 Mingchun Wang1,2*
 Zixiao Xing
 Chuanliang Yan
- 1China University of Petroleum (Beijing), Beijing, China
- 2CNOOC Research Institute Co., Ltd., Beijing, China
- 3China University of Petroleum (East China), Qingdao, China
Introduction: Salt formations are complex and pose significant risks during oil and gas drilling. Creep behavior in salt formations under geostress can jeopardize drilling safety.
Methods: This study analyzes the shrinkage behavior of boreholes drilled through salt formations in West Africa’s Block B, with emphasis on the differential creep rates in two horizontal principal stress directions and the evolution of wellbore shape over time. The impact of drilling fluid density on shrinkage rates is also investigated.
Results: After drilling through salt formations, the creep rates differ between the two horizontal principal stress directions. Shrinkage is faster in the direction of minimum horizontal principal stress and slower in the direction of maximum horizontal principal stress. Over time, shrinkage rates converge, resulting in a transition from elliptical to circular wellbore shape. Higher drilling fluid density leads to reduced shrinkage rates.
Discussion: These findings contribute to the theoretical guidance for drilling fluid density selection in salt formations.
1 Introduction
Salt formations are commonly seen during oil and gas drilling. Due to the extremely low permeability, salt formations are a good cap rock, under which oil and gas reservoirs are easily formed. Whereas, salt rock shows strong creep behaviors, which are highly unconducive to well drilling and completion. In construction links of selecting the drilling fluid density and designing the casing strength, the creep behaviors of salt rock may cause complex accidents such as wellbore instability, blockage during tripping, jamming of drilling tools, and casing extrusion. Therefore, drilling wells in salt formations, especially deep salt formations, is a serious challenge.
Due to disturbances of drilling engineering, stress is concentrated around wellbores. The increase in stress in creep formations causes creep deformation. The most serious influence of creep on drilling lies in that it causes wellbore shrinkage and affects tripping operation. Existing research on wellbore stability in creep formations is mainly conducted in salt and soft mudstone formations (Thiemeyer, 2015), and also begins to pay attention to creep of brittle rocks in recent years. Through theoretical calculation and numerical simulation, Yin et al. analyzed the casing load in creep formations and considered that the viscoelastic solution of casing load finally approaches elastic solution (Liu et al., 2024). Le Comt (Lux and Heusermann, 1985) was the first to study influences of the temperature effect (room temperature to 193°C) on the creep rate of salt rock and also carried out triaxial creep tests on salt rock under low confining pressure. The first triaxial creep test on salt rock under high pressure was conducted by Heard (Munson et al., 1993) in 1972, in which the maximum confining pressure reached 200 MPa. To meet the demand of engineering research, numerous creep tests on salt rock, including field and laboratory tests were not conducted until the recent 20 years. Lux (1983) conducted lots of uniaxial and triaxial tests in Asse salt mine (Germany) (Munson et al., 1993). Cristeseu carried out lots of laboratory and field tests on properties of salt rock in two creep stages (initial creep and steady creep) by using loading modes including single loading, multi-stage loading, and constant-rate loading (Munson et al., 1993). Tang et al. explored creep behaviors of intercalated salt rock and carried out triaxial compression and creep testes on three types of core samples (mudstone-intercalated salt rock, pure mudstone, and pure salt rock) collected from a site under different confining pressures and analyzed the creep deformation law of the rocks (Lux and Heusermann, 1985). Willson et al. and Poiate et al. established a two-dimensional (2D) finite element model or finite difference model to analyze the casing load in the evaporite bed under horizontal geostress (Munson et al., 1993). Li and Deng analyzed influences of the intrinsic mineral components, deviatoric stress, temperature, and confining pressure on creep and proposed a constitutive model of the steady creep rate combining creep curves and rock parameters (Munson et al., 1996). Machay and Wang built a three-dimensional (3D) finite element model and finite difference model to analyze the mechanical state of casing pipes in salt formations under 3D geostress (Muther and Dahaghi, 2024). Machay et al. came up with the step-by-step simulation method to simulate and analyze the mechanical states of wells during well drilling and cementation (Aubertin et al., 1994). Lao et al. built a finite element model for the inclined shaft in salt formations and analyzed influences of the inclination and azimuth of the shaft on the wellbore shrinkage and the mechanical state of casing pipes (Hunsehe et al., 1981). Li et al. built a heat-fluid-solid coupled mechanical model for wellbore shrinkage in frozen formations and analyzed influences of the temperature of drilling fluids, formation temperature, and wellbore opening time on the state of wellbores (Hunsehe et al., 1994). Combining with geostress conditions of formations in West Africa, the straight wellbore shrinkage under non-uniform geostress was studied.
2 Mathematical model
2.1 Geostress calculation model
Before drilling, strata have begun to bear stress, which is called in-situ geostress. Due to differences in the physical properties, mechanical properties, and pore pressure anomalies of different rocks between or within formations, the geostress is distributed non-uniformly between and within formations. Because geostress is mainly contributed by the overburden pressure and the tectonic force generated by geological conformation movement, formations with different properties differ in their capacity in bearing the tectonic force due to their different deformation resistances under external forces. It is impractical to reveal the distribution law of stress within or between formations based on measured values. Combining with logging data and stratified geostress interpretation model, values of geostress within or between formations can be analyzed. Underground rocks have borne stress before engineering disturbances, and such stress is generally called in-situ geostress and shorted as geostress. Because rocks have undergone a long geological time and experienced multiple complex tectonic movements, the in-situ geostress state of rocks becomes extremely complex. To meet the engineering demand, it is generally considered that the in-situ geostress state is composed of overburden pressure and two horizontal principal geostresses. The geostress is generally considered to occur for two causes: one is gravity and the other is tectonic movements.
People have gradually deepened their understanding of geostress. Heim took the lead to assume that rocks at a certain depth in the crust are under compressive stress in the vertical direction under the gravity of overlying strata, and the value of the compressive stress is
where ρ(z) is the density at the burial depth of z; g is the acceleration of gravity.
If not considering the tectonic stress, the confinement of surrounding rocks is bound to give rise to the horizontal extrusion force. The horizontal geostress is uniform, that is,
In Eq. 2 (Passaris, 1979), μ is the Poisson’s ratio of rocks; σH and σh separately represent the maximum and minimum horizontal geostresses.
Owing to the different physical properties, mechanical properties, and pore pressure anomalies of different rocks between or within formations, geostress is distributed non-uniformly between or within formations. Because the geostress is mainly contributed by the overburden pressure and the tectonic force generated by geological conformation movements, formations with different properties differ in their capacity in bearing the tectonic force due to their different deformation resistances under external forces. Professor Huang in the Rock Mechanics Laboratory, China University of Petroleum proposed a geostress model that considers the action of tectonic stress. That is, in the three components of geostress, the overburden pressure is mainly generated by gravity, while horizontal geostress is generated jointly by the Poisson’s effect under gravity and the tectonic stress. Additionally, the tectonic stress is in direct proportion to the effective overburden pressure.
In Eq. 3, ζ1 and ζ2 separately represent the tectonic stress factors in the directions of maximum and minimum horizontal geostresses; α is the effective stress factor; Pp is the pore pressure. The above equations have been included in the drilling manual of Party A since the early 1990s, acknowledged by the petroleum engineering circle in China, and called Huang’s model. Whereas the model still has a shortcoming, that is, it does not take into account the influence of mechanical properties of each formation on the tectonic stress. In view of this, the laboratory has further developed a horizontal geostress model, namely, the so called combined spring model. The model follows the basic idea that in the tectonic movement process, the deformation of formations under each tectonic movement is coordinated, that is, the deformation of each formation is equal. However, because various formations differ in the stiffness (elastic modulus and Poisson’s ratio), the tectonic stress in each formation is also different. The schematic diagram of the combined spring model is shown in Figure 1.
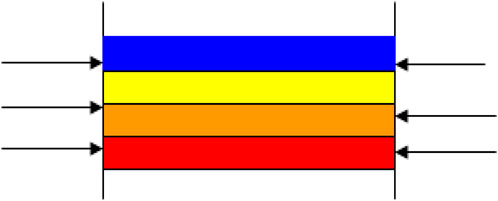
Figure 1. Combined spring model of tectonic stress.
The tectonic stress in the combined spring model is expressed as follows:
The overall horizontal geostress model of the combined spring model is
where E, μ, α, Pp, and σv are the elastic modulus, Poisson’s ratio, Biot’s coefficient, pore pressure, and vertical geostress, respectively; σH and σh are separately the maximum and minimum horizontal geostresses; β1 and β2 are average tectonic stress factors.
Well T-1 is located in Block B in West Africa, where the water depth is 1,970 m and the design well depth is 4,000 m. It is anticipated that a salt formation will be encountered in the Ezanga formation. The tectonic stress factors need to be determined based on results of Kaiser effect tests and data obtained in field LOT experimental, as shown in Table 1. According to values of the three geostresses obtained in acoustic emission experiments and the measured Poisson’s ratio of the formation, the two horizontal tectonic stress factors in the region of well T-1 were inverted.

Table 1. LOT experimental results.
The geostress profile was computed using the horizontal tectonic stress factors obtained based on seismic interval velocity data and inversion. The equivalent density of well T-1 under geostress increases with growing formation depth and the pressure of the overlying salt formation is the maximum principal geostress.
2.2 Creep model
Creep refers to a process in which deformation of materials constantly develops with time under the constant stress. When carrying out creep tests on a material in the elastic stage, the total strain of the material can be decomposed into the sum of elastic strain and creep strain (Musso and Vouille, 1974), that is,
In Eq. 6, ε(t) is the total strain; εe is the elastic strain; εc is the creep strain, which is a function of temperature T, time t, and stress σ (Fokker et al., 1981),
Scholars have successively built a series of constitutive models to describe the long-term mechanical properties of salt rock. Considering that the well size is so small relative to the entire ultra-thick salt formation, wellbore shrinkage can be regarded as a creep behavior under the constant temperature and load. Dorn (Gairola et al., 2024; Liu et al., 2024; Muther and Dahaghi, 2024; Xiong et al., 2024) pointed out that at a high temperature, the creep activation energy is identical to the activation energy for atomic self-diffusion, which means that vacancy diffusion serves as the controlling mechanism of strain rate (Hunsche et al., 1992; Gairola et al., 2024; Zeng et al., 2024). On this basis, Weertman proposed the constitutive equation of the steady creep rate:
In Eq. 9, A, m, and n separately represent the power law constant, time order, and equivalent stress order, which are obtained by carrying out creep tests on the rock.
By taking the derivative of time of Eq. 9, the Norton power law criterion related to the creep time can be obtained (Reisabadi et al., 2020; Science-Natural Gas Science and Engineering, 2020; Xinxin et al., 2022):
The composition of the cuttings in the target block is determined by X-ray diffraction analysis instrument, and the artificial salt rock core is made according to the composition, density and acoustic wave velocity. Figure 2 shows the core preparation systems. According to the mineral composition of the natural core, we matched the raw materials required for the artificial cores, heated it in the Salt rock core preparation systems for 2 h to evaporate and crystallize, and we got the artificial core with a size of 25 mm × 50 mm. The mechanical properties of artificial cores are similar to natural cores. Creep tests were carried out on the salt rock cores at 25°C, 50°C, and 80°C. According to test curves in Figures 3–5, the creep constitutive model of the salt rock is (Yan et al., 2019):

Figure 2. Salt rock core preparation system.
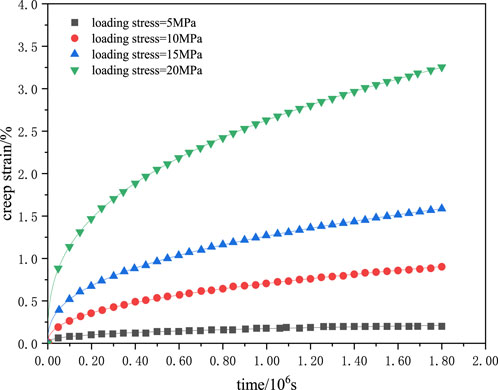
Figure 3. Fitting results of the creep model of salt rock at 25°C.
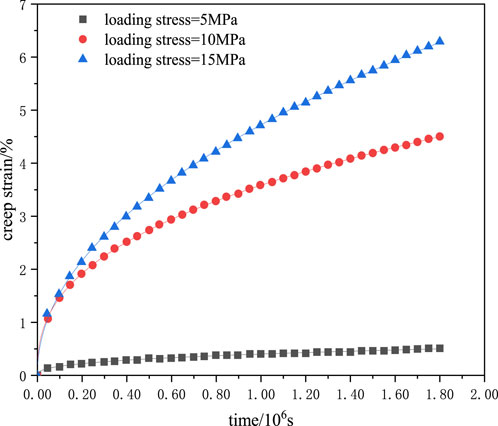
Figure 4. Fitting results of the creep model of salt rock at 50°C.

Figure 5. Fitting results of the creep model of salt rock at 80°C.
2.3 Calculation model for wellbore creep and shrinkage in a salt formation
The depth of well T-1 is 4,000 m, which is drilled in Ezanga salt formation. The geological statistical results are listed in Table 2.
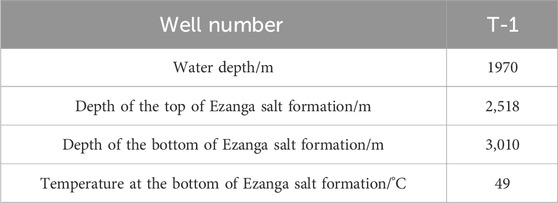
Table 2. Geological information of Ezanga salt formation.
Because deep salt formations are generally thick, it is assumed that there is no strain along the axis of the wellbore, that is, deformation of the wellbore can be regarded as a plane strain problem. To simplify analysis, it is assumed that (Hou and Wu, 2003), as shown in Figure 6.
(1) The hydrostatic pressure does not influence creep of salt rock;
(2) The generalized creep rate and stress deviator are in the same principal direction;
(3) The liquid-column pressure in the wellbore and the wellbore radius are separately denoted by Pm and a, and the wellbore is vertical.
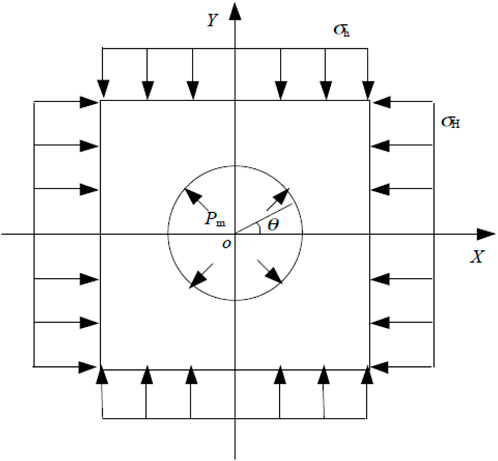
Figure 6. Mechanical model of the wellbore drilled in the salt formation under non-uniform geostress.
The equilibrium equation is
In Eq. 12 (Xiong et al., 2024), σr is circumferential stress; σθ is radial stress; r is wellbore radius.
The geometric equation is
The physical equation is (Li et al., 2024):
The boundary condition is (Gairola et al., 2024):
The creep rate of salt rock rises significantly with increasing temperature and depth, so the creep rate reaches the maximum at the bottom of the salt formation. Considering the extremely low permeability of the salt formation, changes in permeability are not considered in the analysis of geostress and creep rate. The horizontal geostress grows with increasing depth. To improve the calculation efficiency, the circular computational domain is divided into quarter sectors according to the symmetry. The finite element model for wellbore creep and shrinkage in the salt formation is shown in Figure 7, in which the computation radius is 2,000 mm. OX and OY separately denote the directions of maximum and minimum horizontal principal stresses. Boundaries ad and bc are set to be axially symmetric, displacement constraint is applied to boundary ab, and liquid-column pressure is applied to boundary bc.
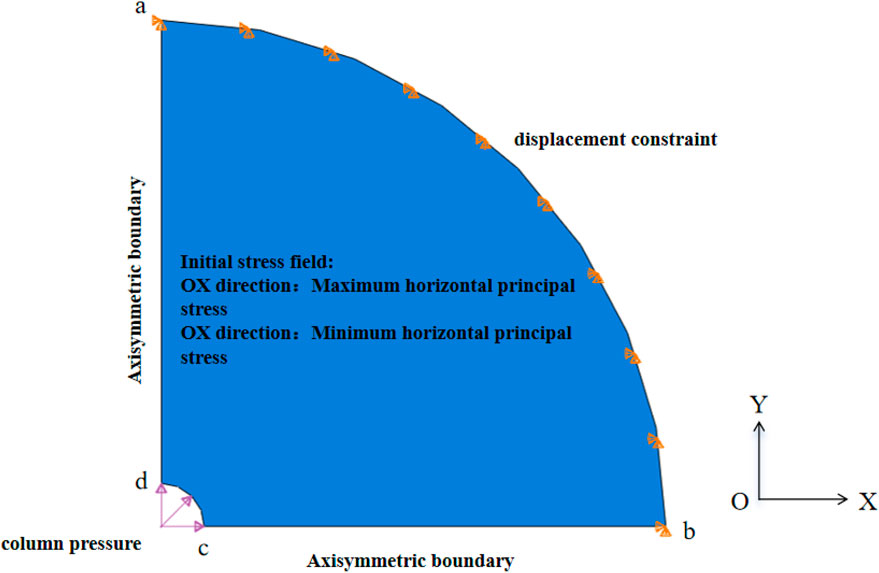
Figure 7. Calculation model of wellbore creep and shrinkage in the salt formation.
According to the actual geological parameters, various parameters in the finite element model are set in Table 3.
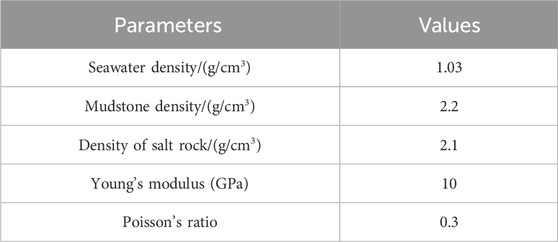
Table 3. Basic parameters of the formation.
3 Wellbore creep and shrinkage in the salt formation
Geostress equilibrium is a key premise to accurately simulate the drilling process. To ensure that the loading of initial stress conforms to the geostress equilibrium principle, the foundation should be only under the initial stress while does not have large deformation. The effect of the initial strain is eliminated in this step. In Abaqus software, geostress equilibrium is generally realized in the first step of simulation by setting the analysis step of geostress equilibrium as Geostatic. In the step, displacement constraints are applied to the far-field region and wellbore region. A quarter of boundaries (boundaries ad and bc) are set to be an axially symmetric constraint. The whole model is under action of the overburden pressure, minimum horizontal principal stress, and maximum horizontal principal stress. The Figure 8 shows the results after geostress equilibrium and the maximum displacement in the model is only 1.97 × 10⁻¹⁹ m, which means that the initial boundary condition is effective and feasible in subsequent analysis.
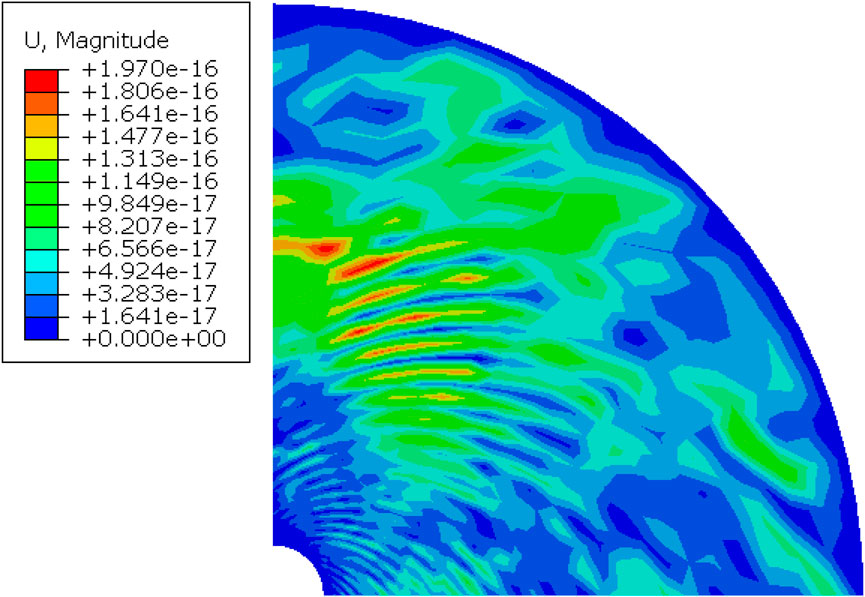
Figure 8. Geostress equilibrium.
3.1 Geostress distribution and deformation at the moment of drilling the wellbore
The drilling process involves drilling the wellbore using a drill bit to release geostress on wellbore wall. In the second step, namely, VSICO analysis, the displacement constraint on the wellbore wall needs to be removed and at the same time the liquid-column pressure of drilling fluids should be applied. Since the permeability of salt rock is extremely low, the flow of fluid is not considered. Under the joint action of non-uniform geostress and liquid-column pressure of drilling fluids, the formation will undergo an initial elastic deformation stage. The displacement distribution during initial deformation is shown in Figure 9, while the initial stress distribution is displayed in Figure 10. Cloud pictures of initial stress and displacement of the formation show that obvious stress concentration occurs at the mouth of the well at the moment that the drill bit penetrates the formation. The stress reaches the maximum in the direction of minimum horizontal geostress. The displacement is maximum in the direction of maximum horizontal geostress, while the wellbore shows the minimum displacement in the direction of minimum horizontal geostress, thus forming an approximately elliptic deformation zone.

Figure 9. Cloud picture of initial deformation after drilling the wellbore.
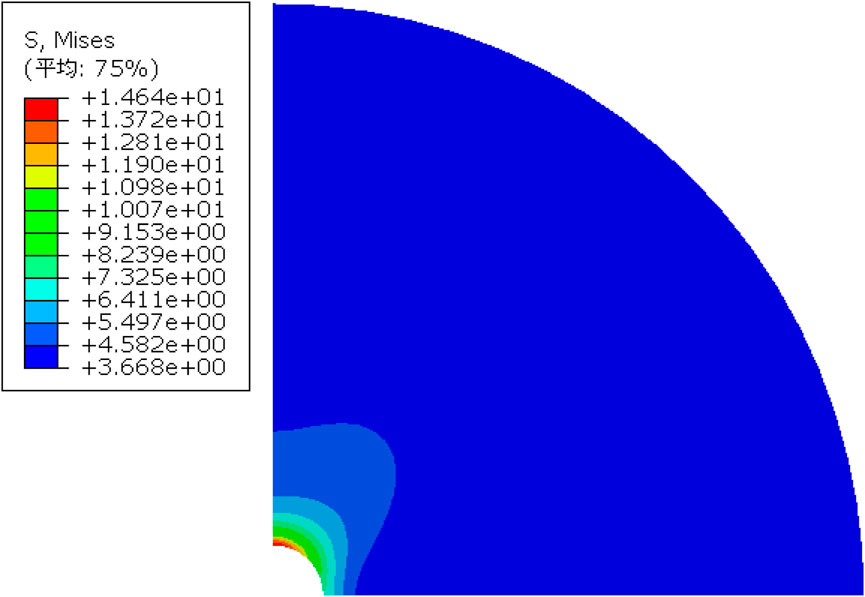
Figure 10. Cloud picture of initial Mises stress after drilling the wellbore.
The salt formation shows typical rheological properties. After the wellbore is drilled using the drill bit, stress around the well is released instantaneously. In the non-creep formation, the wellbore deformation is an instantaneous or short process; at the bottom of the salt formation, the deformation is a long-lasting process. The instantaneous changes in stress around the wellbore induce the driving force for creep of the salt formation and cause wellbore shrinkage with creep. Changes in the wellbore shape, in turn, influence the stress field and then cause changes in the creep rate. When using drilling fluids with the density of 1.1 g/cm³, VSICO analysis step in ABAQUS is used to analyze stress distribution and displacement distribution after drilling in the salt formation using the drill bit, as shown in Figures 11–14.

Figure 11. Cloud picture of radial stress distribution around the wellbore at different moments.
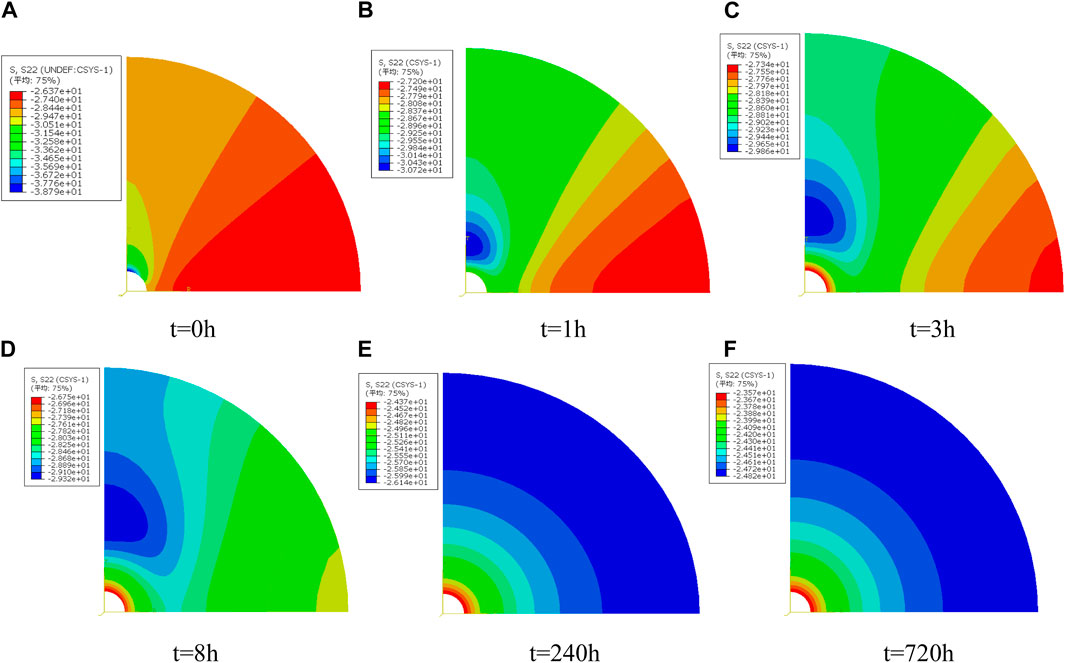
Figure 12. Cloud picture of circumferential stress distribution around the wellbore at different moments.
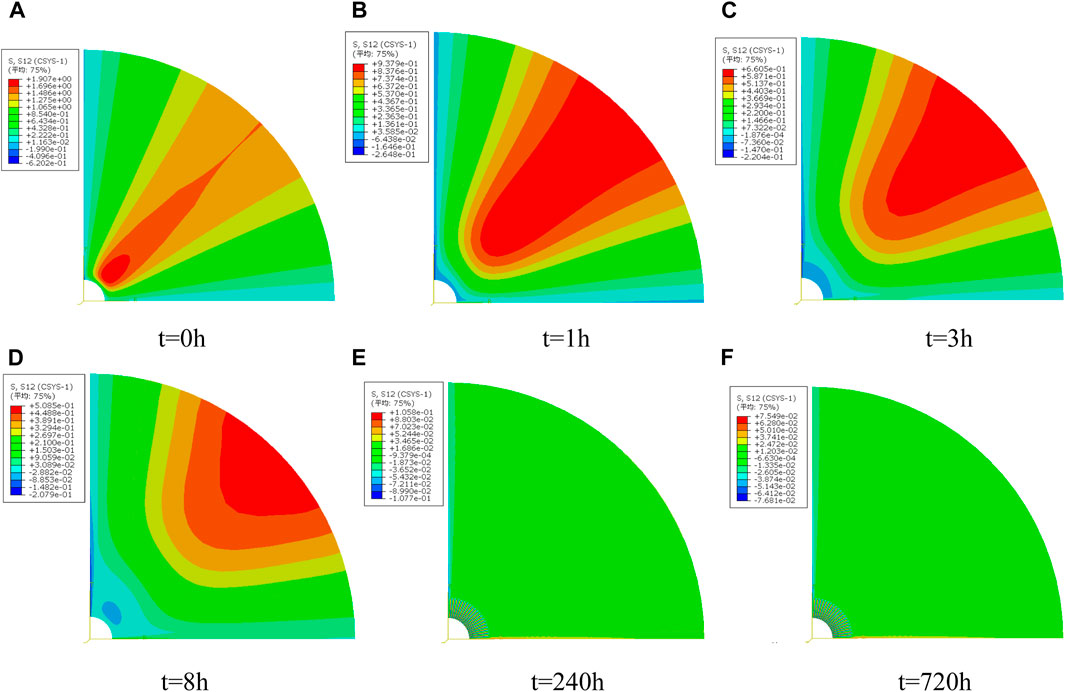
Figure 13. Shear stress on a cross section of the wellbore.
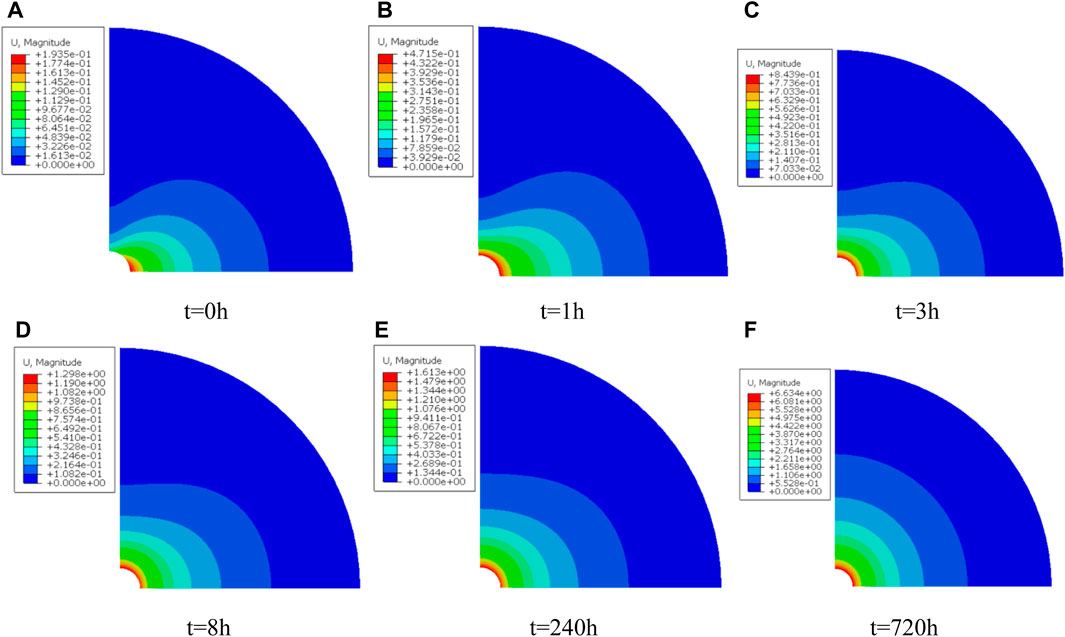
Figure 14. Cloud picture of wellbore displacement.
The wellbore shape and stress state after drilling the wellbore differ greatly from the wellbore shape and stress field at the initial moment, with creep of the wellbore. Variables of stress fields at nodes on the wellbore wall are output in Figures 15, 16. The abscissa is the angle between the point on the wellbore curve and the direction of maximum horizontal principal stress. That is, 0° and 90° separately correspond to the directions of far-field maximum and minimum horizontal principal stresses.
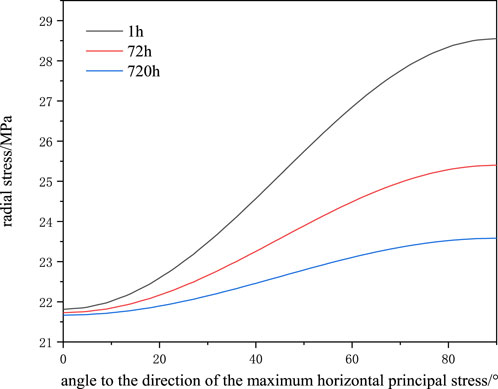
Figure 15. Distribution curves of radial stress on the wellbore wall at different moments.
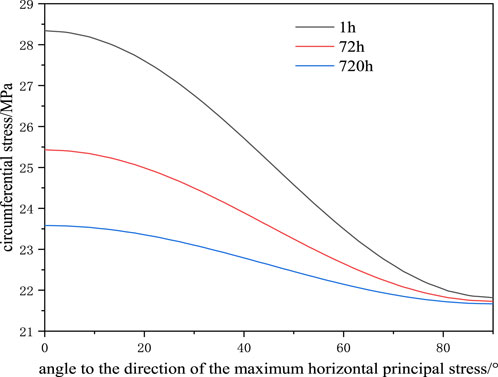
Figure 16. Distribution curves of circumferential stresses on the wellbore wall at different moments.
As shown in Figures 15, 16, stress is concentrated due to the non-uniform geostress distribution at the initial moment. As the drilling time increases, the plastic zone around the wellbore develops uniformly gradually and radial and circumferential stresses both reduce with increasing time due to the non-uniformity of horizontal geostress and creep behaviors of the formation. The difference in plastic strain around the well caused by geostress non-uniformity and creep behaviors of the formation gradually narrows. Mises stress represents the distortional strain energy density of the rock. The Mises stress distribution on the wellbore well at different moments is drawn in Figure 17.
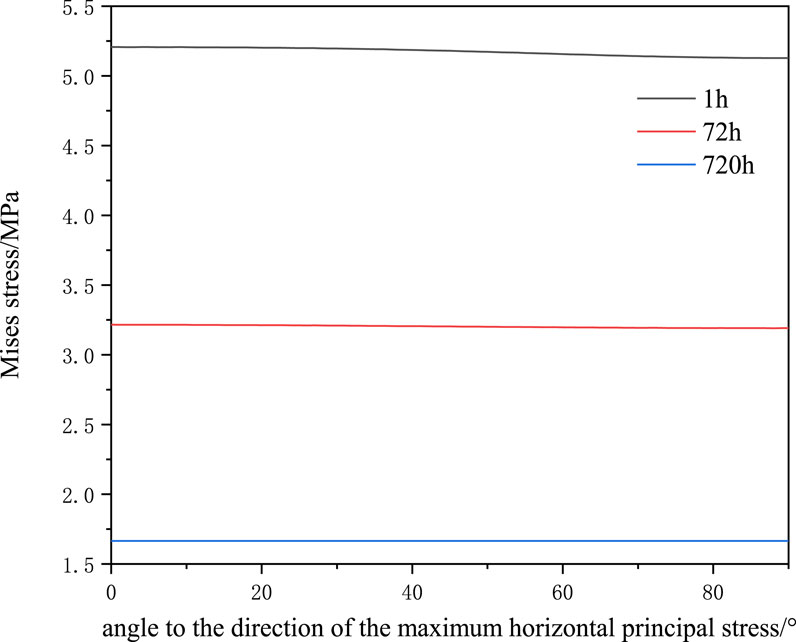
Figure 17. Mises stress distribution curves on the wellbore wall at different moments.
As shown in Figure 18, with the creep of the wellbore, the wellbore shape and stress state 30 days after drilling the wellbore differ greatly relative to the wellbore shape and stress field at the initial moment. With the increasing creep time, Mises stress on the wellbore wall reduces; 1 hour after drilling the wellbore, the Mises stress is distributed non-uniformly on the wellbore wall. The Mises stresses are separately 5.21 and 5.12 MPa when the angles are 0° and 90°. The Mises stress is still non-uniform on the wellbore wall 72 h after drilling the wellbore. Under the condition, the Mises stresses are separately 3.22 and 3.19 MPa when the angles are 0° and 90°. After drilling the wellbore for 720 h, the Mises stresses are basically distributed uniformly on the wellbore wall. In Eq. 1, we can see that the overburden pressure increases with the increase of formation thickness, and the overburden pressure is the driving force of salt rock creep, which will lead to the greater the thickness of salt layer, the greater the ground stress, the faster the creep rate.
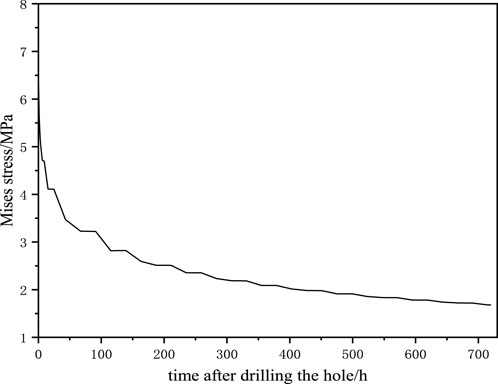
Figure 18. Change curves of Mises stress on the wellbore wall.
3.2 Influence of drilling fluid density on wellbore shrinkage
In formations with creep behaviors, the wellbore shrinkage ratio is a function of time and affected by multiple factors including the geostress, creep behaviors of formations, and density of drilling fluids used. Among these factors, the only factor that is artificially controllable is the drilling fluid density. When the drilling fluid density is too low, the wellbore may undergo creep failure, thus inducing jamming of the drilling tool. By calculating the wellbore shrinkage under different drilling fluid densities, change curves of the maximum wellbore shrinkage ratio with time under different drilling fluid densities were drawn. In the drilling process, the stress equilibrium is broken as the column of drilling fluids replaces the original strata to provide support, so that stress in rocks around the wellbore is redistributed, thus inducing instantaneous deformation of the wellbore. The maximum wellbore shrinkage ratio gradually rises with time and reduces as the drilling fluid density decreases. This indicates that increasing the drilling fluid density is conducive to long-term stability of wellbores in the loose salt rock formation, while a too high density is likely to cause leakage of the formation. According to practical experience, when the wellbore shrinkage ratio exceeds 5.8%, it influences drilling safety. Based on the standard, the creep and shrinkage ratio in the direction of minimum horizonal geostress is calculated. It can also be seen from Figures 19, 20 that the wellbore shrinkage rate gradually declines with increasing drilling fluid density. As shown in Figure 21, the safe drilling period is 6 days when using drilling fluids with the density of 1.1 g/cm³; while it prolongs to 20 days when using drilling fluids with the density of 1.25 g/cm³. This is because the bottom of the salt formation is buried deeply, where even a tiny change in the liquid-column pressure of drilling fluids can induce large differential stress at the well bottom, thus influencing the wellbore shrinkage rate. The actual density of drilling fluid used in this drilling project is 1.26 g/cm3, and no drilling safety accidents have occurred in salt rock formation.
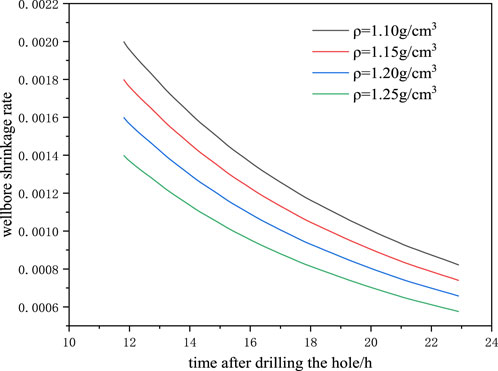
Figure 19. Change curves of the wellbore shrinkage rate with drilling time under different drilling fluid densities.
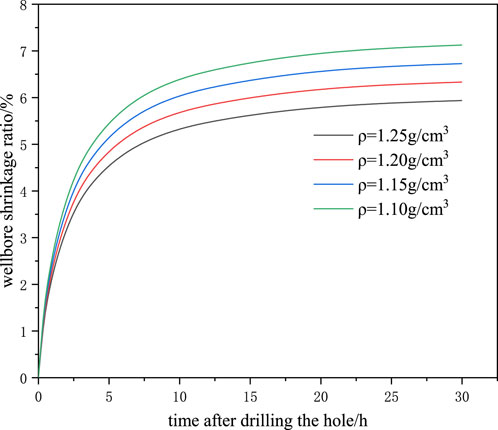
Figure 20. Change curves of the wellbore shrinkage ratio with drilling time under different drilling fluid densities.
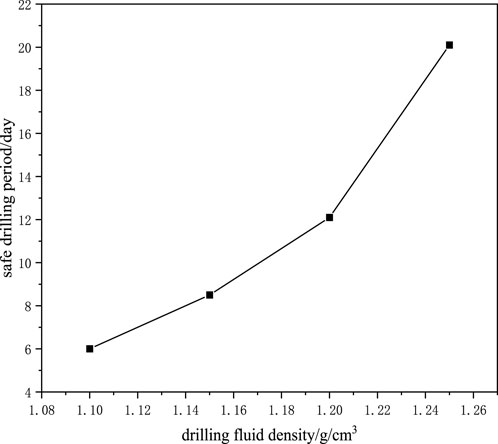
Figure 21. Safe drilling period.
4 Conclusion
1) The salt formation firstly has elastic deformation under the non-uniform geostress at the initial moment when drilling the wellbore using the drill bit. The displacement is maximum in the direction of maximum horizontal geostress while minimum in the direction of minimum horizontal geostress. Due to stress concentration, stress is non-uniformly distributed around the wellbore. The stress is maximum (minimum) in the directions of minimum (maximum) horizontal geostress. Under the condition, the wellbore is approximately elliptic.
2) During wellbore creep and shrinkage, the shrinkage rate differs in different directions: the shrinkage rate is maximum in the direction of minimum horizontal geostress while minimum in the direction of maximum horizontal geostress. The differential stress is released with creep. The maximum and minimum shrinkage rates tend to be identical, and therefore the wellbore gradually changes from an ellipse to a circle.
3) After a certain time of creep, the stress in the wellbore develops from non-uniform distribution to uniform distribution, finally eliminating the influence of non-uniform geostress on stress distribution around the wellbore. Finally, the wellbore wall tends to be stable from the stress perspective of the rock.
4) The higher the drilling fluid density is, the lower the wellbore shrinkage rate. In deep salt formations, even a small change in the liquid-column pressure of drilling fluids can induce high differential stress at the well bottom, thus remarkably influencing the wellbore shrinkage rate.
Data availability statement
The raw data supporting the conclusion of this article will be made available by the authors, without undue reservation.
Author contributions
MW: Writing–original draft, Writing–review and editing, Conceptualization, Data curation, Formal Analysis, Funding acquisition, Investigation, Methodology, Project administration, Resources, Software, Validation, Visualization. JD: Writing–review and editing, Supervision, Conceptualization, Methodology, Validation, Data curation, Formal Analysis, Funding acquisition, Investigation, Project administration, Resources, Software, Visualization. ZL: Supervision, Writing–review and editing, Conceptualization, Methodology, Validation, Data curation, Formal Analysis, Funding acquisition, Investigation, Project administration, Resources, Software, Visualization. ML: Writing–review and editing, Formal Analysis, Investigation, Project administration, Resources. ZX: Writing–review and editing, Formal Analysis, Data curation, Investigation, Visualization. ZZ: Validation, Writing–review and editing, Formal Analysis, Data curation, Investigation, Software, Visualization. CY: Writing–review and editing, Investigation, Project administration, Validation.
Funding
The author(s) declare financial support was received for the research, authorship, and/or publication of this article. This work was supported by CNOOC Limited research project “Key technology of deepwater subsalt drilling” (KJGG 2022-0906) and the Youth Innovation Team Project in Universities in Shandong Province (2022KJ072). The funder was not involved in the study design, collection, analysis, interpretation of data, the writing of this article, or the decision to submit it for publication.
Conflict of interest
Authors MW, ZL, ML, and ZX were employed by CNOOC Research Institute Co., Ltd.
The remaining authors declare that the research was conducted in the absence of any commercial or financial relationships that could be construed as a potential conflict of interest.
Publisher’s note
All claims expressed in this article are solely those of the authors and do not necessarily represent those of their affiliated organizations, or those of the publisher, the editors and the reviewers. Any product that may be evaluated in this article, or claim that may be made by its manufacturer, is not guaranteed or endorsed by the publisher.
References
Aubertin, M., Gill, D. E., and Ladanyi, B. (1994). Constitutive equations with internal state variables for the inelastic behavior of soft rocks. Appl. Meeh. Rev. ASME. 47 (6-2), 97–101. doi:10.1115/1.3124449
Fokker, A. F. (1981). “Elasticity and strength of natural rock salts,” in Proc.1st conf Editors H. Hardy, and M. Lnager (Clausthal-Zellerfeld: TransTeeh Publ).271283
Gairola, S. G., Thiele, T. S., Khanna, P., Ramdani, A., Gloaguen, R., and Vahrenkamp, V. (2024). A data-driven hyperspectral method for sampling of diagenetic carbonate fabrics-A case study using an outcrop analogue of Jurassic Arab-D reservoirs, Saudi Arabia. Mar. Petroleum Geol. 161, 161106691. doi:10.1016/j.marpetgeo.2024.106691
Hou, M., and Wu, W. (2003). Improvement of design of storage cavity in rock salt by using the Hou/Lux constitutive model with consideration of creep rupture criterion and damage. Chin. J. Geotechnical Engineeing 25 (l), 105–108.
Hunsche, U. (1992). “True triaxial tests on cubic rock salt samples-experimental methods and results, finite in elastic deformations-theory and applications,” in IUTAM symp Editors D. Besdo, and E. Stein (Berlin-Heidelberg: Springer-Verlag), 525–536.
Hunsehe, U. (1981). “Result and interpretation of creep experiments on rock salt,” in The meehanical behavior of salt. Proc. 1st conf Editors H. R. Hardy, and M. Langer (Clausthal-Zellerfeld: Tans Tech Publ.), 159–167.
Hunsehe, U. (1994). “Uniaxial and triaxial creep and failure tests on rock: experimenta ltechnique and interpretation,” in Visvo-plastic behavior of geomaterials Editors N. D. Cristeseu, and G. Giod (Wien-NewYork: Springer-Verlag), l–53.
Li, H., Ma, H., Zhao, K., Liang, X., Yu, H., Zheng, Z., et al. (2024). The effect of varying stress intervals on fatigue of rock salt. Geoenergy Sci. Eng., 234212597. doi:10.1016/j.geoen.2023.212597
Liu, W., Dong, Y., Zhang, Z., Li, L., Jiang, D., Fan, J., et al. (2024). Optimization of operating pressure of hydrogen storage salt cavern in bedded salt rock with multi-interlayers. Int. J. Hydrogen Energy 58, 58974–58986. doi:10.1016/j.ijhydene.2024.01.318
Lux, K. H., and Heusermann, S. (1985). “Creep tests on rock salt with changing load as a basis for the verifieation of theoretical material laws,” in Proc.6th Int. Symp on salt, Faisalabad, Pakistan, December 6-7, 2006.
Mingjian, T., Yanlong, L., Minhui, Q., Wang, H., Wang, Y., Lu, J., et al. (2022). A novel multi-path sand-control screen and its application in gravel packing of deepwater horizontal gas wells. Nat. Gas. Ind. B 9 (4), 376–382. doi:10.1016/j.ngib.2022.07.005
Munson, D. E., Devries, K. L., Fossum, A. F., and Callahan, G. D. (1996). “Extension of the M-D model for treating stress drops in salt.The mechanical Behavior of salt,” in Proc.3rd conf Editors H. Hardy, and M. Langer (Clausthal-Zellerfeld: Trans Tech Publ), 31–44.
Munson, D., and Mawersik, W. (1993). “Constitutive modeling of salt behavior-state of the technology,” in Proc 7th int.Conger. On rock mechanics Editor W. Witke (Rotterdam: Balkema), 1797–1810.
Musso, J., and Vouille, G. (1974). “A comparative study of creep, relaxation, cyele loading tests to determine the rheological model of marl and salt,” in International society for rock mechanics,3rd congress, Denver, Colorado, September 1--7, 1974, 345–353.
Muther, T., and Dahaghi, K. A. (2024). Hydrogen adsorption on calcite mineral surface in the presence of CO2 and CH4: a key factor in hydrogen storage in carbonate rocks. Int. J. Hydrogen Energy 58, 58583–58595. doi:10.1016/j.ijhydene.2024.01.185
Passaris, E. K. S. (1979). “The rheological behavior of rock salt as determined in an in situ pressured test cavity,” in International society for rock mechanics.5th congress, Montreux, Switzerland, September 1979, 257–264.
Reisabadi, Z. M., Haghighi, M., Sayyafzadeh, M., and Khaksar, A. (2020). Effect of matrix shrinkage on wellbore stresses in coal seam gas: an example from Bowen Basin, east Australia. J. Nat. Gas Sci. Eng. 77, 77103280–103280. doi:10.1016/j.jngse.2020.103280
Science-Natural Gas Science and Engineering (2020). Science - natural gas science and engineering; university of adelaide details findings in natural gas science and engineering (effect of matrix shrinkage on wellbore stresses in coal seam gas: an example from bowen basin, east Australia). J. Eng.
Xinxin, F., Hong, F., Fengling, L., and Wang, H. (2022). Experimental investigation of the mechanical properties of mud shale under water-bearing conditions and its applications. Sci. Rep. 12 (1), 9486. doi:10.1038/s41598-022-13476-8
Xiong, C., Cai, Z., Ma, B., Tian, W., Shen, C., Zhao, Y., et al. (2024). Controls of strike-slip faults on condensate gas accumulation and enrichment in the Ordovician carbonate reservoirs of the central Tarim Basin, NW China. J. Asian Earth Sci. 263, 263106019. doi:10.1016/j.jseaes.2024.106019
Yan, C., Li, Y., Yan, X., Cheng, Y., Han, Z., Tian, W., et al. (2019). Wellbore shrinkage during drilling in methane hydrate reservoirs. Energy Sci. Eng. 7 (3), 930–942. doi:10.1002/ese3.323
Keywords: salt formation, creep, hole shrinkage, drilling fliud density, rock mechanics, deepwater drilling
Citation: Wang M, Deng J, Li Z, Li M, Xing Z, Zhang Z and Yan C (2024) The shrinkage behavior of boreholes drilled through deepwater creeping salt formations in West Africa. Front. Energy Res. 12:1392272. doi: 10.3389/fenrg.2024.1392272
Received: 27 February 2024; Accepted: 25 March 2024;
Published: 23 April 2024.
Edited by:
Yishan Liu, Research Institute of Petroleum Exploration and Development (RIPED), ChinaReviewed by:
Xin Chang, Chinese Academy of Sciences (CAS), ChinaMiao He, Yangtze University, China
Hailong Jiang, Xi’an Shiyou University, China
Copyright © 2024 Wang, Deng, Li, Li, Xing, Zhang and Yan. This is an open-access article distributed under the terms of the Creative Commons Attribution License (CC BY). The use, distribution or reproduction in other forums is permitted, provided the original author(s) and the copyright owner(s) are credited and that the original publication in this journal is cited, in accordance with accepted academic practice. No use, distribution or reproduction is permitted which does not comply with these terms.
*Correspondence: Mingchun Wang, d2FuZ21jaDVAY25vb2MuY29tLmNu