 Aneesh Jose
 Sudesh Bekal
 Shripad T. Revankar
- 1Mechanical Engineering Department, Visvesvaraya Technological University, Belagavi, Karnataka, India
- 2Mechanical Engineering Department, NMAM Institute of Technology (NITTE Deemed to be University), Nitte, Karnataka, India
- 3School of Nuclear Engineering, Purdue University, West Lafayette, IN, United States
The paper presents an analysis of the performance of a Proton Exchange Membrane (PEM) fuel cell, which is equipped with a flow field design featuring dual inlets and outlets, while operating under conditions of excess stoichiometry. These experiments were conducted using a fuel cell system connected to a station that allowed for the precise adjustment of gas flow rates. During the initial phase of experimentation, various proportions of excess oxygen were systematically applied, while maintaining constant hydrogen flow rates of 80 mL/min and 100 mL/min. Particularly noteworthy, for the case of a 100 mL/min hydrogen gas flow rate and the optimized excess oxygen proportion of 150%, further experiments were undertaken to ascertain the ideal humidification conditions. The outcomes of these experiments revealed that a hydrogen gas flow rate of 100 mL/min consistently outperformed the 80 mL/min flow rate in terms of fuel cell performance. Moreover, it was observed that the introduction of excess oxygen significantly improved performance, up to a 50% oxygen proportion for the 80 mL/min hydrogen flow rate and up to a 150% proportion for the 100 mL/min hydrogen flow rate. One intriguing observation pertained to the influence of humidification. Specifically, it was found that the utilization of a humidification temperature of 100°C, or the absence of humidification altogether, resulted in notably diminished power output. In contrast, intermediate humidification temperatures of 60°C, 70°C, 80°C, and 90°C consistently yielded identical maximum power points (MPP) when combined with a 150% excess oxygen supply and a hydrogen flow rate of 100 mL/min. The twin inlet-twin outlet flow field provides a slight advantage over the conventional serpentine flow field in the overall analysis.
1 Introduction
The electric vehicle is emerging as a viable alternative to traditional petroleum-based vehicles, primarily due to its intrinsic advantages, with pollution mitigation being a primary driver (Jiao et al., 2021; Yingdong et al., 2021). While batteries are currently employed to power electric vehicle motors, the need for a continuous and uninterrupted power supply is becoming increasingly crucial.
Fuel cells offer a compelling solution, as they provide a continuous and reliable source of electric power with superior conversion efficiency. Unlike batteries, fuel cells facilitate a one-step conversion from the chemical energy stored in the fuel into electrical energy. Among the various types of fuel cells, the Proton Exchange Membrane Fuel Cell (PEMFC) has garnered significant attention in the realm of research due to its operation at relatively low temperatures (Guangjin et al., 2018; Yun et al., 2020; Parekh, 2022). The focus of this paper centers on the study of a hydrogen-based PEM fuel cell.
The Proton Exchange Membrane (PEM) fuel cell comprises two pivotal components that have been the focal points of extensive research: the Membrane Electrode Assembly (MEA) and the flow field. This paper, in particular, centers its focus on investigating the design of the bipolar plates, which form an integral part of the flow field.
The fundamental role of the flow field, encapsulated within the bipolar plate, is to serve as a conduit for gases, allowing them to traverse the MEA and distribute evenly across the electrolyte membrane. An inadequate channel configuration can adversely affect the chemical reaction, consequently leading to non-uniform current density. This variation in current density may exacerbate membrane degradation, resulting in the formation of hot spots and ultimately contributing to material degradation (Zhang and Tu, 2024).
The bipolar plates play a crucial role in harnessing the electrical current generated by the fuel cell. Their design and material selection are governed by specific criteria, including but not limited to: i) high electrical conductivity, ii) robust corrosion resistance, iii) superior thermal conductivity, iv) exceptional mechanical strength, v) minimized weight and volume, vi) ease of machinability, and vii) cost-effectiveness (Ryan et al., 2009).
This paper, however, focuses on the flow dynamics within the bipolar plate. Two crucial factors related to the flow dynamics in a fuel cell’s bipolar plate include: i) ensuring the even distribution of gases across the Gas Diffusion Layer (GDL) of cell electrodes, and ii) effectively purging gases from the flow channel to guarantee unimpeded gas flow. Traditional serpentine-type flow fields excel in water removal capabilities (Kahraman and Orhan, 2017; Sauermoser et al., 2020), but they exhibit poor gas distribution characteristics (Ozden et al., 2017).
In order to improve the distribution of gases across MEA, various unconventional flow fields have been tried. A multitude of research papers have delved into innovative flow field designs based on nature’s way of working (Uylings, 1977; Kjelstrup et al., 2010; Chen et al., 2012; Faraz and Ramin et al., 2012; Daniel et al., 2013; Guo et al., 2014; Arvay et al., 2015; David et al., 2018; Trogadas et al., 2018; Cho et al., 2019; Haibing et al., 2023). These studies have explored the exchange and distribution of gases within human lungs and the distribution of water within leaves. The findings have consistently demonstrated improved current densities and reduced pressure losses, leading to enhanced overall performance attributed to the even pressure distribution of gases across the membrane. However, these innovative designs have shown susceptibility to flooding due to the absence of a sufficient pressure head within the channel. Additionally, bilateral track flow field was proposed for improving the longitudinal and transverse mass transfer (Zhang et al., 2024) in the cathode side of the fuel cell. The results show that significant improvement in the utilization of the under-rib region by shortening the reactive gas diffusion path length to obtain a more uniform oxygen distribution.
Experiments conducted for various flow field designs (Liu et al., 2014) indicated better performance for conventional single serpentine flow field for smaller cells, while for larger cells; four serpentine channel arrangements provided preferable performance. Experiments with various alternative designs of serpentine channels such as Z, 2Z, 3Z, parallel Z, S, 2S and W flow field (Dhahad et al., 2019) indicated better results for W flow field.
In the present study, the focus is on fabricating a flow field having two inlets and two outlets. Each pair of inlet and outlet is connected by a serpentine channel and is arranged in such a way that i) pressure difference across two channels is minimum resulting in least rim convection and ii) lesser pressure drop in both the channels resulting in more uniform distribution of gases across MEA face but also have sufficient pressure to purge the water. This is another modification of serpentine channel which is not tried earlier. The study that closely aligns with our research entails a configuration featuring multiple openings and exits interconnected by parallel channels (Hamrang et al., 2023). In their investigation, the authors conducted a numerical comparison between a parallel serpentine flow field and a baffled serpentine flow field, identifying potential enhancements. However, distinctions arise between their methodology and ours regarding the positioning of inlets and exits. In their study, all inlets initiate simultaneously, as do the outlets. Conversely, in our approach, the inlets are situated at diverse locations, as are the exits, aiming to achieve a more uniform pressure distribution across the MEA.
A previous study conducted by Cooper et al., 2016, examined the comparative efficacy of parallel and interdigitated flow fields. Their findings underscored the significance of channel and land width as pivotal design parameters for enhancing the performance of parallel flow field PEMFCs. Moreover, they highlighted the critical role of stoichiometry in optimizing performance when employing interdigitated flow fields.
The objective of this work is to study the behavior of this flow field under different gas flow rates, excess stoichiometric condition and different gas humidity conditions to identify the optimum value of hydrogen gas flow rate, excess stoichiometric ratio, and humidity conditions. The study sheds light on effect of excess oxygen supply and humidity conditions while working with new type of flow field.
In this study, it is assumed that the hydrogen side of the system maintains a uniform gas distribution, with no occurrences of leaks or crossover of hydrogen.
2 Experimental methodology
2.1 Experimental setup
Figure 1 depicts the arrangement of various components and apparatus that constitute the experimental system. The explanation on the apparatus is given here item wise.
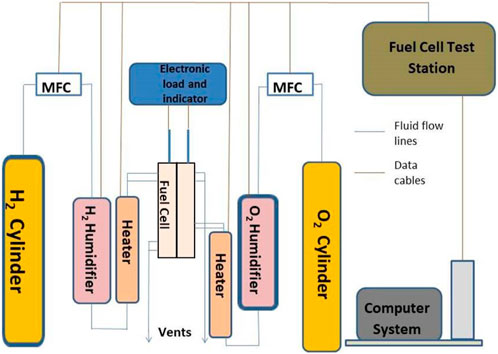
Figure 1. A schematic diagram of the equipment and devices used for the experimentation (MFC: Mass flow controller; Membrane area: 7.5 cm × 7.5 cm; Electrode area: 5 cm × 5 cm; Membrane type: Nafion 212; Gas diffusion layer type: carbon paper; Catalyst type and loading: anode-Pt on carbon with a loading of 0.25 mg/cm2, cathode-Pt on carbon with a loading of 0.5 mg/cm2).
2.1.1 The fuel cell test station
The Fuel Cell Test Station comprises two Alicat mass flow controllers (MFCs) designed to regulate hydrogen and oxygen gas flow rates with a precision of 1 mL/min. Additionally, the station includes separate bubble-type humidifiers for hydrogen and oxygen gas, each equipped with heater coils for water heating. Water levels within the humidifiers are monitored by a water level management apparatus attached to the station and linked to the humidifiers, ensuring adherence to maximum and minimum water level marks. The system is equipped with bypass knobs to enable gas entry into the fuel cell while bypassing the humidifiers. Moreover, provisions are made for adjusting the back pressure at the outlet of the fuel cell’s flow field. The rear section of the unit features drainage arrangements for purging accumulated dirt from the humidifiers periodically. Furthermore, the system integrates transducers to activate the MFCs, humidifier heaters, and line heaters.
2.1.2 Gas supply system
The Gas Supply System sources gas from a cylinder bank, conveyed via copper pipes for oxygen and nitrogen gases, and stainless steel pipes for hydrogen. Gas release into the pipeline is facilitated by cylinder regulators, butterfly valves, and an additional regulator for minor pressure adjustments before entering the MFCs. Hydrogen and oxygen supply to the fuel cell is modulated individually through MFCs, controlled by software installed on a computer interfaced with the test station.
2.1.3 Line heaters
Line heaters are employed to prevent condensation within the outlet pipe from the humidifiers en route to the fuel cell, which is exposed. A heater system heats the gas along its path to the fuel cell.
2.1.4 Computer work station
The Computer Workstation operates the MFCs, humidifier heaters, and line heaters via software installed on a computer interfaced with the fuel cell workstation. The workstation features a dashboard facilitating interaction with various ports, input fields for specifying gas flow rates, humidifier and line heater temperatures. Real-time dynamic data on temperatures, flow rates, and back pressure values are displayed on the dashboard.
2.1.5 Electronic load
The Electronic Load applies a load to the fuel cell, featuring capabilities of displaying 150 V voltages, 40 A current, and 400 W powers. It operates in four distinct modes: constant current, constant voltage, constant power, and constant resistance.
The level of humidification is adjusted by regulating the water temperature within the humidifier, employing its heaters, which are also under computer control. Furthermore, the gas line temperature is controlled by line heaters, also interfaced with the computer. These line heaters serve a dual purpose, preventing moisture condensation in the gas line that connects the humidifier and the cell, while also raising the temperature of the gases. The cell’s load is adjusted by varying the current drawn from the fuel cell current collectors, a process facilitated by the digital loading system.
In Figure 2, a visual depiction of the experimental setup is provided. Additionally, an electronic loader is incorporated for fuel cell loading purposes. With the presence of two inlets, the hydrogen gas is divided into separate streams utilizing a splitter mechanism. Similarly, a comparable process is employed for splitting the oxygen supply directed to the cathode.
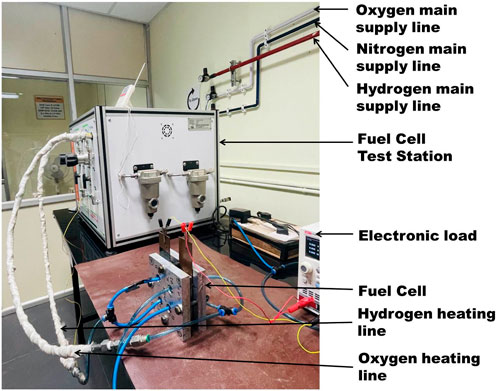
Figure 2. Photograph of Experimental setup (Test station: Provided with separate humidifiers, Alison mass flow meter, and line heating; Electronic load: maximum input current 40 amps; Hydrogen, oxygen and nitrogen gas lines: provided with pressure gage and regulators).
The gases directed to the fuel cell testing station from bank of gas lines traverse through the mass flow controller before entering the humidifier. The temperature of the humidifier is regulated by adjusting the temperature value via the dashboard controls. Subsequently, the humidified gas is conveyed to the fuel cell via an insulated pipeline. Heating of the pipeline is facilitated by a dedicated heater, the temperature of which is also regulated through the software interface. Figure 3 depicts a visual representation of bipolar plates, showcasing both the anode and cathode components. Notably, the image showcases a flow field design characterized by twin inlet and twin outlet configurations. The initial designing was done using Solid works. Thereafter, CNC machine was used to create the channels in the anode bipolar plate. This flow field design entails the partitioning of a continuous serpentine flow field into two distinct channels, each equipped with its own inlet and outlet. This configuration is anticipated to offer several advantages. Firstly, compared to a single continuous channel, the pressure drop within each individual flow field channel is diminished due to shorter path lengths of 567 mm and 467 mm respectively, as opposed to a single continuous path length of 1,250 mm for the same active area (5 cm × 5 cm). Consequently, gas pressure remains more evenly distributed throughout the flow, leading to enhanced gas dispersion across the Membrane Electrode Assembly (MEA). Secondly, the inlet of the second channel is strategically positioned approximately 150 mm away from the inlet of the first channel (as illustrated in the figure below). This spatial arrangement ensures the introduction of fresh gas at high pressure at a distance from the first inlet. Consequently, any pressure drop occurring in the first channel is alleviated at the second inlet, effectively maintaining high pressure across a substantial portion of the active area. This facilitates improved gas utilization overall. For visual reference, please refer to Figure 4, which illustrates the layout of gas flow paths and the placement of gas inlets and outlets. The flow field effectively reduces the gas traverse length by half, resulting in more uniform pressure in the channel, but still maintaining a sufficient pressure drop to push the water out of the channel. The gas sourced from the gas mains undergoes division and is guided towards two distinct inlets, as illustrated in Figure 5. Consequently, the flow rate in each inlet is divided by half in comparison to the initial supply. This reduction in flow rate correlates with a decrease in velocity within each channel, consistent with the principles outlined in the continuity equation. Consequently, the overall pressure drop is further mitigated.
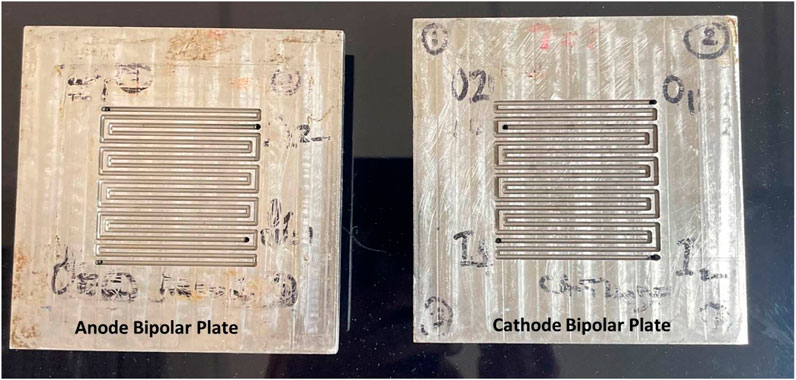
Figure 3. Photograph of bipolar plates (Size of the bipolar plate: 100 mm × 100 mm; Flow field area: 50 mm × 50 mm; Material: Stainless steel; Thickness of the plates: 8 mm).
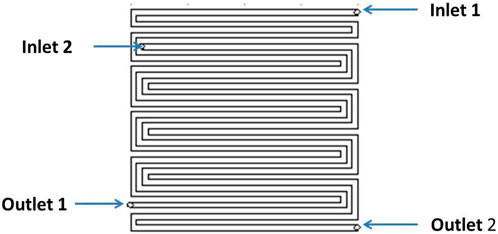
Figure 4. Twin inlet-twin outlet flow field design for anode bipolar plate-not to scale (area covering the rim and channels: 5 cm × 5 cm; width of the flow path: 1.5 mm; depth of the flow path: 1.5 mm; width of the rim: 1 mm; material type: stainless steel).
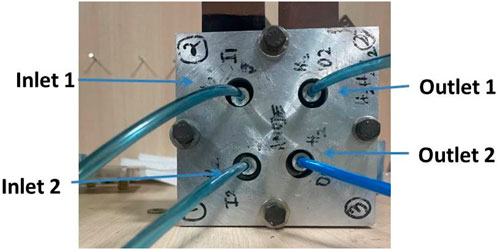
Figure 5. The anode end plate with two gas inlet receiving gas from a splitter (End plate size: 130 mm × 130 mm; end plate thickness; 20 mm).
The gas flow path has a flow cross-section of 1.5 mm × 1.5 mm, while the rim features a 1 mm width. This results in a channel width-to-rim width ratio of 1.5 within the flow field. The membrane utilized in this study is Nafion 212, possessing an electrode area of 25 cm2 and a membrane area measuring 7.5 cm × 7.5 cm. The Gas Diffusion Layer (GDL) is composed of catalyst support which is PTFE (10%) treated carbon paper in this case. A micro porous layer has also been laid over the carbon paper for ensuring better electrical contacts. The thickness of the GDL is 200 microns. Platinum (Pt) catalyst on carbon is employed for both the anode, with a loading of 0.25 mg/cm2, and the cathode, with a loading of 0.5 mg/cm2. To facilitate the measurement of voltage and current density variations, a fuel cell test station (RSI) and an electronic load system (UNIUTL8211) were employed.
Beyond the novelty inherent in the nature of the flow field elucidated previously, this study delves into the potential impact of employing a specialized type of flow field on the performance of the PEMFC under varying flow conditions and levels of humidification, aspects themselves deemed novel. The Maximum Power Point (MPP), indicative of the point where maximum power output occurs, undergoes shifts in terms of current density with alterations in flow rates and levels of humidification, exhibiting uniqueness for each distinct flow field. The characterization of the MPP across different loads holds significance in adapting to changing operational parameters such as flow rate and humidification level to effectively operate the fuel cell at its maximum power point, whether utilized in mobile or stationary applications. The resultant model is deemed valuable for the scaled-up implementation of the fuel cell technology.
2.2 Test conditions
The experiments were executed by maintaining specific values for the humidification temperature and line temperature while varying the stoichiometric proportions. The fuel cell’s load was adjusted using an electronic load, with variations in current density. Notably, the fuel cell remained unheated by external means, and its temperature was observed to fall within the range of 30°C–35°C when measured in proximity to the bipolar plate, close to the membrane’s cross-section. A summary of the test conditions is provided in Table 1.
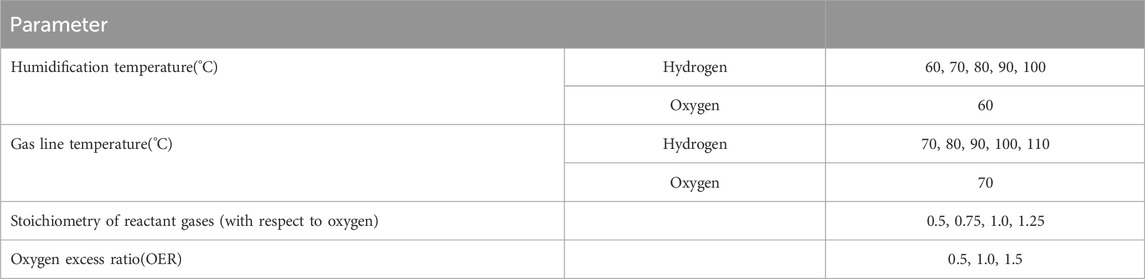
Table 1. Test conditions used in the study.
Voltage readings were recorded for each current density value once the readings had stabilized. The humidification rate was adjusted by modifying the humidification temperature. It’s important to note that the system lacked the capability to directly measure the humidification rate or humidity/relative humidity values.
The variation in humidification temperature encompassed a range from 60°C to 100°C, adjusted in increments of 10°C for the hydrogen supply, while the oxygen supply was consistently maintained at 60°C. This step was taken due to observations that the anode side of the Membrane Electrode Assembly (MEA) was devoid of moisture, while the cathode side exhibited water condensation. To mitigate these effects, the gas line connecting the outlet of the test station and the inlet of the fuel cell was subjected to heating, thus preventing condensation and ensuring that gases entered the fuel cell system at temperatures exceeding the ambient conditions.
The gas line temperature was further controlled, with adjustments ranging from 70°C to 110°C, in 10°C intervals on the hydrogen side, while the oxygen side’s temperature remained fixed at 70°C. Each experiment was initiated after allowing the Proton Exchange Membrane Fuel Cell (PEMFC) to reach a stable state. Upon completing a series of experiments, involving adjustments in the applied current density until the fuel cell reached its load limit, the PEMFC was disassembled. This process aimed to return the Membrane Electrode Assembly (MEA) to a controlled state, preparing it for the subsequent series of experiments involving varying flow rates and gas conditions. The flow pressure for both hydrogen and oxygen was set at 2 bar.
Table 2 shows variations in oxygen flow rate for different hydrogen/oxygen proportion. For a fixed hydrogen flow rate, the oxygen flow rate was varied starting from chemically correct mixture of 50% proportion by volume. The main objective of the paper is to report most suitable hydrogen-oxygen proportion for the best performance when used in a modified conventional serpentine flow field. It is assumed that on the anode side there is no leakage of hydrogen gas and also no hydrogen cross over.
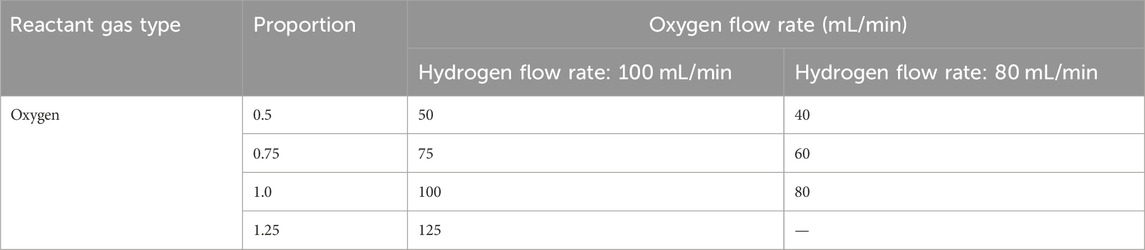
Table 2. Oxygen flow rate.
3 Results and discussion
3.1 Effect of oxygen flow rates on performance of PEMFC for hydrogen flow rate 80 mL/min
The experiments were carried out at a consistent flow rate of 80 mL/cm2, while the flow rates of oxygen were systematically varied, specifically at 40, 60, and 80 mL/min. The polarization curves corresponding to these three different oxygen flow rates are presented in Figure 6.
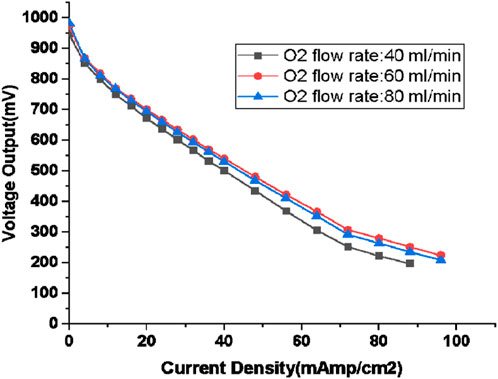
Figure 6. Polarisation curve for Hydrogen flow rate of 80 mL/min (oxygen flow rate: 40, 60, 80 mL/min; humidification temperature: 60°C, gas line temperatute: 70°C).
Concomitant with the specified oxygen flow rates, the hydrogen-oxygen proportions were set at 50%, 75%, and 100%, respectively. The humidification temperature of both anode and cathode were kept constant at 60°C. The polarization curves for these three distinct hydrogen-oxygen proportions conform to the conventional polarization curve pattern. It’s important to note that the experimentation did not extend beyond a hydrogen-oxygen proportion of 80:80, as it yielded no discernible advantages, as depicted in Figure 6.
The most favourable outcome is associated with 80 mL/min hydrogen flow rate and 60 mL/min oxygen flow rate (which amounts to 75% oxygen proportion or 50% excess oxygen) having the least over-potential of 748 mV. Nevertheless, it’s worth mentioning that the performance achieved with 80 mL/min hydrogen flow rate and 80 mL/min oxygen flow rate-which amounts to equal proportion of oxygen and hydrogen or 100% excess oxygen, closely approximated the results, particularly in the activation loss and ohmic loss segments with 203 and 213 mV activation loss for 50% and 100% excess oxygen respectively and ohmic loss of 230 and 238 mV for 50% and 100% excess oxygen respectively. The higher oxygen proportion prompted the fuel cell to operate at a slightly elevated load compared to the hydrogen-oxygen proportion dictated by chemical considerations.
Analyzing the distinct cell over-potentials presented in Table 3 offers valuable insights into the sections that predominantly influence the desirability of a specific hydrogen-oxygen proportion. The activation loss, ohmic loss, and concentration loss of individual over potentials were determined by analyzing the polarization curve. Following every load alteration, voltage values were recorded for duration of 100 s at intervals of 10 s. By calculating the mean and variations about the mean, it was determined that the uncertainty in the voltage values amounted to 0.45%. Since the voltage over potential relies on voltage values at various current (load) levels, the error associated with the voltage over potential appears to be inconsequential within the scope of this study.
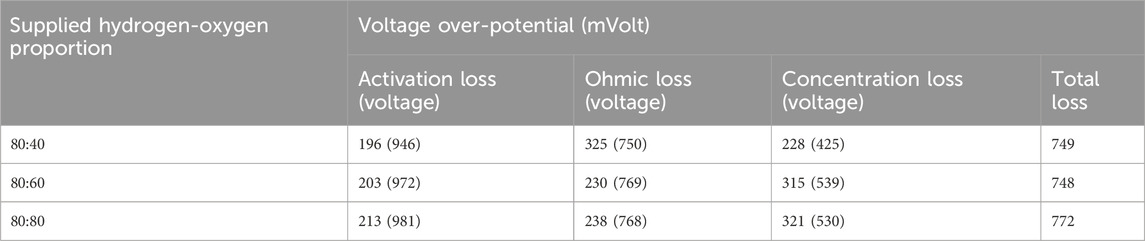
Table 3. Voltage over-potential for hydrogen flow rate of 80 mL/min (humidification temperature: 60°C, gas line temperature: 70°C).
In order to analyse the losses, a trend line was established for the polarization curve, and various voltage values were extracted to calculate each loss component. Specifically, the ohmic loss was calculated by measuring the voltage difference from the beginning to the end of the linear portion of the trend line. Similarly, the activation loss was determined by the difference in voltage values from the start of the trend line to the beginning of its linear portion. Finally, the concentration loss was obtained by comparing the voltage values from the end of the linear portion of the trend line to the end of the entire trend line.
Notably, activation losses exhibit a consistent increase-196, 203 and 213 mV for 0%, 50% and 100% excess oxygen for 80 mL/min hydrogen flow rate. This increase can be attributed to the higher water production associated with increased oxygen, leading to a reduction in reaction kinetics and thus a rise in activation losses. Furthermore, the escalated water production effectively fills voids previously occupied by gases, reducing overall resistance and consequently diminishing ohmic losses.
However, a higher concentration of oxygen can lead to the obstruction of active reaction areas, resulting in elevated concentration losses −228, 315, and 321 mV respectively for 0, 50, and 100% excess oxygen respectively. The comprehensive over-potential, calculated by summing up all losses, is observed to be the lowest−749 and 748 mV respectively for 80 mL/min and 60 mL/min oxygen flow rate- for the 80:60 proportions. Despite the fact that the losses linked with a 100% excess oxygen supply surpass those of all other hydrogen-oxygen proportions, the 80:80 proportion exhibits superior performance by operating at higher voltage ranges across various current density values and demonstrating the capacity to handle greater loads, making it the preferred choice. For example, for a current density of 20, 32, and 48 mA/cm2, the value of voltage generated −695, 593, and 468 mV comes close to related values for 60 mL/min oxygen flow rate such as 701, 602, and 480 mV respectively.
The power generated under various loads for three different oxygen flow rate is represented in Figure 7. The highest power output of 590 mW is achieved with a 60 mL/min flow rate of oxygen, which corresponds to a 50% excess of oxygen. Notably, the point of maximum power shifts to higher current density values as the oxygen flow rate increases, i.e., for 521 mW (40 mL/min oxygen flow rate), current density is 48 mA/cm2, for 590 mW (60 mL/min oxygen flow rate), the current density shifts to higher value of 56 mA/cm2. However, for 80 mL/min oxygen flow rate, the MPP occurs at 56 mA/cm2 itself. The significant contrast in output power for different oxygen flow rates becomes evident beyond the ohmic loss region, i.e., beyond 40 mA/cm2 with percentage difference with respect to base values associated with power output for 40 mL/min, (10%, 7%), (14%, 11%), (20%, 15%), (23%, 15%), (26%, 18%) and (27%, 19%) for current density values of 48, 56, 64, 72, 80, and 88 mA/cm2. The first number in the bracket difference with respect to 60 mL/min oxygen flow rate and the second one for 80 mL/min).
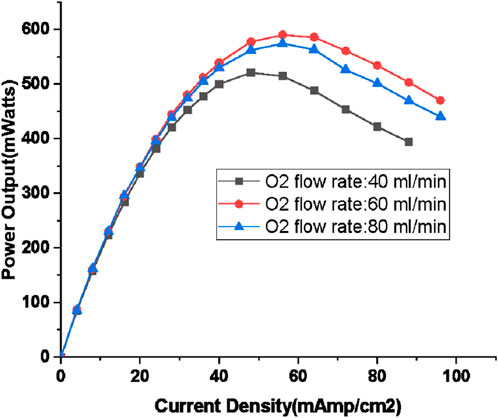
Figure 7. Output power for different loads for Hydrogen flow rate of 80 mL/min (oxygen flow rate: 40, 60, 80 mL/min; humidification temperature: 60°C, gas line temperature: 70°C).
A mathematical model, represented by the MPP curve, was obtained by fitting a second-degree polynomial, resulting in the Eq. 1:
Here, the MPP stand for maximum power point; GFR stands for oxygen gas flow rate in mL/min.
As Figure 4 illustrates, to operate the fuel cell at its maximum power point under varying loads, it is essential to adjust the oxygen flow rate in a non-linear manner.
3.2 Effect of oxygen flow rates on performance of PEMFC for hydrogen flow rate 100 mL/min
In an effort to explore the potential for increasing power output beyond the outcomes achieved with an 80 mL/min hydrogen gas flow rate, a series of trials was conducted using a 100 mL/min hydrogen gas flow rate, while systematically varying the excess oxygen supply (ranging from 50% to 150%). The humidification temperature of both anode and cathode side was kept constant at 60°C. The results of these experiments are depicted in Figure 8. The investigations were extended to excess oxygen levels up to 150%, beyond which the fuel cell demonstrated an inability to sustain the load, even at relatively low current density values (with a maximum power point of 324 mW reached at 32 mA/cm2 current density).
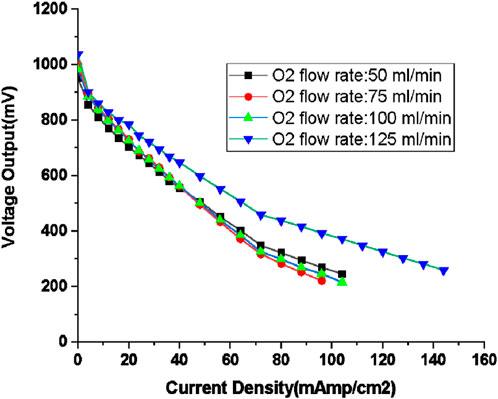
Figure 8. Polarisation curve for Hydrogen flow rate of 100 mL/min with various excess oxygen supply (oxygen flow rate: 50, 75, 100, and 125 mL/min; humidification temperature: 60°C, gas line temperature: 70°C).
Figure 8 illustrates that operations at higher voltage ranges become feasible with an oxygen flow rate of 125 mL/min (equivalent to 150% excess oxygen). The diverse losses associated with varying oxygen flow rates are presented in Table 4. Despite the elevated hydrogen flow rate, the total losses remain within a comparable range, primarily due to the proportionally consistent excess oxygen supply when compared to the case with an 80 mL/min hydrogen flow rate. However, it is worth noting that the configuration with the lowest total loss is associated with the condition of minimal excess oxygen having a flow rate of 50 mL/min. Yet, the capability to bear loads is notably improved under the condition of 150% excess oxygen with current density exceeding 140 mL/min. Experiments involving excess oxygen levels exceeding 150% (e.g., 200%) were unable to sustain loads beyond certain current density values associated with this level of excess oxygen provision.
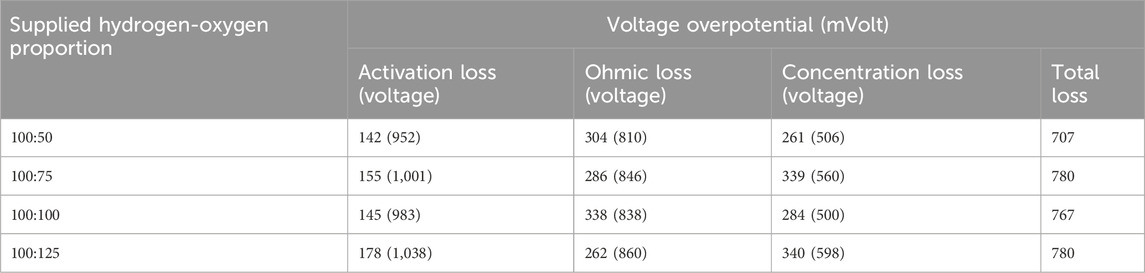
Table 4. Voltage over-potential for hydrogen flow rate of 100 mL/min (humidification temperature: 60°C, gas line temperatute:70°C).
The reasons for the higher load carrying capacity are clearly seen in Figure 8; Table 5; for 150% excess oxygen case, the open circuit voltage starts at a higher value and ohmic loss is the smallest, indicating slower drop in ohmic loss which lifts up the curve. The higher amount of water produced could be reducing the resistance, thus resulting in smaller value of ohmic loss.
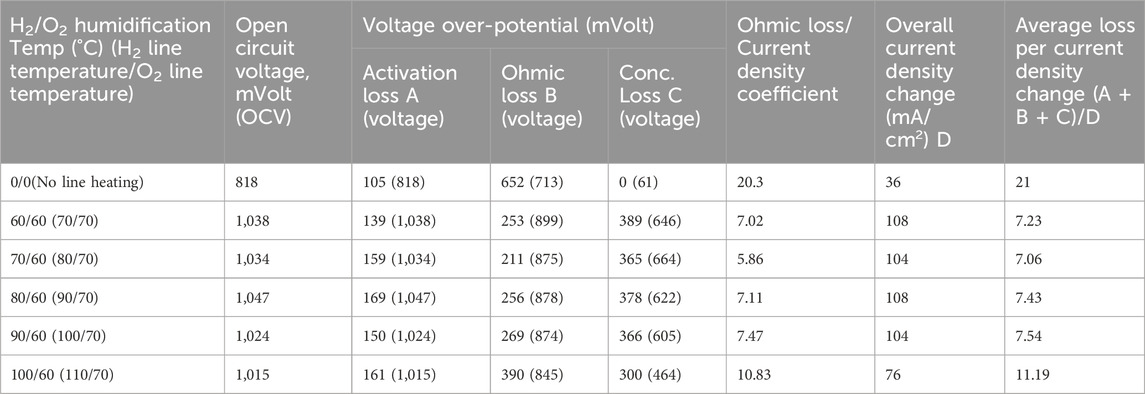
Table 5. Performance parameters for different hydrogen humidification temperatures for 150% excess oxygen condition with hydrogen flow rate of 100 mL/min.
The power developed by the fuel cell for different loads is plotted in Figure 9. The experiment with 150% excess oxygen supply has produced highest power of 833 mW, which is in line with the higher voltage of 438 mV developed as can be seen in Figure 8. The margin of difference in power output when compared with other excess oxygen conditions is about 35%. The maximum power point (MPP) shifts to the right with the increase in oxygen flow rate, 642 mW at 64 mA/cm2 for 50 mL/min oxygen flow rate and 833 mW at 80 mA/cm2 for 125 mL/min. The MPP curve based on fitting a 3rd degree polynomial resulted in Eq. 2:
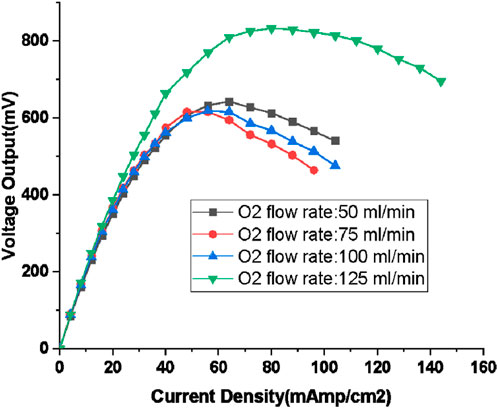
Figure 9. Output power for different loads for Hydrogen flow rate of 100 mL/min (oxygen flow rate: 50, 75,100, and 125 mL/min; humidification temperature: 60°C, gas line temperature: 70°C).
Here, the MPP stand for maximum power point; GFR stands for oxygen gas flow rate in mL/min.
The MPP curve is steeper when compared to that of the case with 80 mL/min flow rate of hydrogen indicating higher rate of rise in flow rate for even smaller increase in load.
When comparing the power output of PEMFC across different oxygen flow rates, it becomes apparent that for flow rates of 50 mL/min, 75 mL/min, and 100 mL/min, the power output values closely resemble each other until the maximum power at is attained. However, beyond this threshold, the disparity between the values increases and no discernible trend emerges aside from a decrease in the power output value. This region, characterized by an absence of a clear trend, is deemed unstable and unsuitable for operation. Such instability stems from random fluctuations in flooding, particularly as loading exceeds the maximum threshold. Similar perturbation is seen in the voltage output in Figure 8 beyond current loading of 40 mAmps/cm2 point where MPP occurs.
3.3 The effect of varying humidification temperature on the performance of PEMFC for 150% excess oxygen condition at 100 mL/min flow rate of hydrogen
In a Proton Exchange Membrane Fuel Cell (PEMFC), water formation occurs within the cathode section of the fuel cell as a result of the reduction reaction. The movement of water molecules is contingent on the condition of the membrane and the concentration of water in the anode section. Under certain conditions, water molecules migrate from the cathode section to the anode section. These water molecules in the anode section play a pivotal role in facilitating the transport of protons to the cathode through electro-osmotic drag. Consequently, ensuring adequate humidification in the anode section is imperative for the efficient operation of the PEMFC.
Figure 10 visually represents the performance of the PEMFC featuring a modified serpentine flow field with twin inlet and twin outlet configurations, under varying H2 humidification temperatures, while keeping the O2 humidification temperature constant at 60°C.
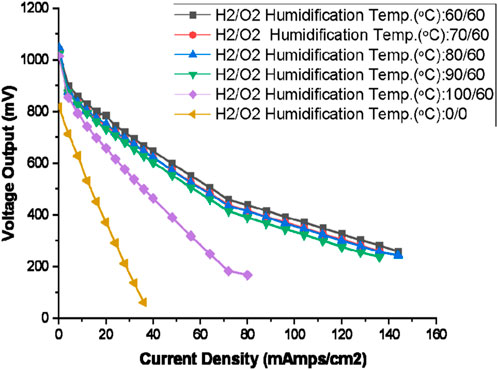
Figure 10. Polarisation curve for PEMFC for different humidification temperature of hydrogen with 150% excess oxygen supply (The oxygen side humidification temperature: 60°C, Oxygen gas flow rate: 125 mL/min, Hydrogen gas flow rate: 100 mL/min, H2/O2 Humidification Temp: 0/0 means no humidification for O2 and H2 gas).
Figure 10 presents polarisation curves illustrating the impact of different hydrogen gas humidification temperatures, while maintaining the oxygen humidification temperature at a constant 60°C. A higher humidification temperature leads to more rapid gas humidification, resulting in an anticipated increase in gas humidity. The selected humidification temperatures for this comparison are 60°C, 70°C, 80°C, 90°C, and 100°C. These results are juxtaposed with the polarisation curve derived from an experiment conducted under zero humidification conditions.
Under zero humidification conditions and at a 100°C humidification temperature, the polarisation curves exhibit a rapid decline with increasing load and are unable to sustain loads beyond a certain point. In the case of zero humidification, the membrane becomes highly dehydrated, resulting in inefficient proton transport and elevated ohmic resistance, evidenced by the steep slope, owing to the absence of water molecules.
With an increase in humidification temperature beyond dry humidification, the voltage output improves alongside an increase in current density for 60°C, 70°C, 89°C, and 90°C humidification temperature. However, at a 100°C humidification temperature, the substantial humidity in the hydrogen gas leads to a potential issue with excess flooding in both the anode and cathode, resulting in diminished output voltage and a sharp increase in resistance, thus elevating ohmic losses. For intermediate humidification temperatures, a more consistent and stable set of polarisation curves is observed.
Table 5 furnishes essential information pertaining to critical parameters that aid in characterizing the impact of humidification temperature. As depicted in Table 5, the line temperature for the hydrogen gas was maintained at a temperature 10°C higher than the specified humidification temperature, while the line temperature for the oxygen gas was set at 70°C, aligning with the 60°C humidification temperature for oxygen.
Utilizing data gleaned from the experimental results, parameters such as voltage over-potential, the coefficient of ohmic loss per current density (where the current density coefficient represents the change in current density during the linear segment of the polarisation curve), and the average loss per unit change in current density are tabulated. A close examination of the Table 5 reveals that, among the three categories of over-potential losses, the activation loss and concentration loss remain relatively consistent for intermediate humidification temperatures. Moreover, it becomes apparent that the performance of the Proton Exchange Membrane (PEM) fuel cell is notably influenced by the ohmic loss in the context of this specific experiment. Additionally, the calculated values of ohmic loss per current density coefficient offer insights into the slope of the crucial segment of the polarisation curve, thus proving valuable in the analytical process. Furthermore, the calculation of the average loss per overall change in current density is expected to reflect the average slope of the polarisation curve.
Further analysis of Table 5 reveals that the ohmic loss values are at their lowest for intermediate humidification temperatures, with the 70°C/70°C combination exhibiting the least ohmic loss. The slope associated with the ohmic loss for this particular combination is also the shallowest, indicating a smaller reduction in voltage output per unit increase in current density. While higher levels of humidification may facilitate proton transport, they can also lead to flooding, impeding the flow of gas into the membrane.
Conversely, lower levels of humidification can hinder proton transport and result in an increase in ohmic loss due to the absence of water particles. In light of these considerations, the 70°C/70°C humidification temperature combination emerges as the ideal choice based on all three parameters.
The power output of the Proton Exchange Membrane Fuel Cell (PEMFC) is depicted in Figure 11, with varying hydrogen gas humidification temperatures under a consistent 150% excess of oxygen supply, maintaining identical hydrogen and oxygen flow rates. As current density increases, the voltage output experiences a decline, resulting in an expected power output curve characterized by both negative and positive slopes, separated by a point of inflection—the maximum power point.
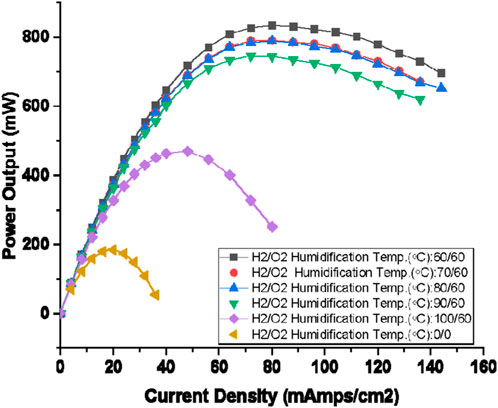
Figure 11. Output power of PEMFC for various hydrogen gas humidification temperatures under 150% excess oxygen supplies (Hydrogen gas flow rate: 100 mL/min, Oxygen gas flow rate: 125 mL/min).
In the absence of humidification for hydrogen and oxygen gases, the dry run yielded an exceedingly poor maximum power output. As the hydrogen humidification rate increases, facilitated by elevating the humidification temperature, the Maximum Power Point (MPP) achieves its highest value within the range of considered humidification temperatures, with only a slight increment in humidification temperature. However, beyond this point, further increases in humidification temperature lead to a marginal initial decrease in maximum power, which later escalates significantly, resulting in a notably poor power output at a 100°C humidification temperature.
Conversely, for intermediate humidification temperatures (60°C, 70°C, 80°C, and 90°C), the variation in maximum power is relatively minimal with values such as 833, 790, 788, and 745 mW. Additionally, the load at which the maximum power point occurs is 80 mA/cm2 and is quite consistent across these temperatures. Consequently, the PEMFC is expected to operate at a consistent maximum power value, which remains nearly identical for most intermediate humidification temperatures, across the range of 60°C–90°C, at a load corresponding to the Maximum Power Point (MPP) of these specific humidification temperatures.
3.4 Overall discussion
In Figures 6, 8, 10, voltage output values were acquired by incrementally increasing the current density. The current density limit is reached when the voltage no longer decreases. It’s important to note that this study is confined to low operating temperatures without external heating and moderate humidity levels ranging from 60% to 70%. These specific conditions contribute to relatively low current density limits.
While power curves (depicted in Figures 7, 9, 11) aid in addressing the aforementioned objectives, polarisation curves (illustrated in Figures 6, 8, 10) facilitate a detailed quantification and comparison of losses. Furthermore, the power curve assists in determining the appropriate flow rate to operate at when the load changes, and whether altering the flow rate yields any benefits under load variations. This rationale underscores the inclusion of three power curves and three polarisation curves. Despite the apparent repetition in these two sets of figures, they encapsulate a wealth of valuable information.
Regardless of hydrogen flow rates, variations in ohmic loss and concentration loss are notable across different oxygen flow rates, with slightly higher ranges observed for a hydrogen flow rate of 100 mL/min. This suggests that hydrogen flow rates between 80 and 100 mL/min yield comparable load-bearing capacities. However, despite the main flow rates being 80 mL/min and 100 mL/min, when split into channels, the effective flow rates are reduced to 40 mL/min and 50 mL/min, which may not significantly impact performance.
Moreover, concerning load-bearing capacity, optimal results are attained with an oxygen flow rate of 60 mL/min for a hydrogen flow rate of 80 mL/min, and with an oxygen flow rate of 125 mL/min for a hydrogen flow rate of 100 mL/min.
From Figure 7, 9, following important results are obtained:
Maximum power for both 80 mL/min and 100 mL/min group around 600 mWatts mark, except 125 mL/min oxygen for 100 mL/min hydrogen.
To optimize power output within the specified range of current density fluctuations, adjustments in gas flow rates are necessary. When the current density shifts from 48 to 76 mAmps/cm2, the optimal power output is achieved by modulating the oxygen flow rate between 40 and 80 mL/min. However, when the current density ranges between 56 and 76 mAmps/cm2, an alteration in both the hydrogen and oxygen flow rates is imperative. Specifically, the hydrogen flow rate must be adjusted to 100 mL/min, while the oxygen flow rate needs to be set within the range of 50–125 mL/min.
Comparison with Conventional serpentine flow field results:
To assess the performance disparity between the twin inlet and twin outlet flow field configurations and the conventional serpentine flow field, we conducted a comparative analysis. We plotted the voltage output and power curves corresponding to the optimal results achieved with hydrogen flow rates of 80 mL/min and 100 mL/min for both the twin inlet and twin outlet flow field setups. These plots were juxtaposed with those representing the conventional serpentine flow field. Figure 12 presents the comparison of voltage output, while Figure 13 depicts the comparison of power output.
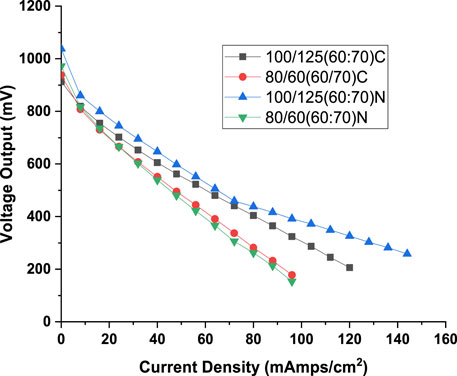
Figure 12. Comparison of voltage output for conventional serpentine and twin inlet and twin outlet flow field for best performing configuration associated with twin inlet twin outlet flow field (N: best result associated with twin inlet twin outlet flow field. C: results for conventional serpentine flow field obtained for same configuration at which best results were obtained for twin inlet twin outlet flow field).
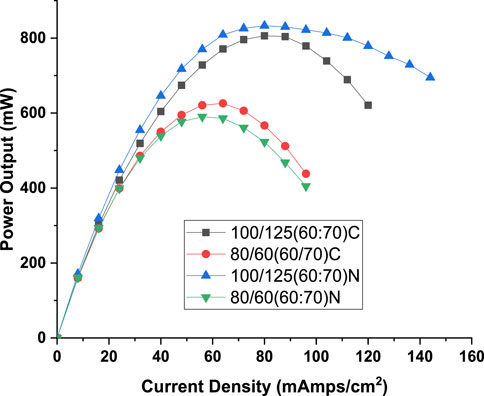
Figure 13. Comparison of power output for conventional serpentine and twin inlet and twin outlet flow field for best performing configuration associated with twin inlet twin outlet flow field (N: best result associated with twin inlet twin outlet flow field. C: results for conventional serpentine flow field obtained for same configuration at which best results were obtained for twin inlet twin outlet flow field).
As depicted in Figure 12, the twin inlet–twin outlet flow field exhibits marginally superior voltage output characteristics compared to those of the conventional serpentine flow field, particularly at higher hydrogen flow rates (100 mL/min). For example, at 48 mA/cm2 current density, the voltage developed for novel flow field is 598 mV against 562 mV for conventional flow field. That is, a marginal superiority of about 6%. However, when considering lower hydrogen flow rates (80 mL/min), no distinct advantage is discernible (Maximum of 1% at 8 mA/cm2 current density). At the 80 mL/min hydrogen flow rate, the flow rate within the individual channels of the twin inlet-twin outlet flow field (40 mL/min) falls below that of the single channel in the conventional flow field (80 mL/min). The potential benefits derived from having twin inlets and two separate pathways are offset by the reduced quantity of hydrogen interacting with the MEA. Nonetheless, at a hydrogen flow rate of 100 mL/min, even a flow rate of 50 mL/min in each channel of the twin inlet-twin outlet flow field proves adequate to harness all the advantages associated with this innovative flow field configuration, as previously.
A comparative examination of power output can be derived from Figure 13, where the power output values for the conventional serpentine flow field are compared to those obtained at configurations (hydrogen flow rate and oxygen flow rate) yielding the best results with the twin inlet – twin outlet flow field. As illustrated in Figure 13, the twin inlet-twin outlet flow field exhibits approximately 3.3% (833 mW for novel flow field and 806 mW for convention flow field) higher peak power output at a hydrogen flow rate of 100 mL/min, whereas at 80 mL/min, the conventional serpentine flow field demonstrates roughly 5% (626 mW for convention flow field and 590 mW for novel flow field) higher peak power. However, it’s noteworthy that the peak value at 80 mL/min is approximately 33%–40% (833 mW for novel flow field and 626 mW for conventional flow field)lower than that achieved with a hydrogen flow rate of 100 mL/min, considering both conventional and twin inlet-twin outlet configurations together.
4 Conclusion
The primary objective of this research was to evaluate the performance of a flow field having twin inlet and twin outlet, under conditions of excess oxygen supply beyond the chemically correct proportion. The study aimed to identify the optimal excess oxygen proportion and the ideal hydrogen flow rate. Additionally, it sought to determine the most favorable humidification conditions for the optimal hydrogen flow rate. Based on the discussions and analyses presented in the preceding sections, the following conclusions have been drawn:
i) Fuel cell with twin inlet–twin outlet flow field produced was able to produce good power output.
Higher flow rate of hydrogen results in better performance when the oxygen flow rate is also higher.
ii) The ability of a fuel cell to handle higher loads while maintaining high output voltage is determined by both the Open Circuit Voltage (OCV) and the slope of the ohmic loss over-potential.
Conditions observed to meet these criteria include 80 mL/min at 50% excess oxygen proportion and 100 mL/min at 150% excess oxygen proportion.
iii) Operating a fuel cell without gas humidification, known as a dry run, results in very poor performance. Conversely, excessive humidification is detrimental to the fuel cell’s performance.
iv) Temperatures of 60°C, 70°C, 80°C, and 90°C consistently produced nearly identical maximum power outputs, with Maximum Power Points (MPPs) occurring at the same current density value of 76 mA/cm2
v) The ohmic loss plays an important role in controlling the performance of twin inlet-twin outlet PEMFC fuel cell.
vi) The twin inlet-twin out let flow field demonstrated 3.3% higher peak pressure compared to conventional serpentine flow field and also its load bearing (maintaining higher level of voltage when load increased) is better.
Data availability statement
The original contributions presented in the study are included in the article/Supplementary Material, further inquiries can be directed to the corresponding author.
Author contributions
AJ: Conceptualization, Methodology, Data curation, Formal Analysis, Writing–original draft. SB: Methodology, Formal Analysis, Investigation, Writing–original draft. SR: Formal Analysis, Supervision, Writing–review and editing.
Funding
The author(s) declare that financial support was received for the research, authorship, and/or publication of this article. All India Council for Technical Education for research. This work was supported by All India council for Technical education(AICTE) grant funded by the Government of India(No.8-168/FDC/RPS(Rural)/POLICY-1/2021-22) and NMAM Institute of Technology(NITTE-deemed to be university). The authors thank profusely the support provide by the two organisations.
Conflict of interest
The authors declare that the research was conducted in the absence of any commercial or financial relationships that could be construed as a potential conflict of interest.
The author(s) declared that they were an editorial board member of Frontiers, at the time of submission. This had no impact on the peer review process and the final decision.
Publisher’s note
All claims expressed in this article are solely those of the authors and do not necessarily represent those of their affiliated organizations, or those of the publisher, the editors and the reviewers. Any product that may be evaluated in this article, or claim that may be made by its manufacturer, is not guaranteed or endorsed by the publisher.
References
Arvay, A., French, J., Wang, J. C., Peng, X. H., and Kannan, A. M. (2015). Modeling and simulation of biologically inspired flow field designs. Open electrochem. J. 6, 1–9. doi:10.2174/1876505X01506010001
Chen, T., Yong, X., and Tiezhu, C. (2012). The impact on PEMFC of bionic flow field with a different branch. Energy Procedia 28, 134–139. doi:10.1016/j.egypro.2012.08.047
Cho, J. I. S., Neville, T. P., Trogadas, P., Meyer, Q., Yunsong, W., Ziesche, R., et al. (2019). Visualization of liquid water in a lung-inspired flow-field based polymer electrolyte membrane fuel cell via neutron radiography. Energy 170, 14–21. doi:10.1016/j.energy.2018.12.143
Cooper, N. J., Smith, T., Santamaria, A. D., and Park, J. W. (2016). Experimental optimization of parallel and interdigitated PEMFC flow-field channel geometry. Int. J. Hydrogen Energy 41 (2), 1213–1223. doi:10.1016/j.ijhydene.2015.11.153
Daniel, L. G., Abel, H. G., Bladimir, R. A., Isaac, P. R., and Alejandro, A. O. (2013). Performance analysis of a proton exchange membrane fuel cell using tree-shaped designs for flow distribution. Int. J. Hydrogen Energy 38 (34), 14750–14763. doi:10.1016/j.ijhydene.2013.08.012
David, O., Adnan, O., Mustafa, E. C., Ozgur, C., Hadi, G., Xianguo, L., et al. (2018). Assessment of different bio-inspired flow fields for direct methanol fuel cells through 3D modeling and experimental studies. Int. J. Hydrogen Energy 43 (2), 1152–1170. doi:10.1016/j.ijhydene.2017.06.073
Dhahad, H. A., Alawee, W. H., and Hassan, A. K. (2019). Experimental study of the effect of flow field design to PEM fuel cells performance. Renew. Energy Focus 30, 71–77. doi:10.1016/j.ref.2019.05.002
Faraz, A., and Ramin, R. (2012). Numerical modeling of an innovative bipolar plate design based on the leaf venation patterns for PEM fuel cells. Int. J. Eng. 25 (3), 177–186. doi:10.5829/idosi.ije.2012.25.03c.01
Guangjin, W., Yi, Y., Hai, L., Chunli, G., Sheng, W., Xiaohua, W., et al. (2018). Progress on design and development of polymer electrolyte membrane fuel cell systems for vehicle applications: a review. Fuel Process. Technol. 179, 203–228. doi:10.1016/j.fuproc.2018.06.013
Guo, N., Ming, C. L., and Umit, O. K. (2014). Bio-inspired flow field designs for polymer electrolyte membrane fuel cells. Int. J. Hydrogen Energy 39 (36), 21185–21195. doi:10.1016/j.ijhydene.2014.10.069
Haibing, L., Lei, X., Xueguan, S., and Linlin, Y. (2023). A novel flow field design method for HT-PEM fuel cells: a hybrid topology and surrogate mode. Int. J. Hydrogen Energy 48 (84), 2955–32967. doi:10.1016/j.ijhydene.2023.05.040
Hamrang, A., Abdollahzadeh, M., Moradi Bilondi, A., Bagherighajari, F., Rahgoshay, S. M., and Pascoa, J. C. (2023). Comparison of PEMFC performance with parallel serpentine and parallel serpentine-baffled flow fields under various operating and geometrical conditions; a parametric study. Int. J. Hydrogen Energy 48 (20), 7442–7459. doi:10.1016/j.ijhydene.2022.11.122
Jiao, K., Xuan, J., Du, Q., Bao, Z., Xie, B., Wang, B., et al. (2021). Designing the next generation of proton-exchange membrane fuel cells. Nature 595, 361–369. doi:10.1038/s41586-021-03482-7
Kahraman, H., and Orhan, M. F. (2017). Flow field bipolar plates in a proton exchange membrane fuel cell: analysis & modeling. Energy Convers. Manag. 133, 363–384. doi:10.1016/j.enconman.2016.10.053
Kjelstrup, S., Marc, O. C., Pharoah, J. G., and Peter, P. (2010). Nature-Inspired energy- and material-efficient design of a polymer electrolyte membrane fuel cell. Energy fuels. 24 (9), 5097–5108. doi:10.1021/ef100610w
Liu, H., Li, P., Juarez-Robles, D., Wang, K., Hernandez-Guerrero, , and David, G. (2014). Experimental study and comparison of various designs of gas flow fields to PEM fuel cells and cell stack performance. Front. Energy Res. doi:10.3389/fenrg.2014.00002
Ozden, A., Ercelik, M., Ouellette, D., Colpan, C. O., Ganjehsarabi, H., and Hamdullahpur, F. (2017). Designing, modeling and performance investigation of bio-inspired flow field based DMFCs. Int. J. Hydrog. Energy 42, 21546–21558. doi:10.1016/j.ijhydene.2017.01.007
Parekh, A. (2022). Recent developments of proton exchange membranes for PEMFC: a review. Front. Energy Res. 10, 956132. doi:10.3389/fenrg.2022.956132
Ryan, O’H., Yingke, Z., Robert, P., Timothy, H., Joe, B., and David, G. (2009). Improving PEMfuel cell catalyst activity and durability using nitrogen-doped carbon supports: observations from model Pt/HOPG systems. J. Mater. Chem. 19, 7830–7838.
Sauermoser, M., Kizilova, N., Pollet, B. G., and Kjelstrup, S. (2020). Flow field patterns for proton exchange membrane fuel cells. Front. Energy Res. 8 (14), 1–20. doi:10.3389/fenrg.2020.00013
Trogadas, P., Chao, J. I. S., Neville, T. P., Marquis, J., Wu, B., Brett, D. J. L., et al. (2018). A lung-inspired approach to scalable and robust fuel cell design. Energy Environ. Sci. 11, 136–143. doi:10.1039/c7ee02161e
Uylings, H. B. M. (1977). Optimization of diameters and bifurcation angles in lung and vascular tree structures. Bull. Math. Biol. 39 (5), 509–520. doi:10.1016/s0092-8240(77)80054-2
Yingdong, H., Yuekuan, Z., Jing, Y., Zhengxuan, L., Zhe, W., and Guoqiang, Z. (2021). Transformation towards a carbon-neutral residential community with hydrogen economy and advanced energy management strategies. Energy Convers. Manag. 249, 114834. doi:10.1016/j.enconman.2021.114834
Yun, W., Daiela Fernanda, R. D., Ken S., C., Zhe, W., and Xavier Cordobes, A. (2020). Materials, technological status, and fundamentals of PEM fuel cells-a review. Materials Today 32, 178–203. doi:10.1016/j.mattod.2019.06.005
Zhang, Y., and Tu, Z. (2024). Flow-field design of the bipolar plates in polymer electrolyte membrane fuel cell: problem, progress, and perspective. Appl. Energy Combust. Sci. 17, 100244. doi:10.1016/j.jaecs.2023.100244
Keywords: twin inlet and twin outlet flow field, humidification temperature, maximum power point, fuel cell over potential, activation loss, concentration loss
Citation: Jose A, Bekal S and Revankar ST (2024) Effect of oxidant quantity and humidification temperature on performance of PEMFC with twin inlet and twin outlet flow field. Front. Energy Res. 12:1390956. doi: 10.3389/fenrg.2024.1390956
Received: 24 February 2024; Accepted: 04 June 2024;
Published: 19 June 2024.
Edited by:
Jinliang Yuan, Ningbo University, ChinaReviewed by:
Zhengkai Tu, Huazhong University of Science and Technology, ChinaGuilin Hu, Zhejiang University of Science and Technology, China
Shian Li, Dalian Maritime University, China
Copyright © 2024 Jose, Bekal and Revankar. This is an open-access article distributed under the terms of the Creative Commons Attribution License (CC BY). The use, distribution or reproduction in other forums is permitted, provided the original author(s) and the copyright owner(s) are credited and that the original publication in this journal is cited, in accordance with accepted academic practice. No use, distribution or reproduction is permitted which does not comply with these terms.
*Correspondence: Sudesh Bekal, c3VkZXNoYmVrYWxAbml0dGUuZWR1Lmlu