 Changhong Cai1,2
 Li Wang1,2*Rui Zhang1Qiang Kang1,2Qingxiu Zhang1,2Dan Zhao1,2Jingsu Guo1,2Manfei Chen1,2Hongbin Chen1Lei Lei3Ke Wang1,2Jiahuan He1,2
- 1Exploration and Development Research Institute of PetroChina Southwest Oil and Gas Field Company, Chengdu, China
- 2Shale Gas Evaluation and Exploitation Key Laboratory of Sichuan Province, Chengdu, China
- 3Development Department of PetroChina Southwest Oil and Gas Field Company, Chengdu, China
Shale oil is mainly stored in the nano–micro-pores of shale in the form of adsorption or in a free state. Among them, only free-state oil is the main contributor to shale oil production under natural elastic energy. Therefore, it is crucial to evaluate the movability of crude oil effectively. In this paper, focusing on the Jurassic shale oil reservoir core in the middle-eastern Sichuan region of China, low-field nuclear magnetic resonance (NMR) technology is used to analyze the basic characteristics of shale oil core samples. Experiments on the low-field NMR one-dimensional and two-dimensional spectrum characteristics of the original core, heat-treated core, and thermogravimetric-treated shale core are carried out. The effects of the TG-MS method, T2 method, and the volatilization of light oil components on the movability of shale oil reservoirs are analyzed, and the movability characteristics of shale oil reservoirs in the middle-eastern Sichuan region are preliminarily clarified. The results show that under thermal treatment, the distribution range of the two-dimensional spectrum of the core oil occurrence area is significantly reduced, and the T1 and T2 distribution ranges are reduced by 10.9% and 60.7%, respectively. According to the TG-MS method, the mobile oil, bound oil, and adsorbed oil account for 74.7%, 8.1%, and 17.2%, respectively. The quantitative calculation of movable oil saturation by NMR combined with heat treatment is 65.6%, which is lower than that calculated using the thermogravimetric method. In order to calculate the movability more accurately, the scale effect between different samples should be considered. This study could provide a theoretical basis for the subsequent shale oil development program.
1 Introduction
Shale oil is an emerging unconventional reservoir resource with huge potential reserves, which has important economic value and strategic significance (Liu et al., 2022; Tan et al., 2023; Feng et al., 2020; Wang et al., 2022; Li et al., 2021). However, due to its special reservoir characteristics and complex distribution status, it is very difficult to evaluate the shale oil stratum selection, find its “geological sweet spot” and “engineering sweet spot,” and carry out the movability evaluation of the target reservoir (Jiang et al., 2018; Jin et al., 2022; Wang et al., 2021). The traditional movability characterization of shale oil mainly studies the occurrence state and oil-bearing characteristics of shale oil in shale oil reservoirs on the basis of mastering the characteristics of mineral rock and pore structure, simulates the flow process of shale oil in the reservoir (Huang et al., 2023; Jiang et al., 2020; Tian et al., 2022; Enze et al., 2022; Tan et al., 2021), analyzes the mobilization parameters such as mobilization conditions, mobilization law, and mobilization amount of shale oil, and studies the influencing factors of shale oil movability (Liu et al., 2022; Liu et al., 2022; Wang et al., 2022). However, due to the restriction of experimental conditions, irreversible damage will be caused to the core, resulting in a large gap between the experimental results and the actual field conditions (Dong et al., 2019; Ge et al., 2021; Guo et al., 2021; Huang et al., 2023; Huang et al., 2020). Low-field nuclear magnetic resonance (NMR) is an efficient and non-destructive fluid detection technology for porous media, which is suitable for laboratory core analysis and downhole measurement. It can provide reservoir parameters such as porosity, permeability, and confined water saturation, as well as observe the fluid distribution state. It is one of the important methods for complex reservoir evaluation (Liu et al., 2023; Ma et al., 2023; Sun et al., 2022).
The study of the original oil and water distribution of shale oil has a great research prospect (Zhu et al., 2019). At present, some progress has been made in the study of fluid distribution and movability of shale reservoirs using low-field NMR technology. Studies have shown that the T1–T2 relaxation spectrum can obtain information about the interaction between fluid molecules and pore surfaces, thus effectively characterizing porous medium pores and their fluid distribution (Rui et al., 2022; Bao et al., 2021). Zou et al. (2014) pointed out that the movability characterization of shale oil is the movability characterization of free oil in shale oil. When the oil saturation index reaches 100 mg/g or more, the free oil in shale can flow. Using the results of NMR experiments and constant speed mercury intrusion experiments (Zou et al., 2014), Bi et al. (2021) pointed out that there is a good correspondence between the NMR T2 spectrum and capillary pressure curve. The radius of the pore throat is smaller than the T2 cutoff value of the movable fluid, and the fluid in the pore encounters flow difficulty (Bi et al., 2021). Wang et al. (2014) used the nuclear magnetic resonance T2 spectrum and centrifuge experiments to master the T2 spectrum distribution of shale reservoirs in the initial state, water saturated state, and oil content conditions and obtained the utilization law of shale oil (Wang et al., 2014). At present, the evaluation methods for shale oil movability are not mature (Yu et al., 2019; Wen et al., 2023), and the relevant influencing factors of movability are not clear. Targeted experimental methods and research techniques also need to be further mastered.
Therefore, in this paper, focusing on the Jurassic shale oil reservoir core in the middle-eastern Sichuan region of China, first, low-field nuclear magnetic resonance technology is used to analyze the basic characteristics of shale oil reservoirs. Experiments on the low-field nuclear magnetic resonance one-dimensional spectrum and two-dimensional spectrum characteristics of the original core, core heat treatment, and thermal gravity treatment of the shale core are carried out. The effects of the thermal gravity mass method, T2 method, and light component volatilization of crude oil on the movability of shale oil reservoirs are analyzed. The movability characteristics of shale oil reservoirs in the middle-eastern Sichuan region are preliminarily clarified, providing a theoretical basis for the subsequent adjustment of shale oil development programs.
2 Materials and methods
2.1 Experimental materials and instruments
(1) Experimental core: The shale core and natural sandstone core were drilled on site, and the basic physical parameters are shown in Table 1.
(2) Experimental oil: The crude oil was acquired from the targeted tight oil well, with a density of 0.89 g/cm3 and viscosity of 4.21 mPa s (60°C).
(3) Liquid of Soxhlet extraction: Toluene:ethanol:petroleum ether—2:1:1.
(4) Experimental instruments: Porosimeter, pulse decay permeameter, Soxhlet oil extraction instrument, high-pressure core saturation device, and low-field nuclear magnetic resonance online analysis system (MacroMR12-150H-I).

Table 1. Basic parameters of core samples.
2.2 Experimental method
The basic flowchart of this study is shown in Figure 1. The detail experiment procedures are as followes.
(1) Core-saturated formation crude oil experiment: First, the core is oil washed using the Soxhlet oil extraction instrument. Then, the formation oil is saturated at a pressure of 20 MPa using the high-pressure saturation device.
(2) Saturated oil core T1–T2 spectrum test: The experimental core is placed in the holder of the low-field NMR device, the experimental temperature is stabilized for 30 min, and the T1–T2 and T2 spectra of the core samples are tested using the IR-CPMG pulse sequence and CPMG pulse sequence, respectively. The two pulse sequence parameter settings are shown in Table 2.
(3) Oil occurrence characteristic experiment of shale oil: Part of the shale core of saturated crude oil is prepared into a diameter of approximately 3 mm, and a thermogravimetric curve of 110°C is determined using a synchronous thermal analyzer. The same core is taken by heating at 110°C for 20 min, the T1–T2 and T2 spectra of the heated core sample are measured using the low-field NMR device, and then the above steps are repeated to determine the core T1–T2 and T2 spectra after 20, 40, and 60 min of treatment and the characteristics of the specific thermogravimetric change and T1–T2 and T2 spectra.
(4) The test temperature is set to 60°C, and the fluorinated liquid is circulated for 60 min until the temperature is stabilized. The oil sample is transferred from the crude oil bottle to a beaker, the temperature is set to 60°C, and the T2 spectrum of the 60-C environment is measured using the CPMG pulse sequence. The T2 spectrum of the original sample is measured at 60°C using the CPMG pulse sequence. The above process is repeated at different time intervals for sampling.

Figure 1. Experimental flowchart.

Table 2. Nuclear magnetic pulse sequence.
3 Results and discussion
3.1 Basic characteristics of the core and fluid
On the one hand, the distribution and movability of shale reservoir fluid are influenced by the structure of the rock pore throat. On the other hand, they are also related to the nature of the fluid itself. The more complex the pore throat structure, the worse the fluid flow capacity and the movability. The fluid composition determines its properties, and the more vulnerable it is to environmental changes, the more likely its flow capacity is to change, thus affecting the distribution and movability. In this section, the aperture distribution characteristics of cores are obtained through a high-pressure mercury experiment. Crude oil carbon number analysis is conducted to clarify the composition of crude oil. The experimental results are shown in Figures 2–5.
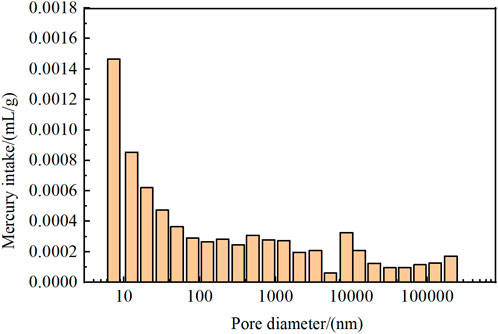
Figure 2. Pore size distribution of the core sample.
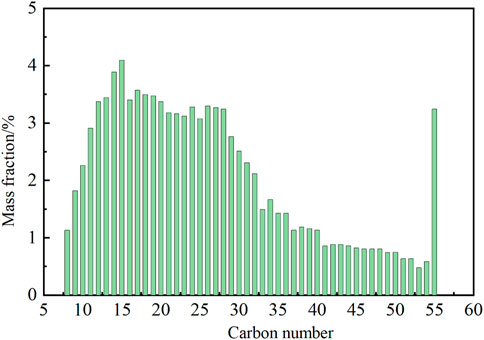
Figure 3. Distribution of the crude oil carbon number in the TD well.
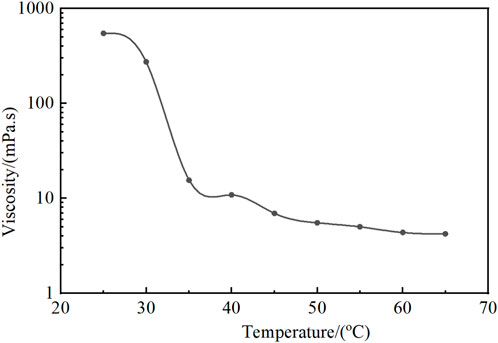
Figure 4. Crude oil viscosity vs temperature of the TD well.
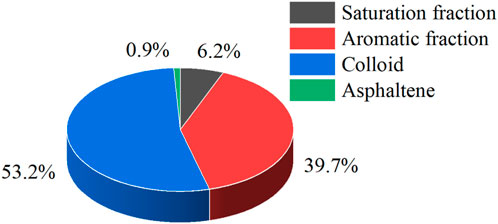
Figure 5. Component of crude oil from the TD well.
Figure 2 shows that the aperture distribution range of the core is 7.35–205,600 nm. The large distribution range of the pore size further indicates that the pore throat structure of the shale core is highly heterogeneous, and the existence of large pore size, which shows that the shale texture is brittle and sensitive due to stress change, is easy to produce microcracks, thus Figure 2 existing the pore size of 106 nm scale. The results also show that the main pore size of the shale core ranges from 7.35 to 5,290 nm, accounting for 83.1% of the total pores. It shows that shale nano–micro pores are highly developed and are the main storage and transportation space of shale. The pore size of 8.61∼205.60 μm accounted for 16.9%, which is mainly microfracture development.
TD well crude oil is mainly C10∼C32, accounting for 72.6%, and the aromatic and colloid account for 92.9%. It does not flow at room temperature; however, the viscosity is reduced by 97.2% at 35°C, which improves the fluidity significantly. Attention should be made to the produced crude oil on site to heat and insulate, to strengthen the oil flow capacity.
3.2 Two-dimensional spectrum characteristics of the core saturated with crude oil
The distribution status of crude oil in the reservoir reveals different crude oil advantage areas, which is an important reference factor in the development process of improving EOR, and divides the application boundary for improving crude oil recovery techniques at different pore scales. Therefore, in order to explore the occurrence characteristics of crude oil in the pores of the shale reservoir, the MacroMR12-150H-I NMR online analysis system is used to measure the two-dimensional spectrum distribution of crude oil cores under saturated crude oil so as to clarify the occurrence of crude oil in shale pores of different sizes to facilitate the subsequent exploration of crude oil utilization at different pore boundaries. The results are shown in Figure 6.
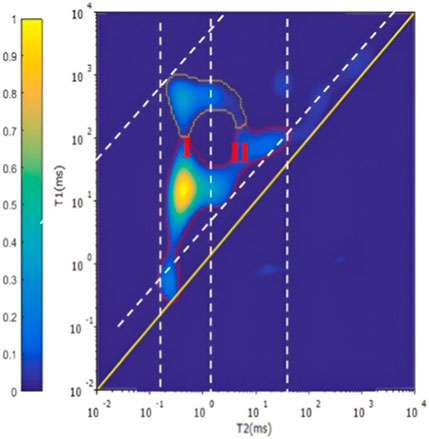
Figure 6. 2D spectrum in the core saturated with crude oil.
After oil is saturated at high pressure, the area I crystalline water zone is within T1, 0.21∼1,018.3 ms and T2, 0.19∼4.4 ms; the main occurrence area of oil in a nanometer-sized pore is within T1, 31.3.3∼913.3 ms and T2, 4.4∼1,018.3 ms. That is, the occurrence status of crude oil can be more intuitively observed through the two-dimensional spectrum.
3.3 Two-dimensional spectrum characteristics of shale cores with heat treatment
High-pressure-saturated oil core pores are full of crude oil, but under the influence of the thermal effect, the crude oil gradually volatilized from the pores. To explore the volatilization of crude oil, the movability of shale oil can be explored; therefore, different heating time cores are taken, and the MacroMR12-150H-I MRI online analysis system is used to measure the 2D spectrum distribution of the crude oil core under different heating times. The results are shown in Figure 7:
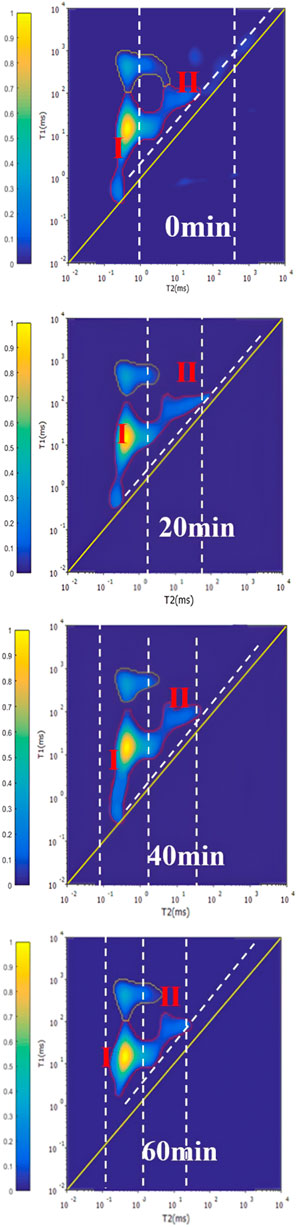
Figure 7. 2D spectrum of the core during heat treatment at different times.
With the extension of the heating time, the distribution pattern of the core changes. Region I is mainly crystallized water with treatment at 110°C. The use of crystallized water was not significant. the distribution of region I is largely unchanged, still remaining within the range of T1: 0.21∼1,018.3 ms, T2: 0.14∼2.3 ms, and T1/T2: 1.0∼6,019.1. The main area is crude oil; with the increasing heating time, the regional distribution range was significantly reduced, the T1 distribution range decreased by 10.9% (from 5.5 to 103.7 ms to 5.5 to 93.0 ms), and the T2 distribution range was reduced by 60.7% (from 1.9 to 43.4 ms to 1.9 to 18.2 ms). In other words, under high temperature, the crude oil in the nanometer-sized pore of the core volatilized gradually, which reduces the regional distribution range in the two-dimensional spectrum, and then, the dynamic oil amount of shale can be explored through thermogravimetric treatment.
3.4 Movable oil analysis of shale oil rock samples
3.4.1 Movable oil by thermogravimetric treatment
Thermogravimetric analysis of saturated oil shale records the change in the sample quality in real time to analyze the volatile amount of shale oil at different times. The volatile amount of shale oil (i.e., the loss of oil) increases with the increase in heating time. The volatile rate of shale oil in different samples is different. The volatile rate of shale oil depends on the pore structure of shale. The better the pore structure, the higher the volatilization rate of shale oil. According to different volatile rates, the content of movable oil, free oil, and bound oil at different stages can be determined, and then, the movable oil content of the shale core can be obtained under the fragmentation scale. The mass change in shale cores at different heat treatment times is shown in Figure 8.
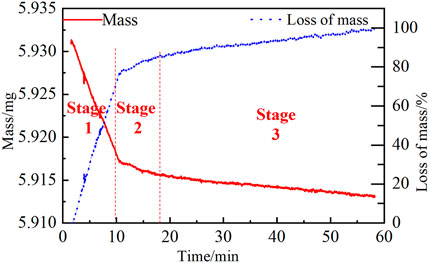
Figure 8. Mass change in the shale sample during thermogravimetric treatment.
The mass of shale samples at 110°C varies with time, consisting of three linear segments, and the slope gradually decreases with the heating time. The volatilization slope of shale oil type can be identified in different time periods of the shale oil volatilization process. The larger slope indicates a faster volatilization rate of shale oil and better movability. Therefore, the slope from large to small represents the movable oil, bound oil, and adsorbed oil, respectively. Phase I is the movable oil volatilization stage, lasting for 10.3 min, where the volatile oil amount is 0.013 mg; in the bound oil volatilization stage, the shortest time is 4.9 min, and the oil loss is 0.0014 mg; the adsorption oil volatilization stage is 42.9 min, and the oil loss is 0.0030 mg. The proportion of movable oil, bound oil, and adsorbed oil was 74.7%, 8.1%, and 17.2%, respectively.
3.4.2 Movable oil by the T2 spectrum of the NMR method
The NMR T2 spectrum of hydrogen fluid in the core pore saturation, high-pressure saturated oil after measuring the shale core T2 spectrum, the core-saturated crude oil, total oil content T2 signal for pore signal and shale itself, heating stability of the shale core T2 spectrum, the core is still untreated completely bound oil, T2 signal for pore bound oil signal and shale itself, drying oil after measuring the shale core T2 spectrum, the core is no fluid, T2 signal for shale organic matter signal. Through the analysis of the NMR T2 spectrum of the core sample during different heating times, the movable oil content at the core scale can be obtained at different heating times. The T2 spectrum changes in shale cores at different heat treatment times are shown in Figure 9.
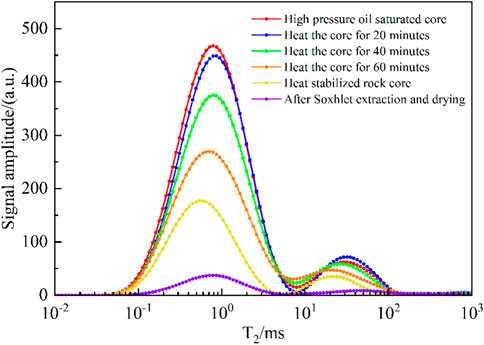
Figure 9. Dynamic T2 spectrum of the core under high-temperature treatment.
The peak area of the NMR T2 spectrum can quantitatively represent the content of hydrogen fluid in the core pore, so the nuclear oil core can be used to quantitatively calculate the movable oil saturation for the saturated oil core:
where
S is the movable oil saturation, %;
A1 is the high-pressure-saturated oil core peak area;
A2 is the core T2 spectrum area after heating and stabilizing; and
A3 is the core T2 spectrum after Soxhlet extraction and drying.
The carbon and component analysis of crude oil are shown in Figures 4 and 5. Three states of oil occurrence in the shale sample are illustrated in Figure 10. The T2 spectrum of the high-pressure-saturated oil core can represent all crude oil and shale organic matter, and the T2 spectrum area is 11,550.7 a.u.. After heat treatment, the adsorbed oil adheres to the shale pore surface, while the movable oil is used to overcome the capillary force under the action of heat. The T2 spectrum area is 4,675.3 a.u.; after washing the oil and drying the core, the T2 spectrum represents the organic matter signal of shale itself, and the T2 spectrum area is 1,062.7 a.u.. The movable oil saturation is calculated as follows:
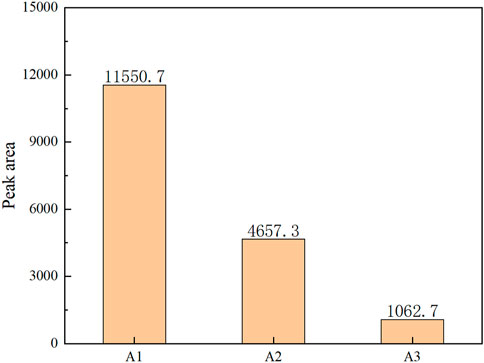
Figure 10. T2 spectrum area of the core under high-temperature treatment.
3.4.3 Light component evaporation in crude oil under heat treatment
The T2 spectrum of crude oil shows a single-peak distribution. The T2 peak area is shown in Figure 11. With the increase in evaporation time, the peak gradually decreases, indicating that the light hydrocarbon components in crude oil escape gradually, resulting in the decrease in light component and the corresponding peak area of the T2 spectrum.
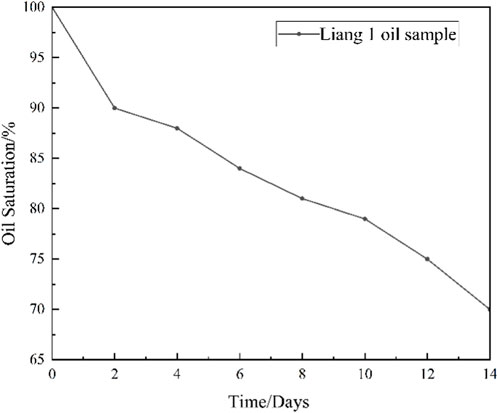
Figure 11. Light component evaporation of crude oil under heat treatment.
4 Discussion
The evaporation experiment of the light component of crude oil heat treatment showed that the light hydrocarbon component in crude oil gradually escapes, resulting in the decrease in the crude oil hydrogen content and the corresponding peak area of the T2 spectrum. Corresponding to the crude oil in the core pores of different scales, the crude oil gradually escapes from the pore under the thermal action, and the cores of different sizes have different evaporation resistances.
Samples for thermogravimetric analysis were 3 mm in diameter and approximately 2 mm in length, and samples for nuclear magnetic analysis were 49 mm in length and 25 mm in diameter. The two-to-scale difference led to the final thermal and nuclear magnetic movability. The movability calculated from the thermogravimetric analysis was 74.7% versus 65.6% from the NMR T2 spectrum. Thermogravimetric movability acquired with the broken sample is higher than that with the plug sample under the NMR method. For smaller-sized samples, under the thermal treatment, oil in pores is easier to overcome flow resistance. This indicates that for the same core sample, under the same temperature, the oil movability in the smaller-sized sample is higher than that in the large ones. Therefore, for a more accurate measurement of oil movability, the scale effect should be considered between different samples.
5 Conclusion
(1) From the thermogravimetric method, the volatile slope of shale oil over different time periods serves as an indicator for identifying shale oil types. A steeper slope implies a faster volatilization rate and enhanced movability of the shale oil. For the shale sample in this study, the movable oil, bound oil, and adsorbed oil account for 74.7%, 8.1%, and 17.2%, respectively.
(2) From the NMR T2 spectrum of the Jurassic section of central and eastern Sichuan shale samples, laboratory-scale experiments yielded a movable oil saturation of 65.6%.
(3) The two-dimensional spectrum provides a comprehensive analysis of the occurrence of crude oil. In particular, under thermal conditions, the T1 and T2 distribution ranges of crude oil were reduced by 10.9% and 60.7%, respectively. This suggests that crude oil volatilizes gradually from the nanometer-sized pore under high temperatures.
(4) Upon exposure to heat, light hydrocarbon components in crude oil evaporate progressively. The movable oil in the broken sample exposed to the thermogravimetric method surpasses that of the core plug sample, as observed using the NMR method. Smaller samples exhibit higher movable oil saturation under thermal conditions. Scale effects should be considered across different sized samples.
Data availability statement
The original contributions presented in the study are included in the article/Supplementary Material; further inquiries can be directed to the corresponding author.
Author contributions
CC: writing–original draft and writing–review and editing. LW: investigation and writing–review and editing. RZ: writing–review and editing. QK: writing–review and editing. QZ: writing–review and editing. DZ: writing–review and editing. JG: writing–review and editing. MC: writing–review and editing. HC: writing–review and editing. LL: writing–review and editing. KW: writing–review and editing. JH: writing–review and editing.
Funding
The author(s) declare that financial support was received for the research, authorship, and/or publication of this article. This research was funded by PetroChina Southwest Oil and Gas Field Company (grant number 20220303-04). The funder was not involved in the study design, collection, analysis, interpretation of data, the writing of this article, or the decision to submit it for publication.
Acknowledgments
The authors acknowledge the PetroChina Southwest Oil and Gas Field Company. The authors thank the reviewers and editors for their careful review of this manuscript.
Conflict of interest
Authors CC, LW, RZ, QK, QZ, DZ, JG, MC, HC, KW, and JH were employed by the Exploration and Development Research Institute of PetroChina Southwest Oil and Gas Field Company. Author LL was employed by the Development Department of PetroChina Southwest Oil and Gas Field Company.
Publisher’s note
All claims expressed in this article are solely those of the authors and do not necessarily represent those of their affiliated organizations, or those of the publisher, the editors, and the reviewers. Any product that may be evaluated in this article, or claim that may be made by its manufacturer, is not guaranteed or endorsed by the publisher.
References
Bi, B. (2021). Experimental study on fluid mobility evaluation of tight oil reservoirs in Jinghe Oilfield. China University of Petroleum, (Beijing, China).
Dong, M. Z., li, Y. J., Sang, X., Li, S., Li, M., and Sun, Y. L. (2019). Reservoir conditions and mechanism of shale oil flow. petroleum Nat. gas Geol. 40, 03.
Feng, Q. H., Xu, S. Q., and Xin, X. D. (2020). Advances and challenges in shale oil development: a critical review. Adv. Geo-Energy Res. 4, 04.
Ge, H. K., Chen, Y. K., Teng, W. W., Shen, Y. H., Liu, H. X., and Zhang, J. L. (2021). Discussion on micro production mechanism and EOR method of jimusar shale oil. Xinjiang Petroleum Nat. gas 17, 03.
Guo, Q. L., Wang, J., Chen, X. M., Chen, N. S., and Wu, X. Z. (2021). Evaluation method and application of shale oil original volume and movable oil volume. petroleum Nat. gas Geol. 42, 06.
Huang, F. Y. H., Zhang, J. Y., Zhang, S. C., He, K., Zhang, B., and Tian, H. (2023a). Characteristics of shale oil in different occurrence states of Cretaceous Qingshankou Formation in northern Songliao Basin. Acta Geol. Sin. 97, 02.
Huang, L. K., He, R., Yang, Z. Z., Tan, P., Chen, W. H., Li, X. G., et al. (2023b). Exploring hydraulic fracture behavior in glutenite formation with strong heterogeneity and variable lithology based on DEM simulation. Eng. Fract. Mech. 278, 109020. doi:10.1016/j.engfracmech.2022.109020
Huang, Z. K., Hao, Y. 1, and Li, S. (2020). Evaluation of hydrocarbon potential and shale oil mobility of shale series in Chang 7 member of Ordos Basin -- Taking well h317 as an example. Geol. China 47, 01.
Jiang, Q. G., Li, M. W., Ma, Y. Y., Cao, T. T., Liu, P., Qian, M. H., et al. (2018). Molecular geochemical evaluation method of shale oil mobility: a case study of shale oil in Jiyang depression. Pet. Exp. Geol. 40, 06.
Jiang, Z. X., Li, T. W., Gong, H. J., Jiang, T., Chang, J. Q., Ning, C. X., et al. (2020). Characteristics of low mature shale reservoir in Zhanhua sag and its influence on shale oil mobility. Acta petrol. Sin. 41, 12.
Jin, Z. J., Liang, X. P., Wang, X. J., Zhu, R. K., Zhang, Y. Y., Liu, G. P., et al. (2022). Shale oil enrichment mechanism and sweet spot optimization of Fengcheng Formation in Mahu depression. Xinjiang Pet. Geol. 43, 06.
Li, J. R., Yang, Z., and Wu, S. T. (2021). Key issues and development direction of petroleum geology research on source rock strata in China. Adv. Geo-Energy Res. 5, 02.
Liu, H. M. (2022a). Exploration practice and Prospect of shale oil in Jiyang depression. PetroChina Explor. 27, 01.
Liu, H. M., Bao, Y. S., Zhang, S. C., Li, Z., Li, J. L., Wang, X. J., et al. (2023). Structural characteristics and shale oil mobility of continental carbonate rich shale: a case study of Paleogene Shahejie Formation shale in Jiyang depression. petroleum Explor. Dev. 50, 06.
Liu, Q. Y., Li, P., Jin, Z. J., Sun, Y. W., Hu, G., Zhu, Y. D., et al. (2022). Organic matter rich formation and hydrocarbon enrichment of lacustrine shale series: a case study of Chang 7. Chin. Sci. Geosciences 52, 02.
Liu, Z. Y. (2022b). Occurrence and mobility evaluation of continental shale oil in Jurassic Daanzhai member of central Sichuan. Beijing, China: China University of Petroleum.
Ma, B. (2023). Study on the mobility of continental shale oil based on various methods -- a case study of the second member of the Kongdong shale in Cangdong depression.
Rui, S., Wei, X., Hang, Y., Zeng, X., Wang, G., and Shao, G. (2022). Study on fluid mobility in sandwich-type shale oil reservoir using two-dimensional nuclear magnetic resonance approaches. Energy Sources, Part A Recovery, Util. Environ. Eff. 44 (3), 5951–5967. doi:10.1080/15567036.2022.2094503
Sun, Z. L., Li, Z. J., Shen, B. J., Zhu, Q. M., and Li, C. X. (2022). Application of nuclear magnetic resonance technology in shale oil and gas reservoir evaluation. Pet. Exp. Geol. 44, 05.
Tan, P., Fu, S. H., Chen, Z. W., and Zhao, Q. (2023). Experimental investigation on fracture growth for integrated hydraulic fracturing in multiple gas bearing formations. Geoenergy Sci. Eng. 231, 212316. doi:10.1016/j.geoen.2023.212316
Tan, P., Jin, Y., and Pang, H. W. (2021). Hydraulic fracture vertical propagation behavior in transversely isotropic layered shale formation with transition zone using XFEM-based CZM method. Eng. Fract. Mech. 248, 107707. doi:10.1016/j.engfracmech.2021.107707
Tian, S. S. (2022). Microscopic characteristics of shale reservoir pores and evaluation of shale oil occurrence and mobility. China Univ. Petroleum (East China).
Wang, E., Li, C. R., Feng, Y., Song, Y. C., Guo, T. L., Li, M. W., et al. (2022b). Novel method for determining the oil moveable threshold and an innovative model for evaluating the oil content in shales. Energy 239, 121848. doi:10.1016/j.energy.2021.121848
Wang, J. M. (2021). Geological sweet spot evaluation of shale oil layer series of Lucaogou Formation in jimusar sag. East China: China University of Petroleum.
Wang, R. F., Qi, H. X., and Lv, X. H. (2014). Occurrence characteristics and control factors of mobile fluids in deep high pressure and low permeability sandstone reservoirs. Petroleum Geol. Exp. 36, 01.
Wang, X. N., Li, J. R., and Zhang, H. (2022a). Characteristics, current exploration practices, and prospects of continental shale oil in China. Adv. Geo-Energy Res. 6, 06.
Wang, Z. Q., Ge, H. K., Guo, H. Y., Zhou, H., and Zhang, Y. K. (2022c). Experimental study on mobility of jimusar shale oil under different temperature and pressure CO2 huff and puff in Junggar Basin. Pet. Exp. Geol. 44, 06.
Wen, J. C., Hu, Q. H., and Yang, S. Y. (2023). Shale reservoir characteristics and shale oil mobility evaluation of the second member of Kongdong formation in Cangdong sag, Bohai Bay Basin. special oil gas Reserv. 30, 04.
Yu, Z. Y., Zhang, X. W., and Tan, J. J. (2019). Study on the occurrence characteristics and mobility of shale oil in Biyang depression. petroleum Geol. Eng. 33, 01.
Zhu, X. M., Zhu, W. B., Cao, J., Song, Y., Zhang, D. M., Hu, S. Z., et al. (2019). Research Progress on shale oil mobility characterization methods. Xinjiang Pet. Geol. 40, 06.
Keywords: shale oil, low-field nuclear magnetic resonance, moveable oil, two-dimensional spectrum, thermal gravity
Citation: Cai C, Wang L, Zhang R, Kang Q, Zhang Q, Zhao D, Guo J, Chen M, Chen H, Lei L, Wang K and He J (2024) Two-dimensional spectrum characteristics and oil movability study of the shale oil reservoir. Front. Energy Res. 12:1389877. doi: 10.3389/fenrg.2024.1389877
Received: 22 February 2024; Accepted: 22 March 2024;
Published: 22 April 2024.
Edited by:
Peng Tan, CNPC Engineering Technology R&D Company Limited, ChinaReviewed by:
Jianbin Liu, Xi’an Shiyou University, ChinaHao Chen, China University of Petroleum, China
Copyright © 2024 Cai, Wang, Zhang, Kang, Zhang, Zhao, Guo, Chen, Chen, Lei, Wang and He. This is an open-access article distributed under the terms of the Creative Commons Attribution License (CC BY). The use, distribution or reproduction in other forums is permitted, provided the original author(s) and the copyright owner(s) are credited and that the original publication in this journal is cited, in accordance with accepted academic practice. No use, distribution or reproduction is permitted which does not comply with these terms.
*Correspondence: Li Wang, d2xpLTExMUBwZXRyb2NoaW5hLmNvbS5jbg==