 Chen Yang
 Li Lingyu2
 Chen Huixiang
95% of researchers rate our articles as excellent or good
Learn more about the work of our research integrity team to safeguard the quality of each article we publish.
Find out more
ORIGINAL RESEARCH article
Front. Energy Res. , 04 July 2024
Sec. Process and Energy Systems Engineering
Volume 12 - 2024 | https://doi.org/10.3389/fenrg.2024.1387837
This article is part of the Research Topic Optimal Design and Efficiency Improvement of Fluid Machinery and Systems: Volume III View all 7 articles
The efficiency of the pump device is an important parameter to judge the overall dynamic performance of the pumping station. The commonly used method at home and abroad is to carry out model tests of the pump device. The performance parameters of the prototype pump and pump device are obtained by the similarity conversion formula. However, at present, there are not many device model tests for large vertical submersible pumps. Taking a large vertical submersible mixed-flow pumping station in China as an example, research predicted the performance of the pump device through a model test and a submersible pump prototype test. The results show that the model test of the large vertical submersible mixed-flow pump device has a maximum efficiency of approximately 77.8%, and the prototype test conversion device has a maximum efficiency of approximately 80.33%. The device model test and the pump factory prototype test results are compared. It is found that the performance parameters of the pump measured by the prototype test are in good agreement with the device model test under the design conditions, and there is a certain error when the deviation from the design conditions is significant. The device model test and the factory test of the pump are indispensable in the large-scale road of submersible pumps, and a large number of tests are needed to sum up the experience.
A pump is a common type of fluid machinery used in various river basins for socio-economic development (Xu et al., 2022). Pumping stations are an important component of cross-basin water transfer projects, and pumps are the core component of pumping stations (Zhang H. et al., 2023; Jiao et al., 2023). The performance of the pumps directly determines the performance of the pumping stations, and how to evaluate the performance of pumps and pumping stations has always been an important research topic for experts and scholars. At present, the effectiveness evaluation of pumps and pumping stations is mainly based on two methods: computational fluid dynamics (CFD) numerical simulation and experiments (Peng et al., 2021; Han et al., 2022). Compared to numerical simulation, testing the effectiveness of pumps and pumping stations through experiments is more realistic and accurate. Therefore, it is currently more common to use experimental methods to determine the effectiveness of pumps and pumping stations (Xi et al., 2022; Zhang B. et al., 2023).
The vertical submersible pump is an integral pump unit. It has the characteristics of a compact pump unit structure, simple civil structure, convenient installation, and low operation noise (Guan, 2019). At present, there are few studies on high-power vertical submersible pumps. With the deepening of research on submersible motors and the gradual improvement of manufacturing level, the power, flow, and head of submersible pumps in water conservancy projects tend to be large-scale. The efficiency of the pump device (Lu et al., 2012; Li, 2022) is an important parameter to judge the overall dynamic performance of the pumping station. The pump device is composed of three parts: the inlet passage, the pump section, and the outlet passage (Liu, 2003). For drainage pumping stations or pumping stations with small pump sizes, some engineering construction personnel believe that efficiency is not an important consideration index, and in the actual unit operation process, efficiency and water flow stability are closely related (Chen, 2021). The flow of the whole flow channel of the large and medium-sized water pump device is complex, and its efficiency cannot be accurately determined by theory and design calculation (Liu and Li, 1993; Ge et al., 2006). However, there were difficulties and operational risks in establishing a test system in the pumping station to test the energy, cavitation, and hydraulic characteristics of the inlet and outlet channels of the prototype pump, and the test cost was high (Yuan, 2018). The method commonly used at home and abroad was to carry out the model test of the pump device, and the performance parameters of the prototype pump and the pump device were obtained by the similarity conversion formula (Zuo, 1984; Ge, 2006; Qin and Xu, 2022). Domestic scholars have carried out many studies (Xie et al., 2018; Zhu et al., 2019; Zhang and Tang, 2022) on the model test of vertical axial-flow pumps, vertical mixed-flow pumps, inclined shaft pumps, shaft tubular pumps, submersible tubular pumps, and other pump devices, and the pump device with excellent efficiency was beneficial to provide a reference for practical engineering (Yang et al., 2012; Zhang et al., 2022). The structural characteristics of the vertical submersible pump are suitable for the performance test of the pump. Still, the test of the inlet and outlet channels cannot be carried out (Xia et al., 2018; Lu et al., 2020).
At present, there are not many device model tests for vertical submersible pumps. For this reason, Chen (2022) conducted research on the hydraulic model and model test of large vertical submersible pumps and compared the differences and reasons between CFD calculation and device model test results. For the large-scale development of submersible pumps, Chen proposed a standardized vertical submersible pump section model test idea. On this basis, the device model test and pump prototype test results of the vertical submersible pump were further compared and analyzed in this paper, laying a good foundation and accumulated experience for the development of a large-scale vertical submersible pump. There is no series of hydraulic models for vertical submersible axial-flow pumps and submersible mixed-flow pumps in domestic research studies. The guide vane of the large vertical submersible pump must match the unit structure. The innovative aspect of this study is the proposal that its performance must be comprehensively predicted by the pump device model test and the pump factory prototype test.
The designed flow rate of a large vertical submersible pumping station is 66 m³/s, with six vertical submersible mixed-flow pump units. The flow rate of the single pump is 11.00 m³/s, the net head is 2.7–9.5 m, the diameter of the impeller is 1,870 mm, the pump rotating speed is 210 r/min, and the motor power is 1,250 kW. As shown in Figure 1, the structural characteristics of large vertical submersible pumps are significantly different from those of conventional vertical pumps. The volume of the submersible pump motor with direct drive or the size of the planetary gearbox with deceleration drive is larger than the inner cylinder of the guide vane of the conventional pump section hydraulic model. Therefore, under the constraints of selecting the target impeller and the given control size, the guide vane was re-matched to match the structure of the guide vane with the structure of the submersible pump. As shown in Figure 2, the pumping station adopts an elbow-shaped inlet conduit, and the pump is connected to a rectangular outlet conduit after the volute outlet.
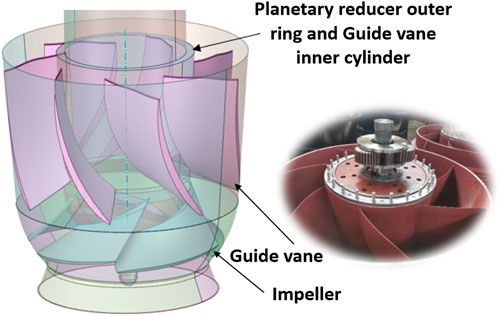
Figure 1. Structure of the vertical submersible pump.
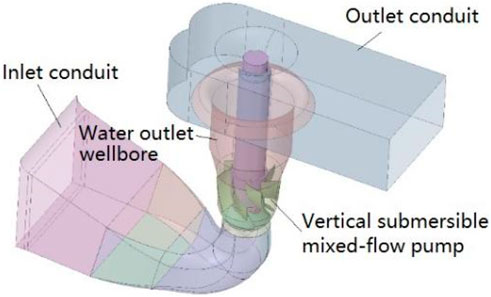
Figure 2. Water pump device diagram.
The pump device model test was carried out on the hydraulic test bench of Hohai University. Through this model test, the energy characteristics, cavitation characteristics, runaway characteristics, and pressure pulsation characteristics of the large-scale submersible mixed-flow pump device were mastered. The energy test measured the device’s performance with different blade placement angles and determined the relationship between the pump head, shaft power, efficiency, and flow rate. The critical cavitation margin corresponding to each different operating condition was measured by the cavitation test, and the cavitation curve was given. The runaway characteristic test measured the model pump’s runaway speed as the turbine’s working condition reversal. The pressure pulsation test measured the pressure pulsation values of different blade placement angles at the measuring point. The purpose of the model test is to ensure that the pump device can reach the design flow under the design head condition and that the unit can operate safely, stably, and efficiently in the whole operation interval. Meanwhile, the pump would not have harmful cavitation, and the runaway speed of the unit was within the safe range under the fault condition.
According to the similarity theory, the model test results were converted into the parameters of the prototype pump. The test was for the actual engineering application service. It was not revised because the efficiency was equal under similar working conditions.
In the formula,
hf —hydraulic loss of the conduit(m);
D—prototype pump impeller diameter (mm);
H—prototype pump device head(m);
HP—prototype pump head(m);
HM—model pump device head(m);
n—prototype pump rotating speed (r/min);
Q—prototype pump flow rate (m3/s);
QM—model pump flow rate (m3/s);
Pt—prototype pump shaft power (kW);
P1—input power of the prototype pump motor (kW);
PM—model pump shaft power (kW);
M—prototype pump torque (Nm);
U—voltage (V);
I—current (A).
The pump device model’s characteristic head energy performance curve is shown in Figure 3, and the test data are shown in Table 1.
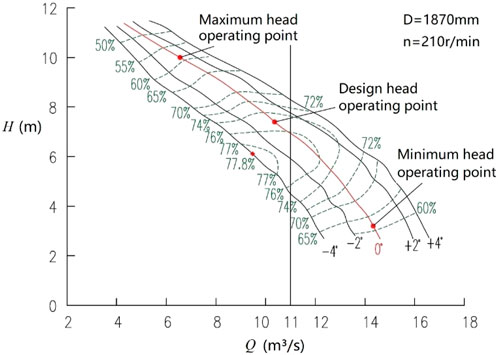
Figure 3. Model test conversion of the pump device performance curve for the prototype pump.
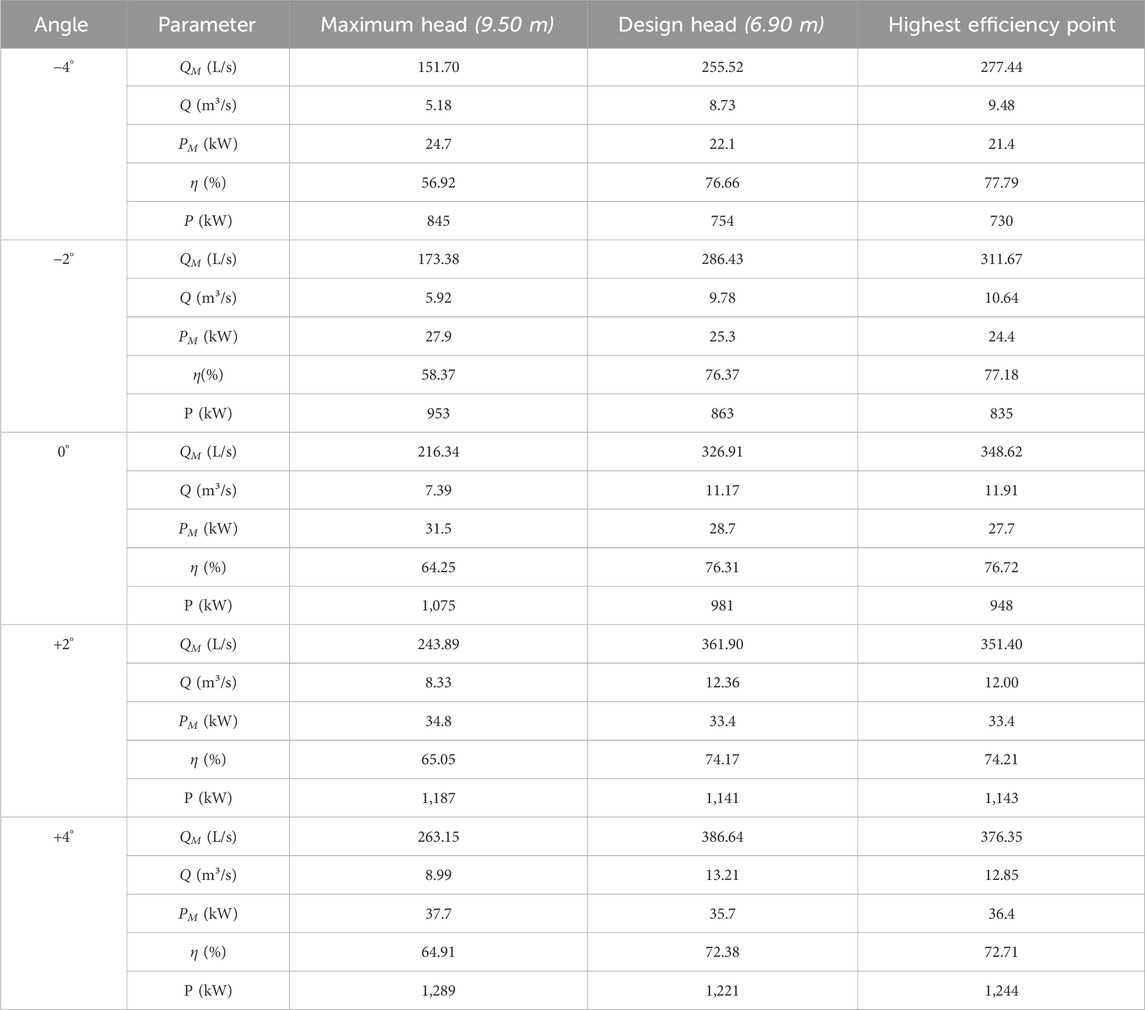
Table 1. Test model and prototype device characteristic head energy test data.
The energy test of the pump device model at five blade angles was carried out respectively. It can be seen from Table 1 that the maximum device efficiency of the model is 77.79%, the corresponding blade placement angle is −4°, the corresponding device head is 6.11 m, the model flow rate is 277.44 L/s, and the converted prototype flow rate is 9.48 m³/s. Under the design head of 6.90 m, the prototype flow meets the design flow of 11.08 m³/s, and the blade placement angles are 0°, +2°, and +4°. When the blade angle is 0°, the maximum shaft power of the highest head is 1,017 kW, the highest efficiency of the pump device is approximately 76.72%, the corresponding flow rate is 11.91 m³/s, and the device head is approximately 6.22 m.
The hydraulic performance test of the product before leaving the factory was carried out on the prototype test platform of the large submersible electric pump in the pump factory. The hydraulic performance parameters were measured by the reliability test (including head-flow rate curve, input power-flow rate curve, and pump efficiency-flow rate curve). The electromagnetic test device carried out air tightness, temperature rise, current, no-load, and load full performance tests on the submersible motor and drew the performance curve.
The data on the hydraulic characteristics of the pump are shown in Figure 4 and Table 2. The placement angle of the pump blade is the same as the 0° angle of the device model test. The maximum efficiency of the submersible pump is 86.99%, the corresponding pump head is 7.98 m, the flow rate is 11.59 m³/s, the active power of the motor is 1,042 kW, the load rate is 83%, and the efficiency of the unit (including the motor) is 80.78%. As the head decreases, the flow rate gradually increases, and the shaft power decreases.

Figure 4. Hydraulic performance curve of the pump factory prototype test.
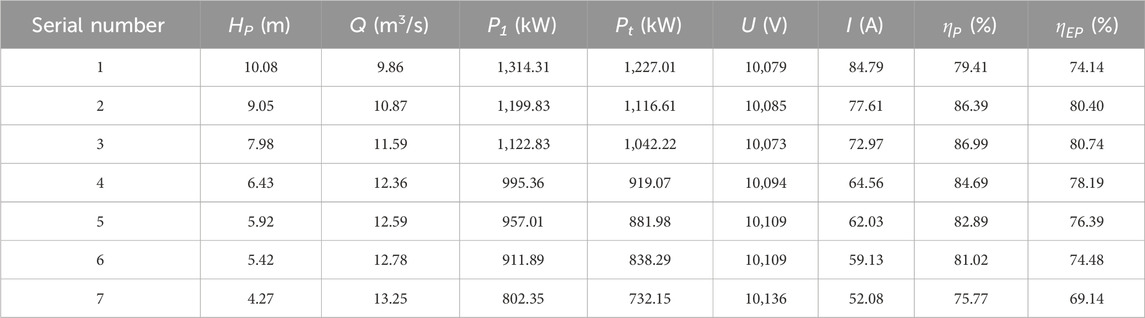
Table 2. Hydraulic performance data on the pump factory prototype test.
The pump device model test bench is a vertical, closed circulation system with a total capacity of 50 m3. The main equipment is composed of the tail water tank, pressure water tank, electromagnetic flowmeter, water supply pump (or auxiliary pump), electric gate valve, manual butterfly valve, and Φ500 pipeline. The pump device model includes an inlet flow channel, a guide vane, an impeller section, and an outlet flow channel. The impeller diameter of the model pump is 320 mm, and the flow channel size of the model pump is completely similar to that of the prototype pump. The flow measurement method is the pipeline electromagnetic flowmeter measurement. The main parameters of the test include pump head H, flow rate Q, torque M, and rotating speed n. The cross section of the circulating pipeline system of the test bench is shown in Figure 5.
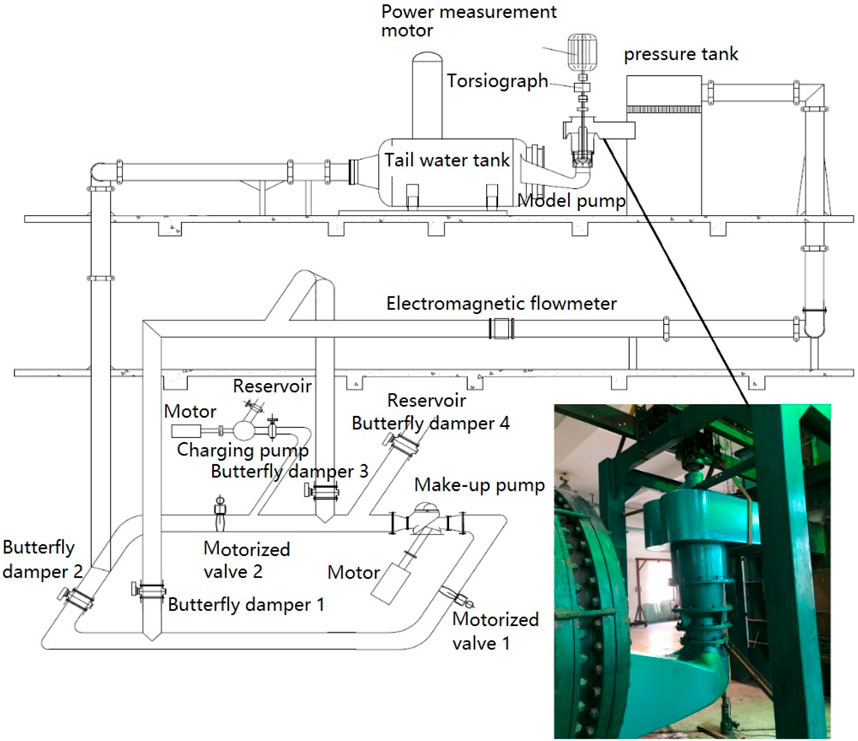
Figure 5. Model test bench and test bench circulation pipeline system.
The experimental uncertainty is divided into two parts: systematic uncertainty and random uncertainty.
5.1.1.2.1 System uncertainty (
The system uncertainty of efficiency in the model experiments can be calculated using the following equation:
where
According to the experimental equipment, the system uncertainty of the test bench is as follows:
System uncertainty in flow measurement:
The system uncertainty of the efficiency measurement in model experiments can be obtained from Equation 9:
5.1.1.2.2 Random uncertainty (
where
At the designed head of 6.64 m, when the blade placement angle is 0°, the pump device continuously collects and reads nine repeated test data, as shown in Table 3 below.
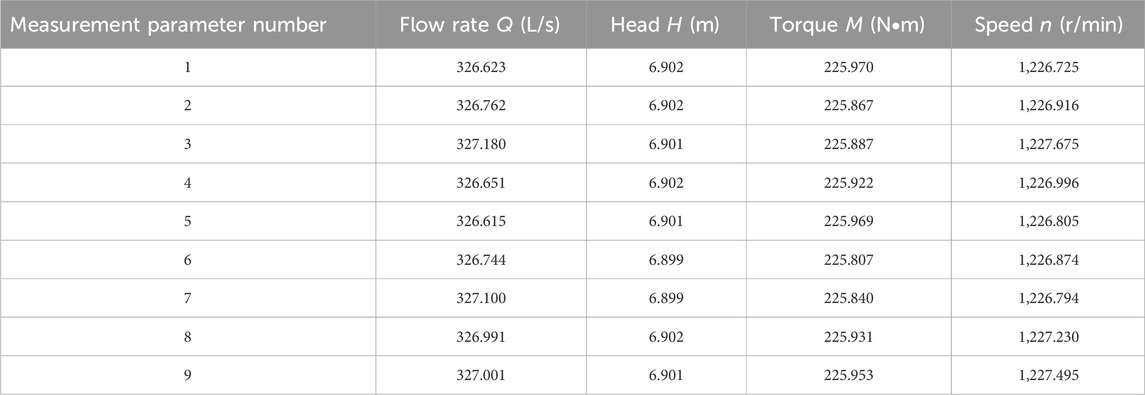
Table 3. Data for nine repeated trials.
The random uncertainty is represented by relative uncertainty (
where
tn−1 is the confidence coefficient, generally using a 95% confidence probability, can be calculated by looking up a table.
The random uncertainty of efficiency is expressed as follows:
where
The calculation results of standard deviation
5.1.1.2.3 Total uncertainty of efficiency (
where
According to Equation 13, the total uncertainty of the efficiency of the test can be calculated as
The test platform of a large submersible pump is an open test circulation system, as shown in Figure 6. The water storage volume of the large submersible pump test bench in a pumping plant is 6,000 m³, which is divided into 3,600 m³ of the lower pool and 2,400 m³ of the upper pool. The excavation depth is −11 m, and the water level is −7.5 m. The test device includes an upper and lower tank, a submersible pump, and an outlet open channel. The flow measurement method is a full-width weir measurement. It was verified by the National Industrial Pump Quality Supervision and Inspection Center that the test circuit and test system meet the first-level accuracy requirements of the GB/T 12785-2014 ‘Submersible Pump Test Method’ and GB/T 3216-2016 ′Rotary Power Pump Hydraulic Performance Acceptance Test Level 1, Level 2, and Level 3′ standards.
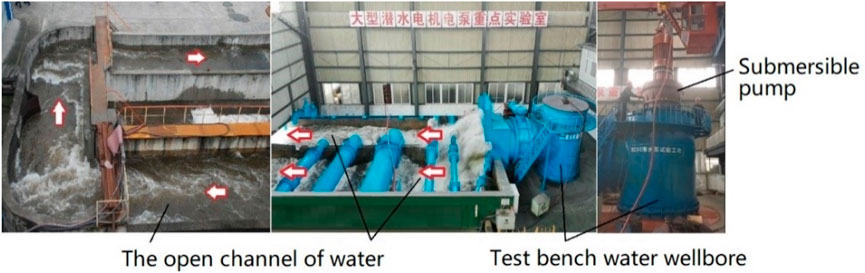
Figure 6. Submersible pump test bench.
The measurement of pump shaft power is an important basis for determining the performance parameters of the pump. The large vertical axial-flow pump and mixed-flow pump unit, whether for the device model test or the prototype test, requires that the shaft power measurement be only on the shaft or installed on the shaft end, and the shaft system cannot be disconnected. Therefore, the measurement methods of pump shaft power can usually be divided into torque dynamometer and electrical dynamometer (Wu et al., 2012; Xie et al., 2012). The pump shaft of the model pump is usually extended out of the flow channel to connect the prime mover, and the torque dynamometer method is generally used. The torque and speed of the prime mover are measured by an intelligent torque and speed sensor torque meter to obtain the pump shaft power. Due to the compact connection inside the submersible pump motor shaft, the torque meter is not easy to install on the test system. It is feasible to adopt the electric dynamometer method, but the shaft power measurement of the pump is determined by the input power of the motor with known efficiency. In the GB/T12785-2014 ‘Submersible Electric Pump Test Method” (The state bureau of technical supervision, 2014), the pump shaft power Pt and motor efficiency ηm are calculated by the loss analysis method according to formulas 14 and 15.
In the formula,
Pt is the prototype pump shaft power (kW);
P1 is the input power of the prototype pump motor (kW);
ηm is the motor efficiency (%);
Pcu1 is the actual loss of the motor stator (at the test temperature) (kW);
Pcu2 is the actual loss of the motor rotor (at the test temperature) (kW);
PFe is the iron loss of the motor (kW);
Pfw is the mechanical loss of the motor (kW);
Ps is the motor load stray loss (kW).
The motor mechanical loss Pfw and iron loss PFe are obtained by the no-load test, and the motor load stray loss Ps is selected according to the recommended value table of the power level and bearing type. Therefore, 'known efficiency' ηm is an approximate estimation. The shaft power measured by the electrical dynamometer method is approximately estimated with a certain measurement deviation. The pump shaft power measured by the torque dynamometer method used in the device model test is more accurate. However, the speed of the pump has an effect on the mechanical efficiency, so when the speed difference is large, the calculation of the power value also has an error.
The different error analyses were required for the results of the two experiments before performance conversion. According to the relevant specifications, the measurement uncertainty of pump efficiency is used as the evaluation result of the measurement uncertainty of the test system. The total uncertainty of the model test of the device efficiency is ± 0.272%. The total uncertainty of the prototype test efficiency is ± 0.337%. According to the model test of the device, when the blade angle is 0° and the flow rate is 11 m³/s, the loss of the inlet and outlet flow channel is approximately 0.65 m, and the efficiency of the device flow channel is about 91%. Combined with the hydraulic loss characteristics of the flow channel and the energy characteristic data on the pump prototype test, the energy characteristic parameters of the pump device (including the flow conduit) tested by the “ideal state” prototype pump were estimated, as shown in table 4 below, and the conversion curve was compared with the test results of the device model.
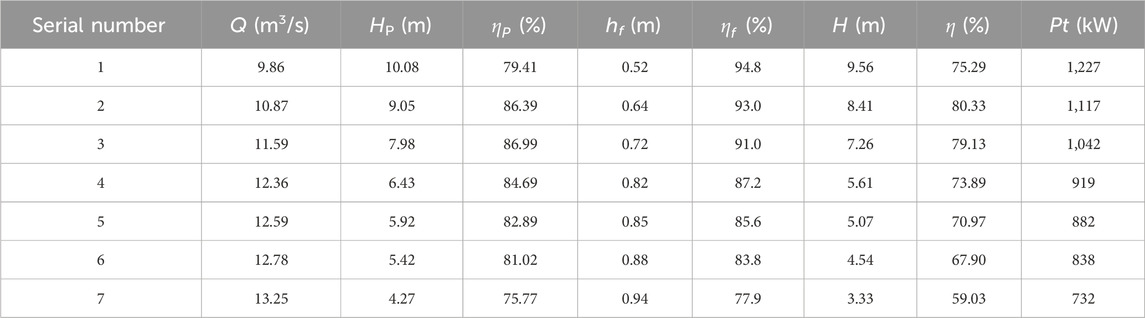
Table 4. Energy characteristic data conversion of the prototype test energy characteristic parameter of the prototype device.
As shown in Figure 7, for the performance of the prototype device at the characteristic operating point, the conversion results of the device using the model test were compared with the results converted into the device after the prototype test of the submersible pump. The predicted flow, head, efficiency, and power trends are consistent. The maximum efficiency of the device converted after the prototype test is approximately 80.33%, the corresponding flow rate is 10.87 m³/s, and the device head is approximately 8.41 m.
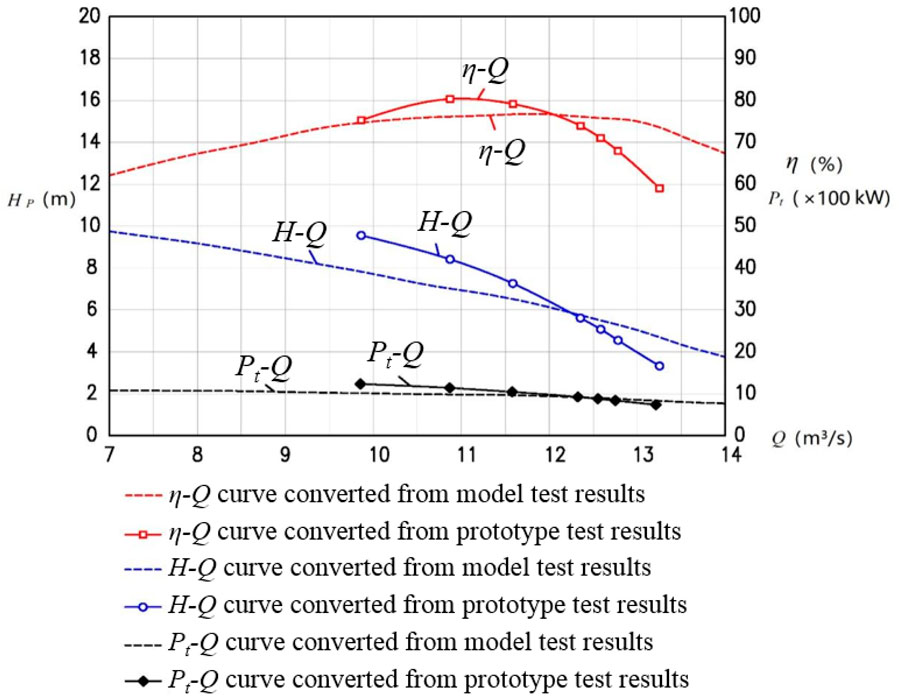
Figure 7. Performance comparison of the model test and prototype test converted to the prototype device.
When the device head is 6.90 m, the flow rate of the model test converted to the prototype is 11.07 m³/s, the device efficiency is approximately 76.23%, and the shaft power is approximately 983 kW. The test flow rate of the pump is 11.77 m³/s, the conversion device efficiency is approximately 78.31%, and the shaft power is approximately 1,017 kW. The conversion result of the prototype test is approximately 0.7 m³/s larger than that of the device model test to the prototype, and the device efficiency is approximately 2.08% higher.
When the device head is 9.50 m, the flow rate of the model test converted to the prototype is 7.44 m³/s, the device efficiency is approximately 64.54%, and the shaft power is approximately 1,074 kW. The test flow rate of the pump is 9.92 m³/s, the conversion device efficiency is approximately 75.68%, and the shaft power is approximately 1222 kW. The conversion result of the prototype test is approximately 2.48 m³/s larger than that of the device model test to the prototype, and the device efficiency is approximately 11.14% higher.
On the whole, the performance of the device converted after the prototype test is steeper than the flow head Q–H curve converted from the device model test to the prototype; in other words, the flow rate changes little with the change of the head. The performance of the device converted after the test of the prototype pump is steeper than the Q–P curve of the flow shaft power converted to the prototype by the device model test, which is also caused by the rapid change of the head. The performance of the device converted after the prototype test is in good agreement with the performance parameters predicted by the device model test conversion at the design condition point, and there is a certain error when the deviation from the design condition is large. This is mainly because the test wellbore of the prototype test bench is larger than the actual device wellbore diameter in order to adapt to different sizes of test pumps. After the water flow diffuses through the submersible pump guide vane body, the water flow in the guide vane outlet area appears as a low-speed backflow, which has different degrees of influence on the flow capacity of the guide vane outlet area. In addition, the difference between the open and closed types also reflects the difference in the test results. Under the maximum head, there is a certain deviation between the maximum shaft power of 1,222 kW in the prototype test and the maximum shaft power of 1,017 kW in the device model test. Because of the error of flow and head, at the same time, the device model test compared with the prototype test did not consider the influence of the reducer on the performance.
The flow rate corresponding to the designed head in the pump prototype test is larger than the design flow rate of 11 m³/s. Therefore, after the test, the angle of the pump blade is adjusted from 0° to −2 °during the actual operation of the pump to ensure that the motor is not overloaded.
(1) There is no series of hydraulic models for vertical submersible axial-flow pumps and submersible mixed-flow pumps in domestic research. The guide vane of the large vertical submersible pump must match the unit structure, and its performance must be comprehensively predicted by the device model test and the factory prototype test. The device model test can make up for the unadjustable singleness of the blade angle of the prototype test and can also test the matching of the flow channel. The prototype test can make up for the shortcomings of the device model test, which cannot test the performance of the submersible motor and the influence of the reducer on the performance. Both of them are indispensable in the large-scale road of submersible pumps, and several tests are needed to sum up the experience.
(2) The performance of a large vertical submersible pump at 0° blade angle was studied and tested. When the head of the pump device is 6.90 m, for the pump device model test, the flow rate is 11.07 m ³/s, the efficiency is approximately 76.23%, and the shaft power is approximately 983 kW. When the head of the pump device is 6.90 m, for the pump prototype test, the flow rate is 11.77 m³/s, the conversion device efficiency is approximately 78.31%, and the shaft power is approximately 1,017 kW. When the head of the pump device is 9.50 m, for the pump device model test, the flow rate is 7.44 m³/s, the efficiency is approximately 64.54%, and the shaft power is approximately 1,074 kW. When the head of the pump device is 9.50 m, for the pump prototype test, the flow rate is 9.92 m³/s, the conversion device efficiency is approximately 75.68%, and the shaft power is approximately 1,222 kW.
(3) The device model test of a large vertical submersible pump can test and convert the performance of pumps with different blade placement angles as a reference for actual machine manufacturing, installation, testing, and adjustment. When the vertical submersible pump is large-scale, the economy and the capacitance compensation problem at a low load rate should be considered. The power reserve coefficient of the supporting motor is no longer as large as that of the small and medium-sized submersible pump. To compensate for the shortcomings of the model test, the pump factory prototype test is indispensable.
(4) The pump factory prototype test of large vertical submersible pumps not only predicts the hydraulic performance of the submersible pumps but also comprehensively tests the performance of the submersible motor. Therefore, the submersible pump factory prototype test is also a guarantee to ensure that the motor is not overloaded.
The original contributions presented in the study are included in the article/supplementary material; further inquiries can be directed to the corresponding author.
CY: formal analysis, supervision, validation, writing–original draft, and writing–review and editing. LL: writing–original draft and writing–review and editing. CH: supervision, validation, and writing–review and editing. SD: writing–review and editing.
The author(s) declare that no financial support was received for the research, authorship, and/or publication of this article.
Author CY was employed by Design and Research Co., Ltd. Author LL was employed by Shanghai Shangzi Engineering Design Co., Ltd.
The remaining authors declare that the research was conducted in the absence of any commercial or financial relationships that could be construed as a potential conflict of interest.
All claims expressed in this article are solely those of the authors and do not necessarily represent those of their affiliated organizations, or those of the publisher, the editors, and the reviewers. Any product that may be evaluated in this article, or claim that may be made by its manufacturer, is not guaranteed or endorsed by the publisher.
Chen, Y. (2021). Treatment and technical analysis of vibration in dustpan-type inlet of pumping station. Water Resour. Power 39 (11), 187–190. doi:10.20040/j.cnki.1000-7709.2021.11.0187
Chen, Y. (2022). Research on the hydraulic model and model test of large vertical submersible pump. China Rural Water Hydropower (06), 181–186.
Ge, Q. (2006) Study on water conservancy characteristic conversion for low-lift pumping station and performance prediction. Dissertation. Nanjing (Jiangsu). Hohai University. doi:10.7666/dy1031351
Ge, Q., Chen, S. S., Yan, D. F., and Li, Y. Y. (2006). Experimental study and numeric simulation of the passages losses in a low-lift pump set. China Rural Water Hydropower (12), 70–72+75. (in Chinese). doi:10.3969/j.issn.1007-2284.2006.12.023
Guan, X. F. (2019) Manual for selection of large and medium low head pumps [M]. Beijing: Mechanical Industry Press, 5.
Han, W., Nan, H. Z., Ju, P. P., Zhang, H., Li, F., and Li, R. (2022). Effect of the maximum thickness of a composite airfoil on the performance of a helical axial-flow gas–liquid multiphase pump. Front. Energy Res. 10, 993974. doi:10.3389/fenrg.2022.993974
Jiao, W., Chen, H. J., Cheng, L., Zhang, B., and Gu, Y. (2023). Energy loss and pressure fluctuation characteristics of coastal two-way channel pumping stations under the ultra-low head condition. Energy 278, 127953. doi:10.1016/j.energy.2023.127953
Li, L. Y. (2022). Pump selection of ultra-low head and large flow tubular pumping station. J. Drainage Irrigation Mach. Eng. 40 (04), 353–358. (in Chinese). doi:10.3969/j.issn.1674-8530.21.0348
Liu, C. (2003). Hydraulic performance assess target research of low-head pump equipment in south-north water transfer project. Drainage Irrigation Mach. 21 (6), 2–5. (in Chinese)). doi:10.3969/j.issn.1674-8530.2003.06.002
Liu, X. T., and Li, W. P. (1993) Hydraulic unit field test manual. Beijing: Water Resources and Electric Power Press.
Lu, W. G., Sun, C. G., Xia, H., Shen, Y., and Xu, B. (2020). Comprehensive performance analysis of the shaft tubular pump unit in Tonglv Canal pumping station. J. Yangzhou Univ. Nat. Sci. Ed. 23 (06), 59–64. doi:10.19411/j.1007-824x.2020.06.011
Lu, W. G., Yan, D. F., and Zhen, F. (2012). Efficiency scaling method for pumps and their systems. J. Drainage Irrigation Mach. Eng. 30 (06), 677–682+689. (in Chinese). doi:10.3969/j.issn.1674-8530.2012.06.012
Peng, G., Du, J., Chang, H., Chen, Q., Li, J., Pan, C., et al. (2021). Numerical and experimental analysis of influence of impeller structures on slurry pump performance. Front. Energy Res. 9, 762159. doi:10.3389/fenrg.2021.762159
Qin, Z. J., and Xu, L. (2022). Experimental research on the hydraulic performance of the pump system model for zhuji pumping station in yangtze-to-huaihe water diversion project. China Rural Water Hydropower (01), 111–117. doi:10.3969/j.issn.1007-2284.2022.01.018
The state bureau of technical supervision (2014) GB/T12785-2014 Test method of submersible motor-pumps. Beijing: Standards Press of China.
Wu, Z. Y., Su, Y. S., and Ming, T. T. (2012). Shaft power measurement method of waterjet based on the type of resistance strain and wireless remote measuring. Mach. Electron. (12), 46–49. (in Chinese). doi:10.3969/j.issn.1001-2257.2012.12.013
Xi, W., Lu, W., Wang, C., and Fu, G. (2022). Numerical and experimental study on the opening angle of the double-stage flap valves in pumping stations. Front. Energy Res. 10, 866044. doi:10.3389/fenrg.2022.866044
Xia, C. Z., Cheng, L., Jiang, H. Y., and Xin, J. (2018). Hydraulic performance analysis and optimization on flow passage components of diving tubular pumping system. Trans. Chin. Soc. Agric. Eng. 34 (07), 45–51+301. (in Chinese). doi:10.11975/j.issn.1002-6819.2018.07.006
Xie, C. L., Tang, F. P., Sun, D. D., Zhang, W., Xia, Y., and Duan, X. X. (2018). Model experimental analysis of pressure pulsation in vertical mixed-flow pump system. J. Jilin Univ. Eng. Technol. Ed. 48 (04), 1114–1123. doi:10.13229/j.cnki.jdxbgxb20170216
Xie, R., Ma, T. H., Wu, Y. Y., and Jin, H. (2012). Study on embedded capacitive grating sensing technology and shaft power testing. Chin. J. Sci. Instrum. 33 (04), 844–849. (in Chinese). doi:10.3969/j.issn.0254-3087.2012.04.019
Xu, L., Zhang, H. C., Wang, C., Ji, D., Shi, W., Lu, W., et al. (2022). Hydraulic characteristics of axial flow pump device with different guide vane inlet angles. Front. Energy Res. 10, 836456. doi:10.3389/fenrg.2022.836456
Yang, F., Liu, C., Tang, F. P., and Zhou, J. R. (2012). Numerical simulation on the hydraulic performance and model test of slanted axial pumping system. J. Mech. Eng. 48 (18), 152–159. doi:10.3901/JME.2012.18.152
Yuan, C. (2018) Study on optimization design and model test of pumping device of paihekou pumping station. Master’s thesis. Yangzhou (Jiangsu). Yangzhou University.
Zhang, B., Cheng, L., Jiao, W., and Zhang, D. (2023b). Experimental and statistical analysis of the flap gate energy loss and pressure fluctuation spatiotemporal characteristics of a mixed-flow pump device. Energy 272, 127117. doi:10.1016/j.energy.2023.127117
Zhang, H., Liu, J., Wu, J., Jiao, W., Cheng, L., and Yuan, M. (2023a). Research on optimization of the bulb form of the bulb tubular pump device for a low-head agricultural irrigation pumping station. Agriculture 13 (9), 1698. doi:10.3390/agriculture13091698
Zhang, X. W., and Tang, F. P. (2022). Investigation on hydrodynamic characteristics of coastal axial flow pump system model under full working condition of forward rotation based on experiment and CFD method. Ocean. Eng. 253, 111286. doi:10.1016/j.oceaneng.2022.111286
Zhang, X. W., Tang, F. P., Chen, Y. T., Huang, C., Wang, L., et al. (2022). Experimental study on the internal pressure pulsation characteristics of a bidirectional axial flow pump operating in forward and reverse directions. Machines 10 (3), 167. doi:10.3390/machines10030167
Zhu, H. G., Bo, G., Zhou, Y. B., Zhang, R., and Cheng, J. (2019). Performance prediction of pump and pumping system based on combination of numerical simulation and non-full passage model test. J. Braz. Soc. Mech. Sci. Eng. 41 (9), 376. doi:10.1007/s40430-019-1874-9
Keywords: vertical submerged pump, model test, prototype test, efficiency, shaft power
Citation: Yang C, Lingyu L, Huixiang C and Dan S (2024) Test and analysis of energy characteristics of large vertical submersible pumps. Front. Energy Res. 12:1387837. doi: 10.3389/fenrg.2024.1387837
Received: 18 February 2024; Accepted: 30 May 2024;
Published: 04 July 2024.
Edited by:
Yang Yang, Yangzhou University, ChinaReviewed by:
Weixuan Jiao, Yangzhou University, ChinaCopyright © 2024 Yang, Lingyu, Huixiang and Dan. This is an open-access article distributed under the terms of the Creative Commons Attribution License (CC BY). The use, distribution or reproduction in other forums is permitted, provided the original author(s) and the copyright owner(s) are credited and that the original publication in this journal is cited, in accordance with accepted academic practice. No use, distribution or reproduction is permitted which does not comply with these terms.
*Correspondence: Chen Yang, Y2hlbnNwb25nZUAxNjMuY29t
Disclaimer: All claims expressed in this article are solely those of the authors and do not necessarily represent those of their affiliated organizations, or those of the publisher, the editors and the reviewers. Any product that may be evaluated in this article or claim that may be made by its manufacturer is not guaranteed or endorsed by the publisher.
Research integrity at Frontiers
Learn more about the work of our research integrity team to safeguard the quality of each article we publish.