 Yan Li1
 Xingjian Zhao
 Tao Xu
- 1State Grid Intelligence Technology Co., Ltd., Jinan, China
- 2School of Control Science and Engineering, Shandong University, Jinan, China
The fluctuations in power output from distributed power sources are rapid and dramatic, causing voltage fluctuations in the distribution network that threaten the safety of electricity consumption. Soft open points (SOPs) can replace traditional contact switches and are expected to suppress voltage fluctuations. However, traditional power regulation methods based on the reference values are unable to address rapid and large voltage fluctuations. Therefore, this paper proposes an adaptive power control method for SOPs based on virtual impedance. The SOP is modeled as a series link of adjustable impedance and a voltage source. Then, the voltage difference component is used to calculate the reference for the DQ domain to regulate the power flow in real time automatically. By doing so, the proposed method can smooth the voltage fluctuations in the distribution network. Additionally, the virtual impedance is also optimized to minimize the power loss. Finally, the method is validated through simulation and experiments, demonstrating that this method can automatically regulate power and significantly reduce voltage fluctuations.
1 Introduction
At present, wind power and solar power are representatives of the rapid development of distributed generation (DG) and have several points of access to the distribution network to help realize the effective measures for the carbon peak and neutrality targets. However, the large and rapid fluctuations in the output of DG lead to rapid and drastic voltage fluctuations in the distribution network, which seriously threatens the safety of electricity consumption (Bloemink and Green, 2013; Ren, 2021).
In order to realize effective control of rapid power and voltage fluctuations, a variety of new power electronic devices represented by soft open points (SOPs) have been rapidly developed and widely used in the optimized operation and scheduling of active distribution networks and have achieved good results. An SOP is an emerging piece of power electronic equipment, and it can replace the tie switch in the traditional distribution network. SOPs can significantly enhance the traditional distribution network’s connection situation, expanding its operational capabilities beyond simple on and off states. Moreover, SOPs can also improve the traditional contact switch work casting process that leads to power failure and closing impact situation (Yang Huan, 2018). By placing the SOP in the distribution network, power mutualization between different feeders is realized, while the disadvantage of the lack of isolation between feeders is eliminated (Bloemink and Green, 2010; Wang, 2017). Its connection in the distribution network is shown in Figure 1.
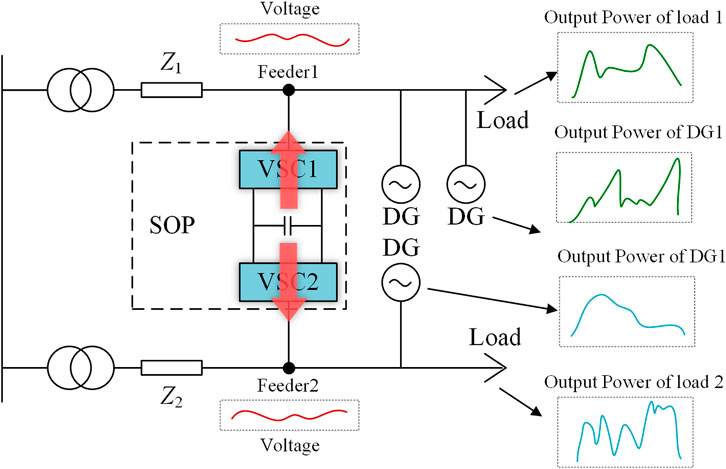
Figure 1. Simplified schematic diagram of the distribution network with SOPs.
DG is the distributed power source connected to the distribution grid, and Z1 and Z2 are the line impedance of the distribution grid. The distribution grid above the SOP is defined as the feeder 1 system, and the distribution grid below the SOP is defined as the feeder 2 system. As shown in Figure 1, the power fluctuations of the load and the DG cause the voltage on feeder 1 and feeder 2 to fluctuate.
At present, many experts and scholars have paid attention to the research and application of the SOP, and its topology has been more mature, but research on its control strategy is still in its infancy. Wang et al. (2015) provided a detailed introduction to the basic functions and principles of a SOP and compared three topological models of SOPs, proving that the topology of the back-to-back voltage source converter has a greater advantage. Shen et al. (2012) and Xiong et al. (2020) provided a detailed introduction of the operation principle of the back-to-back voltage source converter and the PQ-VdcQ control strategy. Aithal et al. (2016) and Dong et al. (2018) provided a detailed analysis of the operation modes and basic control strategies of a SOP. Li et al. (2019), Meng et al. (2019), Zhang et al. (2020), and Liu et al. (2022) optimized distribution networks containing multi-port flexible switches to achieve the regulation of active and reactive power. Related studies have shown that an SOP can effectively improve the power quality of distribution networks and optimize the system current. However, the traditional control strategy cannot realize the automatic regulation of the system current.
Based on the above research, this paper proposes an adaptive power control method to realize the adaptive regulation of SOPs to a distribution network. The method equates the SOP as a link with impedance in the series with the voltage source. It takes the voltage difference at the feeder end as the input to the control loop and adjusts the value of the equivalent impedance through the feedback link. The virtual impedance is also optimized to minimize the power loss. This method enables automatic control of system currents and node voltages without adding additional controllers. Finally, the effectiveness of the proposed method is verified by MATLAB/Simulink simulation and the built experimental platform.
2 Structure and working mode of SOPs
SOPs are mainly composed of fully controlled power electronics, and their common topology is a back-to-back voltage source converter, which is characterized by connecting two converters back-to-back using a capacitor (Li et al., 2013; Chengshan et al., 2022; Xie et al., 2024), as shown in Figure 2.
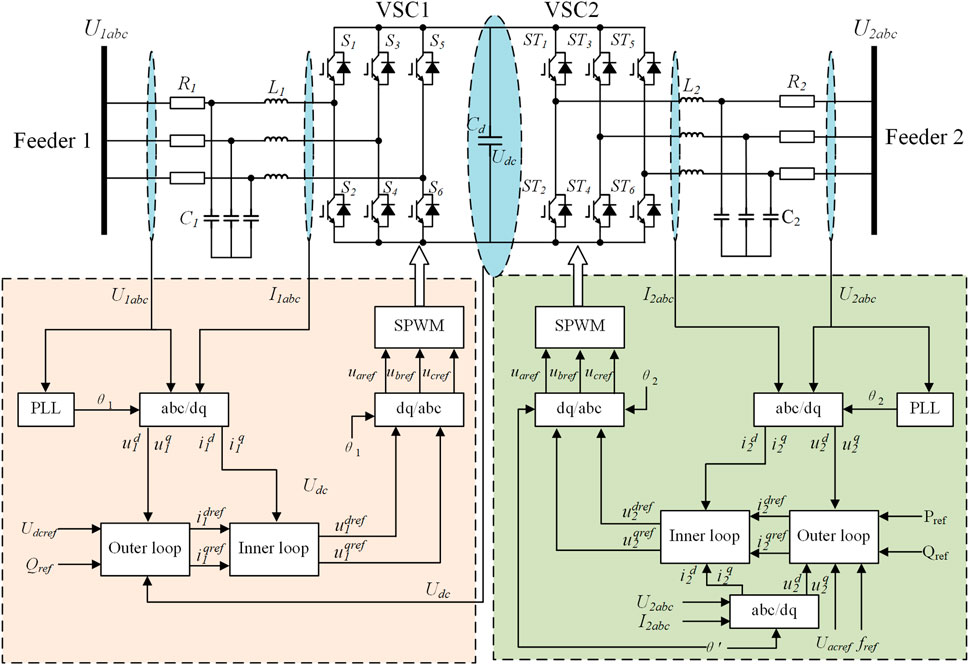
Figure 2. Topology diagram of the back-to-back SOP.
Due to its special structure and function, the SOP needs to maintain the stability of the DC chain voltage during operation, so the voltage source converter on one side of it needs to work in the rectifier mode. As shown in Figure 2, the converter on feeder 1 operates in the rectified state. This feeder mainly maintains the stability of the DC voltage. First, the acquired AC voltage and AC current signals are converted by abc/dq to the output DC signals u1,2d,q and i1,2d,q under the dq axis. Then, u1,2d,q and the reference signals Udcref and Qref are input to the PI controller of the outer loop, and i1,2d,q are input to the PI controller of the inner loop. Finally, after the dq/abc conversion and SPWM link, it can realize the control of DC voltage. The converter on feeder 2 operates in the inverter state. This feeder is mainly used to realize the regulation of power flow. The input signals for its control link are the active power reference value Pref and the reactive power reference value Qref. Its specific control strategies are adjusted according to the current operating status of the distribution network, mainly VdcQ-PQ control for power regulation and VdcQ-Vacf control for maintaining load voltage stabilization (Wang et al., 2015; Wang et al., 2016).
The control strategy mentioned in the previous section is capable of realizing the regulation of power flow and uninterrupted power supply under the fault condition according to the input signals. However, it has the following shortcomings: (1) it needs to get the actual power consumed by the load and the power supplied by the DG in advance. (2) The reference value of active power Pref cannot be automatically adjusted according to the actual load power. It needs to be calculated and artificially input to the control link, resulting in a waste of human resources. Due to the above shortcomings, the traditional control method cannot achieve real-time, automatic control. In particular, in the case of several new energy sources with a high proportion of new energy, it is difficult to realize real-time adaptive regulation, following the rapid and drastic power and voltage changes.
3 Power adaptive regulation strategy based on virtual impedance
At the distribution network, the loads and DG connected to different feeders are not equal, so the voltage at the end of the loads in different feeders and different locations are not equal, which makes the operating voltage of the user loads fluctuate with the distribution network. The distribution system connected through an SOP is able to regulate the power flow by adjusting the control strategy, which, in turn, affects the voltage at the load terminals on both sides (Zhang et al., 2021; Wang et al., 2016). However, as mentioned earlier, the traditional control strategies do not realize adaptive regulation.
3.1 Operation criteria
When the transformer ratios and capacities accessed on both sides of the distribution network are the same and SOPs are accessed on both sides of the distribution network at similar locations, then, the ideal operation state is the same voltage at the access points on both sides. Therefore, SOPs can be equipotential virtual impedance link representations and can be adjusted through the virtual impedance value to change the voltage difference between the two sides to realize the power transfer. The 1-side system and the 2-side system do not change due to the change of impedance; only the voltage of node 1 and node 2 changes. Therefore, node 1 and node 2 can be considered two AC sources and represented as phase quantities, as shown in Figure 3. Here, U1 and U2 denote the RMS values of the AC voltages on both sides, δ denotes the phase difference between the AC voltages on both sides, and θ denotes the impedance angle of the equivalent impedance.
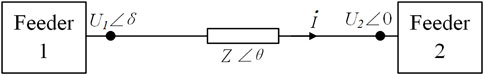
Figure 3. SOP is equivalent to impedance.
In the PLL link, when the d-axis is used as the directional axis, as shown in Figures 3, 4, the phase difference is constant Δ when the dq-axis is rotating with the reference synthesized vector Vδ at a synchronous rotational speed ω. To achieve Δ = 0, it is necessary to satisfy that the d-axis is coincident with the reference synthesized vector Vδ, at which time, there is Vd = Vδ, Vq = 0. When the d-axis is used as the directional axis, the active power is positively correlated with the d-axis component and the voltage magnitude. The q-axis is related to the reactive power and the voltage phase difference. Similarly, when the q-axis is the directional axis, the q-axis represents the active power and the d-axis represents the reactive power.
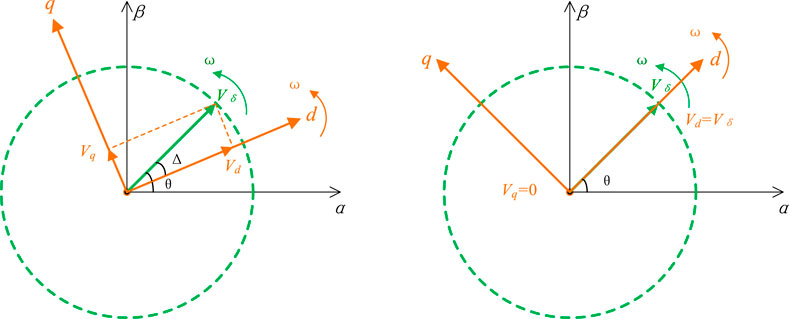
Figure 4. Schematic diagram of the dq coordinate system.
According to the basic principles of the power system, in the high-voltage transmission lines, the line reactance value is much larger than the resistance value, and the resistance value can be regarded as zero. Then, the voltage amplitude is related to the reactive power, and the voltage phase is related to the active power. In the low-voltage distribution network, the line resistance value is greater than the reactance value, and the reactance value can be regarded as zero, that is, when the line is resistive, the voltage amplitude and active power, voltage phase, and reactive power. Therefore, in the low-voltage distribution network, when the d-axis is the directional axis, the d-axis component is related to the voltage magnitude.
In summary, the dq-axis component in the rotating coordinate system obtained based on the Park transform realizes that the sinusoidal quantity of AC can be changed into DC signal for comparison, and it can reflect the change in the voltage in real time, which is very suitable to be used as the input signal of the control loop. Moreover, because of the DC state, it can be controlled by the PI controller. Therefore, the AC voltage on both sides can be changed into DC flow in the DQ domain by the Park transformation, and then, the difference of DC flow can be carried out for negative feedback control.
Therefore, the active power is mainly related to the voltage magnitude, and the reactive power is mainly related to the voltage phase angle difference. The current flowing through the equivalent impedance link at this time is expressed as follows:
where Δu denotes the voltage difference between feeder 1 and feeder 2, R denotes the resistance value of the virtual impedance, and L denotes the inductance value of the virtual impedance.
Using PLL and Park transformation, the AC volume is converted to a direct flow in the dq coordinate system, which can be obtained as follows:
Furthermore, it can be expressed in the frequency domain as follows:
Since the d-axis component in the DQ domain is positively correlated with the amplitude of the sinusoidal AC voltage (Kupzog et al., 2007), the d-axis component is used as the input signal for the power control. The virtual impedance control link is obtained according to Equation 5, as shown in the dashed box of Figure 5, and the overall control strategy of the node virtual impedance-based power control is shown in Figure 5.
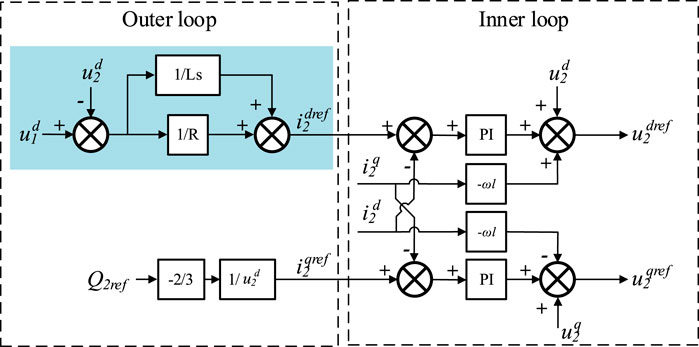
Figure 5. Control block diagram based on virtual impedance when the SOP is equivalent to impedance.
3.2 The control strategy of SOPs based on virtual impedance and virtual power supply
When the transformer ratios accessed on both sides of the distribution network are different, or when the positions of node 1 and node 2 of SOPs accessed to the distribution network differ greatly relative to the loads and DGs, the load terminal voltages on both sides should be different in the ideal case. In this case, the SOP in Figure 3 can be represented by a link of impedance series voltage source, where Z denotes the impedance, as shown in Figure 6.
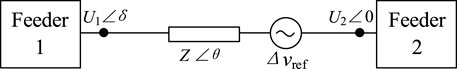
Figure 6. SOP is equivalent to a series connection of impedance and voltage source.
The voltage difference between the two sides can be expressed as follows:
The current flowing through the SOP at this time is expressed as follows:
Using PLL and Park's transformation, the AC volume is converted to a direct flow in the dq coordinate system, which can be obtained:
Further, it can be expressed in the frequency domain as:
Again, using the d-axis voltage component under the DQ domain as the input signal, the corresponding control block diagram shown in Figure 7 can be obtained from Equation 9, as shown below:
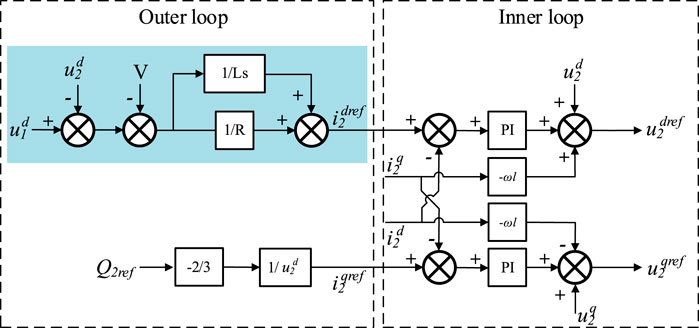
Figure 7. Control block diagram when the SOP is equivalent to a series connection of impedance and voltage source.
4 The general method to optimize the parameters
The general method to calculate the virtual impedance and the virtual voltage source.
In the last section, the adaptive control method has been proposed. The power flow through the SOP is determined by two side-grid voltages. A simplified diagram of the system of the SOP connected to the distribution grid is shown in Figure 8, where the AC source voltages U1 and U2 on both sides denote the voltages intervening in the distribution grid, Y1 and Y2 denote the line admittance, Zsop denotes the virtual impedance link of the SOP, and △Vsop denotes the virtual voltage source link. U3 indicates the voltage of the utility grid. As mentioned before, the regulation of the system power flow is realized by adjusting the values of Zsop and △Vsop. Among them, when the value of z is small enough, the power flow regulation on both sides is more flexible and flows more frequently, and any small voltage deviation will cause the power balance, which increases the power flowing through the SOP, and the loss generated by the SOP itself increases. In addition, when the value of z is large, the sensitivity to the voltage difference between the two sides decreases and the power flow regulation threshold rises, decreasing the losses generated by the SOP. Therefore, how to design the values of Zsop and △Vsop such that the SOP can automatically regulate the power flow, balance the voltage difference between the two sides, and also take into account the loss due to the SOP power regulation is the key to the realization of the control strategy proposed in this paper.

Figure 8. Equivalent model for optimizing the virtual impedance and virtual voltage source.
The goal in this section is to find the virtual impedance and virtual voltage for a specific purpose; for example, for minimizing the power loss. The virtual impedance and virtual voltage are given as follows:
where △Vsop and θsop are the magnitude and phase angle of the virtual voltage source, respectively. Gsop and Bsop are the conductance and susceptance, respectively. In this article, the objective function is to minimize the power loss. For other objective functions, the method can still be used. The objective function is given as follows:
The power loss mainly contains the losses caused by the transformers and line impedance, which are indicated by Ploss1 and Ploss2, respectively. Additionally, the power loss of the SOP, which is indicated by Ploss_sop, is also included. Unlike traditional line losses, SOP losses require calculating power device losses and inductor losses based on the power flowing through the SOP. The constraints of the objective function are the power flow distribution. The complexity of the constraints and the nonlinearity of the objective function make the optimization difficult to solve. So, an artificial intelligent optimization method, such as particle swarm optimization (PSO), can be employed. The details of the solving processes are given in the following sections.
(1) The particles are initialized as follows:
where the subscript x indicates the number of particles. rand() denotes the random value. Parx indicates the position of particle x, where the dimension of Parx is 4.
(2) The main purpose of flexible interconnection equipment is to facilitate the transfer of power imbalances. Considering the variability of real-world operating conditions, traversing all operating conditions would consume a significant amount of resources. Therefore, different operating conditions are separated into a finite number of intervals.
The parameters in Eq 13 can be calculated according to the power flow. For each combination of P and Q, the power flow can be calculated according to Equs 14–16.
According to Figure 8, the admittance matrix is given as follows:
where
Substituting the power in Table 1 into the formula to obtain the power flow equation, we obtain:

Table 1. Power stages and probability.
According to the above equation,
(3) The results are compared to find the historical best and the global best. The historical best of each particle is Parxb. The global best is Pargb.
(4) The update of the particles is expressed as follows:
(5) Repeat steps (2)–(4) until the into English is “iteration limit. The flowchart of the above method is given in Figure 9.
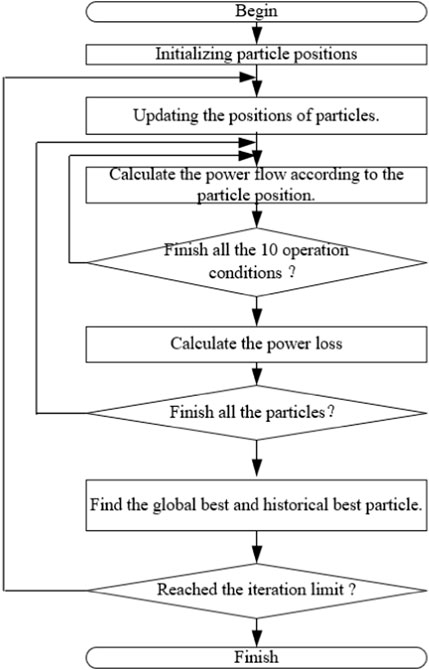
Figure 9. Flowchart of parameter optimization.
5 Simulation and experimental verification
A simulation model of the distribution network shown in Figure 1 is built in MATLAB/Simulink, and to simplify the model without affecting the simulation results, the line impedance Z on both sides is taken as 1 Ω. The parameters of the simulation model are shown in Table 2.

Table 2. Simulation parameters.
The DG and load connected on both sides are equated as load 1 and load 2, respectively, and the power absorbed/released by the load from the distribution network is defined as the net consumed power, in which both are of 10 kW–100 kW level; the reference quantity of DC chain voltage is 800 VDC, the output voltage of the transformer is 220 V/50 Hz, the R value of the virtual impedance link is taken as 0.2, the L value is taken as 50, the parameter of the PI control ring is taken as kp 1.2, and ki is 200, and the simulation verifies the effectiveness of the virtual impedance-based SOP power adaptive regulation method. In addition, the experimental platform of the SOP is also built for verification. Under the laboratory conditions, the output voltage of the transformer is 35 V/50 Hz, the DC chain voltage reference quantity is 100 VDC, and the loads on both sides are of kW level; the built experimental platform is shown in Figure 10.
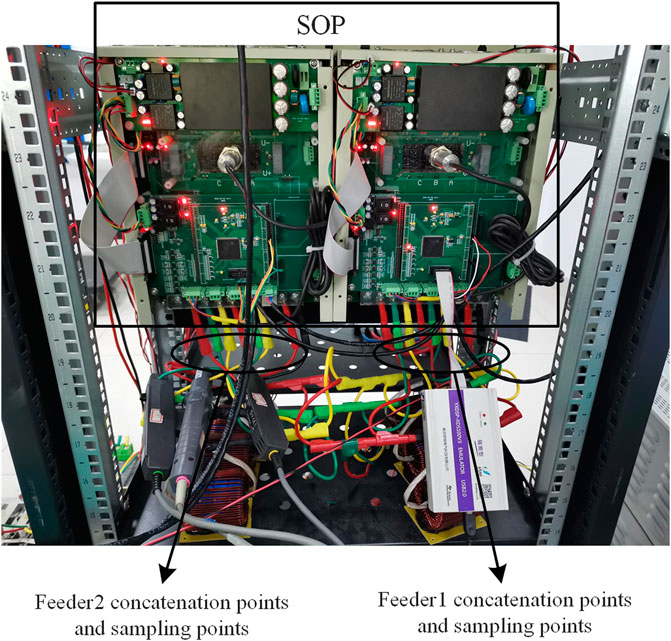
Figure 10. SOP experiment platform.
In the simulation experiment in which the smart soft switch is connected to the same position on both sides of the distribution network, the smart soft switch is equated to a virtual impedance link. The 1-side and 2-side systems have large fluctuations in the total net consumed power due to the access of the distributed power sources, as shown in Figure 11A. At this time, the voltage RMS of both sides accessed to the load terminal fluctuates largely with the power fluctuation, as shown by the solid line in Figure 11B. After adding the regulation method proposed in this paper, the waveform of the RMS voltage at the load terminal on both sides is shown as the dotted line in Figure 11B, and at this time, the RMS voltages on both sides are equal, and the fluctuation amplitude is smaller. The power flow regulated by the SOP is shown in Figure 11C, where the part greater than 0 indicates that the power flows from side 1 to side 2, and the part less than 0 indicates that the power flows from side 2 to side 1.
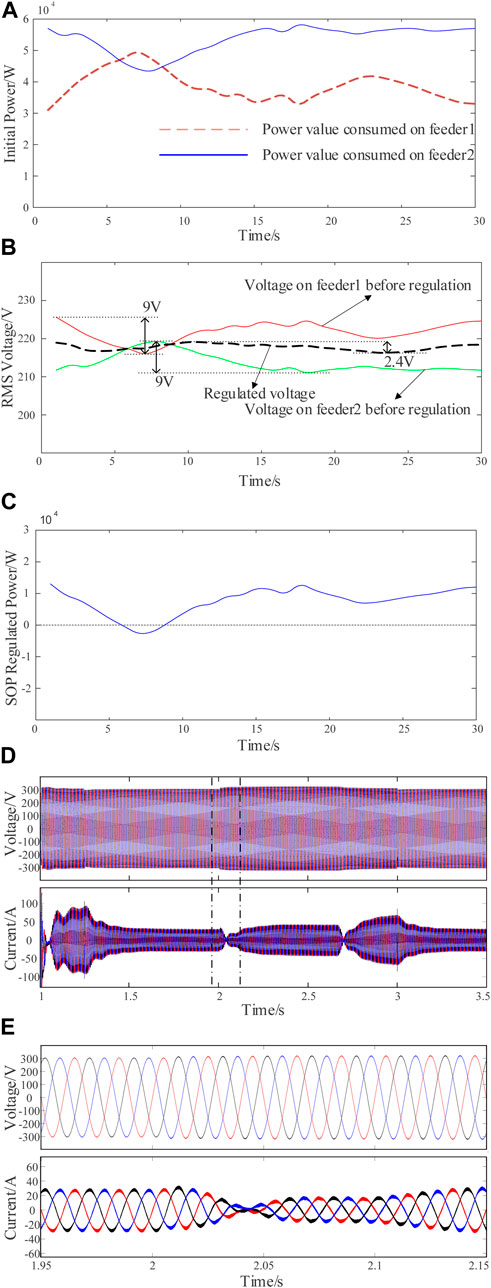
Figure 11. Simulation results diagram when the SOP is equivalent to impedance. (A) Initial net power consumption trajectory; (B) RMS voltage trajectory; (C) SOP regulated power trajectory; (D) Voltage and current waveform on long time scales for feeder1; (E) Voltage and current waveform on short time scales for feeder1.
In the simulation experiments where the positions of the two sides of the SOP access to the distribution network differ greatly, the SOP is equivalent to an impedance series-connected voltage source link. The total net power consumption of the 1-side and 2-side system access is shown in Figure 12A, and the RMS values of the voltages at the access point of the SOP to the distribution network are, respectively, shown as the solid lines in Figure 12B, at which time the voltages fluctuate rapidly and with a large fluctuation amplitude. After adding the regulation method proposed in this paper, the waveform of the RMS voltage at the access point of the SOP is shown as the dotted line in Figure 12B, at which time, the voltage difference between the two sides follows the change in the control quantity, and the voltage fluctuation between the two sides becomes smaller. The power flow regulated by the SOP is shown in Figure 12C, where the part greater than 0 indicates that the power flows from side 1 to side 2, and the part less than 0 indicates that the power flows from side 2 to side 1. The simulation experiment can prove that the power adaptive regulation method of the SOP based on virtual impedance proposed in this paper can realize the regulation of power and voltage in a distribution network.
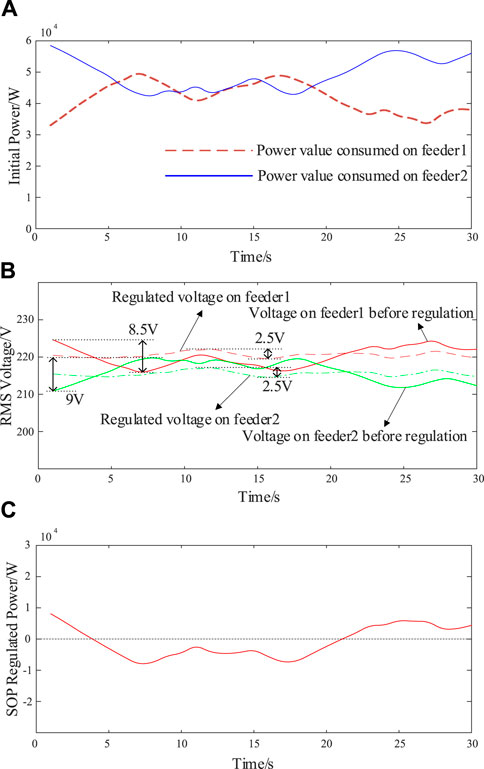
Figure 12. Simulation results when the SOP is equivalent to a series connection of impedance and voltage source. (A) Initial net power consumption trajectory; (B) RMS voltage trajectory; (C) SOP regulated power trajectory.
Under the experimental conditions of an AC voltage of 35 V/50 Hz, DC voltage of 100 VDC, and load power of kW class, the waveforms measured by an oscilloscope are shown in Figure 11, where the upper side of Figure 13 shows the current waveforms of the long time-scale on the 2-side of SOP, and the lower side of Figure 13 shows the current waveforms of the short time-scale after the addition of the regulation strategy. From the long time-scale current waveforms, it can be seen that the current amplitude of this side of the overall downward trend with the power changes, which can realize the adaptive regulation; from the short time-scale current waveforms, it can be seen that after the regulation of the SOP, the three-phase current frequency, phase stability in line with the requirements of the grid, and the experimental platform can realize the proposed regulation method.

Figure 13. Experimentally measured current waveform.
6 Conclusion
In this paper, an adaptive regulation method based on virtual impedance is proposed for the power of SOPs. This method equates SOPs as virtual impedance and power source links and determines the equivalent impedance value of SOPs with the voltage component in the DQ domain. The adaptive control of power flow and voltage is realized by adding the virtual impedance and the power supply link in the control loop.
Simulation and experimental results show that the proposed method can quickly regulate the power flow, effectively reduce the voltage fluctuation, and improve the operational efficiency and stability of the distribution network.
Data availability statement
The original contributions presented in the study are included in the article/Supplementary material; further inquiries can be directed to the corresponding authors.
Author contributions
YL: data curation, validation, and writing–review and editing. YL: investigation, resources, and writing–review and editing. XZ: writing–original draft and data curation. FG: supervision and writing–review and editing. TX: writing–original draft, writing–review and editing, and conceptualization.
Funding
The author(s) declare that no financial support was received for the research, authorship, and/or publication of this article.
Conflict of interest
Authors YL and YL were employed by the State Grid Intelligence Technology Co., Ltd.
The remaining authors declare that the research was conducted in the absence of any commercial or financial relationships that could be construed as a potential conflict of interest.
Publisher’s note
All claims expressed in this article are solely those of the authors and do not necessarily represent those of their affiliated organizations, or those of the publisher, the editors, and the reviewers. Any product that may be evaluated in this article, or claim that may be made by its manufacturer, is not guaranteed or endorsed by the publisher.
References
Aithal, A., Long, C., Cao, W., Wu, J., and Ugalde-Loo, C. E. (2016). Impact of soft open point on feeder automation. 2016 IEEE Int. Energy Conf., 1–6. doi:10.1109/ENERGYCON.2016.7514101
Bloemink, J. M., and Green, T. C. (2010). Increasing distributed generation penetration using soft normally-open points. IEEE PES General Meet., 1–8. doi:10.1109/PES.2010.5589629
Bloemink, J. M., and Green, T. C. P. (2013). Benefits of distribution-level power electronics for supporting distributed generation growth. IEEE Trans Power Deliv. 28 (2), 911–919. doi:10.1109/tpwrd.2012.2232313
Chengshan, W., Ji, J., Ji, H., Yu, H., and Wu, J. (2022). Technologies and application of soft open points in distribution networks. Automation Electr. Power Syst. 46 (4), 1–14. doi:10.7500/AEPS20210514005
Dong, X., Liu, Z., Li, P., Song, G., Wu, Z., and Chen, L. (2018). Intelligent distribution network control technology based on multi-terminal flexible distribution switch. Proc. CSEE 38 (1), 86–92. doi:10.13334/j.0258-8013.pcsee.172359
Kupzog, F., Brunner, H., Pruggler, W., Pfajfar, T., and Lugmair, A. (2007). Dg demonet-concept – a new algorithm for active distribution grid operation facilitating high dg penetration. 2007 5th IEEE Int. Conf. (2), 1197–1202. doi:10.1109/INDIN.2007.4384946
Li, P., Ji, H., Yu, H., Zhao, J., Wang, C., and Song, G. (2019). Combined decentralized and local voltage control strategy of soft open points in active distribution networks. Appl. Energy, 241.613–624. doi:10.1016/j.apenergy.2019.03.031
Li, Z., et al. (2013). Dual closed-loop control of soft normally open points and its application in distribution networks. Smart Grid 1 (1), 49–55.
Liu, Y. J., Xuan, X. F., Zou, X. S., Xiong, W., Tan, Z. K., and Xu, Y. T. (2022). Review of distributed power supply dissipation technology based on soft open point. Electr. Meas. Instrum. 59 (7), 1–8. doi:10.19753/j.issn1001-1390.2022.07.001
Meng, M., Wei, Y., Zhu, G. L., and Zhang, J. S. (2019). Research on optimal control strategy of AC/DC active distribution networks based on soft open point. Mod. Electr. Power 36 (2), 1–7. doi:10.3969/j.issn.1007-2322.2019.02.001
Ren, P. (2021) “Research on hybrid energy storage control strategy for PV microgrid,” in Shanxi. China: North University of China Master’s Degree Thesis.
Shen, Y., Peng, X., and Sun, Y. (2012). Study on cooperative control strategies of back-to-back dual-PWM Converter. Power Syst. Technol. 36 (1), 146–152. doi:10.13335/j.1000-3673.pst.2012.01.031
Wang, C. S., Sun, C. B., Li, P., and Wu, J. Z. (2015). SNOP-based operation optimization and analysis of distribution networks. Automation Electr. Power Syst. 39 (9), 82–87. doi:10.7500/AEPS20140828002
Wang, C. S., Song, G. Y., Li, P., Yu, H., Zhao, J. L., and Wu, J. Z. (2016). Research andprospect for soft open point based flexible interconnection technology for smartdistribution network. Automation Electr. Power Syst. 40 (22), 168–175. doi:10.7500/AEPS20160620009
Wang, J., et al. (2021). Overview of typical control methods for grid-connected inverters of distributed generation. Proceeding CSU-EPSA 24 (2), 12–20.
Wang, P. (2017) “Electromagnetic transient modeling and fast simulation of soft open points in active distribution network,” in Tianjin. China: Tianjin University Master’s Degree Thesis.
Xie, X., Sun, Y., and Fan, J. X. (2024). A measurement-based dynamic harmonic model for single-phase diode bridge rectifier-type devices. IEEE Trans. Instrum. Meas. 73, 1–13. doi:10.1109/tim.2024.3370782
Xiong, Z. Y., Miao, H., and Zeng, C. B. (2020). Operation optimization of active distribution network based on smart soft open point and energy storage system. Electr. Meas. Instrum. 57 (13), 33–39. doi:10.19753/j.issn1001-1390.2020.13.007
Yang, H., Cai, Y. Y., Qu, Z. S., Deng, Y., Lu, Y., and Zhao, R. X. (2018). Key techniques and development trend of soft open point for distribution network. Automation Electr. Power Syst. 42 (7), 153–165. doi:10.7500/AEPS20171031018
Zhang, B., Liu, S. Y., Lin, Z. Z., Yang, L., Gao, Q., and Xu, H. (2021). Distribution network reconfiguration with high penetration of renewable energy considering demand response and soft open point. Automation Electr. Power Syst. 45 (8), 86–94. doi:10.7500/AEPS20190930004
Keywords: soft open point, virtual impedance, adaptive power control, voltage fluctuations, PSO
Citation: Li Y, Li Y, Zhao X, Gao F and Xu T (2024) An adaptive power control method for soft open points based on virtual impedance. Front. Energy Res. 12:1387670. doi: 10.3389/fenrg.2024.1387670
Received: 18 February 2024; Accepted: 12 June 2024;
Published: 14 August 2024.
Edited by:
Hao Wang, Monash University, AustraliaCopyright © 2024 Li, Li, Zhao, Gao and Xu. This is an open-access article distributed under the terms of the Creative Commons Attribution License (CC BY). The use, distribution or reproduction in other forums is permitted, provided the original author(s) and the copyright owner(s) are credited and that the original publication in this journal is cited, in accordance with accepted academic practice. No use, distribution or reproduction is permitted which does not comply with these terms.
*Correspondence: Xingjian Zhao, MjAyMTM0OTQ5QG1haWwuc2R1LmVkdS5jbg==