 Jianbing Jiang
 Jianxun Jiang1*
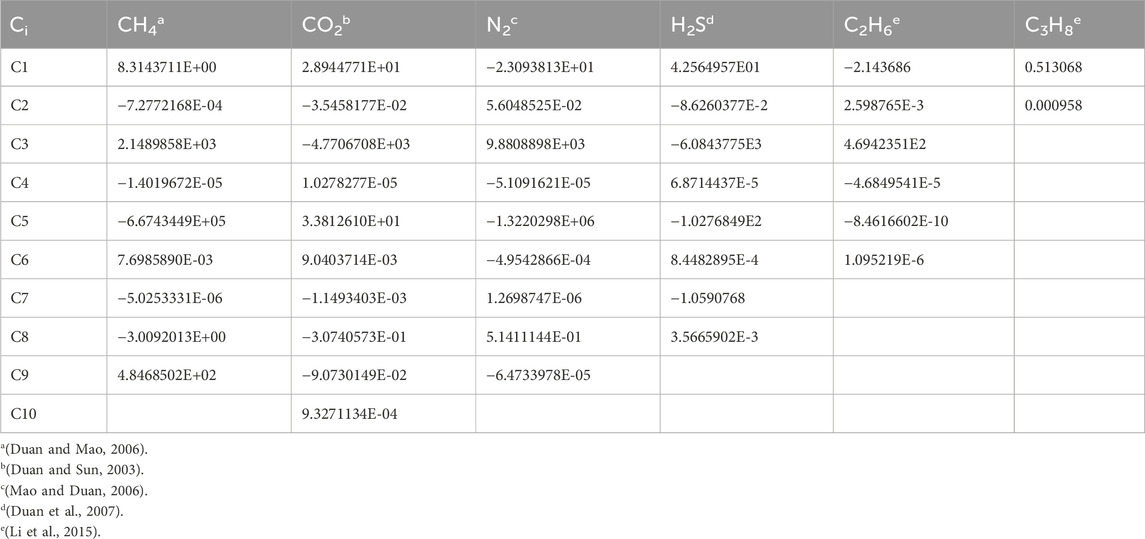

95% of researchers rate our articles as excellent or good
Learn more about the work of our research integrity team to safeguard the quality of each article we publish.
Find out more
ORIGINAL RESEARCH article
Front. Energy Res. , 14 March 2024
Sec. Advanced Clean Fuel Technologies
Volume 12 - 2024 | https://doi.org/10.3389/fenrg.2024.1378754
The study of hydrate phase equilibrium is crucial for ensuring the safety of natural gas pipeline transportation and the process of hydrate recovery. While scientists typically focus on the chemical potential of hydrates, the role of gas solubility in hydrate phase equilibrium remains unclear, and this study fills this gap. This work investigated the solubility of gas at the equilibrium point of the hydrate phase through model calculations. Additionally, a new model of hydrate phase equilibrium is established based on the relationship between solubility. Firstly, a solubility model based on gas-liquid equilibrium theory showed higher prediction accuracy in comparison to the PR equation and Duan model and was then used to calculate gas solubility under hydrate phase equilibrium conditions. Afterwards, a novel model was developed to predict hydrate equilibrium state based on the relationship between gas solubility and hydrate phase equilibrium temperature, and it was further compared with the Chen–Guo model and CSMGem in terms of prediction accuracy under pure water and brine settings. The results showed: (a) The calculation deviation of the solubility model was 0.7–8.7% in pure water settings and 2.6–11.7% in brine settings; (b) A strong linear correlation between the phase equilibrium temperature of hydrates and gas solubility was also found; (c) This proposed model achieved over 10 times the accuracy of the Chen–Guo model and the CSMGem in predicting the phase equilibrium state of N2 and CO2 hydrates, and 3–10 times higher accuracy than that of the Chen–Guo model and CSMGem in brine. This work suggests that the gas solubility equilibrium theory can provide a more accurate prediction of hydrate states.
Natural gas hydrates are a kind of non-stoichiometric crystalline structure substance and composed by gas and water molecules through hydrogen bonds. As a potential clean energy source, hydrate recovery has been gaining global attentions. Moreover, hydrates have the potential of applications in brine desalination (Sahu et al., 2018), storage (Cheng et al., 2020) and transportation of hydrogen (Lee et al., 2005; Strobel et al., 2009), CO2 separation in flue gas, and CO2 sequestration (Van Denderen et al., 2012; Quon and Jiang, 2023). In addition, hydrate plugs in pipeline for natural gas transportation are also a primary concern (Creek, 2012). Predicting hydrate deposition in natural gas pipelines is crucial for gas transportation efficiency and safety (Zhang et al., 2019a; Zhang et al., 2019b). The most common method to prevent the hydrate-associated problems in the wellbore is to add a large amount of thermodynamic inhibitor to totally inhibit the formation of hydrates (hoon Sohn et al., 2015). Therefore, the evaluation of inhibitors also requires studying the phase equilibrium of hydrates. Moreover, accurate phase equilibrium analysis has a significant impact on the efficiency of gas exchange in natural gas hydrate recovery technology (Wang Y. et al., 2021), such as the equilibrium state of the hydrates can be broken by changing the temperature and pressure conditions of hydrate reservoirs (Qin et al., 2020). Temperature and pressure are the basic parameters for hydrate formation. Hydrate equilibrium state prediction is one of important aspects in the above hydrate-based technologies. Therefore, studying how to predict the temperature or pressure of hydrate phase equilibrium is significant.
The prediction methods for hydrate phase equilibrium mainly include the enthalpy–entropy chart method (Katz, 1945), thermodynamics model (Chen and Guo, 1996; Chen and Guo, 1998; Klauda and Sandler, 2000; Waals and Platteeuw, 2007), and neural network algorithm (Khamehchi et al., 2013; Xu et al., 2021). The enthalpy–entropy chart method is the earliest developed method, but it lacks an understanding of hydrate structures, leading to significant biases. The neural network method, including the application of multilayer perceptron and radial distribution function, have gradually become a hot research topic in recent years, but it exhibit overfitting (Khan et al., 2018). The thermodynamics models, including vdW-P type models (Waals and Platteeuw, 1958), Chen−Guo (C-G) model (Chen and Guo, 1996; Chen and Guo, 1998), and Klauda–Sandler (K-S) model (Klauda and Sandler, 2000), are well known and widely used. But these thermodynamics models rely on hypothesis (Wang L.-B. et al., 2021). The application range of the Antoine coefficient limits the applicability of the Chen Guo model (Mohammadi and Richon, 2008). Meanwhile, the main drawback of vdW-P model is its weak ability to predict high and low pressures and temperatures (Mohamadi-Baghmolaei et al., 2018). The original vdW-P model also exhibits a significant bias under high concentration salt solutions (Xu et al., 2021). Moreover, these models do not consider solubility and still require the calculation of gas fugacity or activity through equations of state (Li et al., 2019). On one hand, this is attributed to the low solubility of gases. On the other hand, these thermodynamic models construct the potential function of water molecules in hydrates, and it is independent of gas solubility. However, with the advancement of micro-molecular research in recent years, it has been gradually recognized that gas concentration plays a significant role in the influence of hydrates (Zhang et al., 2016; He et al., 2017).
The main factors affecting the phase equilibrium of hydrates include pressure (Liehui et al., 2006), salt (Lv et al., 2018), alcohol inhibitors (Sami et al., 2013), porosity (Yang et al., 2011), gas solubility and gas species. Experimental studies (Sloan and Koh, 2007) have found that the temperature of hydrate phase equilibrium is increased with increasing pressure. As the mineralization degree increases, the temperature of hydrate phase equilibrium decreases (Sloan and Koh, 2007). The higher the content of inhibitors, the lower the temperature of hydrate phase equilibrium (Sami et al., 2013). Additionally, the temperature of hydrates is varied for different natural gas species (Sloan and Koh, 2007). In recent years, some scholars have measured the solubility of greenhouse gases in the presence of hydrates (Li et al., 2018; Hassan et al., 2020; Wang et al., 2023). However, the relationship between gas solubility and the phase equilibrium temperature or pressure of natural gas hydrates is still unclear. It is difficult to observe or measure the gas saturate solubility near hydrate formation in macroscopic experiments because the solubility exhibits supersaturation in the presence of hydrates (Song et al., 1997). Therefore, this work adopted high-precision solubility models for calculation. Studying the gas solubility before hydrate formation is of great significance for the investigation of hydrate phase equilibrium. It also holds reference significance for the study of hydrate nucleation concentration.
The main objective of this work is to study the solubility of gas in the vicinity of different hydrate equilibrium states. Subsequently, a model is constructed to predict the phase equilibrium of natural gas hydrates based on the relationship between gas solubility and the hydrate equilibrium state. Therefore, this study initially constructs a solubility model using gas-liquid theory to calculate the gas solubility at the hydrate equilibrium state. The solubility relationship is then fitted at various hydrate equilibrium temperatures. Furthermore, a novel model is developed based on gas solubility to predict the phase equilibrium state of natural gas hydrates. Finally, the Chen–Guo model and CSMGem software are compared with this model. Additionally, the equilibrium states of hydrates under pure water and brine conditions are predicted using this model.
The steps for this work can be broken down as follows:
(1) Constructing a gas solubility model suitable for high pressure based on gas-liquid phase equilibrium theory.
(2) Calculating the gas solubility at hydrates phase equilibrium state
(3) Developing a predictive model for hydrate phase equilibrium state.
(4) Computing and comparing the reliability of the hydrate phase equilibrium state prediction model.
The workflow shows in Figure 1.
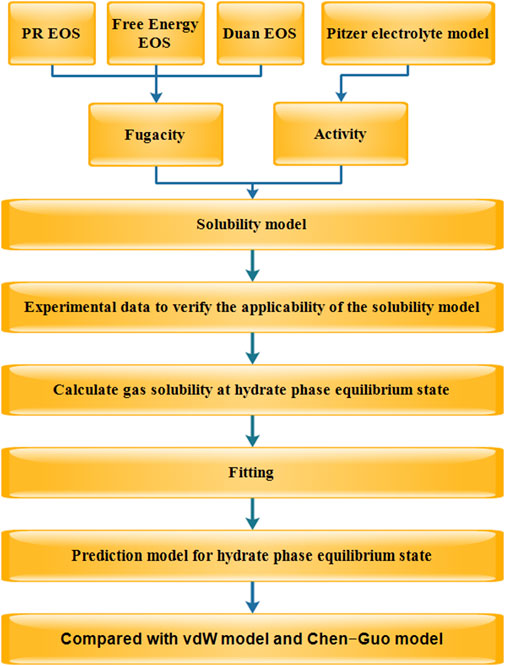
FIGURE 1. The workflow diagram for this work.
The study of solubility can be broadly categorized into the fugacity-fugacity model and the fugacity-activity model. In the fugacity–activity model, gas equations of state (EOS), such as cubic equations (Soave, 1972; Peng and Robinson, 1976; Kontogeorgis et al., 2006) and multi parameter equations (Benedict et al., 1940; Benedict et al., 1951), are used to describe the gas phase, while electrolyte models are employed to describe aqueous solutions. It should be noted that cubic equations tend to exhibit increasing deviations under high-pressure conditions (Moshfeghian et al., 2012; Chabab et al., 2019; Rezania et al., 2021). Multiparameter equations are often preferred for high-pressure applications due to their higher accuracy. For instance, the Duan model (Duan et al., 1992) can be applied to pressures up to 2,000 bar for gases like CH4 and CO2. The SW96 (Span and Wagner, 1996) model (Span and Wagner, 1996) is capable of handling pressures up to 8,000 bar for CO2 gas.
When the gas and liquid phases reach equilibrium, the chemical potential of component i in phases α and β can be expressed as follow:
The chemical potential
where i is the natural gas component, μV is the chemical potential gas component, μL is the chemical potential liquid component, ai is the activity of component i, fi is the fugacity of component i,
The equilibrium constant of component i can be defined as (Li and Duan, 2007):
The functions for each component of natural gas are (Duan and Sun, 2003; Duan and Mao, 2006; Mao and Duan, 2006; Mao et al., 2013; Li et al., 2015)
The constant ci is shown in Table 1.
Consider the impact of water vapor, Consider the impact of water vapor, the calculation of gas composition is shown in Eqs (11, 12):
where
In the multi-parameter equation of state, expressed in the form of Helmholtz free energy (MH), the free energy A is a function of temperature and density. It is expressed as the sum of the ideal state free energy and the remaining free energy (Mao et al., 2017), shows in Eqs (13−16):
where
The dimensionless Helmholtz free energy is defined as:
where
where
where
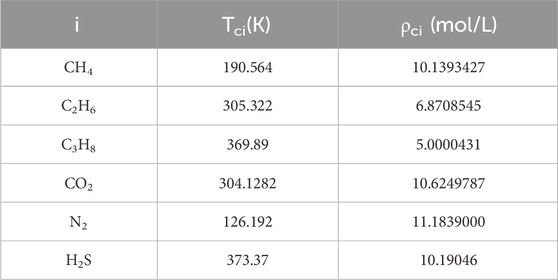
TABLE 2. Gas critical constant.
The relationship between dimensionless Helmholtz Free Energy and PVT is shows in Eqs (17−19):
where
The constants i, j, and k are shown in appendix Table 3, am is shown in Table 4.
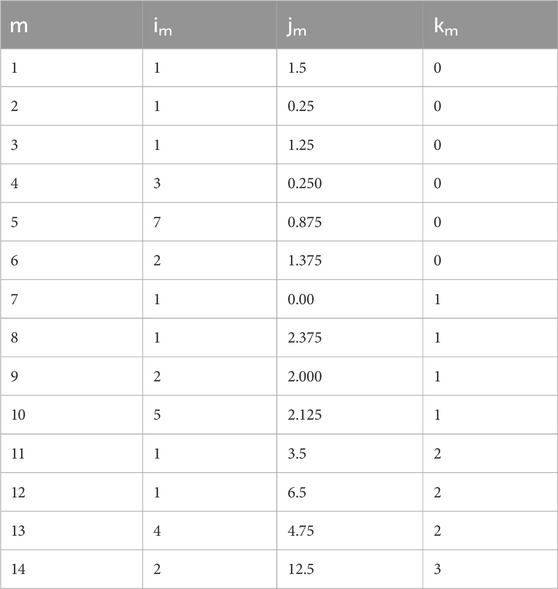
TABLE 3. Constants of Eq. 19.
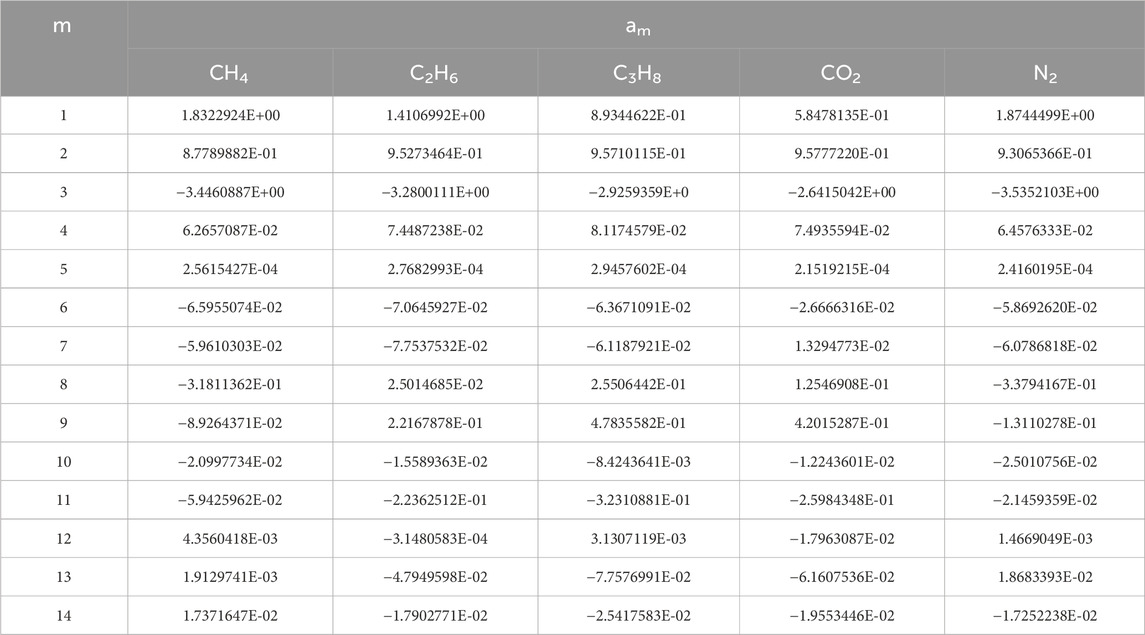
TABLE 4. Constants of am in Eq. 19.
The fugacity expression of the Mao’s Helmholtz (MH) EOS (Mao et al., 2017) is shows in Eqs (20−22):
where
The Pitzer activity coefficient model (Pitzer et al., 1984) can be expressed as
where mc is the cation molality, mol/kg; ma is the anion molality, mol/kg;
For CH4, CO2, N2, Eq. 5 can be transformed with Eq. 23 into Eqs (24−28):
The relationship between critical temperature of hydrate phase equilibrium and gas solubility can be given as follows:
Where i is component, mi is gas solubility, Ci and Di are constants, fitted by Origin 2021, shows in Table 5. This relationship will be demonstrated in the subsequent Results section. By combining Eqs 5, 29, a phase equilibrium prediction model for hydrate can be obtained:
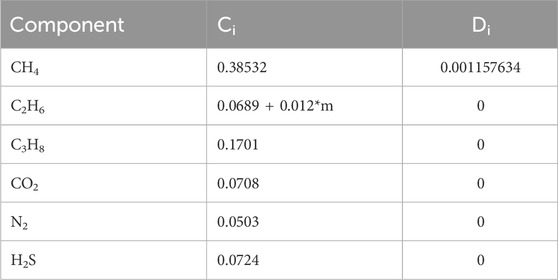
TABLE 5. Recommended values, where m (mol/kg) represents the mineralization degree of Na ions.
Eq. 30 can be transformed into:
The first term on the left-hand side of the equation is determined by EOS, while the second term is determined by the chemical potential of liquid. The constants Ci and Di are determined by the composition of the system.
By comparing the experimental data with the solubility model, as shown in Table 6 solubility ranges from 0.7% to 7.6%, for CO2 solubility ranges from 1.2% to 7.2%, and for N2 solubility ranges from 1.9% to 6.8%. In comparison with Duan model, the MH model exhibits a deviation within 2%. Under low-temperature conditions, the solubility model shows good agreement with the experimental data, with an AAD of only 3.4%. The solubility of CH4 and CO2 under different conditions is analyzed, as depicted in Figures 2A, B, respectively. Apart from a small amount of experimental data deviating by approximately 10% under low-temperature (<280 K) and low-pressure (<100 bar) conditions for CH4, most of the experimental data aligns with the calculated values of the model within a deviation of 5% or less. The prediction deviation of MH and Duan models for CO2 generally remains within 5% under most data comparisons, with the peak deviation occurring under low–pressure and low–temperature conditions (288 K, 1.1 bar). Additionally, the model’s deviation for CH4 and CO2 under high-pressure and low-temperature conditions is deemed acceptable.
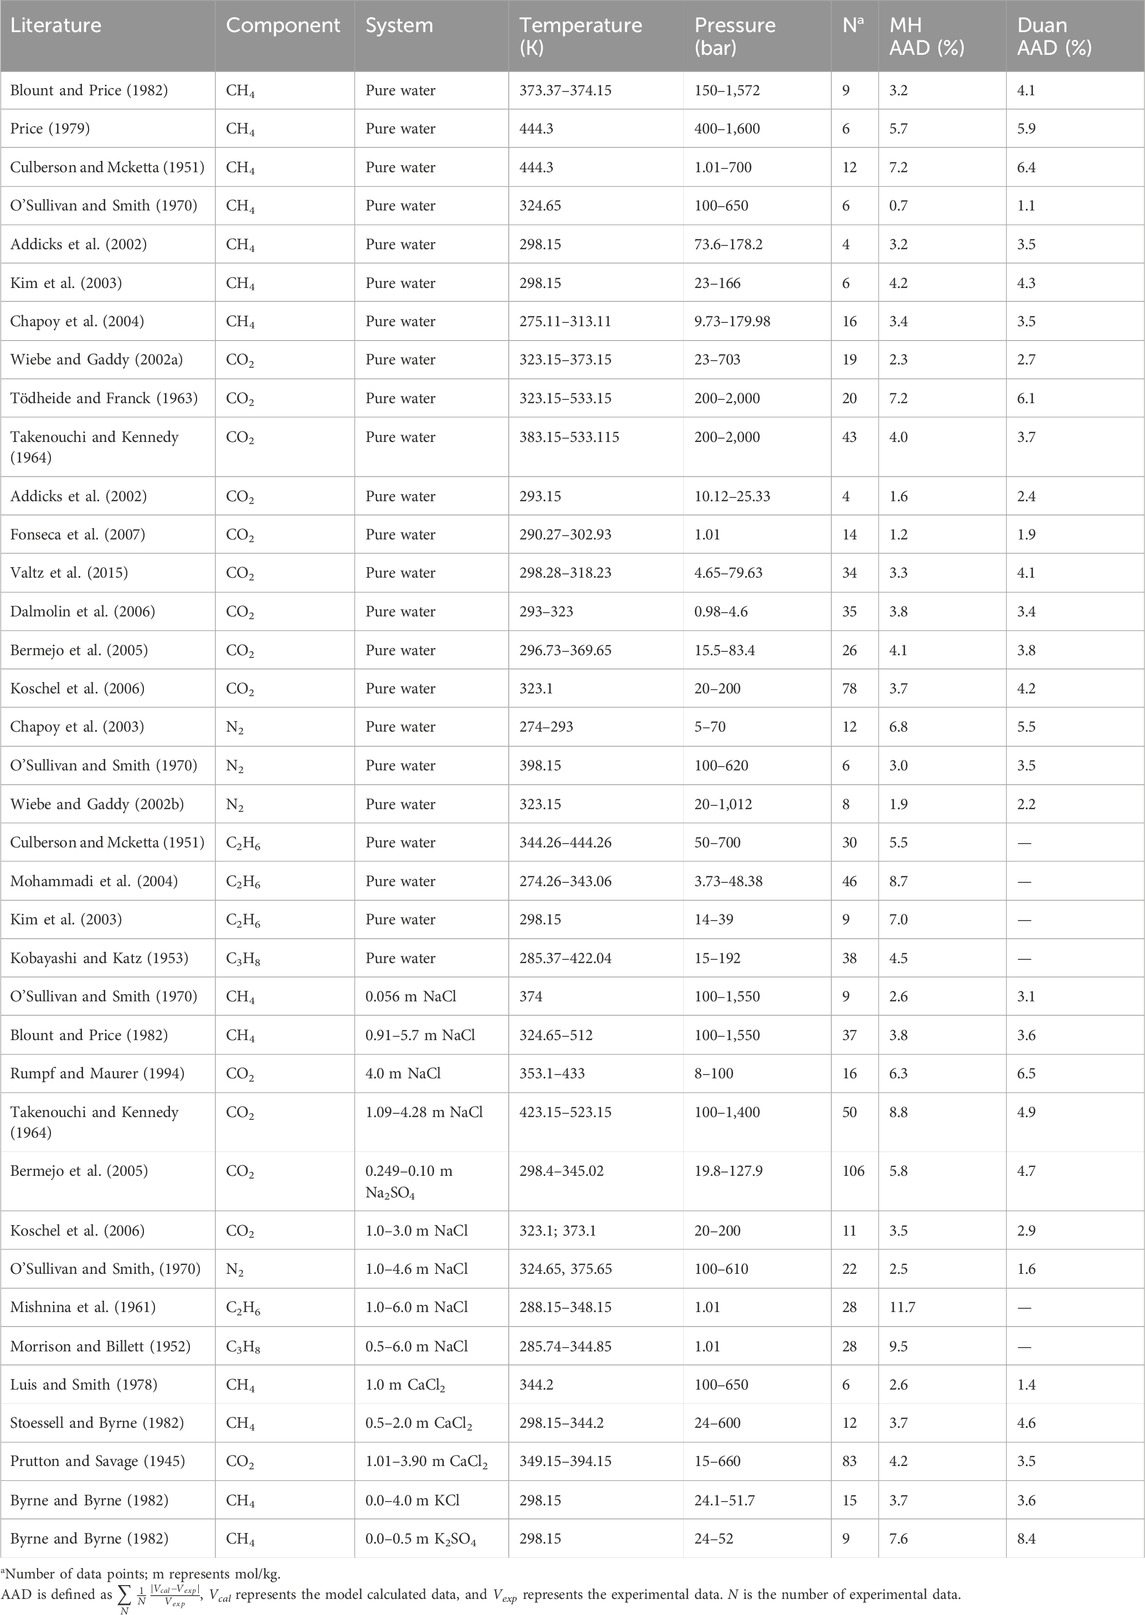
TABLE 6. Experimental data on the solubility of hydrocarbons in brine solutions and comparison.
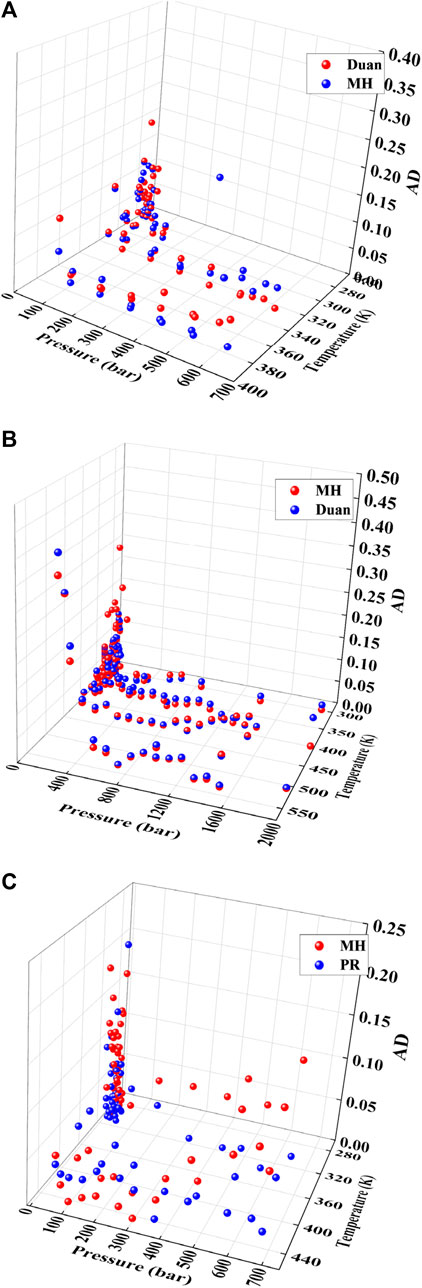
FIGURE 2. Solubility deviation statistical distribution in pure water, (A) is for CI-14 (B) is for CO2, (C) for C2116. Data source: References (Yarym-Agaev et al., 1985; Gao et al., 1997; Lekvam and Bishnoi, 1997; Chapoy et al., 2004; Kim et al., 2003; Wiebe and Gaddy, 2002a; Valtz et al., 2015; Dalmolin et al., 2006; Dohrn et al., 1993; D'Souza et al., 1988).
The deviation of C2H6 solubility in the temperature range of 274 K–444 K and pressure range of 0bar–700 bar is statistically analyzed in Figure 2C. Within the pressure range less than 100 bar and temperature range of less than 280 K, the deviation between the MH model and experimental data is significant, with AD exceeding 10%. From Figure 2C, it can be seen that there is a significant deviation in some experimental data for the prediction results under low temperature and low-pressure conditions. This may be due to the low solubility of natural gas and the relative measurement deviation under low temperature and low-pressure conditions. Additionally, the presence of residual gases in water may also affect the results. Therefore, as the pressure increases and the solubility increases, this relative deviation would gradually decrease. When the pressure exceeds 100 bar, the deviation of the MH model becomes similar to that of the PR model, with AD around 5%. Therefore, under pure water conditions, the PR model is considered superior to the MH model.
The solubility for N2 is shown in Figures 3A, B, the AADs of the MH, Duan, and PR models are 4.01%, 5.54%, and 4.51%, respectively. After pressure exceeds 500 bar (Figure 3B), the deviation of the PR (Peng-Robinson) model gradually increases. This is consistent with the results of literature research (Moshfeghian et al., 2012; Chabab et al., 2019). The PR equation has received widespread attention from scholars for its concise form, but as the pressure gradually increases, the cubic equation of state shows an increasing bias. The advantage of the Duan model is that it accurately calculates the fugacity of pure gases, but the limitation of the Duan model is that it is only applicable to a limited number of pure gases.

FIGURE 3. Comparison of different models, (A,B) for N2 solubility in pure water. (C) for C2H6 and (D) for C3H8 solubility in brine. Data source: References (Mishnina et al., 1961; Morrison and Billett, 1952; O'Sullivan et al., 1966; Wiebe et al., 1933).
The deviation of the model in calculating the solubility of gases under brine conditions is shown in Table 6, where the average absolute deviation (AAD) of the model for the solubility of CH4, CO2, and N2 gases is acceptable. The distribution of calculation deviations for C2H6 solubility and C3H8 solubility using the MH model at different mineralization levels is shown in Figures 3C, D. The figure demonstrates that the MH model exhibits higher calculation accuracy compared to the PR model. The average absolute deviations (AAD) of the MH model for C2H6 and C3H8 are 11.7% and 9.5%, respectively. The model’s calculation deviation is the smallest under low-temperature conditions (288.15 K for C2H6 and 285.74 K for C3H8) and increases with temperature. Furthermore, when the mineralization degree exceeds 4 mol/L, the deviation of the model in calculating the solubility of ethane increases. Therefore, the calculation deviation of the MH model is considered acceptable for low temperatures and mineralization levels not exceeding 4 mol/L.
Through the verification of a large amount of experimental data, it can be observed that the gas solubility deviation of this solubility model under high-pressure conditions is primarily distributed within 10%, with some deviations even reaching 5%. This indicates that the calculated dissolution deviation near the hydrate phase equilibrium using this solubility model is acceptable. Although there is a significant deviation in the calculation of solubility under low-pressure and low-temperature conditions in this solubility model, it does not affect the usability of this solubility model since the formation conditions of natural gas hydrates occur under high pressure.
This work employs the MH model, Duan model, and PR model to calculate the gas solubility at the temperature and pressure of hydrate phase equilibrium. The pressure range considered in the calculations is as follows: CH4 (<2,000 bar), CO2 (<2,000 bar), H2S (<23 bar), N2 (<1,000 bar), C2H6 (<33 bar), and C3H8 (<6 bar). The gas solubility at hydrate phase equilibrium is shown in Figure 4. All points in the figure represent three-phase equilibrium (gas-hydrate-liquid water), and the data points are obtained from the literature. The image in Figure 4A can be projected onto the solubility-temperature plane to obtain the linear graph shown in Figure 4B. The relationship between the natural logarithm of solubility and temperature follows a linear equation. Similarly, under brine conditions, the calculations yield a linear relationship, as shown in Figures 5A–C. Therefore, Eq. 29 can be easily derived. Normally, gas solubility decreases with increasing temperature, as depicted in Figure 5D. However, as the temperature of hydrate phase equilibrium increases, the gas solubility also increases, indicating a positive correlation between gas solubility and hydrate formation. Hence, gas solubility can be used to characterize the ease of hydrate formation. In other words, the higher the gas solubility, the higher the temperature at which the hydrate reaches phase equilibrium. This indicates that only a small temperature difference is required, but a significant pressure change is needed in the process of hydrate formation in two different states. However, the gas solubility required to produce hydrates in these two different states can be predicted linearly. In other words, obtaining hydrates at higher temperature conditions requires a higher gas solubility to be triggered.
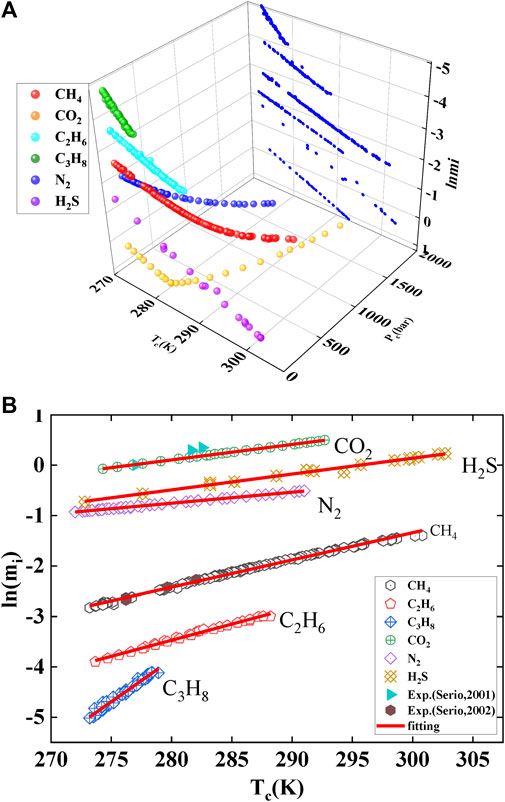
FIGURE 4. Gas saturation solubility under given temperature and pressure conditions. Tc is the phase equilibrium temperature; Pc, is the phase equilibrium pressure; mi, is the gas solubility, ln(mi) refers to the natural logarithm of solubility. Data source: References (Servio and Englezos, 2001; Servio and Englezos, 2002). Panel (A) represents the spatial curve of solubility with temperature and pressure, while panel (B) represents its projection onto the temperature and solubility planes.
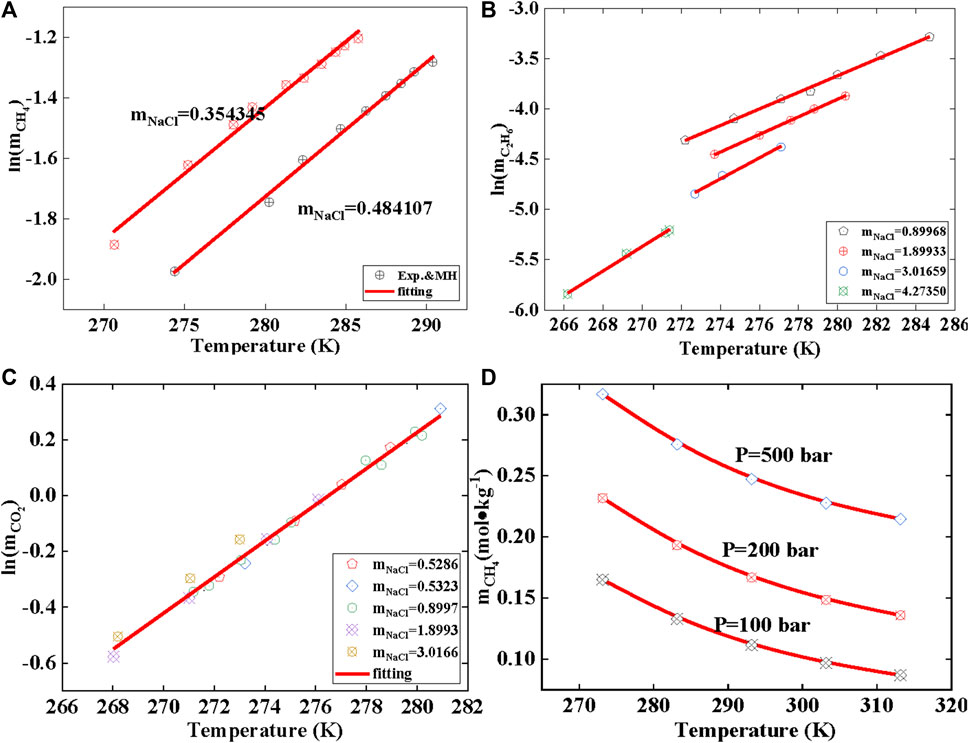
FIGURE 5. Solubility in brine condition and the gas solubility with temperature. Data source: References (Sloan and Koh, 2007). m represents solubility, mol/kg; (A) represents the temperature-dependent solubility of methane at different mineralization levels; (B) represents the temperature-dependent solubility of ethane at different mineralization levels; (C) represents the temperature-dependent solubility of carbon dioxide at different mineralization levels, and (D) represents the temperature-dependent solubility of methane in pure water.
In comparison to the experimental data provided by Servio (Servio and Englezos, 2001; Servio and Englezos, 2002), shows in Figure 4B, the experimental and calculated values for CH4 show good agreement. However, there is a significant deviation between the calculated and experimental values for CO2. This can be explained by the adsorption effect of hydrate (Song et al., 1997). This effect causes the aqueous solution to exhibit a supersaturation phenomenon.
The prediction of methane hydrate phase equilibrium state is shown in Figure 6A; Table 7. As the pressure increases, the value predicted by this model is slightly lower than the experimental value, while the Chen–Guo model and CSMGem predict higher values. The curve of this model for CH4 hydrate follows the trend of the experimental data more closely. This shows that the Chen–Guo model and vdWP thermodynamic models have a similar prediction accuracy for methane hydrates, but it is slightly lower than the prediction accuracy of this model.
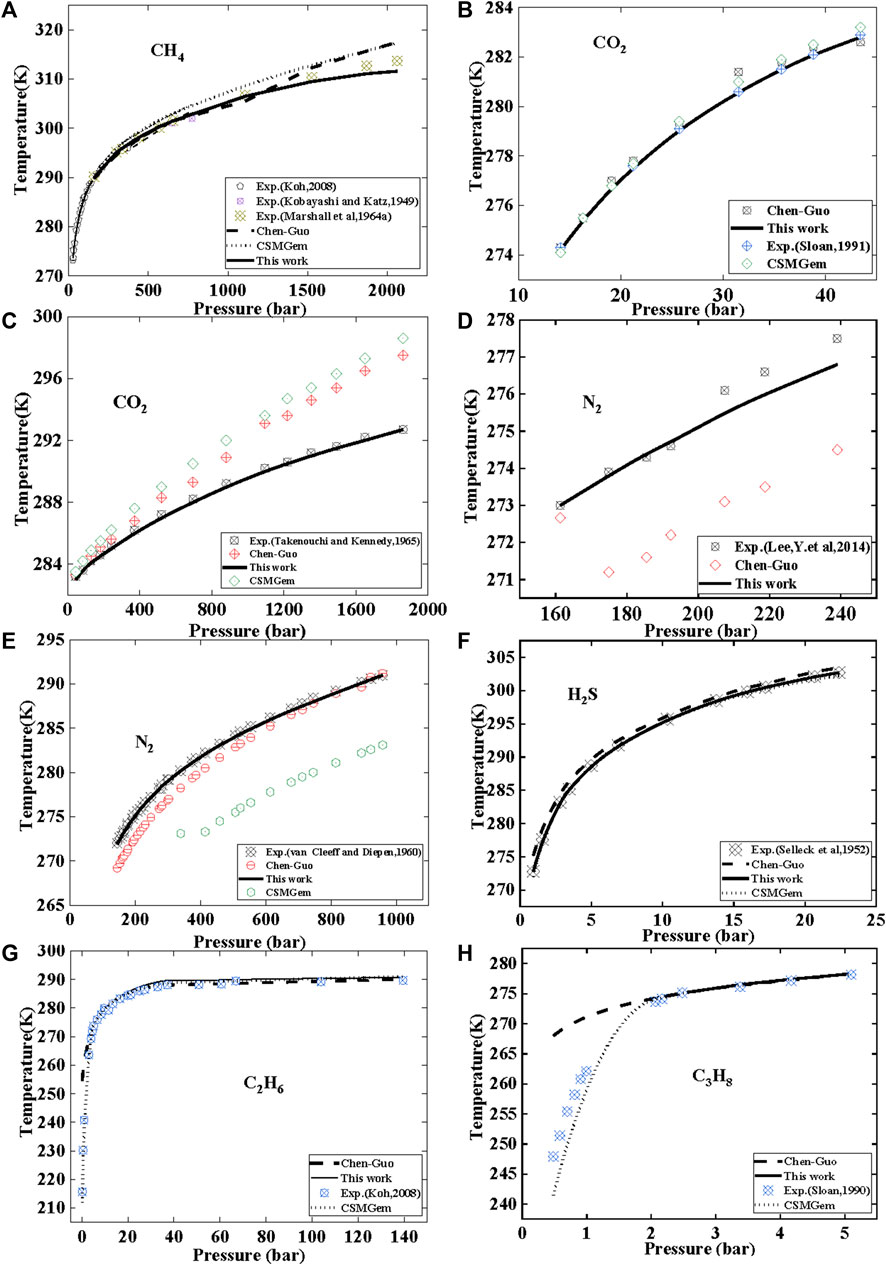
FIGURE 6. Comparison of this model with Chen—Guo model and CSMGem models for predicting the phase equilibrium of common gas hydrates.
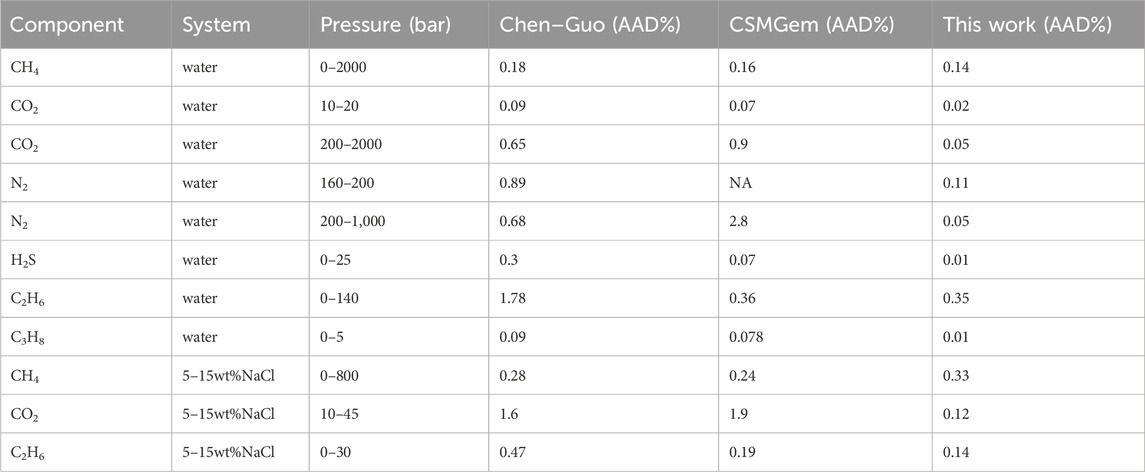
TABLE 7. Comparison in pure water and brine setting. Data (Sloan and Koh, 2007).
For CO2, the results compared with experimental data are shown in Figures 6B, C. At low-pressure conditions (Figure 6B), the prediction accuracy of this model is similar to that of the Chen Guo model and CSMGem. However, under high–pressure conditions (Figure 6C), there is a significant difference in the prediction performance between this model and the Chen–Guo model and CSMGem. This model demonstrates a better ability to predict CO2 hydrate phase equilibrium state compared to the Chen–Guo model and CSMGem, with an AAD of only 0.02%–0.05%, while the Chen–Guo model has an AAD of 0.65%. The results of the Chen–Guo model are close to those of CSMGem, but the Chen–Guo model outperforms CSMGem for CO2.
The prediction of N2 hydrate phase equilibrium state was validated using experimental data, as shown in Figures 6D, E; Table 7. Under medium and low-pressure conditions (Figure 6D), the average absolute deviation (AAD) of this model is lower than that of the Chen-Guo model. Under high pressure (Figure 6E), CSMGem exhibited a significant deviation. Our model has an average absolute deviation (AAD) of 0.05%–0.11%, while the ChenGuo model and CSMGem have AADs of 0.68%–0.89% and 2.8%, respectively.
From Figures 6C–E, it can be seen that there is a significant difference in the prediction between this model and the thermodynamic models Chen Guo and vdWP(CSMGem). The prediction accuracy of this model can even be more than 10 times that of the latter two models. Firstly, this indicates that the model is more in line with experimental data. Secondly, this may be because the formation process of hydrates is a complex process, and thermodynamic models rely on numerous assumptions and empirical parameters. Finally, this also proves that the linear relationship between gas solubility and hydrate equilibrium temperature is worth studying in this article.
Comparing the predictions of the phase equilibrium state of H2S hydrate using three models in Figure 6F; Table 7, the prediction deviation of this model is only 0.1%, while the prediction deviations of the Chen-Guo model and CSMGem software reach 0.3% and 0.07%, respectively. This indicates that this model has an advantage in terms of prediction accuracy.
The results of C2H6 hydrate are shown in Figure 6G; Table 7. It is observed that the AAD of this model is similar to that of CSMGem and better than that of the Chen–Guo model. The prediction results for C3H8 hydrate phase equilibrium state are presented in Figure 6H. The AAD of Chen–Guo mode is similar to that of CSMGem and higher than that of this model. Similar to the Chen–Guo model, this model exhibits a significant deviation below 270 K, but its accuracy is nearly equivalent to that of the Chen–Guo model above 270 K. This deviation is caused by the conversion of the liquid phase to the ice phase when the temperature is below 273.15 K.
From Figure 6, it can be seen that this model has a significant advantage in predicting the equilibrium state of CO2 and N2 hydrates. The prediction accuracy for several hydrates such as CH4, H2S, C2H6, and C3H8 is similar to that of the thermodynamic models Chen–Guo and vdWP. As this model is derived based on GLE theory, it is only applicable to the equilibrium conditions of Liquid Water-Hydrate-Vapor. When the temperature is lower than 273 K, the system enters the ice-hydrate equilibrium phase. This model, along with the Chen–Guo model, shows a significant deviation in the ice-hydrate system. However, CSMGem exhibits a better prediction accuracy below the freezing point temperature.
The comparison of literature data between this model and the Chen–Guo model and CSMGem in brine is shown in Table 7. It shows that the accuracy of these three models is comparable in predicting CH4 hydrate equilibrium. The AAD (average absolute deviation) of this model for predicting CO2 and C2H6 hydrate equilibrium state is only 0.12%–0.33%, whereas the deviations of the Chen–Guo model and CSMGem reach 0.28%–1.6% and 0.19%–1.9%, respectively.
Under the presence of NaCl, the prediction for the CO2 hydrate is shown in Figure 7A. The distance between the red and blue spheres represents the deviation between this model and the experimental data. The AAD of this model for CO2 hydrate under electrolytes is 0.12%, but the deviation increases significantly when the temperature is below 270 K. As the salinity of electrolytes increases, it can be seen that the deviation progressively increases when the salinity of electrolytes over 4 mol/L. The deviation primarily arises from high concentrations of NaCl.
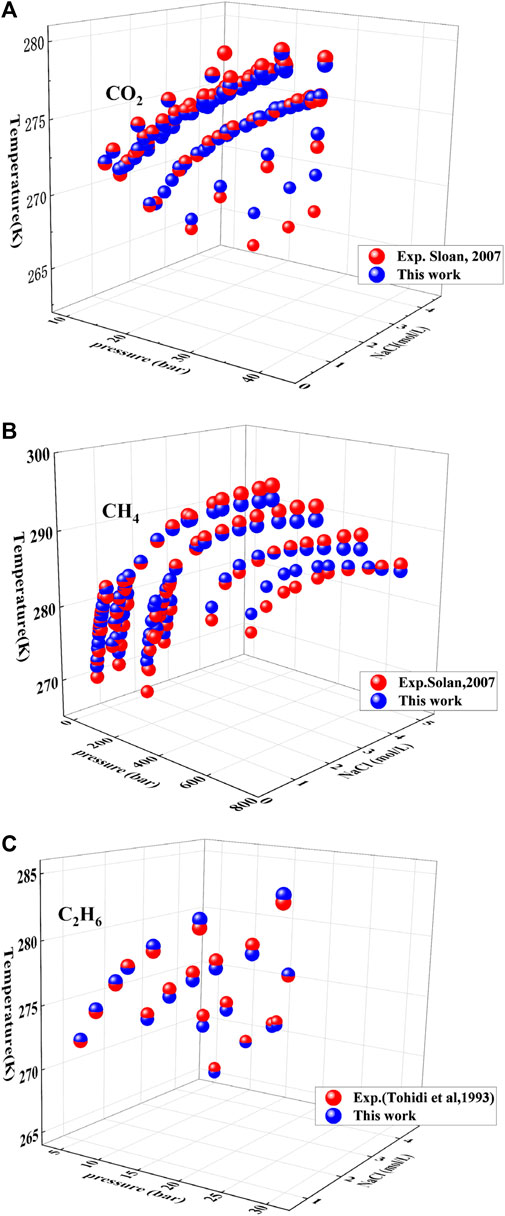
FIGURE 7. Prediction of hydrate under different electrolyte NaC1 concentrations. Data source: References (Sloan and Koh, 2007). (A−C) respectively represent the phase equilibrium prediction effects of this model on carbon dioxide hydrates, methane hydrates, and ethane hydrates in different NaC1 systems. The blue ball represents the predicted value of this model, while the red ball represents the experimental value.
The prediction of CH4 hydrate formation under different NaCl concentrations is shown in Figure 7B, and the AAD of this model is 0.33%. Under low pressure (<200 bar) and low concentration NaCl conditions (<2 mol/L), the two sets of colored spheres almost overlap at the same position, indicating that this model has high predictive accuracy for low temperature, low pressure, and low concentration conditions. The deviation of this model gradually increases with an increase in pressure. Additionally, as the concentration of NaCl increases, the deviation of the model’s prediction also gradually increases. The figure demonstrates that electrolytes with concentrations greater than 4 mol/L have a significant impact on the prediction deviation of the model.
This model has a good prediction effect on hydrate under different NaCl mineralization degrees. The results are shown in Figure 7C, and it shows that the prediction results of this model are consistent with experimental data. Even if the NaCl mineralization degree reaches 4 mol/L, the deviation of the model is still small, and the AAD is 0.14%. Therefore, this model has strong prediction ability for C2H6 hydrate in low pressure condition.
In addition, this work also investigated and compared the improved Chen–Guo model and vdWP model, as shown in Table 8. The results show that compared to existing literature, this model has higher accuracy. The CPA, SRK, and PR equations are essentially cubic equations, and they generally exhibit a trend of increasing deviation under high-pressure conditions. Therefore, whether the cubic equation is coupled with the Chen Guo model or the vdWP model, it may exhibit a trend of increasing deviation under high pressure conditions.
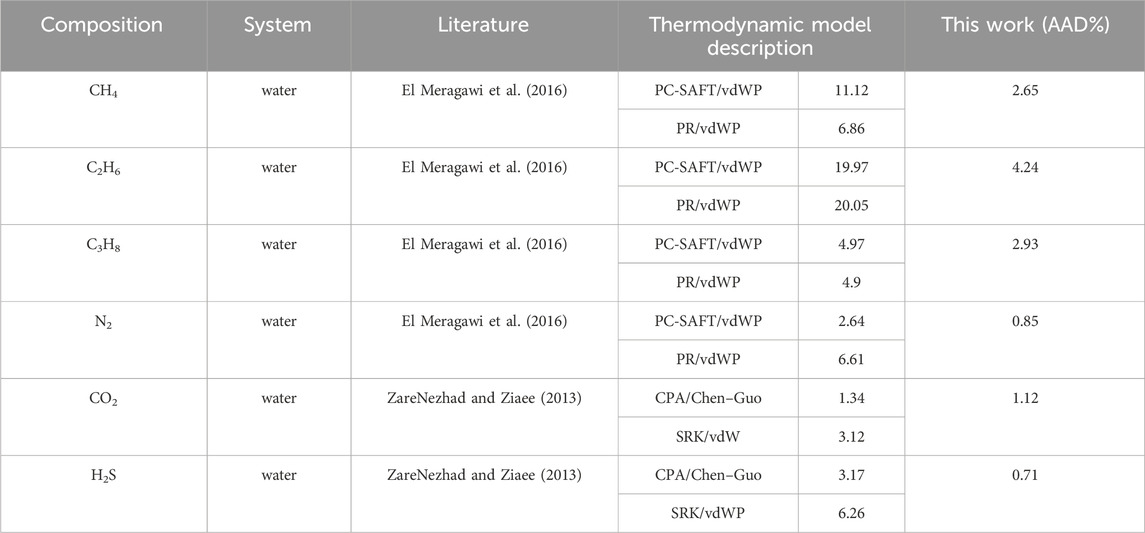
TABLE 8. Comparison with existing literature models for predicting hydrate pressure.
From the above results, it is evident that as the mineralization degree increases, the prediction bias of the solubility model also increases, along with an increase in the calculation bias of the hydrate phase equilibrium state prediction model. This observation indicates that the predictive capability of the solubility model has a significant impact on the predictive ability of the hydrate phase equilibrium state model. Therefore, finding a high-precision solubility model for accurately predicting the phase equilibrium of hydrates holds great significance.
This model was used to predict hydrates under brine conditions, and a comparison was made between this model and two other models, namely, the Chen–Guo model and the vdWP model, to assess their calculation deviations. The results showed that this model exhibited higher accuracy compared to the other two models. On one hand, this demonstrates the reliability of the accuracy of this model. On the other hand, it indicates that there is still a strong linear relationship between gas solubility under brine conditions and the hydrate phase equilibrium temperature. As the salinity increases, the deviations of this model also gradually increase. This may be due to the fact that the calculation deviations of the solubility model also increase with increasing salinity. Additionally, it is known that salts act as hydrate inhibitors. Therefore, evaluating hydrate inhibitors could be a potential future application of this model.
This work investigates the relationship between the phase equilibrium state of hydrate and gas solubility. A prediction model for hydrate phase equilibrium state was constructed based on gas solubility. Firstly, a solubility model based on gas liquid equilibrium theory was constructed and compared with the PR equation and Duan model. The results showed that the MH can predict the gas solubility of CH4, CO2, and N2 within the range of 0–2,000 bar. The deviation between the MH model and the Duan model is less than 2%. In the temperature range of 285–303 K and the NaCl concentration range of 0–6 mol/kg, the deviation of the MH model for CH4, CO2, and N2 ranges from 0% to 5%. The deviation of the MH model for C2H6 solubility increases with higher temperature and mineralization. The MH model outperforms the PR model in calculating the solubility of C2H6 and C3H8 in brine, within the recommended range of salinity 0–4 mol/kg.
Furthermore, this study has found that as the temperature of the hydrates phase equilibrium increases, the gas solubility also increases. There is a strong linear relationship between the natural logarithm of gas solubility and the temperature of hydrate phase equilibrium. By utilizing this linear relationship, an empirical model for predicting the hydrate phase equilibrium state has been constructed. Comparing it to the classical Chen–Guo model and the vdW (CSMGem software) model, it was found that this model can achieve more than 10 times the accuracy of the Chen–Guo model in predicting the phase equilibrium of N2 and CO2 hydrates. Under the condition of 5–20wt% NaCl in brine, has an AAD of only 0.02%–0.05% and higher accuracy compare to the Chen–Guo model and CSGem software. This model is suitable for predicting hydrates of methane, ethane, propane, nitrogen, and hydrogen sulfide.
The proposed model in this work is based on gas solubility and applicable to conditions with Water-gas-hydrate system, such as natural gas pipelines. However, due to the lack of experimental data, the phase equilibrium of hydrates of C3H8, N2, and H2S under brine conditions was not predicted and compared in this work. This will be our focus in future work. In addition, this model may have potential applications in the evaluation of hydrate inhibitors.
The original contributions presented in the study are included in the article/Supplementary material, further inquiries can be directed to the corresponding authors.
JbJ: Writing–original draft, Writing–review and editing, Software, Visualization. JxJ: Funding acquisition, Supervision, Writing–review and editing. JM: Supervision, Writing–review and editing. DL: Formal Analysis, Writing–review and editing. TL: Investigation, Validation, Writing–review and editing. ZP: Project administration, Writing–review and editing.
The author(s) declare financial support was received for the research, authorship, and/or publication of this article. This work was supported by funding from the “Science and Technology Cooperation Project of the China National Petroleum Corporation–Southwest Petroleum University Innovation Alliance” (2020CX030203). The funder was not involved in the study design, collection, analysis, interpretation of data, the writing of this article, or the decision to submit it for publication.
Author DL was employed by Huabei Oilfield Third Oil Production Plant, PetroChina. Author TL was employed by Gas Storage Branch of PetroChina Huabei Oilfield Company. Author ZP was employed by Oil and Gas Technology Research Institute of Huabei Oilfield Company.
The remaining authors declare that the research was conducted in the absence of any commercial or financial relationships that could be construed as a potential conflict of interest.
All claims expressed in this article are solely those of the authors and do not necessarily represent those of their affiliated organizations, or those of the publisher, the editors and the reviewers. Any product that may be evaluated in this article, or claim that may be made by its manufacturer, is not guaranteed or endorsed by the publisher.
Addicks, J., Owren, G. A., Fredheim, A. O., and Tangvik, K. (2002). Solubility of carbon dioxide and methane in aqueous methyldiethanolamine solutions. J. Chem. Eng. Data 47 (4), 855–860. doi:10.1021/je010292z
Benedict, M., Webb, G. B., and Rubin, L. C. (1940). An empirical equation for thermodynamic properties of light hydrocarbons and their mixtures I. Methane, ethane, propane and n-butane. J. Chem. Phys. 8 (4), 334–345. doi:10.1063/1.1750658
Benedict, M., Webb, G. B., and Rubin, L. C. (1951). An empirical equation for thermodynamic properties of light hydrocarbons and their mixtures I. Methane, ethane, propane and n-butane. Fugacities liquid–vapour equilibria 8 (4), 334–345. doi:10.1063/1.1750658
Bermejo, M. D., Martín, A., Florusse, L., Peters, C., and Cocero, M. (2005). The influence of Na2SO4 on the CO2 solubility in water at high pressure. Fluid Phase Equilibria 238 (2), 220–228. doi:10.1016/j.fluid.2005.10.006
Blount, C. W., and Price, L. C. (1982). Solubility of methane in water under natural conditions: a laboratory study. United States: OSTI, 56–58.
Byrne, S., and Byrne, P. A. (1982). Salting-out of methane in single-salt solutions at 25°C and below 800 psia. Geochimica Cosmochimica Acta 46 (8), 1327–1332. doi:10.1016/0016-7037(82)90268-x
Chabab, S., Théveneau, P., Corvisier, J., Coquelet, C., Paricaud, P., Houriez, C., et al. (2019). Thermodynamic study of the CO2-H2O-NaCl system: measurements of CO2 solubility and modeling of phase equilibria using Soreide and Whitson, electrolyte CPA and SIT models. Int. J. Greenh. Gas Control 91, 102825–102848. doi:10.1016/j.ijggc.2019.102825
Chapoy, A., Coquelet, C., and Richon, D. (2003). Solubility measurement and modeling of water in the gas phase of the methane/water binary system at temperatures from 283.08 to 318.12 K and pressures up to 34.5 MPa. Fluid Phase Equilibria 214 (1), 101–117. doi:10.1016/s0378-3812(03)00322-4
Chapoy, A., Mohammadi, A. H., Richon, D., and Tohidi, B. (2004). Gas solubility measurement and modeling for methane–water and methane–ethane–n-butane–water systems at low temperature conditions. Fluid phase equilibria 220 (1), 113–121. doi:10.1016/j.fluid.2004.02.010
Chen, G. J., and Guo, T. M. (1996). Thermodynamic modeling of hydrate formation based on new concepts. Fluid Phase Equilibria 122 (1-2), 43–65. doi:10.1016/0378-3812(96)03032-4
Chen, G.-J., and Guo, T.-M. (1998). A new approach to gas hydrate modelling. Chem. Eng. J. 71 (2), 145–151. doi:10.1016/s1385-8947(98)00126-0
Cheng, C., Wang, F., Tian, Y., Wu, X., Zheng, J., Zhang, J., et al. (2020). Review and prospects of hydrate cold storage technology. Renew. Sustain. Energy Rev. 117, 109492–109523. doi:10.1016/j.rser.2019.109492
Creek, J. (2012). Efficient hydrate plug prevention. Energy and Fuels 26 (7), 4112–4116. doi:10.1021/ef300280e
Culberson, O. L., and Mcketta, J. J. (1951). Phase equilibria in hydrocarbon-water systems III - the solubility of methane in water at pressures to 10,000 PSIA. J. Petroleum Technol. 3 (08), 223–226. doi:10.2118/951223-g
Dalmolin, I., Skovroinski, E., Biasi, A., Corazza, M., Dariva, C., and Oliveira, J. V. (2006). Solubility of carbon dioxide in binary and ternary mixtures with ethanol and water. Fluid Phase Equilibria 245 (2), 193–200. doi:10.1016/j.fluid.2006.04.017
Dohrn, R., Bünz, A. P., Devlieghere, F., and Thelen, D. (1993). Experimental measurements of phase equilibria for ternary and quaternary systems of glucose, water, CO2 and ethanol with a novel apparatus. Fluid Phase Equilibria 83 (83), 149–158. doi:10.1016/0378-3812(93)87017-u
D'Souza, R., Patrick, J. R., and Teja, A. S. (1988). High pressure phase equilibria in the carbon dioxide -n-Hexadecane and carbon dioxide — water systems. Can. J. Chem. Eng. 66 (2), 319–323. doi:10.1002/cjce.5450660221
Duan, Z., and Mao, S. (2006). A thermodynamic model for calculating methane solubility, density and gas phase composition of methane-bearing aqueous fluids from 273 to 523 K and from 1 to 2000 bar. Geochimica Cosmochimica Acta 70 (13), 3369–3386. doi:10.1016/j.gca.2006.03.018
Duan, Z., and Sun, R. (2003). An improved model calculating CO2 solubility in pure water and aqueous NaCl solutions from 273 to 533 K and from 0 to 2000 bar. Chem. Geol. 193 (3), 257–271. doi:10.1016/s0009-2541(02)00263-2
Duan, Z., Sun, R., Liu, R., and Zhu, C. (2007). Accurate thermodynamic model for the calculation of H2S solubility in pure water and brines. Energy and Fuels 21 (4), 2056–2065. doi:10.1021/ef070040p
Duan, Z. H., Moller, N., and Weare, J. H. (1992). An equation of state for the CH4-CO2-H2O system: I. Pure systems from 0 to 1000°C and 0 to 8000 bar. Academia 56 (7), 2605–2617. doi:10.1016/0016-7037(92)90347-l
El Meragawi, S., Diamantonis, N. I., Tsimpanogiannis, I. N., and Economou, I. G. (2016). Hydrate–fluid phase equilibria modeling using PC-SAFT and Peng–Robinson equations of state. Fluid Phase Equilibria 413, 209–219. doi:10.1016/j.fluid.2015.12.003
Fonseca, I., Almeida, J., and Fachada, H. C. (2007). Automated apparatus for gas solubility measurements. J. Chem. Thermodyn. 39 (10), 1407–1411. doi:10.1016/j.jct.2007.05.013
Gao, J., Zheng, D. Q., and Guo, T. M. (1997). Solubilities of methane, nitrogen, carbon dioxide, and a natural gas mixture in aqueous sodium bicarbonate solutions under high pressure and elevated temperature. J. Chem. Eng. Data 42 (1), 69–73. doi:10.1021/je960275n
Hassan, M. H. A., Sher, F., Zarren, G., Suleiman, N., Tahir, A. A., and Snape, C. E. (2020). Kinetic and thermodynamic evaluation of effective combined promoters for CO2 hydrate formation. J. Nat. Gas Sci. Eng. 78, 103313. doi:10.1016/j.jngse.2020.103313
He, Z. J., Linga, P., and Jiang, J. W. (2017). What are the key factors governing the nucleation of CO2hydrate? Phys. Chem. Chem. Phys. 19 (24), 15657–15661. doi:10.1039/c7cp01350g
hoon Sohn, Y., Kim, J., Shin, K., Chang, D., Seo, Y., Aman, Z. M., et al. (2015). Hydrate plug formation risk with varying watercut and inhibitor concentrations. Chem. Eng. Sci. 126, 711–718. doi:10.1016/j.ces.2015.01.016
Katz, D. L. (1945). Prediction of conditions for hydrate formation in natural gases. Trans. AIME 160 (01), 140–149. doi:10.2118/945140-g
Khamehchi, E., Shamohammadi, E., and Yousefi, S. H. (2013). Predicting the hydrate formation temperature by a new correlation and neural network. Gas Process. J. 1, 41–50. doi:10.22108/GPJ.2013.20158
Khan, M. N., Warrier, P., Peters, C. J., and Koh, C. A. (2018). Advancements in hydrate phase equilibria and modeling of gas hydrates systems. Fluid Phase Equilibria 463, 48–61. doi:10.1016/j.fluid.2018.01.014
Kim, Y., Ryu, S., Yang, S. O., and Lee, C. S. (2003). Liquid water−hydrate equilibrium measurements and unified predictions of hydrate-containing phase equilibria for methane, ethane, propane, and their mixtures. Industrial Eng. Chem. Res. 42 (11), 2409–2414. doi:10.1021/ie0209374
Klauda, J. B., and Sandler, S. I. (2000). A fugacity model for gas hydrate phase equilibria. Industrial Eng. Chem. Res. 39 (9), 3377–3386. doi:10.1021/ie000322b
Kobayashi, R., and Katz, D. (1953). Vapor-liquid equilibria for binary hydrocarbon-water systems. Industrial Eng. Chem. 45 (2), 440–446. doi:10.1021/ie50518a051
Kontogeorgis, G. M., Michelsen, M. L., Folas, G. K., Derawi, S., von Solms, N., and Stenby, E. H. (2006). Ten years with the CPA (Cubic-Plus-Association) equation of state. Part 1. Pure compounds and self-associating systems. Industrial Eng. Chem. Res. 45 (14), 4855–4868. doi:10.1021/ie051305v
Koschel, D., Coxam, J. Y., Rodier, L., and Majer, V. (2006). Enthalpy and solubility data of CO2 in water and NaCl(aq) at conditions of interest for geological sequestration. Fluid Phase Equilibria 247 (1-2), 107–120. doi:10.1016/j.fluid.2006.06.006
Lee, H., Lee, J. W., Kim, D. Y., Park, J., Seo, Y. T., Zeng, H., et al. (2005). Tuning clathrate hydrates for hydrogen storage. Nature 434, 743–746. doi:10.1038/nature03457
Lekvam, K., and Bishnoi, P. R. (1997). Dissolution of methane in water at low temperatures and intermediate pressures. Fluid Phase Equilibria 131 (1), 297–309. doi:10.1016/s0378-3812(96)03229-3
Li, D., and Duan, Z. (2007). The speciation equilibrium coupling with phase equilibrium in the H2O-CO2-NaCl system from 0 to 250 °C, from 0 to 1000 bar, and from 0 to 5 molality of NaCl. Chem. Geol. 244 (3-4), 730–751. doi:10.1016/j.chemgeo.2007.07.023
Li, J., Zhang, Z., Luo, X., and Li, X. (2015). Modelling of phase equilibria in CH4-C2H6-C3H8-nC4H10-NaCl-H2O systems. Appl. Geochem. 56, 23–36. doi:10.1016/j.apgeochem.2015.02.006
Li, S., Li, Y., Yang, L., Chen, Y., Shao, Y., Sun, J., et al. (2019). Prediction of phase equilibrium of methane hydrate below 272.2 K based on different equations of state. Fluid Phase Equilibria 490, 61–67. doi:10.1016/j.fluid.2018.12.026
Li, Z., Wang, X., Xue, Q., and Liu, M. (2018). “Calculation for solubility of methane and carbon dioxide in water in presence of hydrate,” in ISOPE International Ocean and Polar Engineering Conference, Sapporo, Japan, June 10–15, 2018.
Liehui, Z., Dengwei, L., and Yu, X. (2006). The experimental researches on phase equilibrium of natural gas hydrates. Nat. Gas. Ind. 26 (3), 129–130. doi:10.3321/j.issn:1000-0976.2006.03.041
Luis, H., and Smith, N. O. (1978). The high pressure solubility of methane in aqueous calcium chloride and aqueous tetraethylammonium bromide. Partial molar properties of dissolved methane and nitrogen in relation to water structure. J. Phys. Chem. B 82 (2), 186–191. doi:10.1021/j100491a012
Lv, Q., Zang, X., Li, X., and Li, G. (2018). Effect of seawater ions on cyclopentane-methane hydrate phase equilibrium. Fluid Phase Equilibria 458, 272–277. doi:10.1016/j.fluid.2017.11.031
Mao, S., and Duan, Z. (2006). A thermodynamic model for calculating nitrogen solubility, gas phase composition and density of the N2–H2O–NaCl system. Fluid Phase Equilibria 248 (2), 103–114. doi:10.1016/j.fluid.2006.07.020
Mao, S., Lü, M., and Shi, Z. (2017). Prediction of the PVTx and VLE properties of natural gases with a general Helmholtz equation of state. Part I: application to the CH4 -C2H6 -C3H8 -CO2 -N2 system. Geochimica Cosmochimica Acta 219, 74–95. doi:10.1016/j.gca.2017.09.025
Mao, S., Zhang, D., Li, Y., and Liu, N. (2013). An improved model for calculating CO2 solubility in aqueous NaCl solutions and the application to CO2–H2O–NaCl fluid inclusions. Chem. Geol. 347, 43–58. doi:10.1016/j.chemgeo.2013.03.010
Mishnina, T. A., Avdeeva, O. I., and Bozhovskaya, T. K. (1961). Solubility of gases in natural waters depending on temperature, pressure and salt composition. Mater. Vses. Nauchn. Issled. Geol. Inst. 46, 93–110. doi:10.1016/j.apgeochem.2015.02.006
Mohamadi-Baghmolaei, M., Hajizadeh, A., Azin, R., and Izadpanah, A. A. (2018). Assessing thermodynamic models and introducing novel method for prediction of methane hydrate formation. J. Petroleum Explor. Prod. Technol. 8, 1401–1412. doi:10.1007/s13202-017-0415-2
Mohammadi, A. H., Chapoy, A., Tohidi, B., and Richon, D. (2004). Measurements and thermodynamic modeling of vapor− liquid equilibria in ethane− water systems from 274.26 to 343.08 K. Industrial Eng. Chem. Res. 43 (17), 5418–5424. doi:10.1021/ie049747e
Mohammadi, A. H., and Richon, D. (2008). Thermodynamic model for predicting liquid water−hydrate equilibrium of the water−hydrocarbon system. Industrial Eng. Chem. Res. 47 (4), 1346–1350. doi:10.1021/ie0709640
Morrison, T. J., and Billett, F. (1952). 730. The salting-out of non-electrolytes. Part II. The effect of variation in non-electrolyte. J. Chem. Soc. 1952, 3819–3822. doi:10.1039/jr9520003819
Moshfeghian, H. M., Azin, R., Hassanzadeh, H., and Moshfeghian, M. (2012). Mutual solubility of CH4, CO2, H2S, and their mixtures in brine under subsurface disposal conditions. Fluid Phase Equilibria 324, 80–93. doi:10.1016/j.fluid.2012.03.017
O'Sullivan, T. D., and Smith, N. O. (1970). Solubility and partial molar volume of nitrogen and methane in water and in aqueous sodium chloride from 50 to 125.deg. and 100 to 600 atm. J. Phys. Chem. 74 (7), 1460–1466. doi:10.1021/j100702a012
O'Sullivan, T. D., smith, N. O., and Nagy, B. (1966). Solubility of natural gases in aqueous salt solutions—III nitrogen in aqueous NaCl at high pressures. Geochimica Cosmochimica Acta 30 (6), 617–619. doi:10.1016/0016-7037(66)90015-9
Peng, D. Y., and Robinson, D. B. (1976). New two-constant equation of state. Industrial Eng. Chem. Fundam. 15 (1), 3069–3078. doi:10.1021/i160057a011
Pitzer, K. S., Peiper, J. C., and Busey, R. H. (1984). Thermodynamic properties of aqueous sodium chloride solutions. J. Phys. Chem. Reference Data 13 (1), 1–102. doi:10.1063/1.555709
Price, L. C. (1979). Aqueous solubility of methane at elevated pressures and temperatures. Aapg Bull. 63 (9), 1527–1533. doi:10.1306/2F9185E0-16CE-11D7-8645000102C1865D
Prutton, C., and Savage, R. L. (1945). The solubility of carbon dioxide in calcium chloride-water solutions at 75, 100, 120° and high Pressures1. J. Am. Chem. Soc. 67 (9), 1550–1554. doi:10.1021/ja01225a047
Qin, X., Liang, Q., Ye, J., Yang, L., Qiu, H., Xie, W., et al. (2020). The response of temperature and pressure of hydrate reservoirs in the first gas hydrate production test in South China Sea. Appl. Energy 278, 115649. doi:10.1016/j.apenergy.2020.115649
Quon, H., and Jiang, S. (2023). Decision making for implementing non-traditional water sources: a review of challenges and potential solutions. npj Clean. Water 6 (1), 56–14. doi:10.1038/s41545-023-00273-7
Rezania, P., Ranjbar, V., and Nasrifar, K. (2021). High pressure solubility of light gases (CH4, C2H6, C3H8, H2S, CO2, N2, Xe, Ar and Kr) and certain gas mixtures in water from cubic equations of state. J. Solut. Chem. 50, 1169–1188. doi:10.1007/s10953-021-01110-6
Rowlinson, J. S. (1971). The principles of chemical equilibrium: kenneth denbigh. 3rd Edn. Cambridge: University Press, 1195.
Rumpf, B., and Maurer, G. (1994). Solubility of ammonia in aqueous solutions of phosphoric acid: model development and application. J. Solut. Chem. 23 (1), 37–51. doi:10.1007/bf00972606
Sahu, P., Krishnaswamy, S., Ponnani, K., and Pande, N. K. (2018). A thermodynamic approach to selection of suitable hydrate formers for seawater desalination. Desalination 436, 144–151. doi:10.1016/j.desal.2018.02.001
Sami, N. A., Das, K., Sangwai, J. S., and Balasubramanian, N. (2013). Phase equilibria of methane and carbon dioxide clathrate hydrates in the presence of (methanol+ MgCl2) and (ethylene glycol+ MgCl2) aqueous solutions. J. Chem. Thermodyn. 65, 198–203. doi:10.1016/j.jct.2013.05.050
Servio, P., and Englezos, P. (2001). Effect of temperature and pressure on the solubility of carbon dioxide in water in the presence of gas hydrate. Fluid phase equilibria 190 (1-2), 127–134. doi:10.1016/s0378-3812(01)00598-2
Servio, P., and Englezos, P. (2002). Measurement of dissolved methane in water in equilibrium with its hydrate. J. Chem. Eng. Data 47 (1), 87–90. doi:10.1021/je0102255
Shibue, Y. (2003). Vapor pressures of aqueous NaCl and CaCl2 solutions at elevated temperatures. Fluid Phase Equilibria 213 (1-2), 39–51. doi:10.1016/s0378-3812(03)00284-x
Sloan, E. D., and Koh, C. A. (2007). Clathrate hydrates of natural gases. 3rd edition. United States: CRC Press, 360–500.
Soave, G. (1972). Equilibrium constants from a modified Redlich-Kwong equation of state. Chem. Eng. Sci. 27 (6), 1197–1203. doi:10.1016/0009-2509(72)80096-4
Song, K., Feneyrou, G., Fleyfel, F., Martin, R., Lievois, J., and Kobayashi, R. (1997). Solubility measurements of methane and ethane in water at and near hydrate conditions. Fluid phase equilibria 128 (1-2), 249–259. doi:10.1016/s0378-3812(96)03165-2
Span, R., and Wagner, W. (1996). A new equation of state for carbon dioxide covering the fluid region from the triple-Point temperature to 1100 K at pressures up to 800 MPa. J. Phys. Chem. Ref. Data 25 (6), 1509–1596. doi:10.1063/1.555991
Stoessell, R. K., and Byrne, P. A. (1982). Salting-out of methane in single-salt solutions at 25°C and below 800 psia. Geochimica Cosmochimica Acta 46 (8), 1327–1332. doi:10.1016/0016-7037(82)90268-x
Strobel, T. A., Hester, K. C., Koh, C. A., Sum, A. K., and Sloan, E. D. (2009). Properties of the clathrates of hydrogen and developments in their applicability for hydrogen storage. Chem. Phys. Lett. 478 (4-6), 97–109. doi:10.1016/j.cplett.2009.07.030
Takenouchi, S., and Kennedy, G. C. (1964). The binary system H2O+CO2 at High temperatures and pressures. Am. J. Sci. 262 (9), 1055–1074. doi:10.2475/ajs.262.9.1055
Tödheide, K., and Franck, E. U. (1963). Das zweiphasengebiet und die kritische kurve im system Kohlendioxid–Wasser bis zu drucken von 3500 bar. Z. für Phys. Chem. 37, 387–401. doi:10.1524/zpch.1963.37.5_6.387
Valtz, A., Chapoy, A., Coquelet, C., Paricaud, P., and Richon, D. (2015). Vapour–liquid equilibria in the carbon dioxide–water system, measurement and modelling from 278.2 to 318.2K. Fluid Phase Equilibria 226 (3), 333–344. doi:10.1016/j.fluid.2004.10.013
Van Denderen, M., Ineke, E., and Golombok, M. (2012). CO2 removal from contaminated natural gas mixtures by hydrate formation. Industrial Eng. Chem. Res. 48 (12), 5802–5807. doi:10.1021/ie8017065
Waals, J. H. v.d., and Platteeuw, J. C. (1958). Clathrate solutions. Adv. Chem. Phys. 2, 1–57. doi:10.1002/9780470143483.ch1
Waals, J. H. V. D., and Platteeuw, J. C. (2007). Clathrate solutions. Adv. Chem. Phys. 2, 1–57. doi:10.1002/9780470143483.ch1
Wang, L.-B., Cui, J.-L., Sun, C. Y., Ma, Q. L., Fan, S. S., Wang, X. H., et al. (2021b). Review on the applications and modifications of the Chen–Guo model for hydrate formation and dissociation. Energy and Fuels 35 (4), 2936–2964. doi:10.1021/acs.energyfuels.0c03977
Wang, X.-H., Xu, X.-J., Cai, J., Zheng, H. X., Chen, Y. X., Pang, W. X., et al. (2023). CO2 concentration in aqueous solution from gas–liquid equilibrium system to gas–liquid–hydrate coexistence system. Gas Sci. Eng. 115, 205024. doi:10.1016/j.jgsce.2023.205024
Wang, Y., Lang, X., Fan, S., Wang, S., Yu, C., and Li, G. (2021a). Review on enhanced technology of natural gas hydrate recovery by carbon dioxide replacement. Energy and Fuels 35 (11), 3659–3674. doi:10.1021/acs.energyfuels.0c04138
Wiebe, R., and Gaddy, V. L. (2002a). The solubility in liquid ammonia of hydrogen at 0° and of nitrogen at 0, 50, 75, 90 and 100° at pressures to 1000 atmospheres. Critical phenomena of ammonia-nitrogen Mixtures1. J. Am. Chem. Soc. 59 (10), 1984–1987. doi:10.1021/ja01289a055
Wiebe, R., Gaddy, V. L., and Heins, C. (1933). The solubility of nitrogen in water at 50, 75 and 100° from 25 to 1000 atmospheres. J. Am. Chem. Soc. 55 (3), 947–953. doi:10.1021/ja01330a011
Wiebe, R., and Gaddy, V. L. (2002b). The solubility in water of carbon dioxide at 50, 75 and 100°, at pressures to 700 atmospheres. J. Am. Chem. Soc. 61 (2), 315–318. doi:10.1021/ja01871a025
Xu, H., Jiao, Z., Zhang, Z., Huffman, M., and Wang, Q. (2021). Prediction of methane hydrate formation conditions in salt water using machine learning algorithms. Comput. Chem. Eng. 151, 107358. doi:10.1016/j.compchemeng.2021.107358
Yang, M., Song, Y., and Liu, Y. (2011). Effects of porous media and salinity on phase equilibrium of methane hydrates. J. Dalian Univ. Technol. 51 (1), 31–35. doi:10.1007/s12182-011-0123-3
Yarym-Agaev, N. L., Sinyavskaya, R. P., and Koliushko, I. I. (1985). Phase equilibria in the water-methane and methanol-methane binary systems under high pressures. J. Appl. Chem. USSR 58 (1), 154–157.
ZareNezhad, B., and Ziaee, M. (2013). Accurate prediction of H2S and CO2 containing sour gas hydrates formation conditions considering hydrolytic and hydrogen bonding association effects. Fluid Phase Equilibria 356, 321–328. doi:10.1016/j.fluid.2013.07.055
Zhang, J., Wang, Z., Liu, S., Zhang, W., Yu, J., and Sun, B. (2019a). Prediction of hydrate deposition in pipelines to improve gas transportation efficiency and safety. Appl. Energy 253, 113521. doi:10.1016/j.apenergy.2019.113521
Zhang, J., Wang, Z., Sun, B., Sun, X., and Liao, Y. (2019b). An integrated prediction model of hydrate blockage formation in deep-water gas wells. Int. J. Heat Mass Transf. 140, 187–202. doi:10.1016/j.ijheatmasstransfer.2019.05.039
Keywords: natural gas hydrate, gas solubility, prediction model, phase equilibrium, temperature, pressure
Citation: Jiang J, Jiang J, Mao J, Li D, Liu T and Pan Z (2024) A novel model to predict phase equilibrium state of hydrates from the relationship of gas solubility. Front. Energy Res. 12:1378754. doi: 10.3389/fenrg.2024.1378754
Received: 30 January 2024; Accepted: 01 March 2024;
Published: 14 March 2024.
Edited by:
Fei Wang, Qingdao University of Science and Technology, ChinaReviewed by:
Roshan Raman, The Northcap University, IndiaCopyright © 2024 Jiang, Jiang, Mao, Li, Liu and Pan. This is an open-access article distributed under the terms of the Creative Commons Attribution License (CC BY). The use, distribution or reproduction in other forums is permitted, provided the original author(s) and the copyright owner(s) are credited and that the original publication in this journal is cited, in accordance with accepted academic practice. No use, distribution or reproduction is permitted which does not comply with these terms.
*Correspondence: Jianxun Jiang, amlhbnh1bl9qaWFuZ0AxNjMuY29t; Jinchen Mao, bGl2ZW4yMDE0QHllYWgubmV0
Disclaimer: All claims expressed in this article are solely those of the authors and do not necessarily represent those of their affiliated organizations, or those of the publisher, the editors and the reviewers. Any product that may be evaluated in this article or claim that may be made by its manufacturer is not guaranteed or endorsed by the publisher.
Research integrity at Frontiers
Learn more about the work of our research integrity team to safeguard the quality of each article we publish.