 Yanhe Yin1
 Yi Zhong
94% of researchers rate our articles as excellent or good
Learn more about the work of our research integrity team to safeguard the quality of each article we publish.
Find out more
ORIGINAL RESEARCH article
Front. Energy Res. , 23 May 2024
Sec. Sustainable Energy Systems
Volume 12 - 2024 | https://doi.org/10.3389/fenrg.2024.1378067
This article is part of the Research Topic Low-Carbon Oriented Improvement Strategy for Flexibility and Resiliency of Multi-Energy Systems View all 24 articles
Load models have a significant influence on power system simulation. However, current load modeling approaches can hardly satisfy the diversity and time-varying characteristics of loads [including electric vehicles (EVs) and battery storage] in terms of model accuracy and computing efficiency. An online modeling method for composite load models based on measurement information is proposed in this paper. Firstly, the dominant factors in load model output are analyzed based on the active subspace of parameter space. Then the clustering algorithm is applied to cluster the large number of underlying loads based on the characteristics of load daily output curves. Finally, the underlying loads are equivalently aggregated from the low voltage levels to the high voltage levels to construct the composite load model. Simulation results obtained based on PSCAD/EMTDC demonstrate that the load model constructed by the proposed approach can accurately reflect the actual load characteristics of a power system.
Simulation analysis is an important means to study the steady state and transient characteristics of the power system, which is carried out through the establishment of the power system source, network, and load simulation model, taking the initial trend results as a starting point, and using numerical methods to iteratively solve for each state response quantity of the system so as to carry out the inversion of accidents or fault preview (Zhang et al., 2022). Therefore, the accuracy of the simulation model is an important guarantee for the reliability of the simulation analysis results (Zhang et al., 2021; Qian et al., 2023).
However, the models used in the current simulation analysis have not been able to accurately reflect the real characteristics of complex power systems, and it is difficult to accurately invert and reproduce the real faults occurring in some actual power grids by means of simulation (Zhang et al., 2017). Among them, the accuracy of the load model is doubtful, which is an important reason affecting the simulation results, and the diversity of the power system network structure and the expansion of the scale of new load access further increase the difficulty of load modeling (Xu et al., 2023). Compared with traditional vehicles, new energy vehicles have the advantages of low pollution, high energy efficiency, and low operating costs. The operation benefit of order charging is verified by constructing order charging on the power grid side.
Currently, a large number of studies have been carried out for load modeling. The comprehensive load model composed of static constant impedance, constant current, constant power components, and dynamic induction motor components is widely used in power system simulation due to its good generalization ability (Overbye, 1994; Zalok and Eduful, 2013; Camille et al., 2021). On this basis, related studies have proposed model construction and parameter identification methods, which can be mainly categorized into two types based on constituent components (Chen et al., 1997; Zhang et al., 2023) and measurement information (Ma et al., 2008; Zhang et al., 2020a). Component-based methods divide the loads according to types and then characterize different types of loads with typical static loads or motor loads, but the statistical work efficiency is low and the dynamic changes of loads are ignored. The method based on measurement information regards all kinds of loads as a black box model and makes the simulation response output consistent with the measured response by identifying its parameters so as to reflect the real dynamic characteristics of the system and be used for power system simulation analysis, but the complex structure of the load model and its high-dimensional nonlinear parameter space lead to computational speed and efficiency that are still low. The vigorous development of electric vehicles is of the utmost significance to adjust the optimal design of industrial structures and promote the sustainable development of industry. In view of the problems existing in the development of electric vehicles at the present stage, the state focuses on the research and development of charging problems for electric vehicles and carries out research on the safety and power supply of charging equipment at the present stage so as to form a safe and effective charging safety system.
In order to reduce the complexity of load modeling, literature (Zhang et al., 2021b) proposes a comprehensive load simplification model based on the dominant parameter selection, which transforms the induction motor model into a second-order equation of state; literature (Han et al., 2022) proposes a fast calculation method for the parameters of the comprehensive load model based on the sensitivity analysis; and some researchers use intelligent optimization algorithms (Wang et al., 2018; Hu et al., 2022) or machine learning algorithms (Cui et al., 2019; Bu et al., 2020; Hu et al., 2023) for the overall identification of the model parameters. These studies aim to reduce the parameter space of the load model or increase the parameter calculation rate to simplify the complexity of load modeling. However, the electrical quantity measurement is usually targeted at nodes of higher voltage levels, and it is difficult to obtain all the underlying load information of the lower voltage levels of the distribution network, and its iterative or training process often requires sample labels, i.e., the exact values of the parameters to be measured corresponding to the observed quantities, which are usually difficult to know in advance in practical applications especially in the transmission system (Tsekouras et al., 2007; Zhang et al., 2020b; Zhang et al., 2020c; Zhang et al., 2021c).
Aiming at the above problems, this paper proposes an online modeling method for integrated load models based on measurement information. On the basis of analyzing and identifying the dominant factors of the external characteristics of the comprehensive load model, the bottom load is clustered according to the load curve, and the comprehensive load equivalent aggregation model is constructed by aggregating equivalently from the low voltage level to the high voltage level step by step. The proposed method is simulated, analyzed, and validated based on the PSCAD/EMPDC platform.
The integrated load model generally refers to a load model composed of induction motors and static loads in a certain proportion. Obviously, the external characteristics of the integrated load model are related to the composition ratio of each type of load and the parameters of its internal model, and it is necessary to analyze and identify the dominant factors affecting the external characteristics of the integrated load model before carrying out the integrated load equivalent modeling. This section identifies the dominant factors in the characteristics of the integrated load model based on the activation subspace approach. The activation subspace is a low-dimensional linear subspace of the parameter space that allows for a global assessment of the sensitivity of the output variables with respect to the parameters.
Consider a parameterization function that maps the parameters of the system to the scalar output of interest, where C denotes the canonical set of parameter values:
In Eq. 3, the joint probability function of the parameters satisfies:
For any smooth function, in the reduced-dimensional case, the matrix C is called the average generalized derivative, which weights the input values according to the density. A single normalization parameter is a random variable with values in the range [−1, 1] that represents a parameter in the original model. The matrix C is the average of the gradient and its own outer product.
From Eq. 1, the elements of C are the average of the product of partial derivatives, which can be regarded as the parameter sensitivity:
In (4), Cij is the (i,j) element of C and m denotes the number of parameters. Since the matrix C is symmetric, the spectral eigen-decomposition can be performed, as shown in Eq. 5.
where W is a column of the orthogonal matrix, is the standard orthogonal eigenvector of C,
It can be seen that the eigenvalue of matrix C is the mean square directional derivative in the direction of the corresponding eigenvector. If the eigenvalue is very small, it indicates insensitivity in the direction of the corresponding eigenvector. On the contrary, the larger the eigenvalue, the more significant the change in the direction of the corresponding eigenvector.
The eigenvalues can be separated from the eigenvectors based on the magnitude of the eigenvalues, shown in Eq. 6:
where
The integrated load model in our study includes parameters like Distributed Network Reactance, Inductive Motor Active Power Proportion, Load Ratio, Stator Reactance, Constant Reactance Load Proportion, Direct Current Side Capacitor, and Photovoltaic Output Equivalent Reactance. These parameters significantly shape the external characteristics of the load model and should be compared with the model discussed in this paper.
Since W is orthogonal, any parameter vector can be expressed as:
In Eq. 7,
Then any parameter vector-sensitive output is shown in Eq. 8:
From the definitions of W1 and W2, it can be seen that a small perturbation has little effect on the value of On the contrary, small perturbations can significantly change Based on this property, the range of W1 is defined as the activation subspace, and the range of W2 is defined as the corresponding inactivation subspace of the model. The above subspaces describe the sensitivity of the model outputs to parameter changes.
Distributed Network Reactance affects the load’s impedance, while Inductive Motor Active Power Proportion and Load Ratio determine the proportion of induction motors and static loads, influencing dynamic behavior. Stator Reactance and Constant Reactance Load Proportion impact impedance and power consumption, and the Direct Current Side Capacitor and Photovoltaic Output Equivalent Reactance represent auxiliary component influences. By analyzing these parameters alongside our model, the sensitivity can be extended to understand their impact on external behavior. This comparative approach enhances our understanding and informs system design. Incorporating these parameters allows for a comprehensive comparison, identifying key factors influencing the load model’s behavior.
The integrated load model is accessed in the WSCC-9 node system and tested based on the Python-PSASP simulation platform. The test parameters are the internal parameters of the static load or the induction motor load and their composition ratios, and all parameters are uniformly distributed by default. The voltage, active power, and reactive power of the observation point are used as the response output trajectory, and the change of the internal parameters of the integrated load model under the observation point will cause the change of the response trajectory. The degree of change of the dynamic trajectory after the parameter change is used as the sensitivity index, and a sample contains the numerical sensitivity of all the parameters at a randomized point in the parameter space (which is a composite index after the average of the voltage and the power), and the set of the sample set is 2,000.
Among the 2,000 samples generated at the end of the simulation, noisy samples due to transient instability (the model is prone to instability under certain parameter compositions) are sifted out by analysis, and for the column vectors of sensitivity in the samples the corresponding variational generalized function matrices are computed and the mean value C is found in Eq. 9:
In this paper, the method for separating eigenvalues from eigenvectors is called the “Variational Generalized Function Matrices Approach.”
The eigendecomposition of C is performed to calculate the eigenvalues and eigenvectors of C. If C can be understood as a variational generalized function matrix with the parameter space as the independent variable, the parameter’s own sensitivity, and the correlation between the parameters as the dependent variable, then there must be a parameter space that has a high sensitivity distribution under a certain subspace after some kind of linear transformation. The diagonal array of eigenvalues generated by the eigendecomposition of C is understood as a new function space transformed by the coordinates of these eigenvectors. These eigenvectors after the coordinate transformation of the new function space, these eigenvectors for the function space of the coordinate axes, the function space of the function value, are also the correlation coefficient and the parameter’s own sensitivity to the size of the numerical value, except that the corresponding independent variable is no longer a parameter value of physical significance but the parameter space after the coordinate transformation of some kind of independent variable. Obviously, the 1st eigenvalue of C is much larger than the other eigenvalues, i.e., in the transformed function space, the change of the function value in the direction represented by the first eigenvector is much larger than that in the direction pointed by the other eigenvectors; therefore, the activation subspace of C is a 1-dimensional space, and the value of eigenvectors corresponding to the 1st eigenvalue multiplied by the parameter vectors is the coordinate of the parameter vectors on this space. The distribution of eigenvectors corresponding to the first eigenvalue is shown in Figure 1. The analysis reveals that the composition ratios of static load and induction motor exhibit larger sensitivity weights compared to the internal parameters of the model. Thus, the primary factors influencing the external characteristics of the integrated composite model are identified as the composition ratios of static load and induction motor load. Diagram of converting load model to highvoltage side considering the EVs and fuel betteries is shown in Figure 2 and structure of the simulation system is depicted in Figure 3.
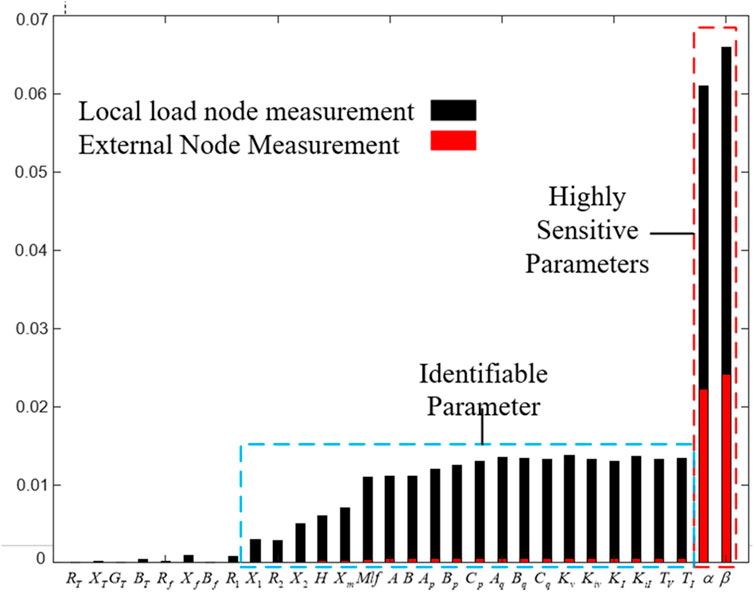
Figure 1. Sensitivity weights corresponding to different parameters.
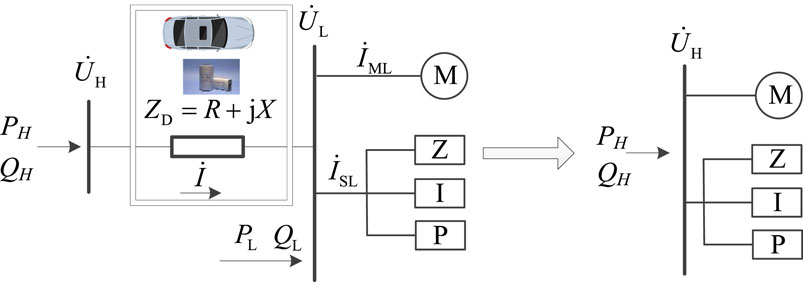
Figure 2. Diagram of converting load model to high-voltage side considering the EVs and fuel betteries.
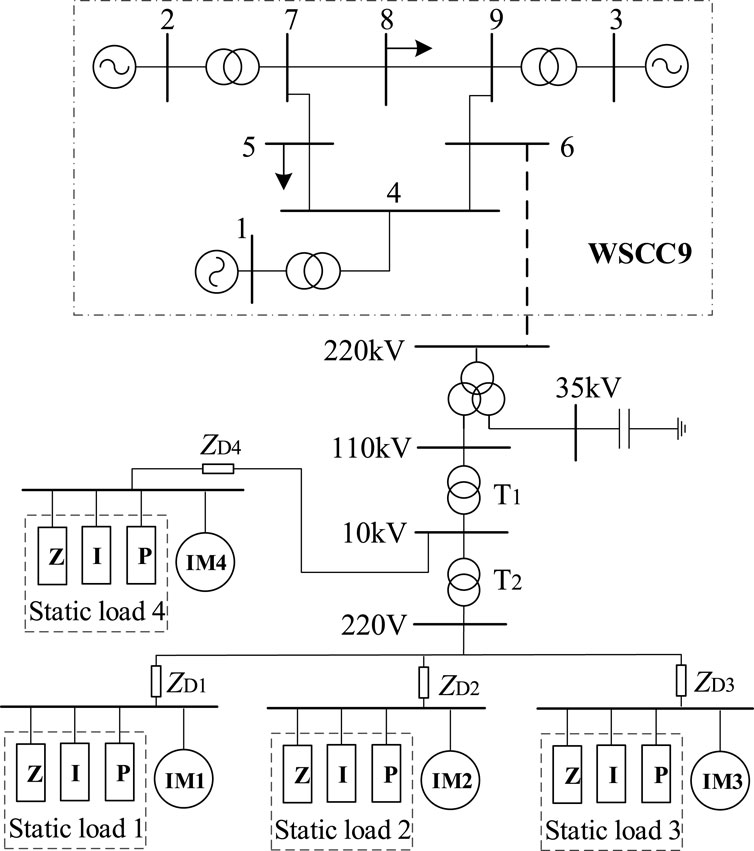
Figure 3. Structure of the simulation system.
In this section, we delve into the integration of advanced modeling techniques to augment the accuracy and robustness of integrated load models. Specifically, we adopt deep learning architectures, including deep neural networks (DNNs), recurrent neural networks (RNNs), and convolutional neural networks (CNNs), alongside data-driven parameter estimation techniques. Our choice of these methodologies is driven by their capacity to capture intricate nonlinear relationships within load dynamics and to accurately estimate model parameters based on historical operational data. By leveraging the capabilities of these advanced techniques, we aim to refine load modeling accuracy and contribute to the advancement of computational methodologies in this domain.
With the rapid advancement in computational methodologies, exploring advanced modeling techniques becomes imperative for refining the accuracy and robustness of integrated load models. One promising avenue is the incorporation of machine learning algorithms, particularly deep learning architectures, to capture intricate nonlinear relationships within the load dynamics. Deep neural networks (DNNs) offer unparalleled capabilities in handling complex data structures and learning high-dimensional mappings, which could significantly enhance the fidelity of load modeling.
To leverage the potential of deep learning, integrating DNNs within the integrated load modeling framework presents an intriguing prospect. By training DNNs on extensive datasets comprising diverse operational scenarios and load profiles, these models can learn intricate patterns and correlations, thus enabling more accurate predictions of load behavior. Moreover, recurrent neural networks (RNNs) and convolutional neural networks (CNNs) can capture temporal dependencies and spatial features, respectively, further enriching the modeling capabilities.
Another avenue for enhancing integrated load modeling is through data-driven parameter estimation techniques. By leveraging historical operational data and advanced optimization algorithms such as genetic algorithms or Bayesian inference methods, accurate estimation of model parameters can be achieved. These data-driven approaches offer a pragmatic means to calibrate model parameters in real-time, thereby ensuring adaptability to evolving system dynamics and load characteristics.
Since the dominant factor affecting the external characteristics of the integrated load model is the load composition ratio, it can be assumed that users with similar daily load profiles have similar load composition ratios. After clustering the loads using the clustering algorithm, the typical load composition ratio at the center of the clusters is used to characterize the composition of the loads in the class. The specific steps are as follows: 1) The load clustering process involves the following steps:
1) Processing the load data into daily load profiles and normalizing them based on Eq. 9 to create a library of daily load profiles:
In Eq. 10 xi denotes the ith daily load profile sampling point data and X denotes all sampling point data of the daily load profile There are two common Copula families, the Archimedes Copula and the Elliptic Copula. The three most common types of Archimedes Copula functions are Gumbel Copula, Clayton Copula and Frank Copula, and elliptic Copula functions mainly include normal Copula and t-Copula. Because t-Copula is extremely time-consuming to fit multidimensional random variables and the Gumbel-Copula form is complex, only the remaining three Copula functions are considered in this paper.
2) Clustering the daily load profiles of a large number of users using the k-means algorithm (Zhang et al., 2020b), for a given N daily load profile data, k cluster centers are randomly generated, the Euclidean distances of all the load profiles to the k cluster centers are calculated, respectively, and the cluster centers with the closest distances are selected as the groups to which they belong.
3) Recalculate the center of clustering for each cluster, i.e., average all load profiles in the load cluster and use it as the center of clustering for the next iteration;
4) Repeat the above steps until the center of clustering does not change anymore or the clustering reaches the convergence condition, which here corresponds to the mathematical problem of minimizing the number of 2-parameters:
In Eq. 11, Ci denotes the ith user group,
For loads within the same cluster, they are aggregated equivalently to characterize the underlying large number of user loads in terms of a typical load model.
In the actual power system, not all induction motors under the same bus may be in a working state, and one motor may correspond to multiple working states. Therefore, there are uncertainties and time-varying characteristics of load aggregation, and the model established based on the traditional capacity weighting method is single and fixed, which cannot reflect the real-time state and time-varying characteristics of load. In this paper, the real-time measured power of nodes is used instead of capacity for weighted aggregation, and the weighting coefficients are calculated according to Eq. 11:
In Eq. 12, Pi denotes the real-time measured power of the ith single motor load node. Following the calculation of weight coefficients using real-time measured power, Eqs 13, 14 are utilized to compute the inertia time constant of the aggregation model and the conductance of each branch of the equivalent circuit:
where Ti and Zi are the inertia time constant and branch impedance of the ith individual motor load, respectively, and the specific form of resistance and reactance of Zi varies depending on whether it is a stator branch, rotor branch, or excitation branch that is being expressed.
The static load is usually described by a polynomial consisting of constant impedance, constant current, and constant power as shown in Eq. 15:
where P0 and Q0 denote the rated active and reactive power consumed by the load, U and U0 denote the actual and rated voltage of the load bus, respectively, and ap, bp, cp, and aq, bq, cq denote the active and reactive power coefficients of each part of the model, respectively.
In Eq. 16, P0 denotes the rated active power consumed by the single static load, ap, bp, cp denote the active power coefficients of each part of the model, and the subscripts 1-n denote the serial number of the single static load.
When simulating and analyzing the power system, the load model is difficult to cover the lower voltage levels of the distribution network and is often connected to the higher voltage level buses, such as 110 kV or even 220 kV for simulation. Taking EVs and batteries into consideration, from the point of view of vehicle charging, to provide more electricity in the shortest time, the equipment needs to be optimized. The safety problems of charging on the side of the charging vehicle are mainly the adverse effects of the charging behavior of the electric vehicle on the battery or battery management system, including BMS (Battery Management System) safety protection measures out of control, poor consistency of the BMS communication protocol, poor collision coefficient, and leakage. Therefore, reasonable planning and selection of charging facilities increase battery safety and the anti-collision safety factor. From the point of view of an electric vehicle power collision, not only the voltage will change, but also the shape will deform and lead to the battery. The electrolyte of the part is splashed. Therefore, after the load model is aggregated, it is necessary to equate it step by step from the low voltage level to the high voltage level, as shown in the figure below:
In the figure, and denote the bus voltage of HV side and LV side, respectively, PH and PL denote the active power flowing into HV side and LV side, respectively, QH and QL denote the reactive power flowing into HV side and LV side, respectively, and denote the current of HV side, the current flowing into the motor load and the static load, respectively, and ZD is the equivalent impedance. The increasing charging load and the discordance in structure design increase the operating pressure of the power grid, but compared with fuel vehicles, electric vehicles have energy savings and emission reductions to maximize the benefits.
The following mathematical relationships of electrical quantities can be written as below:
Where: YZ, YI and YP denote the conductance of the constant impedance, constant current and constant power parts of the static load, respectively.
According to the third order model of induction motor, it can be expressed as:
where: Rs is the stator resistance, and is the short circuit reactance when the slew rate is zero.
The joint solution of Eqs 17, 18 can be obtained:
Order is shown in Eq. 21:
Substituting Eq. 20 into Eq. 19 yields the high voltage side bus voltage shown in Eq. 22:
Substituting Eq. 20 into the low voltage side motor transient electromotive force equation Eq. 23:
This gives the equivalent to the high voltage side induction motor excitation reactance, stator reactance, and rotor resistance and rotor reactance, as shown in Eq. 24:
Substituting Eq. 20 into the low voltage side induction motor electromagnetic moment equation yields the equivalent motor electromagnetic moment on the high voltage side as shown in Eq. 25:
Then the time constant of inertia of the induction motor load equaled to the high-voltage side is shown in Eq. 26:
From the circuit relationship, it can be obtained Eq. 27:
Simplification leads to Eq. 28:
Therefore, the static load conductance equated to the high-voltage side can be calculated by Eq. 29, where the proportion of constant impedance, constant current, and constant power components is determined according to the typical load composition in the clustering.
Based on the WSCC-9 node system in PSCAD/EMTDC, the example system is built, and a distribution network containing integrated load models of low voltage levels is accessed at node 6, and each integrated load model characterizes a class of customer loads. The specific parameters of the load model and the example system are shown in the Tables 1-4.
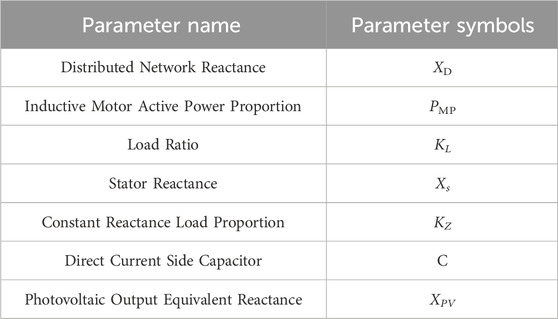
Table 1. Parameters of the generalized SLM.
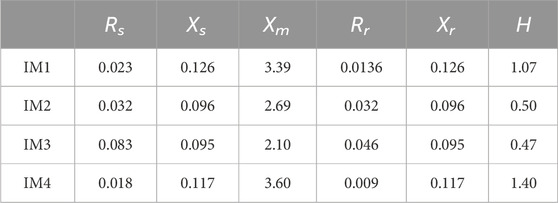
Table 2. Model parameters of the induction motor load.
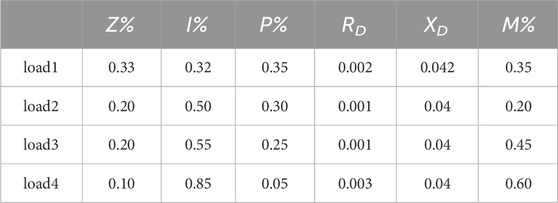
Table 3. Parameters of static load and impedance.

Table 4. Parameters of static load and impedance.
The method of this paper and the traditional overall measurement and discrimination method are used to construct the integrated load model of the high-voltage side, in which the method of this paper aggregates the loads of each voltage level of the low-voltage side and equates them step by step to the nodes of the 110 kV buses, and the overall measurement and discrimination method is based on the measurement information of the 110 kV nodes, and the optimization algorithm is used for the overall optimization of the load parameters under the nodes. Some of the parameters of the high-voltage side equivalent aggregated load model obtained by the method of this paper and the overall measurement and discrimination method (control) are shown in the Tables 5-7.
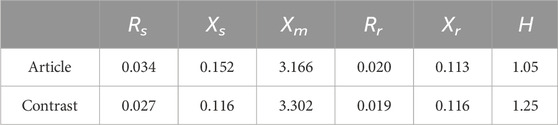
Table 5. Parameters of static load and impedance.
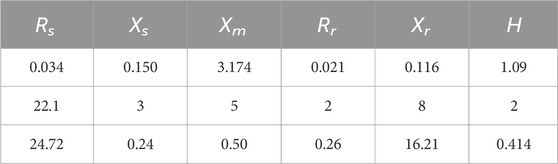
Table 6. Model parameters after load changes.
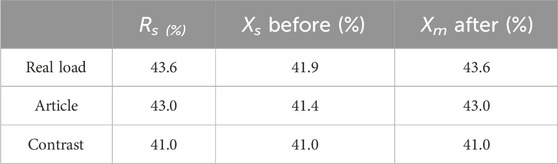
Table 7. Ratio of induction motors before and after load changes.
From the above table, it can be seen that there is not much difference in the parameters of the equivalent integrated load model obtained by the two methods. However, the overall measurement method cannot track and reflect the real-time changes in the system state and load. If the load model 1 of the load model of the system is cut off, the model parameters obtained by the overall measurement method remain fixed, while the model parameters obtained by the method of this paper will be changed accordingly, as shown in the table below:
These tables reflect the proportion of the induction motor before and after the load change. When the load composition changes, the identification result of this paper’s method for the induction motor is adjusted from 43.0% to 41.4%, while the identification result of the control method remains unchanged at 41.0%. It can be seen that the method of this paper can track the real load changes compared with the overall measurement and identification method, and the error of the identification results of the load proportion of the induction motor is relatively small. When the battery is overcharged, the electrode materials with different chemical properties will have different effects. At the beginning of charging, most of the electric energy is stored by a reversible reaction, and the heating power is small. But in the later stage of charging, because of the irreversible chemical reaction, the electric energy becomes heat energy. Causing the battery temperature to rise rapidly, resulting in a series of chemical reactions. The following reactions occur when the battery is out of control: the battery cathode material loses lithium and releases oxygen to oxidize the electrolyte, and the battery negative electrode cannot be embedded with lithium due to the decomposition of the diaphragm, which is deposited into lithium metal. These processes release heat accumulation beyond heat dissipation. Therefore, electric vehicles and the power grid are in a state of balance in order to protect the charging safety of electric vehicles.
Setting a short-time ground fault based on the load model obtained by different modeling methods, the simulation response curve of the relevant electrical quantities at the 110 kV node is shown in Figure 4. From the response curves of node voltage and active power, it can be seen that the simulation curves obtained from the load model established based on the method of this paper are closer to the actual real response and can more accurately reflect the real-time operation status and dynamic changes of the system load. The average errors of nodal voltage and active power are 1.88% and 2.17%, respectively, and the average errors of the simulation curves obtained from the load model based on the overall measurement and discrimination method are larger, 3.16% and 3.54%, respectively. The random charging of electric vehicles on a large scale is bound to cause the conventional load of the power grid to be “peak plus peak.” If electric vehicle charging is introduced and an effective charging control strategy is formulated to charge the electric vehicle at a relatively low power grid load, this will play a positive role in cutting the peak and filling the valley. To reduce the variance of the load curve and reduce the peak load as the charging target of the power grid side to manage the charging load of electric vehicles. A safety assessment model is established to analyze the charge-discharge process of electric vehicles and study the interaction characteristics of power batteries, charge and discharge equipment, and power supply equipment. At present, the mainstream charging modules on the market usually use a Vienna rectifier circuit because of the advantages of low cost, high power density, and a simple control strategy.
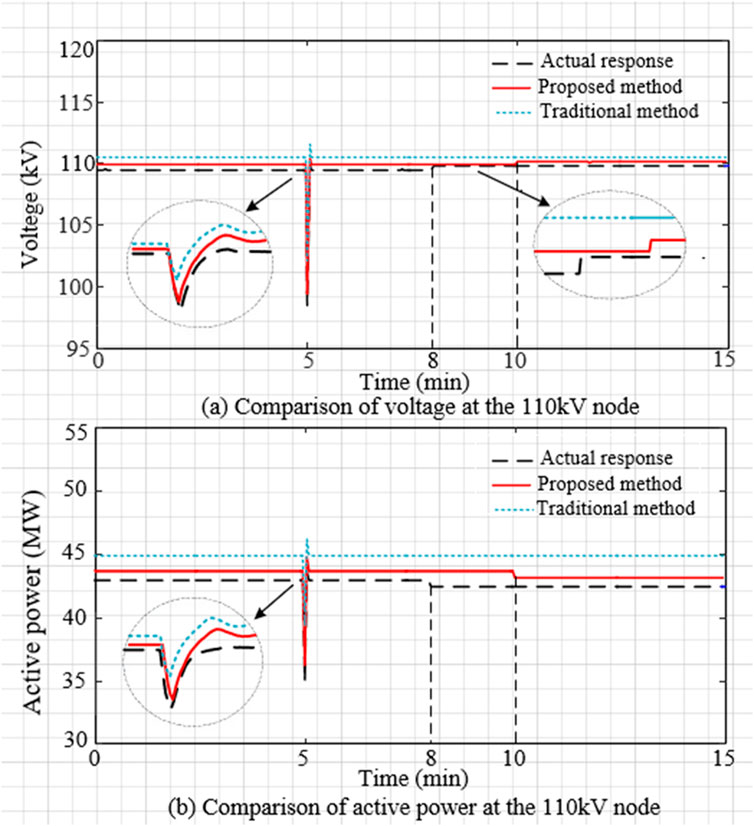
Figure 4. Comparison of simulation curves of electrical variables.
This paper proposes an online modeling method for a comprehensive load model (including electric vehicles (EVs) and battery storage) based on measurement information, based on the analysis and identification of the dominant factors of the external characteristics of the comprehensive load model, clustering the bottom load according to the load curve, and constructing the comprehensive load isoaggregation model by stepwise isoaggregation from the low voltage level to the high voltage level. The load model based on the proposed method can track and reflect the real-time changes of the system load and can reflect the real characteristics of the load more accurately than the traditional overall measurement and classification methods. The charging of electric vehicles affects the power quality of the power network and produces about 6 k harmonics, which lead to the loss of the power network, affect the life of the equipment, interfere with the circuit, and then affect the normal operation of the equipment. Therefore, only by avoiding these effects can the impact of electric vehicles on the power grid be minimized. However, the proposed method is only oriented toward the integrated load model composed of static loads and induction motor loads and does not consider the characteristics of new types of loads, such as distributed new energy.
This study elucidated the critical factors influencing the external characteristics of integrated load models, emphasizing the significance of load composition ratios and parameter sensitivities. Through the activation subspace approach and spectral analysis, we identified the dominant factors shaping integrated load behavior, laying the groundwork for more comprehensive modeling techniques.
With a large number of new types of loads connected to the power system, the load characteristics are more complex and variable. The electric vehicle is connected to the distribution side of the power grid, which has the characteristics of random and extensive access. The performance and charging mode of each vehicle are different, and there will be different characteristics in the management of the dispatching center. Considering the future, electric vehicle ownership will be considerable. In order to access any electric vehicle randomly on a large scale, a hierarchical architecture is adopted to construct the integrated structure of intelligent charging, charging, and power monitoring.
The grid voltage is divided into several grades in the stratified area, and the power supply capacity is divided into several power supply areas at different structural levels. The supply is carried out in each area according to the different power loads. The high-dimensional nonlinear characteristics of the model parameters are more prominent, so how to consider this factor to construct a more accurate integrated load model is the focus of the next research work.
Looking ahead, future research directions encompass the exploration of advanced modeling techniques, including deep learning and data-driven parameter estimation, to further refine the accuracy and adaptability of integrated load models. Additionally, efforts should be directed towards integrating these advanced models into practical power system applications, facilitating enhanced load forecasting, grid optimization, and resilience analysis in the face of evolving energy landscapes and demand patterns.
The original contributions presented in the study are included in the article/Supplementary material, further inquiries can be directed to the corresponding author.
YY: Formal Analysis, Project administration, Investigation, Writing–original draft. YZ: Investigation, Writing–original draft. YH: Data curation, Writing–review and editing. GL: Data curation, Writing–review and editing. ZL: Validation, Writing–review and editing. SP: Methodology, Writing–review and editing.
The author(s) declare that financial support was received for the research, authorship, and/or publication of this article. This research was Supported by the Science and Technology Project of China Southern Power Grid Co., Ltd. (032000KK52220006(GDKJXM20220163)). The funder was not involved in the study design, collection, analysis, interpretation of data, the writing of this article, or the decision to submit it for publication.
Authors YY, YZ, YH, and GL were employed by Zhongshan Power Supply Bureau of Guangdong Power Grid Co., Ltd.
The remaining authors declare that the research was conducted in the absence of any commercial or financial relationships that could be construed as a potential conflict of interest.
All claims expressed in this article are solely those of the authors and do not necessarily represent those of their affiliated organizations, or those of the publisher, the editors and the reviewers. Any product that may be evaluated in this article, or claim that may be made by its manufacturer, is not guaranteed or endorsed by the publisher.
Bu, F., Ma, Z., Yuan, Y., and Wang, Z. (2020). WECC composite load model parameter identification using evolutionary deep reinforcement learning. IEEE Trans. Smart Grid 11 (6), 5407–5417. doi:10.1109/tsg.2020.3008730
Camille, C., Hewage, D. K., Mirza, O., Mashiri, F., Kirkland, B., and Clarke, T. (2021). Performance behaviour of macro-synthetic fibre reinforced concrete subjected to static and dynamic loadings for sleeper applications. Constr. Build. Mater. 270, 121469. doi:10.1016/j.conbuildmat.2020.121469
Chen, C. S., Hwang, J. C., and Huang, C. W. (1997). Application of load survey systems to proper tariff design. IEEE Trans. power Syst. 12 (4), 1746–1751. doi:10.1109/59.627886
Cui, M., Khodayar, M., Chen, C., Wang, X., and Zhang, Y. (2019). Deep learning-based time-varying parameter identification for system-wide load modeling. IEEE Trans. Smart Grid 10 (6), 6102–6114. doi:10.1109/tsg.2019.2896493
Han, R., Hu, Q., Cui, H., Chen, T., Quan, X., and Wu, Z. (2022). An optimal bidding and scheduling method for load service entities considering demand response uncertainty. Appl. Energy 328 (1), 120167. doi:10.1016/j.apenergy.2022.120167
Hu, Q., Guo, Z., and Li, F. (2023). Imitation learning based fast power system production cost minimization simulation. IEEE Trans. Power Syst. 38 (3), 2951–2954. doi:10.1109/tpwrs.2023.3237398
Hu, Q., Han, R., Quan, X., Wu, Z., Tang, C., Li, W., et al. (2022). Grid-forming inverter enabled virtual power plants with inertia support capability. IEEE Trans. Smart Grid 13 (5), 4134–4143. doi:10.1109/tsg.2022.3141414
Ma, J., Han, D., He, R., Dong, Z. Y., and Hill, D. J. (2008). Reducing identified parameters of measurement-based composite load model. IEEE Trans. Power Syst. 23 (1), 76–83. doi:10.1109/tpwrs.2007.913206
Overbye, T. J. (1994). Effects of load modelling on analysis of power system voltage stability. Int. J. Electr. Power and Energy Syst. 16 (5), 329–338. doi:10.1016/0142-0615(94)90037-x
Qian, T., Ming, W., Shao, C., Hu, Q., Wang, X., Wu, J., et al. (2023). An edge intelligence-based framework for online scheduling of soft open points with energy storage. IEEE Trans. Smart Grid 15, 2934–2945. doi:10.1109/TSG.2023.3330990
Tsekouras, G. J., Hatziargyriou, N. D., and Dialynas, E. N. (2007). Two-stage pattern recognition of load curves for classification of electricity customers. IEEE Trans. Power Syst. 22 (3), 1120–1128. doi:10.1109/tpwrs.2007.901287
Wang, C., Wang, Z., Wang, J., and Zhao, D. (2018). SVM-based parameter identification for composite ZIP and electronic load modeling. IEEE Trans. Power Syst. 34 (1), 182–193. doi:10.1109/tpwrs.2018.2865966
Xu, T., Chen, T., Gao, C., and Hui, H. (2023). Intelligent home energy management strategy with internal pricing mechanism based on multiagent artificial intelligence-of-things. IEEE Syst. J. 17 (4), 1–12. doi:10.1109/JSYST.2023.3324795
Zalok, E., and Eduful, J. (2013). Assessment of fuel load survey methodologies and its impact on fire load data. Fire Saf. J. 62, 299–310. doi:10.1016/j.firesaf.2013.08.011
Zhang, W., Remon, D., and Rodriguez, P. (2017). Frequency support characteristics of grid-interactive power converters based on the synchronous power controller. IET Renew. Power Gener. 11 (4), 470–479. doi:10.1049/iet-rpg.2016.0557
Zhang, Y., Meng, X., Malik, A., and Wang, L. (2022). The use of analytical converter loss formula to eliminate DC slack/droop bus iteration in sequential AC-DC power flow algorithm. Int. J. Electr. Power and Energy Syst. 137, 107596. doi:10.1016/j.ijepes.2021.107596
Zhang, Y., Meng, X., Shotorbani, A. M., and Wang, L. (2020c). Minimization of AC-DC grid transmission loss and DC voltage deviation using adaptive droop control and improved AC-DC power flow algorithm. IEEE Trans. Power Syst. 36 (1), 744–756. doi:10.1109/tpwrs.2020.3020039
Zhang, Y., Mohammadpour Shotorbani, A., Wang, L., and Mohammadi-Ivatloo, B. (2021b). Enhanced PI control and adaptive gain tuning schemes for distributed secondary control of an islanded microgrid. IET Renew. Power Gener. 15 (4), 854–864. doi:10.1049/rpg2.12074
Zhang, Y., Qian, W., Ye, Y., Li, Y., Tang, Y., Long, Y., et al. (2023). A novel non-intrusive load monitoring method based on ResNet-seq2seq networks for energy disaggregation of distributed energy resources integrated with residential houses. Appl. Energy 349, 121703. doi:10.1016/j.apenergy.2023.121703
Zhang, Y., Shotorbani, A. M., Wang, L., and Li, W. (2020b). Distributed voltage regulation and automatic power sharing in multi-terminal HVDC grids. IEEE Trans. Power Syst. 35 (5), 3739–3752. doi:10.1109/tpwrs.2020.2986168
Zhang, Y., Shotorbani, A. M., Wang, L., and Li, W. (2021c). A combined hierarchical and autonomous DC grid control for proportional power sharing with minimized voltage variation and transmission loss. IEEE Trans. Power Deliv. 37 (4), 3213–3224. doi:10.1109/tpwrd.2021.3125254
Zhang, Y., Shotorbani, A. M., Wang, L., and Mohammadi-Ivatloo, B. (2021a). Distributed secondary control of a microgrid with a generalized PI finite-time controller. IEEE Open Access J. Power Energy 8, 57–67. doi:10.1109/oajpe.2021.3056507
Keywords: load modeling, measurement data, composite load model, equivalent aggregation, electric vehicles (EVs), battery storage
Citation: Yin Y, Zhong Y, He Y, Li G, Li Z and Pan S (2024) Online modeling method for composite load model including EVs and battery storage based on measurement data. Front. Energy Res. 12:1378067. doi: 10.3389/fenrg.2024.1378067
Received: 29 January 2024; Accepted: 23 April 2024;
Published: 23 May 2024.
Edited by:
Rufeng Zhang, Northeast Electric Power University, ChinaReviewed by:
Dongliang Xiao, South China University of Technology, ChinaCopyright © 2024 Yin, Zhong, He, Li, Li and Pan. This is an open-access article distributed under the terms of the Creative Commons Attribution License (CC BY). The use, distribution or reproduction in other forums is permitted, provided the original author(s) and the copyright owner(s) are credited and that the original publication in this journal is cited, in accordance with accepted academic practice. No use, distribution or reproduction is permitted which does not comply with these terms.
*Correspondence: Yi Zhong, eWl6aG9uZzIwMjMyMDIzQDE2My5jb20=
Disclaimer: All claims expressed in this article are solely those of the authors and do not necessarily represent those of their affiliated organizations, or those of the publisher, the editors and the reviewers. Any product that may be evaluated in this article or claim that may be made by its manufacturer is not guaranteed or endorsed by the publisher.
Research integrity at Frontiers
Learn more about the work of our research integrity team to safeguard the quality of each article we publish.