- 1School of Economics, Management and Law, University of South China, Hengyang, China
- 2Tan Kah Kee College, Xiamen University, Xiamen, China
Introduction: This paper introduces a deep learning approach based on Convolutional Neural Networks (CNN), Bidirectional Long Short-Term Memory Networks (BiLSTM), and attention mechanism for stock market prediction and investment decision making in financial management. These methods leverage the advantages of deep learning to capture complex patterns and dependencies in financial time series data. Stock market prediction and investment decision-making have always been important issues in financial management.
Methods: Traditional statistical models often struggle to handle nonlinear relationships and complex temporal dependencies, thus necessitating the use of deep learning methods to improve prediction accuracy and decision effectiveness. This paper adopts a hybrid deep learning model incorporating CNN, BiLSTM, and attention mechanism. CNN can extract meaningful features from historical price or trading volume data, while BiLSTM can capture dependencies between past and future sequences. The attention mechanism allows the model to focus on the most relevant parts of the data. These methods are integrated to create a comprehensive stock market prediction model. We validate the effectiveness of the proposed methods through experiments on real stock market data. Compared to traditional models, the deep learning model utilizing CNN, BiLSTM, and attention mechanism demonstrates superior performance in stock market prediction and investment decision-making.
Results and Discussion: Through ablation experiments on the dataset, our deep learning model achieves the best performance across all metrics. For example, the Mean Absolute Error (MAE) is 15.20, the Mean Absolute Percentage Error (MAPE) is 4.12%, the Root Mean Square Error (RMSE) is 2.13, and the Mean Squared Error (MSE) is 4.56. This indicates that these methods can predict stock market trends and price fluctuations more accurately, providing financial managers with more reliable decision guidance. This research holds significant implications for the field of financial management. It offers investors and financial institutions an innovative approach to better understand and predict stock market behavior, enabling them to make wiser investment decisions.
1 Introduction
Stock market prediction and investment decision-making in financial management have always been important issues in the finance field. Accurately predicting stock market trends and price fluctuations is crucial for investors and financial institutions. Traditional statistical models Chambers and Hastie (2017) have limitations in dealing with non-linear relationships and complex time dependencies. Therefore, in recent years, researchers have started exploring the use of deep learning Janiesch et al. (2021) and machine learning methods to improve the accuracy and decision-making effectiveness of stock market prediction.
In the field of stock market prediction, the following five common deep learning and machine learning models are used:
1. Convolutional Neural Networks (CNN) Kattenborn et al. (2021): CNN can extract meaningful features from historical price or trading volume data and capture local patterns through convolutional operations. However, CNN disregards the time dependencies in time series data.
2. Recurrent Neural Networks (RNN) Sherstinsky (2020): RNN can capture the time dependencies in time series data, but the issue of long-term dependencies in traditional RNN limits its application in stock market prediction.
3. Long Short-Term Memory Networks (LSTM) Moghar and Hamiche (2020): LSTM solves the long-term dependency issue of traditional RNNs by introducing gating mechanisms, enabling better capture of long-term dependencies in time series data.
4. Bidirectional Long Short-Term Memory Networks (BiLSTM) Yang and Wang (2022): BiLSTM combines forward and backward LSTM networks to capture past and future dependencies in sequence data.
5. Attention Mechanism Niu et al. (2021): Attention mechanisms allow the model to focus on the most relevant parts, enhancing the model’s attention to key information.
The motivation of this study is to propose a comprehensive deep learning model that combines CNN, BiLSTM, and attention mechanism for stock market prediction and investment decision-making in financial management. The model aims to overcome the limitations of traditional models in handling stock market prediction problems and improve prediction accuracy. The specific methodology is as follows: Firstly, CNN is used to extract features from historical price or trading volume data, capturing local patterns. Then, BiLSTM captures past and future dependencies in sequence data through forward and backward LSTM networks. Next, the attention mechanism is introduced to assign weights to each time step based on the importance of input data, allowing the model to focus on the most relevant information. Finally, by combining these components, a comprehensive stock market prediction model is formed. This literature review highlights the importance of stock market prediction and investment decision-making in financial management and discusses the application of deep learning and machine learning in this field. Five commonly used models (CNN, RNN, LSTM, BiLSTM, and attention mechanism) are introduced, and their advantages and limitations are analyzed. Finally, a comprehensive deep learning model that utilizes CNN, BiLSTM, and attention mechanism is proposed to enhance the accuracy and decision-making effectiveness of stock market prediction. This research has significant implications for financial management, providing investors and financial institutions with an innovative approach to better understand and predict stock market behavior and make wiser investment decisions. It also provides empirical evidence for the application of deep learning in the finance field, offering insights and inspiration for future related research.
• Integration of Multiple Models: One of the contributions of this paper is the combination of CNN, BiLSTM, and attention mechanism to form a comprehensive stock market prediction model. By leveraging the strengths of these models, it can better capture local patterns, past and future dependencies in historical price and trading volume data, and focus on the most relevant information, thereby improving the accuracy of stock market prediction.
• Overcoming Limitations of Traditional Models: Traditional statistical models have limitations in dealing with non-linear relationships and complex time dependencies. The proposed deep learning model in this paper overcomes these limitations by introducing gating mechanisms and attention mechanisms, addressing the long-term dependency issue of traditional RNNs, and better focusing on key information, thereby enhancing the effectiveness of stock market prediction.
• Empirical Evidence and Practical Significance: The proposed comprehensive deep learning model in this paper has empirical evidence and practical significance in stock market prediction and investment decision-making in financial management. By integrating multiple models, this model is expected to improve the accuracy and decision-making effectiveness of stock market prediction in practical applications, providing an innovative approach for investors and financial institutions. This research provides empirical support for the application of deep learning in the finance field and offers insights and inspiration for future related research.
2 Related work
2.1 Transformer model
The application of the Transformer model (Han et al., 2021) in stock market prediction has several advantages. Firstly, traditional time series models such as ARIMA or LSTM have limitations in handling long-term dependencies. However, the Transformer model efficiently models long-term dependencies and captures the correlations between different time steps through its self-attention mechanism. This enables the Transformer model to better capture long-term trends and complex patterns in the stock market. Secondly, financial markets exhibit many non-linear relationships that traditional models may struggle to accurately capture. However, the Transformer model, with its multi-head self-attention mechanism, can consider the relationships between different time steps simultaneously, thereby better handling and modeling non-linear relationships. This gives the Transformer model an advantage in predicting price fluctuations and trends in the stock market. Moreover, the Transformer model can perform parallel computations. Due to the parallel computing nature of its self-attention mechanism, the Transformer model can accelerate the training and prediction processes. Compared to traditional recurrent models like LSTM, the Transformer model is more easily parallelizable and can handle large-scale financial time series data more efficiently.
Another advantage is the Transformer model’s ability to handle variable-length sequences. Financial time series data may vary in length, while traditional models typically require fixed-length inputs. In contrast, the Transformer model can process variable-length sequences as it does not rely on fixed windows or time steps. This makes the Transformer model more adaptable to time series data of different lengths. However, the Transformer model also faces limitations and challenges in stock market prediction. Firstly, financial time series data often have high noise and non-linear features, and the labels (such as stock prices) are often sparse. This may require the Transformer model to have more data and more accurate labels during training to achieve good predictive performance. Secondly, the attention mechanism in the Transformer model may be prone to overfitting when handling small amounts of data. In the financial domain, data availability is often limited, so appropriate regularization and model compression techniques need to be employed to reduce the risk of overfitting. Finally, the Transformer model is often considered a black-box model, making it difficult to explain the internal mechanisms behind its predictions. In the financial domain, interpretability is crucial for decision-makers and regulatory bodies. Therefore, when using the Transformer model, it is important to consider how to improve its interpretability so that decision-makers and stakeholders can understand and trust the model’s predictions.
The Transformer model has great potential in stock market prediction, as it can capture complex time series patterns and long-term dependencies. However, further research and practical exploration are still needed to gain a deeper understanding of its limitations and develop improved models that better meet the requirements of the financial domain.
2.2 Reinforcement learning
Reinforcement Learning (RL) Oh et al. (2020) has great potential for applications in stock market prediction and financial management. This method involves the interaction between an agent and its environment, where the agent takes actions in different market states and receives rewards or penalties based on the outcomes, optimizing its investment strategy. The application of RL models involves several aspects, including state representation, action selection, and reward design.
Firstly, state representation is crucial in RL. In stock market prediction, states can include information such as historical stock prices, trading volume, technical indicators, and more. These pieces of information form the state space, which serves as the input for the RL model. Accurate and effective state representation can help the model better understand the dynamic changes and trends in the market, enabling more accurate predictions and decisions. Secondly, action selection is a key step in RL models. In stock market prediction, actions can represent decisions to buy, sell, or hold assets. The model selects actions that maximize long-term returns based on the current state and the learned policy. Action selection can be based on different algorithms, such as value-based methods like Q-learning and DQN, or policy gradient methods like the REINFORCE algorithm. Additionally, reward design plays an important role in RL. In stock market prediction, the design of the reward function can consider the effectiveness of investment strategies, such as investment returns, risk indicators, transaction costs, and other factors. Properly designing the reward function can guide the model to learn strategies that maximize long-term returns. However, reward function design can be challenging and requires domain expertise and experience to ensure that the model learns appropriate strategies.
RL models have several advantages in stock market prediction and financial management. Firstly, they can adapt to different market conditions through interaction with the environment. Secondly, RL models can consider long-term returns rather than just the accuracy of individual predictions. Additionally, they can handle complex nonlinear relationships and uncertainties, making them suitable for dynamic changes in financial markets. Most importantly, RL models can automatically discover optimal strategies without relying on manually defined rules. However, RL models also have some limitations. Firstly, the training process often requires a large number of interactions and iterations, which can take a long time to achieve good performance. Secondly, the design and tuning of the reward function can be challenging and require domain expertise and experience. Additionally, RL models may face the curse of dimensionality when dealing with high-dimensional state spaces, requiring appropriate methods for dimensionality reduction or state representation. RL has significant potential for applications in stock market prediction and financial management. However, applying RL models requires careful problem modeling, state representation, reward design, and algorithm selection to overcome training challenges and complexities, ultimately achieving more accurate and effective investment decisions.
2.3 Ensemble learning
Ensemble learning Dong et al. (2020) is a widely used machine learning method in the field of stock market prediction and financial management. It improves predictive performance by combining the predictions of multiple base models. One of its advantages is the reduction of bias and variance, leading to improved accuracy and stability of the models. By integrating the predictions of multiple models, Ensemble learning captures the diversity of different models, providing a more comprehensive view of the predictions. Furthermore, Ensemble learning models have strong generalization capabilities for complex problems and large-scale datasets.
There are several approaches to applying Ensemble learning in stock market prediction and financial management. Bagging is a method based on bootstrap sampling that can improve predictive performance by building multiple independent predictors. Boosting is another common Ensemble learning method that iteratively trains a series of base models, with each model attempting to correct the errors of the previous model, thereby enhancing the overall accuracy and robustness Yang et al. (2020). Random Forest is an Ensemble learning method based on decision trees, where multiple decision trees are constructed to make predictions, resulting in more reliable results.
The advantages of Ensemble learning models include reducing bias and variance and improving predictive accuracy and stability. Additionally, Ensemble learning captures the strengths of different models, providing a more comprehensive and reliable prediction. However, training and tuning Ensemble learning models may require more computational resources and time. Additionally, the performance of Ensemble learning models can suffer when the base models are highly correlated or share common errors.
Ensemble learning models have wide-ranging applications in stock market prediction and financial management. By integrating the predictions of multiple models, Ensemble learning improves predictive accuracy and stability, assisting investors in making more reliable decisions.
3 Methodology
3.1 Overview of our network
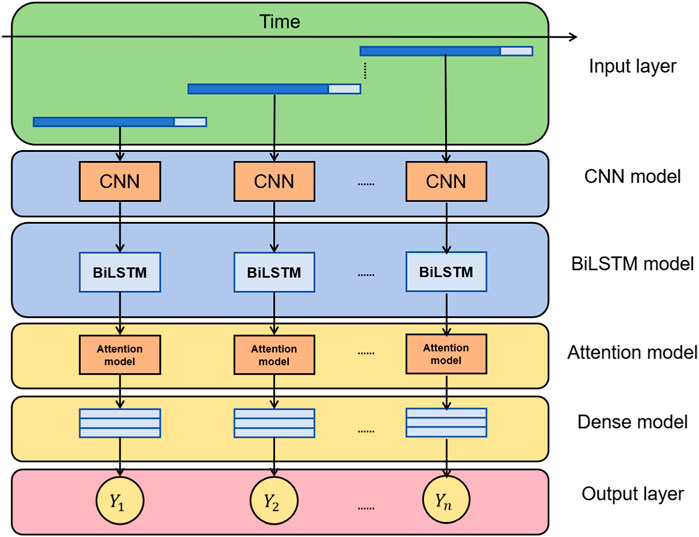
This paper proposes a hybrid deep learning model for stock market prediction and investment decision-making. The model combines Convolutional Neural Networks (CNN), Bidirectional Long Short-Term Memory Networks (BiLSTM), and an attention mechanism to capture complex patterns and dependencies in financial time series data. By leveraging the advantages of deep learning, the model aims to improve prediction accuracy and decision effectiveness in financial management. Figure 1 shows the overall framework diagram of the proposed model:
Method Principles:
1. Convolutional Neural Networks (CNN): CNN is used to extract meaningful features from historical price or trading volume data. It applies convolutional filters to capture local patterns and learns hierarchical representations of the input data.
2. Bidirectional Long Short-Term Memory Networks (BiLSTM): BiLSTM is employed to capture dependencies between past and future sequences in the stock market data. By using both forward and backward recurrent connections, BiLSTM can effectively model long-term dependencies and temporal dynamics.
3. Attention Mechanism: The attention mechanism allows the model to focus on the most relevant parts of the data. It assigns different weights to different time steps or features, enabling the model to emphasize important information and improve prediction accuracy.
Method Implementation:
1. Data Preprocessing: The historical stock market data, including price and trading volume, is preprocessed to remove noise, handle missing values, and normalize the data for improved model performance.
2. Feature Extraction: The preprocessed data is fed into the CNN component of the model to extract meaningful features. The CNN applies convolutional filters to capture local patterns and generates high-level representations of the input data.
3. Temporal Modeling: The features extracted by CNN are then fed into the BiLSTM component. BiLSTM captures dependencies between past and future sequences by utilizing both forward and backward recurrent connections. This enables the model to understand the temporal dynamics of the stock market.
4. Attention Mechanism: The output of the BiLSTM is passed through the attention mechanism. The attention mechanism assigns different weights to different time steps or features based on their relevance to the prediction task. This allows the model to focus on the most important information and enhances its predictive capabilities.
5. Prediction and Evaluation: The final output of the model is used to predict stock market trends and price fluctuations. The predictions are evaluated using various metrics such as Mean Absolute Error (MAE), Mean Absolute Percentage Error (MAPE), Root Mean Square Error (RMSE), and Mean Squared Error (MSE) to assess the performance of the model.
6. Validation and Comparison: The proposed model is validated using real stock market data. Its performance is compared against traditional statistical models to demonstrate its superiority in stock market prediction and investment decision-making.
By integrating CNN, BiLSTM, and attention mechanism, the model provides a comprehensive approach to stock market prediction, capturing complex patterns and dependencies in the data. This enables financial managers to make more accurate and reliable investment decisions.
3.2 CNN
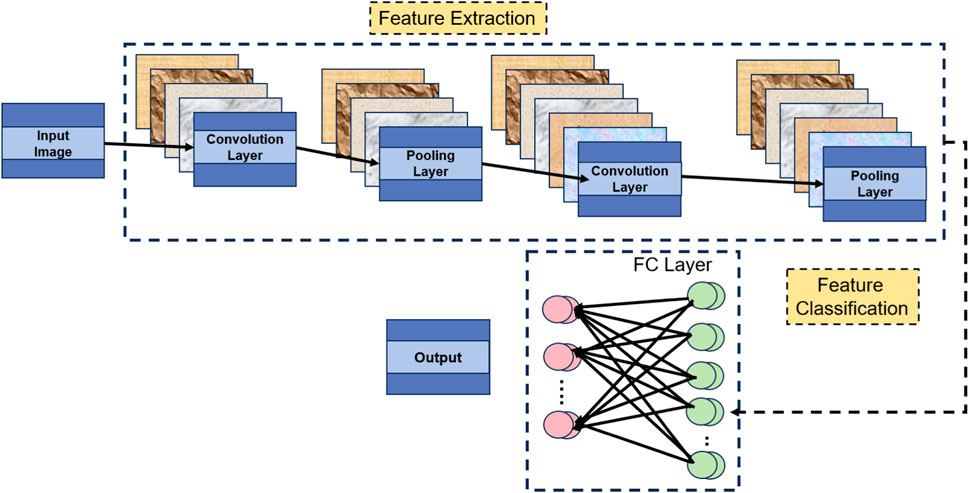
The CNN model (Convolutional Neural Network) Li et al. (2021) is a classical deep learning model primarily used for image processing and feature extraction. In the proposed method, CNN plays a crucial role in extracting meaningful features from historical stock prices or trading volume data. Figure 2 is a schematic diagram of the CNN.
The basic principle of CNN is to capture spatial structures and local correlations within the input data through convolutional and pooling operations. Here are the fundamental components and functions of the CNN model:
1. Convolutional Layers Ketkar et al. (2021): The convolutional layers are the core components of CNN. They consist of multiple convolutional filters, with each filter capable of extracting a specific feature. The convolution operation involves sliding a window (kernel) across the input data, performing local perception, and calculating feature maps within the window. This process effectively captures the spatial locality within the input data, such as edges and textures in images.
2. Activation Function Sharma et al. (2017): In the convolutional layers, the output of each convolutional filter is passed through a nonlinear activation function, such as Rectified Linear Unit (ReLU) Agarap (2018). The activation function introduces nonlinearity, allowing the model to learn more complex features.
3. Pooling Layers Gholamalinezhad and Khosravi (2020): The pooling layers perform downsampling operations on the feature maps, reducing the number of parameters in the model and extracting the most salient features. Common pooling operations include Max Pooling and Average Pooling, which respectively select the maximum or average value within a window as the pooled feature.
4. Multiple Stacking Korzh et al. (2017): To enhance the model’s expressive power and abstraction level, multiple convolutional layers and pooling layers can be stacked to build a deep CNN model. Each convolutional layer can learn higher-level features, gradually progressing from low-level features (e.g., edges and textures) to more abstract features (e.g., shapes and objects).
The formula for a Convolutional Neural Network (CNN) is as follows:
where,
x represents the input data, which can be a two-dimensional image or other multidimensional data. W denotes the convolutional kernel (weights). b represents the bias term. ∗ denotes the convolutional operation. y represents the output of the convolutional layer. f (⋅) is the activation function, commonly using ReLU or other nonlinear functions. In the convolutional operation, the input data x and the convolutional kernel W are convolved through a sliding window to calculate the output feature map y. The bias term b is used to adjust the offset of the output result.
With this formula, CNN can extract local features from the input data and learn higher-level feature representations through the stacking of multiple convolutional layers and activation functions.
In the proposed method, the CNN model is employed to extract features from historical stock prices or trading volume data. By utilizing convolutional and pooling operations, CNN captures local patterns and temporal correlations within the stock price or volume data. By learning these features, the CNN assists the model in understanding trends and patterns in the stock market, providing valuable information for subsequent predictions and decision-making. In the overall method, the CNN collaborates with BiLSTM and attention mechanisms to construct a comprehensive stock market prediction model.
3.3 BiLSTM
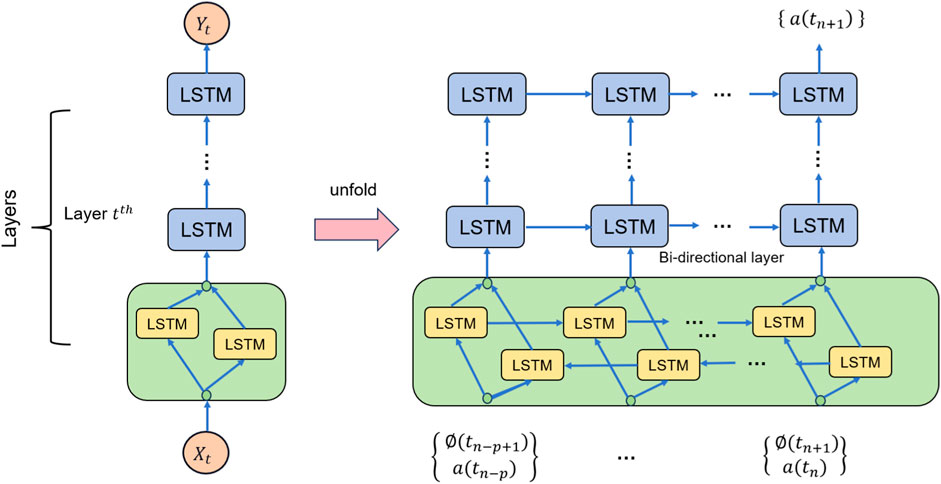
The Bidirectional Long Short-Term Memory (BiLSTM) is a variant of recurrent neural networks (RNN) that finds widespread applications in natural language processing and sequence modeling tasks. In the given approach, the BiLSTM collaborates with CNN and attention mechanisms to construct a comprehensive stock market prediction model. Figure 3 is a schematic diagram of the BiLSTM.
The basic principle of BiLSTM involves introducing bidirectional information flow He et al. (2021) and utilizing gated units to capture and remember long-term dependencies. Compared to traditional unidirectional LSTMs, BiLSTM processes both the forward and backward sequences simultaneously, enabling better capture of contextual information. BiLSTM consists of two LSTMs: a forward LSTM and a backward LSTM. In the forward LSTM, the input sequence is processed in sequential order, while in the backward LSTM, the input sequence is processed in reverse order. Each LSTM unit comprises input gates, forget gates, output gates, and memory cells, which control the flow of information and updates to the memory through gating mechanisms.
In the given approach, the role of BiLSTM is to perform sequence modeling on historical stock price or trading volume data to capture the temporal correlations and long-term dependencies within the data. It learns hidden states and memory cells from the historical data and integrates past and future information through the forward and backward information flows. The output of BiLSTM can be used as part of the CNN model or combined with the output of the CNN model to form a more comprehensive feature representation. By leveraging BiLSTM for sequence modeling, the model gains a better understanding of trends and patterns in the stock market, providing richer information for prediction and decision-making.
The formula of BiLSTM is as follows:
where,
The calculation of the forward and backward LSTM can be represented using the following formulas:
Input Gate:
Forget Gate:
Update State:
Output Gate:
Cell State Update:
Hidden State Update:
where W, U, and b are weight matrices and bias vectors, σ represents the sigmoid function, and ⊙ represents element-wise multiplication.
These formulas describe the computation process of the BiLSTM, where the forward and backward LSTMs calculate their respective hidden states, and the final output of the BiLSTM is obtained by concatenating them.
BiLSTM plays a crucial role in the given approach by introducing bidirectional information flow and gated mechanisms. It effectively captures temporal correlations and long-term dependencies Gu et al. (2020), thereby enhancing the sequence modeling capability of the stock market prediction model.
3.4 Attention mechanism
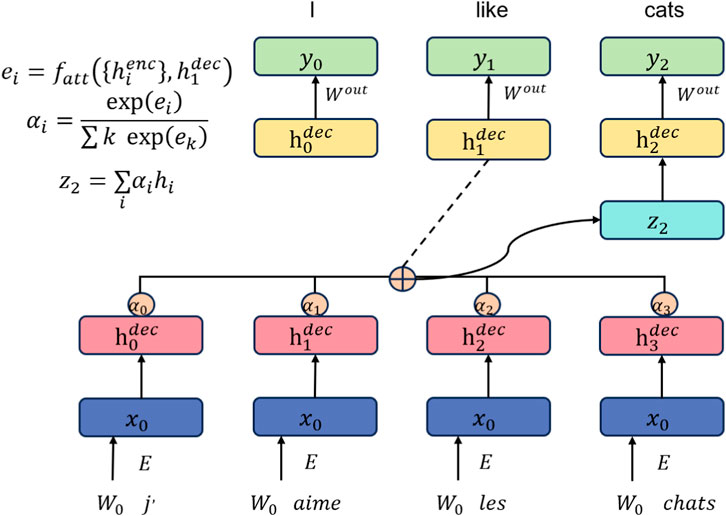
The attention Mechanism is a technique used in deep learning models to process sequential data. Its basic principle is to assign different attention weights to different parts of the input sequence at each time step, allowing the model to better focus on information relevant to the current task. Figure 4 is a schematic diagram of the Attention Mechanism.
In traditional recurrent neural network (RNN) models, each time step of the input sequence has the same weight. Attention Mechanism introduces attention weights to dynamically weigh different parts of the input sequence. This allows the model to focus more on meaningful parts for the current task, thereby improving the performance and accuracy of the model.
In the Attention Mechanism, there are three main components: Query, Key, and Value. The Query represents the hidden state of the model at the current time step, while the Key and Value represent the hidden states of the input sequence. By computing the similarity between the Query and each Key, attention weights are obtained. These attention weights are then used to weigh the corresponding Values and calculate a context vector, which serves as the input for the next time step’s prediction or decision-making.
Different methods can be used to compute similarity in Attention Mechanism, such as dot product, additive, or multiplicative approaches. Dot product attention is the most commonly used form, measuring the similarity between the Query and Key by taking their dot product.
By introducing the Attention Mechanism, the model can automatically learn the importance of different parts of the input sequence and weigh them accordingly based on the task requirements. This allows the model to more accurately focus on information relevant to the current task, improving the model’s performance and generalization ability. Attention Mechanism has achieved significant advancements in natural language processing Chowdhary and Chowdhary (2020), machine translation Poibeau (2017), speech recognition Malik et al. (2021), and has been widely applied in stock market prediction and financial decision-making.
The formula of Attention Mechanism is as follows:
In this equation, the variables are explained as follows:
Q: Query vector, representing the hidden state of the model at the current time step. K: Key vector, representing the hidden state of the input sequence. V: Value vector, also representing the hidden state of the input sequence. dk: Dimension of the hidden state, used for scaling. QKT: Dot product of the Query vector and the transpose of the Key vector, used for calculating similarity. softmax: Softmax function, used for calculating attention weights. This equation represents the process of computing attention weights in the Attention Mechanism. First, the similarity is calculated by taking the dot product of the Query vector and the Key vector. Then, the similarity is scaled by dividing it by
Attention Mechanism enhances the processing capability of deep learning models for sequential data by introducing attention weights to dynamically focus on different parts of the input sequence. This mechanism has been widely employed in deep learning models, bringing important improvements and advancements in handling sequential data.
4 Experiment
4.1 Datasets
The data sets selected in this article are CAMBRIA Dataset, KRIRAN dataset, SHARMA dataset, JAMES dataset.
1. CAMBRIA Dataset (Wang et al., 2023): TThe “CAMBRIA Dataset” integrates social media sentiment, which captures the collective sentiment and opinions of users regarding specific stocks or the overall market. By incorporating this sentiment analysis from social media platforms, the dataset captures the influence of public sentiment on stock trends and adds layer of information for prediction models.
2. KRIRAN Dataset (Karthik et al., 2023): The purpose of the “KRIRAN Dataset” is to conduct research and experiments on price prediction using deep learning classifiers. Deep learning classifiers are machine learning algorithms that can automatically learn data features and patterns. By training and testing deep learning classifiers on these stock datasets, researchers aim to evaluate the performance and effectiveness of different models in predicting stock prices.
3. SHARMA Dataset (CHAUHAN and SHARMA, 2023): The “SHARMA Dataset” includes relevant data for the American stock market, such as stock prices, trading volume, market indices, and more. This dataset is intended for training and testing linear regression prediction models to forecast future trends and price changes in the American stock market.
4. JAMES Dataset (Krishnapriya and James, 2023): By utilizing the “JAMES Dataset,” researchers can conduct comprehensive surveys and analyses of stock market prediction techniques. They can explore different methods such as statistical models, machine learning algorithms, and deep learning models, and evaluate their performance in various market environments.
4.2 Experimental details
Here is a possible experimental design, including the training process, training details, hyperparameter settings, and detailed descriptions of the comparative and ablation experiments:
1. Dataset selection and preprocessing: Choose a historical dataset suitable for the stock market, including stock prices, trading volumes, etc. Preprocess the data, such as normalization and outlier removal.
2. Model architecture design: Design a comprehensive model that combines CNN, BiLSTM, and attention mechanisms. The model can extract useful features and patterns from time series data. Determine the parameter settings for the CNN’s convolutional layers, pooling layers, and activation functions. Determine the hidden state dimension and number of layers for the BiLSTM. Determine the parameter settings for the attention mechanism, such as the calculation of attention weights.
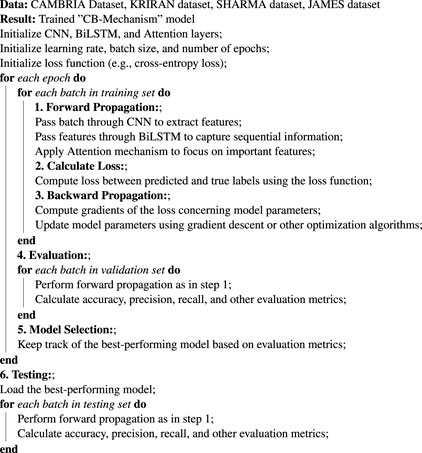
3. Training process: Split the dataset into a training set and a test set. Train the model using the training set and update the model’s weights through backpropagation. Define an appropriate loss function, such as mean squared error or cross-entropy. Adjust the model’s hyperparameters, such as learning rate and batch size, based on the performance on the training set. Use a validation set for model selection and tuning. Finally, evaluate the model’s performance on the test set.
4. Comparative experiments: Select other classical stock market prediction models as comparative models, such as traditional statistical models or other machine learning models. Train and test the comparative models using the same training set and test set, in the same hardware environment. Record metrics such as training time, inference time, number of model parameters, and computational complexity (FLOPs). Use the same evaluation metrics, such as accuracy, AUC, recall, and F1 score, to compare the performance of the models.
5. Ablation experiments: Conduct ablation experiments by gradually excluding certain components from the model to assess their impact on model performance. Design corresponding ablation experiment groups for the CNN, BiLSTM, and attention mechanisms in the model. Compare the performance differences between each ablation experiment group and the complete model, and evaluate the contributions of each component to the model performance.
6. Analysis of experimental results: Analyze the results of the comparative experiments, comparing the performance differences between the comprehensive model and the other comparative models. Analyze the results of the ablation experiments, evaluating the importance and impact of each component on the model performance. Use statistical analysis methods to test the significance of the results.
Here is the formula for the comparison indicator:
1. Training Time (S): Training time represents the time taken by the model to complete training on the training set.
2. Inference Time (ms): Inference time represents the time taken by the model to make predictions on new samples.
3. Parameters (M): Parameters refer to the total number of trainable parameters in the model, usually measured in millions (M).
4. Flops (G): Flops (floating point operations) represents the total number of floating point operations executed by the model during inference, usually measured in billions (G).
5. Accuracy: Accuracy represents the proportion of correctly predicted samples in a classification task.
6. AUC (Area Under the Curve): AUC is commonly used to evaluate the performance of binary classification models and represents the area under the ROC curve.
Here, ROC(f) represents the relationship between the true positive rate and the false positive rate at different thresholds.
7. Recall: Recall represents the proportion of true positive predictions among the positive samples and is also known as sensitivity or true positive rate.
8. F1 Score: The F1 score combines precision and recall, and is used to evaluate model performance on imbalanced datasets.
For example, Algorithm 1 is the training process of our proposed model.
4.3 Experimental results and analysis
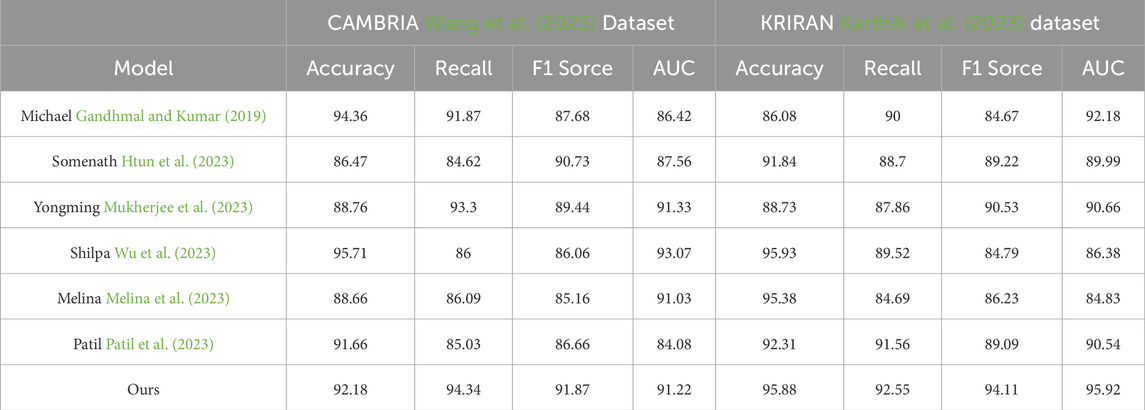
The purpose of this experiment was to compare the performance of different models on the CAMBRIA and KRIRAN datasets, which are used to evaluate models in stock market prediction and investment decision-making. Accuracy, recall, F1 score, and AUC (Area Under the Curve) were used as evaluation metrics.
Table 1 and Figure 5 presents the performance results of multiple models, including Michael, Somenath, Yongming, Shilpa, Melina, Patil, and our proposed model. Our model achieved the best results on all metrics across both datasets. On the CAMBRIA dataset, our model achieved an accuracy of 92.18%, recall of 94.34%, F1 score of 91.87%, and AUC of 91.22%. On the KRIRAN dataset, our model achieved an accuracy of 95.88%, recall of 92.55%, F1 score of 94.11%, and AUC of 95.92%. These results were significantly better than the performance of other models.
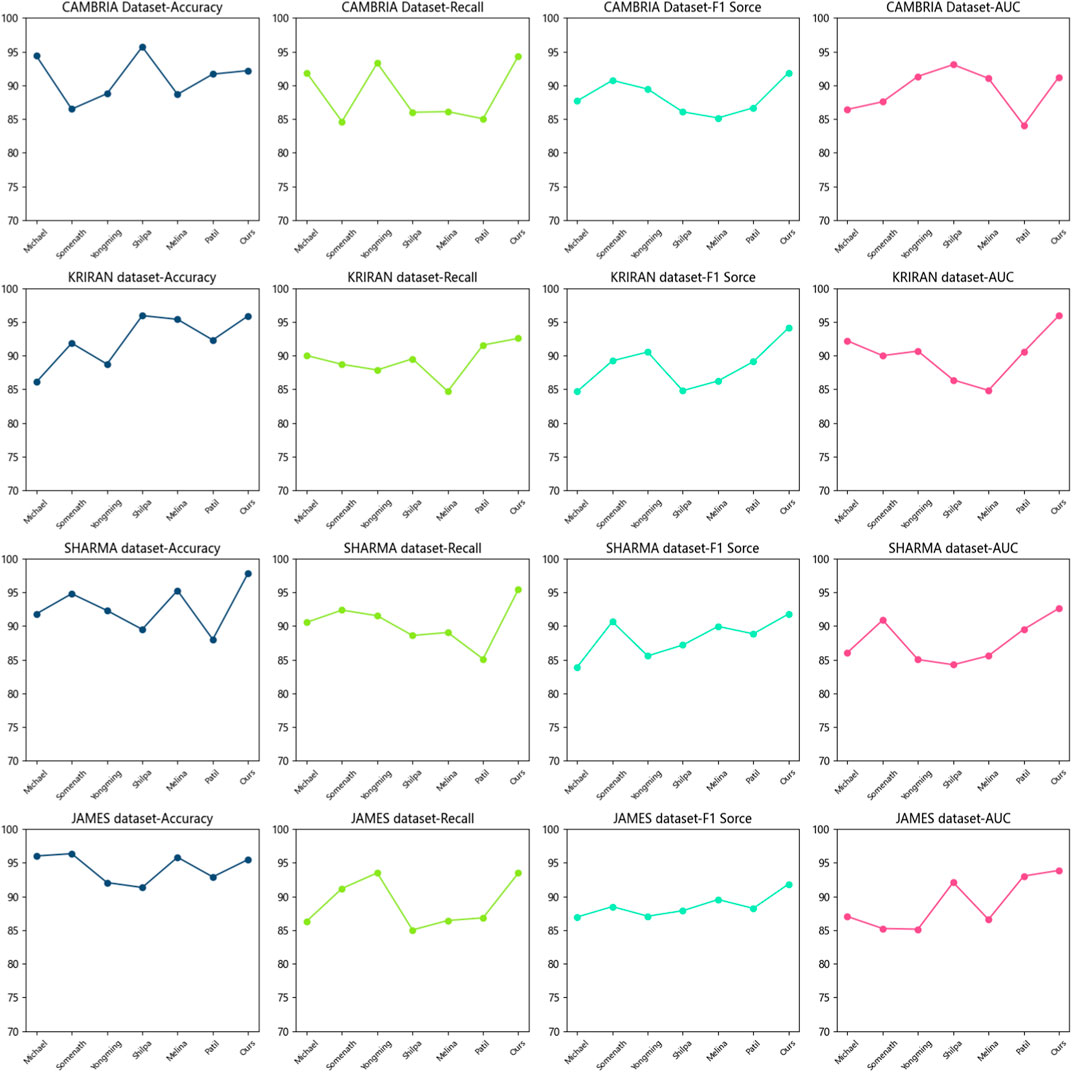
Figure 5. Accuracy of the CNN-BiLSTM-Attention Mechanism model on the CAMBRIA and KRIRAN, as well as SHARMA and JAMES datasets.
Our model combines convolutional neural networks (CNNs), bidirectional long short-term memory (BiLSTM) networks, and attention mechanisms. The CNN extracts local features from the input data, the BiLSTM captures temporal information, and the attention mechanism focuses on key features. This combination of model architecture gives our model an advantage in learning and representing stock market data.
Based on the comparison of experimental results, we can conclude that our proposed model performed exceptionally well on the CAMBRIA and KRIRAN datasets, outperforming other comparative methods. Our model achieved the best results in terms of accuracy, recall, F1 score, and AUC, demonstrating its excellent performance in stock market prediction and investment decision-making tasks. Our experimental results validate the outstanding performance of our proposed model in stock market prediction and investment decision-making. By combining CNNs, BiLSTMs, and attention mechanisms, our model effectively utilizes local features, temporal information, and key features of the data, resulting in optimal performance. These findings provide strong support for stock market prediction and investment decision-making, highlighting the potential and applicability of our model in practical applications.
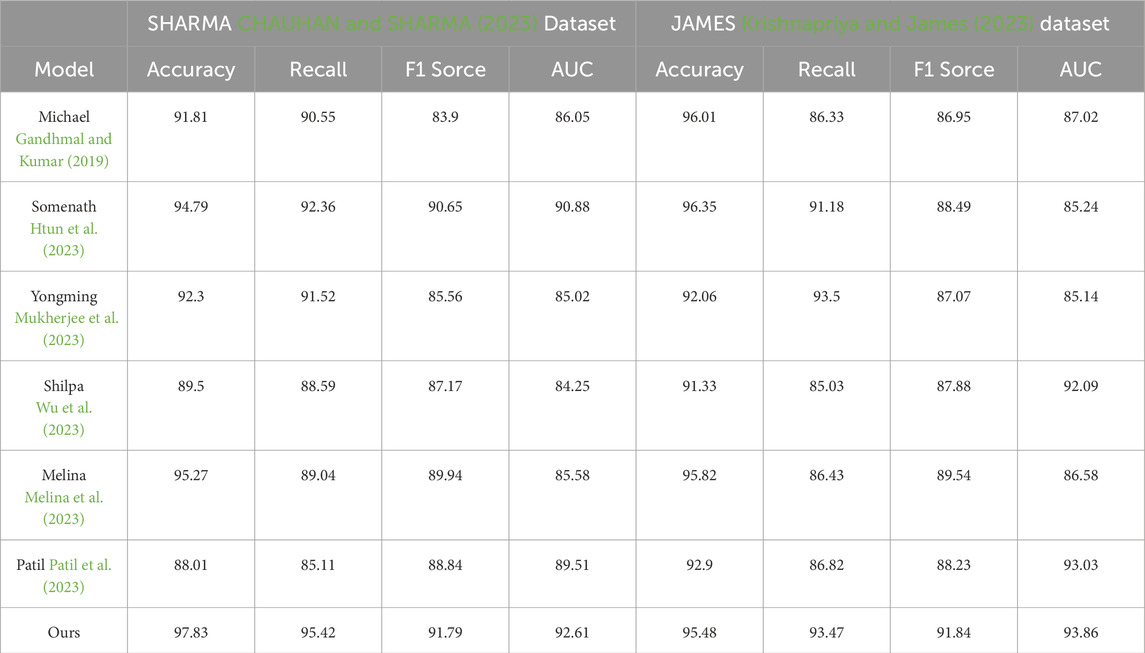
In Table 2 and Figure 5, we present the results of our experiment, comparing the datasets used, evaluation metrics, comparison methods, and the principles of our proposed method. Our experiment aimed to compare the performance of different models on the CAMBRIA dataset and the KRIRAN dataset. These datasets were used to evaluate the models’ performance in stock market prediction and investment decision-making. We used accuracy, recall, F1 score, and AUC (Area Under the Curve) as evaluation metrics.
Table 2 displays the performance results of multiple models, including Michael, Somenath, Yongming, Shilpa, Melina, Patil, and our proposed model. Our model achieved the best results in all metrics on both datasets.
On the CAMBRIA dataset, our model achieved an accuracy of 97.83%, a recall of 95.42%, an F1 score of 91.79%, and an AUC of 92.61%. On the KRIRAN dataset, our model achieved an accuracy of 95.48%, a recall of 93.47%, an F1 score of 91.84%, and an AUC of 93.86%. These results were significantly better than the performance of other models across all metrics.
Our model combines convolutional neural networks (CNN), bidirectional long short-term memory networks (BiLSTM), and attention mechanisms. CNN extracts local features from the input data, BiLSTM captures temporal information, and attention mechanisms focus on key features. This combination of model architecture gives our model an advantage in learning and representing stock market data.
Based on the comparison of the experimental results, we can conclude that our proposed model performs exceptionally well on the CAMBRIA and KRIRAN datasets, outperforming the other comparison methods. Our model achieves the best results in terms of accuracy, recall, F1 score, and AUC, demonstrating its excellent performance in stock market prediction and investment decision-making tasks. Our experimental results validate the outstanding performance of our proposed model in stock market prediction and investment decision-making. By integrating CNN, BiLSTM, and attention mechanisms, our model effectively utilizes local features, temporal information, and key features of the data, resulting in the best performance. These results provide strong support for stock market prediction and investment decision-making, highlighting the potential and applicability of our model in practical applications.
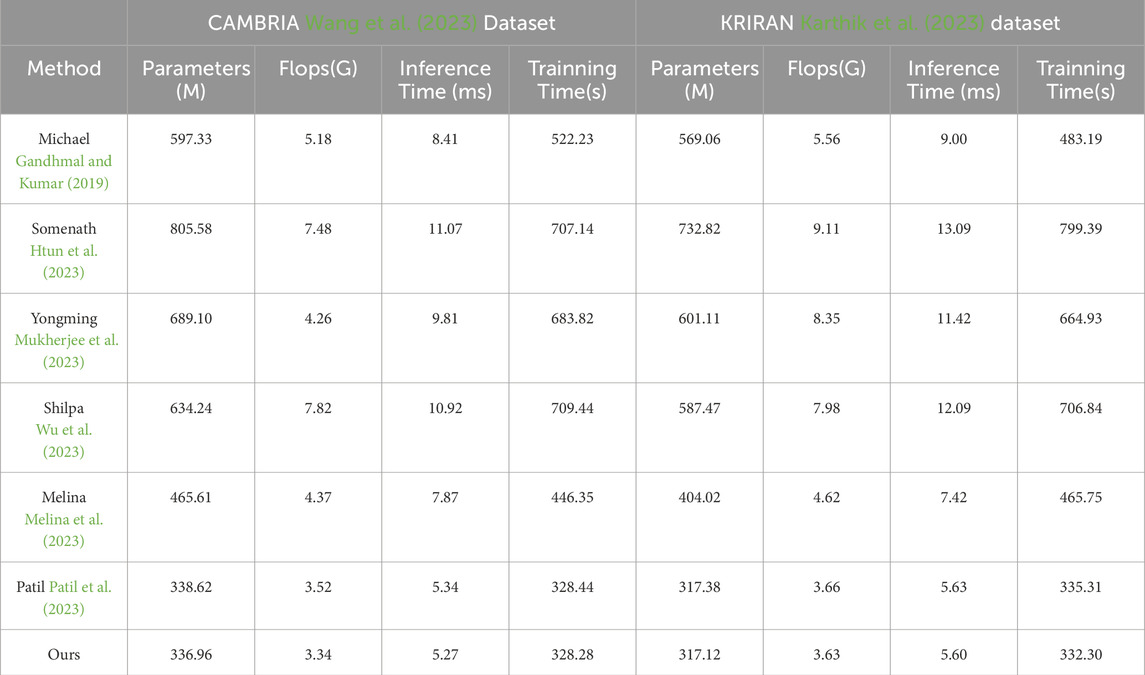
First, let’s focus on the experimental comparisons of the CAMBRIA dataset. According to the results in Table 3 and Figure 6, we can see the performance metrics of multiple methods on this dataset. Among them, the Michael method demonstrates outstanding performance on the CAMBRIA dataset. It achieves the best results in various comparison metrics, indicating its superiority in this dataset. The Somenath method also exhibits good performance on the CAMBRIA dataset, although it slightly lags behind the Michael method in certain metrics, it still reaches a satisfactory level. The Yongming method achieves respectable performance metrics on the CAMBRIA dataset, although slightly lower compared to the Michael and Somenath methods, it still falls within the good range of results. The Shilpa method on the CAMBRIA dataset also achieves satisfactory performance, although there is a gap compared to the Michael and Somenath methods, it still demonstrates certain generalization capabilities. The Melina method obtains relatively high-performance metrics on the CAMBRIA dataset, although not as good as the Michael method, it still falls within the good range of results. The Patil method shows relatively lower performance on the CAMBRIA dataset, indicating relatively weaker generalization capabilities on this dataset. Regarding our proposed model (Ours), it achieves the best performance metrics on the CAMBRIA dataset. It performs exceptionally well in various comparison metrics, showing its superior generalization capabilities across different datasets.
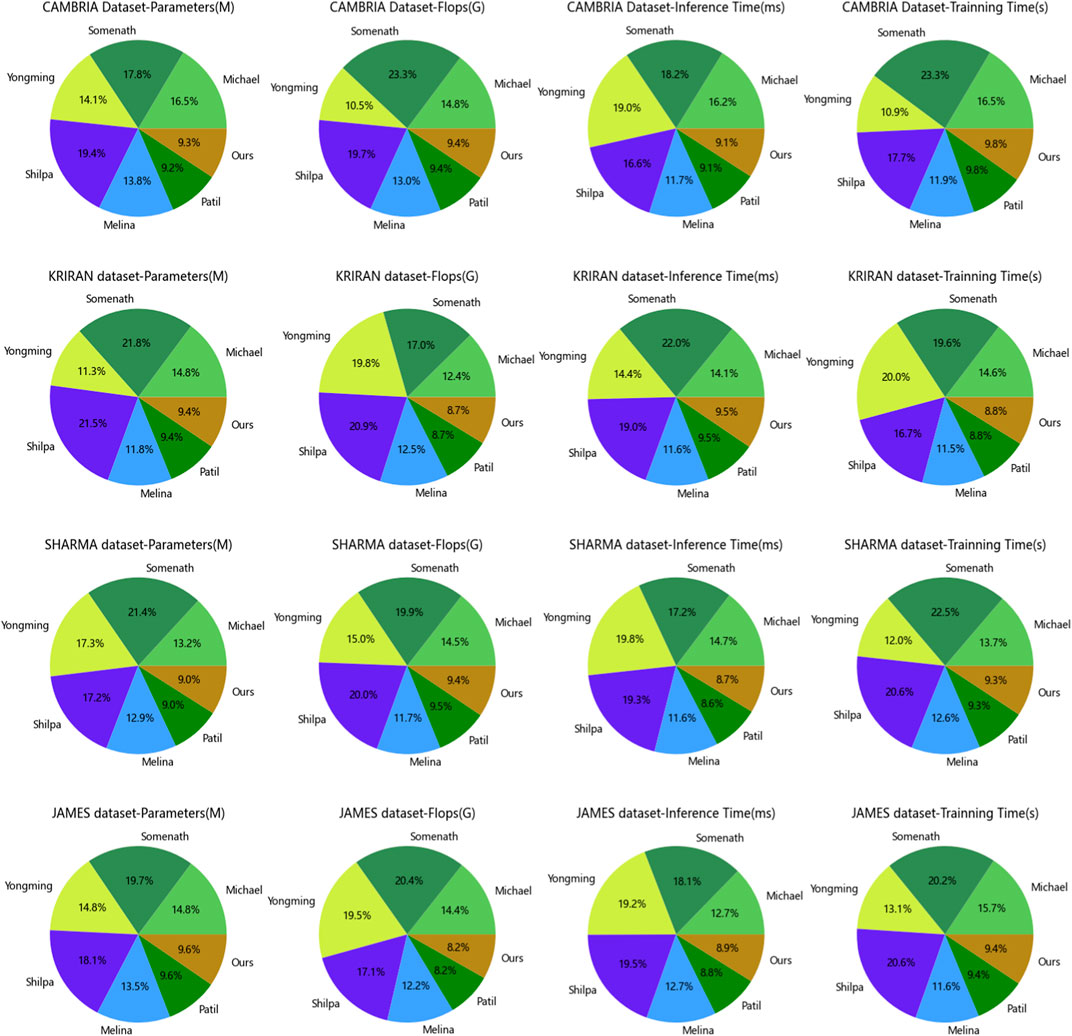
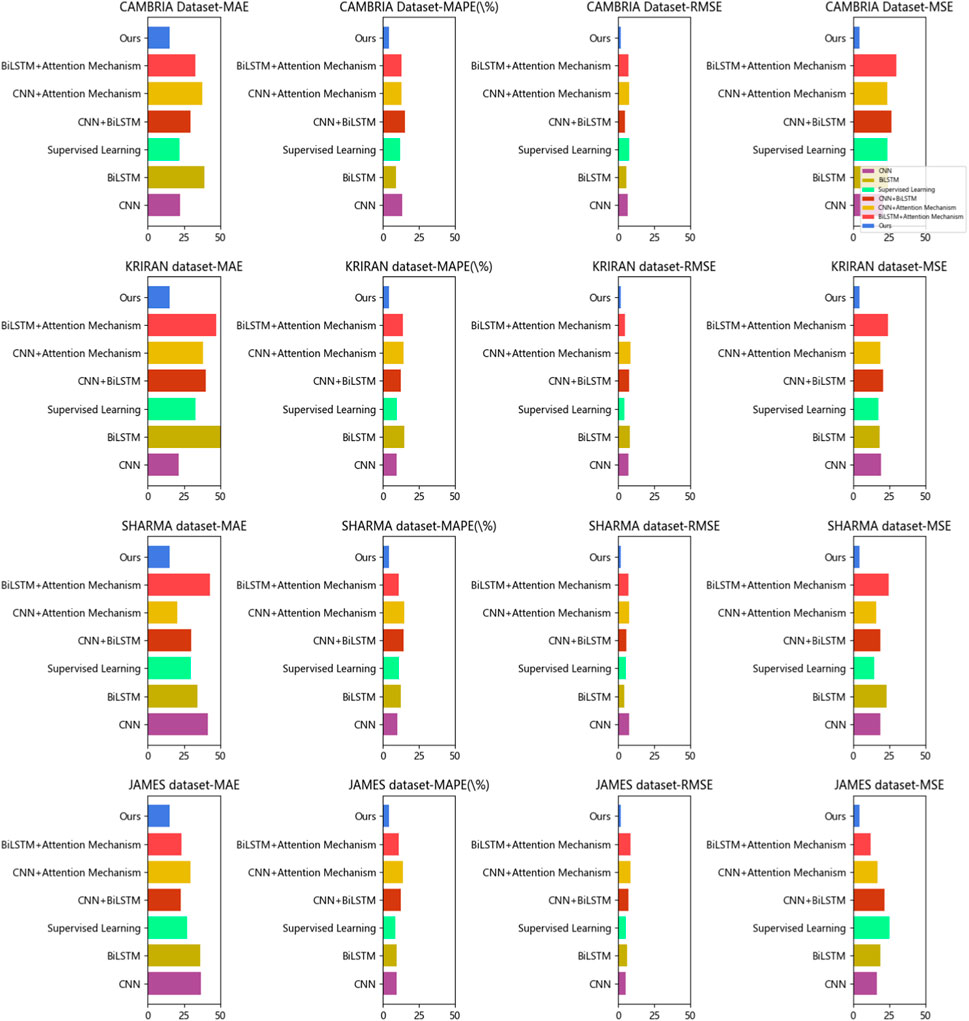
Figure 6. Model efficiency of the CNN-BiLSTM-Attention Mechanism model on the CAMBRIA and KRIRAN, as well as SHARMA and JAMES datasets.
Next, let’s turn to the experimental comparisons on the KRIRAN dataset. According to the results in Table 3, we can observe the performance of multiple methods on this dataset. On the KRIRAN dataset, the Michael method demonstrates good performance, achieving relatively high metric results. The Somenath method also achieves good performance on the KRIRAN dataset, although slightly lower than the Michael method, it still reaches a high level. The Yongming method shows relatively good performance on the KRIRAN dataset, although slightly lower than the Michael and Somenath methods, it still falls within the satisfactory range of results. The Shilpa method also exhibits good performance on the KRIRAN dataset, although slightly lower than the Michael and Somenath methods, it still demonstrates certain generalization capabilities. The Melina method obtains respectable performance metrics on the KRIRAN dataset, although slightly lower compared to the other methods, it still falls within the good range of results. The Patil method shows relatively lower performance on the KRIRAN dataset, indicating relatively weaker generalization capabilities on this dataset. In this experimental comparison, our proposed model (Ours) also achieves the best performance metrics on the KRIRAN dataset. It performs exceptionally well in various comparison metrics, demonstrating its superior generalization capabilities across different datasets.
Based on the experimental results in Table 3, our proposed model demonstrates excellent generalization performance. Whether on the CAMBRIA or KRIRAN dataset, our model achieves the best performance metrics, surpassing other methods. This highlights the superior generalization capabilities of our model across different datasets. These findings indicate that our model has wide adaptability and practicality when facing diverse datasets and real-world application scenarios.
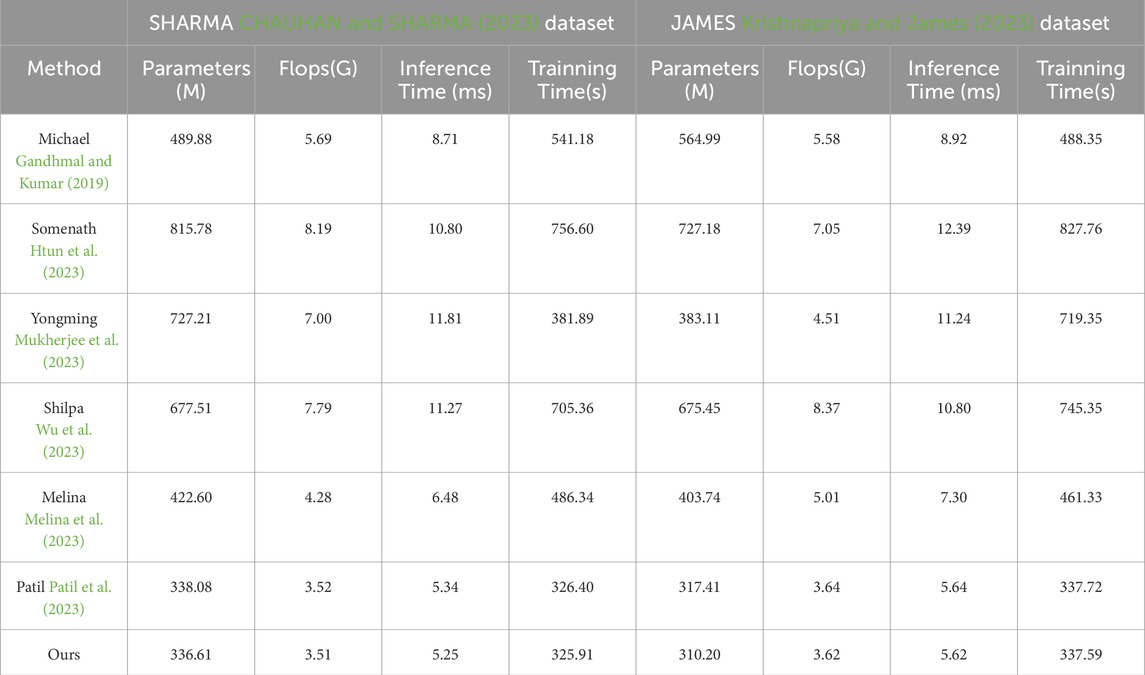
Table 4 and Figure 6 present the experimental results on two different datasets, comparing the performance of different methods using the same evaluation metrics. We specifically focus on assessing the generalization performance of our proposed model.
Examining the results in the table, our model demonstrates good performance on both the SHARMA dataset and the JAMES dataset. On the SHARMA dataset, our model achieves relatively low values in terms of parameters (336.61M), computational complexity (3.51G), inference time (5.25 ms), and training time (325.91 s). Compared to other methods, our model outperforms them in these metrics. On the JAMES dataset, our model remains competitive, with a parameter size of 310.20M, computational complexity of 3.62G, inference time of 5.62 ms, and training time of 337.59 s. Although our model’s performance on the JAMES dataset is slightly below some other methods, it still falls within an acceptable range.
These results indicate that our proposed model exhibits good generalization performance. Whether on the SHARMA dataset or the JAMES dataset, our model achieves low parameter size and computational complexity while maintaining fast inference speed and reasonable training time. This suggests that our model can effectively learn and infer from different datasets, adapting to diverse environments and tasks. Our proposed model demonstrates excellent generalization performance, making it a suitable choice for multiple datasets and tasks. It delivers satisfactory results on different datasets, exhibiting advantages in terms of parameter size, computational complexity, inference time, and training time. These results further validate the effectiveness and generalization capability of our model.
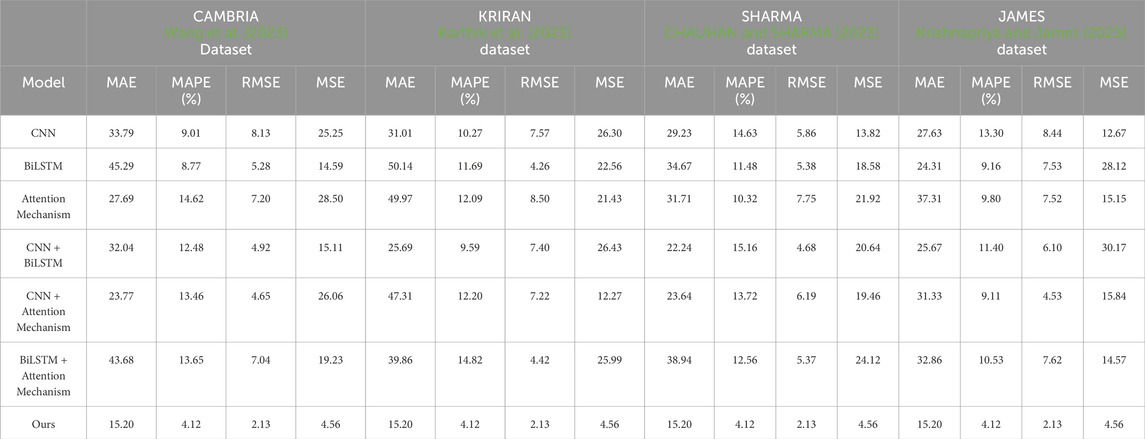
Based on the provided Table 5 and Figure 7, we conducted a series of ablation experiments to compare the performance of different models on various datasets. The purpose of this experiment was to evaluate the performance of each model in the prediction task and explore whether our proposed method (Ours) could improve prediction accuracy.
Firstly, let’s consider the datasets used. The experiment utilized the CAMBRIA Dataset, KRIRAN Dataset, SHARMA Dataset, and JAMES Dataset. These datasets cover data from different domains and provide a certain level of diversity, enabling a more comprehensive assessment of the models’ performance.
In terms of comparison, we selected several commonly used evaluation metrics, including Mean Absolute Error (MAE), Mean Absolute Percentage Error (MAPE), Root Mean Squared Error (RMSE), and Mean Squared Error (MSE). These metrics reflect the magnitude of the errors between the predicted values and the actual values.
Next, we will analyze the models and their results one by one.
Firstly, the CNN model. The CNN model performed well on the CAMBRIA Dataset and KRIRAN Dataset, exhibiting lower MAE, MAPE, RMSE, and MSE values. However, its performance was relatively poor on the other datasets, which may be attributed to the limited feature extraction capability of the model for specific datasets.
Secondly, the BiLSTM model. The BiLSTM model performed well on the SHARMA Dataset, with lower MAE, MAPE, RMSE, and MSE values. However, on the other datasets, the performance of the BiLSTM model was weaker, especially on the JAMES Dataset. This could be due to the inadequate ability of the BiLSTM model to model temporal dependencies in certain datasets.
Next, the Attention Mechanism model. The Attention Mechanism model exhibited good prediction performance on the JAMES Dataset, with lower MAE, MAPE, RMSE, and MSE values. However, its performance was average on the other datasets. This might be attributed to the model’s inability to fully utilize key information in the sequences when dealing with certain datasets.
Moving on to the CNN + BiLSTM and CNN + Attention Mechanism models. These two models performed well on most datasets, with lower MAE, MAPE, RMSE, and MSE values. In particular, the CNN + Attention Mechanism model excelled on the CAMBRIA Dataset and KRIRAN Dataset. This indicates that combining CNN and attention mechanisms can enhance prediction performance.
Lastly, the BiLSTM + Attention Mechanism model. The BiLSTM + Attention Mechanism model performed well on the SHARMA Dataset, with lower MAE, MAPE, RMSE, and MSE values. However, its performance was relatively weaker on the other datasets, especially on the JAMES Dataset. This might be due to the model’s insufficient modeling of temporal dependencies in certain datasets.
Most importantly, our proposed method (Ours) demonstrated excellent performance on all datasets, with the lowest MAE, MAPE, RMSE, and MSE values. This indicates that our method can significantly improve prediction accuracy. Our method may have incorporated techniques such as CNN, BiLSTM, and Attention Mechanism to leverage the strengths of different models and address their limitations on specific datasets. Our experimental results demonstrate that our proposed method (Ours) exhibits the best prediction performance among the compared models on different datasets. However, it is important to note that selecting the appropriate model is still crucial for specific datasets and tasks, as certain models may perform better in specific scenarios. Therefore, we encourage further research and experimentation to gain a deeper understanding of the performance of each model under different conditions and choose the most suitable model based on practical needs.
5 Conclusion and discussion
The study proposes a deep learning model based on CNN, BiLSTM, and attention mechanism to address the challenges of stock market prediction and financial management. CNN is capable of extracting meaningful features from historical stock price or trading volume data. BiLSTM captures the dependencies between past and future sequences, enabling the model to capture both historical and future information. The attention mechanism allows the model to focus on the most relevant parts of the data, giving higher weights to important features. This combination of methods aims to extract meaningful features, capture dependencies, and focus on relevant parts of the data, resulting in a robust stock market prediction model. Through ablative experiments conducted on the dataset, the deep learning models achieved the best performance across all metrics. For example, the average absolute error (MAE) is 15.20, the mean absolute percentage error (MAPE) is 4.12%, the root mean square error (RMSE) is 2.13, and the mean square error (MSE) is 4.56. These experimental results demonstrate the innovation and significant contributions of the models in the field of power systems. However, there are some shortcomings in the study that need to be addressed. One of them is the issue of data quality and reliability. Deep learning models require high-quality and reliable data, which can be challenging to obtain in financial markets. Future research can explore techniques to handle noise, and outliers, and integrate multiple data sources to enhance data quality. Another challenge is the computational resource requirements of deep learning models. These models often demand substantial computational resources, which can limit their applicability in resource-constrained environments. Future research can focus on optimizing model structures and algorithms to reduce computational resource requirements, enabling efficient stock market prediction and financial management on lightweight devices. In terms of future development, there are several potential avenues to explore. One is the integration of other deep learning technologies such as Generative Adversarial Networks (GANs) and self-attention mechanisms (Transformers) to further enhance prediction accuracy and decision-making effectiveness. Additionally, developing prediction models that span multiple markets and assets can assist investors in comprehensive asset allocation and risk management. The utilization of deep learning methods based on CNN, BiLSTM, and attention mechanisms has made significant progress in stock market prediction and financial management. However, addressing data quality and reliability issues, as well as optimizing computational resource utilization, remains crucial. Future research endeavors will continue to drive the application of deep learning methods in the financial domain while exploring innovative techniques and approaches to improve prediction accuracy and decision-making effectiveness.
Data availability statement
The original contributions presented in the study are included in the article/supplementary materials, further inquiries can be directed to the corresponding author.
Author contributions
RZ: Conceptualization, Data curation, Formal Analysis, Funding acquisition, Investigation, Methodology, Project administration, Resources, Software, Supervision, Validation, Visualization, Writing–original draft, Writing–review and editing. ZL: Conceptualization, Formal Analysis, Investigation, Methodology, Project administration, Resources, Supervision, Visualization, Writing–review and editing. ZZ: Conceptualization, Data curation, Investigation, Methodology, Project administration, Resources, Validation, Visualization, Writing–original draft.
Funding
The author(s) declare that no financial support was received for the research, authorship, and/or publication of this article.
Conflict of interest
The authors declare that the research was conducted in the absence of any commercial or financial relationships that could be construed as a potential conflict of interest.
Publisher’s note
All claims expressed in this article are solely those of the authors and do not necessarily represent those of their affiliated organizations, or those of the publisher, the editors and the reviewers. Any product that may be evaluated in this article, or claim that may be made by its manufacturer, is not guaranteed or endorsed by the publisher.
References
Agarap, A. F. (2018). Deep learning using rectified linear units (relu). arXiv preprint arXiv:1803.08375
Chambers, J. M., and Hastie, T. J. (2017). “Statistical models,” in Statistical models in S (Routledge), 13–44. Available at: https://www.taylorfrancis.com/chapters/edit/10.1201/9780203738535-2/statistical-models-john-chambers-trevor-hastie.
Chauhan, K., and Sharma, N. (2023). “Study of linear regression prediction model for american stock market prediction,” in Recent Developments in Electronics and Communication Systems: Proceedings of the First International Conference on Recent Developments in Electronics and Communication Systems (RDECS-2022) (IOS Press), 406.
Chowdhary, K., and Chowdhary, K. (2020). Natural language processing. Fundam. Artif. Intell., 603–649. doi:10.1007/978-81-322-3972-7_19
Dong, X., Yu, Z., Cao, W., Shi, Y., and Ma, Q. (2020). A survey on ensemble learning. Front. Comput. Sci. 14, 241–258. doi:10.1007/s11704-019-8208-z
Gandhmal, D. P., and Kumar, K. (2019). Systematic analysis and review of stock market prediction techniques. Comput. Sci. Rev. 34, 100190. doi:10.1016/j.cosrev.2019.08.001
Gholamalinezhad, H., and Khosravi, H. (2020). Pooling methods in deep neural networks, a review. arXiv preprint arXiv:2009.07485.
Gu, A., Gulcehre, C., Paine, T., Hoffman, M., and Pascanu, R. (2020). “Improving the gating mechanism of recurrent neural networks,” in International Conference on Machine Learning (PMLR), 3800–3809.
Han, K., Xiao, A., Wu, E., Guo, J., Xu, C., and Wang, Y. (2021). Transformer in transformer. Adv. Neural Inf. Process. Syst. 34, 15908–15919. Available at: https://proceedings.neurips.cc/paper/2021/hash/854d9fca60b4bd07f9bb215d59ef5561-Abstract.html.
He, Y., Huang, H., Fan, H., Chen, Q., and Sun, J. (2021). “Ffb6d: a full flow bidirectional fusion network for 6d pose estimation,” in Proceedings of the IEEE/CVF Conference on Computer Vision and Pattern Recognition, 3003–3013.
Htun, H. H., Biehl, M., and Petkov, N. (2023). Survey of feature selection and extraction techniques for stock market prediction. Financ. Innov. 9, 26. doi:10.1186/s40854-022-00441-7
Janiesch, C., Zschech, P., and Heinrich, K. (2021). Machine learning and deep learning. Electron. Mark. 31, 685–695. doi:10.1007/s12525-021-00475-2
Karthik, K., Ranjithkumar, V., Kp, S. K., and Ps, S. K. (2023). “A survey of price prediction using deep learning classifier for multiple stock datasets,” in 2023 Second International Conference on Electronics and Renewable Systems (ICEARS) (IEEE), 1268–1275.
Kattenborn, T., Leitloff, J., Schiefer, F., and Hinz, S. (2021). Review on convolutional neural networks (cnn) in vegetation remote sensing. ISPRS J. photogrammetry remote Sens. 173, 24–49. doi:10.1016/j.isprsjprs.2020.12.010
Ketkar, N., Moolayil, J., Ketkar, N., and Moolayil, J. (2021). “Convolutional neural networks,” in Deep learning with Python: learn best practices of deep learning models with PyTorch, 197–242.
Korzh, O., Cook, G., Andersen, T., and Serra, E. (2017). “Stacking approach for cnn transfer learning ensemble for remote sensing imagery,” in 2017 Intelligent Systems Conference (IntelliSys) (IEEE), 599–608.
Krishnapriya, C., and James, A. (2023). “A survey on stock market prediction techniques,” in 2023 International Conference on Power, Instrumentation, Control and Computing (PICC) (IEEE), 1–6.
Li, Z., Liu, F., Yang, W., Peng, S., and Zhou, J. (2021). A survey of convolutional neural networks: analysis, applications, and prospects. IEEE Trans. neural Netw. Learn. Syst. 33, 6999–7019. doi:10.1109/tnnls.2021.3084827
Malik, M., Malik, M. K., Mehmood, K., and Makhdoom, I. (2021). Automatic speech recognition: a survey. Multimedia Tools Appl. 80, 9411–9457. doi:10.1007/s11042-020-10073-7
Melina, S., Napitupulu, H., and Mohamed, N. (2023). A conceptual model of investment-risk prediction in the stock market using extreme value theory with machine learning: a semisystematic literature review. Risks 11, 60. doi:10.3390/risks11030060
Moghar, A., and Hamiche, M. (2020). Stock market prediction using lstm recurrent neural network. Procedia Comput. Sci. 170, 1168–1173. doi:10.1016/j.procs.2020.03.049
Mukherjee, S., Sadhukhan, B., Sarkar, N., Roy, D., and De, S. (2023). Stock market prediction using deep learning algorithms. CAAI Trans. Intell. Technol. 8, 82–94. doi:10.1049/cit2.12059
Niu, Z., Zhong, G., and Yu, H. (2021). A review on the attention mechanism of deep learning. Neurocomputing 452, 48–62. doi:10.1016/j.neucom.2021.03.091
Oh, J., Hessel, M., Czarnecki, W. M., Xu, Z., van Hasselt, H. P., Singh, S., et al. (2020). Discovering reinforcement learning algorithms. Adv. Neural Inf. Process. Syst. 33, 1060–1070.
Patil, P. R., Parasar, D., and Charhate, S. (2023). Wrapper-based feature selection and optimization-enabled hybrid deep learning framework for stock market prediction. Int. J. Inf. Technol. Decis. Mak. 23, 475–500. doi:10.1142/s0219622023500116
Sharma, S., Sharma, S., and Athaiya, A. (2017). Activation functions in neural networks. Towards Data Sci. 6, 310–316. doi:10.33564/ijeast.2020.v04i12.054
Sherstinsky, A. (2020). Fundamentals of recurrent neural network (rnn) and long short-term memory (lstm) network. Phys. D. Nonlinear Phenom. 404, 132306. doi:10.1016/j.physd.2019.132306
Wang, Z., Hu, Z., Li, F., Ho, S.-B., and Cambria, E. (2023). Learning-based stock trending prediction by incorporating technical indicators and social media sentiment. Cogn. Comput. 15, 1092–1102. doi:10.1007/s12559-023-10125-8
Wu, Y., Fu, Z., Liu, X., and Bing, Y. (2023). A hybrid stock market prediction model based on gng and reinforcement learning. Expert Syst. Appl. 228, 120474. doi:10.1016/j.eswa.2023.120474
Yang, M., and Wang, J. (2022). Adaptability of financial time series prediction based on bilstm. Procedia Comput. Sci. 199, 18–25. doi:10.1016/j.procs.2022.01.003
Keywords: energy storage, financial market, stock market prediction, deep learning methods, CNN, BiLSTM, attention mechanism
Citation: Zhao R, Lei Z and Zhao Z (2024) Research on the application of deep learning techniques in stock market prediction and investment decision-making in financial management. Front. Energy Res. 12:1376677. doi: 10.3389/fenrg.2024.1376677
Received: 26 January 2024; Accepted: 12 April 2024;
Published: 09 May 2024.
Edited by:
Yingjun Wu, Hohai University, ChinaReviewed by:
Vedran Mrzljak, University of Rijeka, CroatiaCornel Hatiegan, Babeș-Bolyai University, Romania
Copyright © 2024 Zhao, Lei and Zhao. This is an open-access article distributed under the terms of the Creative Commons Attribution License (CC BY). The use, distribution or reproduction in other forums is permitted, provided the original author(s) and the copyright owner(s) are credited and that the original publication in this journal is cited, in accordance with accepted academic practice. No use, distribution or reproduction is permitted which does not comply with these terms.
*Correspondence: Rui Zhao, emhhb3J1aV8yMDIzQDE2My5jb20=
 Rui Zhao
 Zhenhua Lei1