 Jinni Luo
 Hexu Yang1*
- 1Ningxia Institute of Science and Technology, Shizuishan, China
- 2Ningxia Belite Chemical Cyanamide Development Co., Ltd, Shizuishan, China
In China, where energy activities, predominantly driven by fossil fuel combustion, account for nearly 90% of the country’s greenhouse gas (GHG) emissions and coal power alone contributes over 40%, the shift towards carbon neutrality is a critical national ambition. This study conducts a comprehensive comparison of the environmental impacts of solar photovoltaic power generation (SPPG) and coal power, employing both life cycle assessment and ecological footprint analysis. We meticulously analyze the complete lifecycle of SPPG, pinpointing key stages of GHG emissions, and offer nuanced, localized policy recommendations. Our findings indicate that a 1 kWp SPPG module emits 1,601.18 kg of GHGs over its lifespan, equating to 1.35 kg/kW·h per unit of electricity produced—substantially lower than the 4.81 kg/kW·h emitted by coal power, thus highlighting the latter’s heightened environmental detriment. Additionally, this study assesses the ecological footprint of both energy sources in Ningxia. SPPG emerges with an ecological surplus, showcasing a per capita footprint of 0.0342 hm2, compatible with Ningxia’s ecological capacity. In stark contrast, coal power exhibits a sustained ecological deficit over the past 5 years, with a growing per capita footprint of 0.6529 hm2, underscoring its unsustainability. This research provides a detailed comparative analysis of the environmental impacts of SPPG and coal power in Ningxia, offering valuable insights for energy policymakers and industry stakeholders. It underscores the urgent need for industrial restructuring towards more sustainable and renewable energy sources, aligning with China’s broader objectives of environmental preservation and achieving carbon neutrality.
1 Introduction
The global climate crisis, fuelled by rising greenhouse gas (GHG) emissions, poses an existential threat to our planet. Energy production, a vital cog in the wheel of economic progress, is also one of the primary contributors to this environmental challenge (Zhang and Gao, 2023). Historically, the reliance on fossil fuels for energy has been the principal driver of GHG emissions, contributing significantly to global warming and climate change (Liu et al., 2023). China’s energy sector, dominated by coal, has been the backbone of its economic powerhouse status (Gao et al., 2021). Coal power, a significant contributor to China’s energy mix, has also been a major source of its GHG emissions, accounting for over 40% of the total emissions (Zhang et al., 2020). This heavy reliance on coal has led to substantial environmental and health concerns, including air pollution and a considerable carbon footprint (Yousri et al., 2021). However, in recent years, there has been a paradigm shift. In September 2020, China announced ‘double carbon’ target-a pledge to reach a carbon peak before 2030 and achieve carbon neutrality by 2060, commonly referred to as the. This ambitious commitment is a clear signal of China’s intention to transition towards a more sustainable energy future and holds substantial implications for global climate change mitigation efforts.
The transition from fossil fuels to renewable energy sources has become a cornerstone of China’s strategy to meet its ‘double carbon’ goals. The urgency of this transition cannot be overstated, given the escalating climate crisis and China’s significant role in global GHG emissions. Among various renewable energy options, solar photovoltaic power generation (SPPG) stands out as a particularly promising alternative (Wang et al., 2019). The evaluation of ecological impacts from various energy production methods involves renewable energy approaches, life cycle assessment (LCA), and the ecological footprint methodology. LCA is established as a mature framework that allows for a comprehensive assessment of environmental impacts associated with energy consumption and emissions across the entire lifecycle of renewable energy sources (Ahmed et al., 2020). On the other hand, the ecological footprint has become a widely utilized metric for addressing direct and indirect environmental impacts in studies on environmental sustainability, quantifying the influence of human activities on the ecosystem (Alola et al., 2019).
Previous studies have predominantly focused on either the economic feasibility or technological aspects of renewable energy. For example, studies have explored the environmental repercussions of China’s burgeoning solar energy sector, propelled by policy subsidies (Hong et al., 2016; Huang et al., 2017; Yu et al., 2017). The LCA method has been instrumental in evaluating the environmental trade-offs of China’s solar photovoltaic industry (Xu et al., 2018). Regarding biomass energy, the last decade has indicated its potential as an interim substitute for fossil fuels (Udomsirichakorn and Salam, 2014), with a growing body of research employing LCA to examine the environmental effects of various biomass fuels, their logistics, and biopower technologies between 2009 and 2020 (Magelli et al., 2009; Song et al., 2017; Hossain and Poon, 2018; Liu et al., 2019). However, less emphasis on the combination evaluation of comparative environmental impacts including both LCA and ecological footprints. This study aims to fill this gap by providing a detailed comparative analysis of the life cycle assessment and ecological footprints of SPPG and coal power generation. The significance of this research lies in its potential to inform policymakers and stakeholders about the environmental implications of energy choices. By evaluating both the GHG emissions and ecological footprints of SPPG and coal power, this study offers a holistic view of their environmental impacts, thereby contributing valuable insights to the discourse on sustainable energy transition in China.
With its abundant light and long sunshine hours, Ningxia province, located in the northwest of China, presents an ideal setting for the development and utilization of SPPG. The region’s natural endowments, combined with advancements in solar technology, position it as a key player in China’s renewable energy landscape. The development of SPPG in Ningxia not only aligns with the national energy policy but also offers a model for sustainable energy development that can be replicated in other regions.
The objective of this study is to conduct a comparative analysis of the environmental impacts of SPPG and coal power generation systems in Ningxia, focusing on their life cycle assessments and ecological footprints. Then, a comprehensive analysis will be conducted to combine all evaluation indictors. This comparison aims to shed light on the respective environmental burdens of these two energy sources and provide a basis for informed decision-making in China’s energy policy. Finally, the paper will conclude with a summary of the key findings and their significance, along with suggestions for future research in this area.
2 Methodology
2.1 System boundary and database
This research uses Ningxia city as a case study. The Ningxia region is very rich in solar energy resources, with an annual average of solar radiation between 4,950 MJ/m2 and 6,100 MJ/m2, and the interannual changes in the distribution of solar radiation in the region are relatively stable. And Ningxia is one of the country’s three major silica bases, with the world’s largest silica and quartz ore resources, its high-quality silicon ore resources reserve of up to 4.28 billion tonnes, and its silicon processing industry chain is more complete, with the production of polysilicon is the most notable. Therefore, the photovoltaic industry chain has been more perfect in Ningxia, which is also one of the factors that photovoltaic can be vigorously developed in this region.
This study focuses on the grid-connected solar photovoltaic (PV) systems in Ningxia, China, emphasizing multicrystalline silicon solar panels due to their established industry presence in the region. There are three main parts of the PV industry chain. Upstream includes the manufacture and acquisition of silicon raw materials, the preparation of polysilicon materials, the ingot casting of polysilicon materials, and the preparation of polysilicon wafers; midstream includes the production of cells, the production of battery modules, and the production of balance-of-systems components; and downstream involves the assembly of its parts to form a complete photovoltaic power generation system. The research delineates the system boundary for lifecycle assessment and ecological footprints, as shown in Figure 1. Based on the life cycle assessment and the life cycle technology framework and characteristics, the following statements are made in response to the system boundary diagram drawn above: 1) Production equipment, plant construction, workforce, and transport vehicles not considered; 2) Challenges in estimating transmission distances and energy consumption within Ningxia lead to exclusion of this aspect; 3) Complex components like DC converter boxes excluded due to limited literature and minor impact on overall carbon emissions; 4) Emission-free and pollution-free nature of solar PV systems during operation leads to their exclusion from the lifecycle analysis.
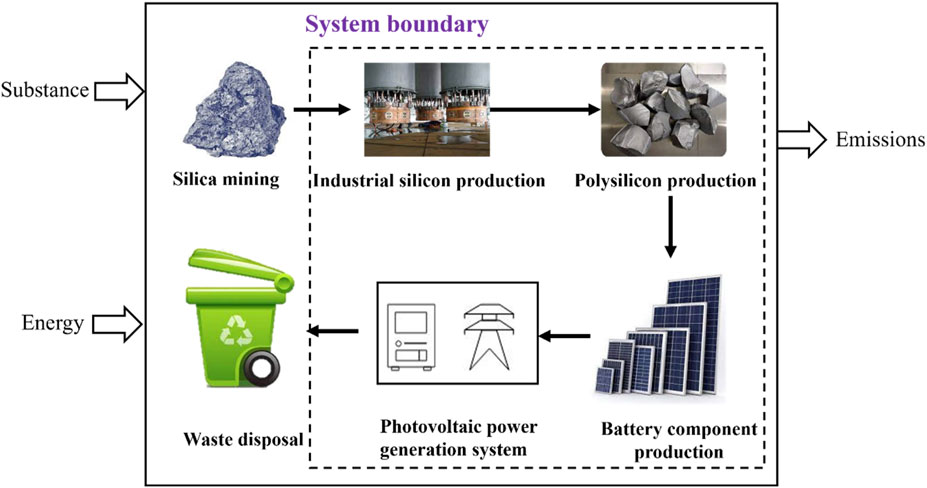
Figure 1. System boundary for lifecycle assessment and ecological footprints.
The data sources and statistics of this paper are mainly in the following ways: official websites of domestic PV enterprises, relevant articles and industry reports, and inventory data of similar processes or products. Lifecycle GHG emissions for PV systems are derived by multiplying electrical consumption by the updated emission factor, 0.5810 t CO₂/MWh, as specified by China’s climate change authorities for 2021 and 2022 emissions reporting (China Energy Statistical Yearbook, 2021; Ningxia Statistical Yearbook, 2022). Due to data acquisition difficulties, this paper uses literature averages for non-electrical emissions. For simplicity, emissions are expressed as kg CO₂/kWh, and related silicon flow data are compiled in Table 1.
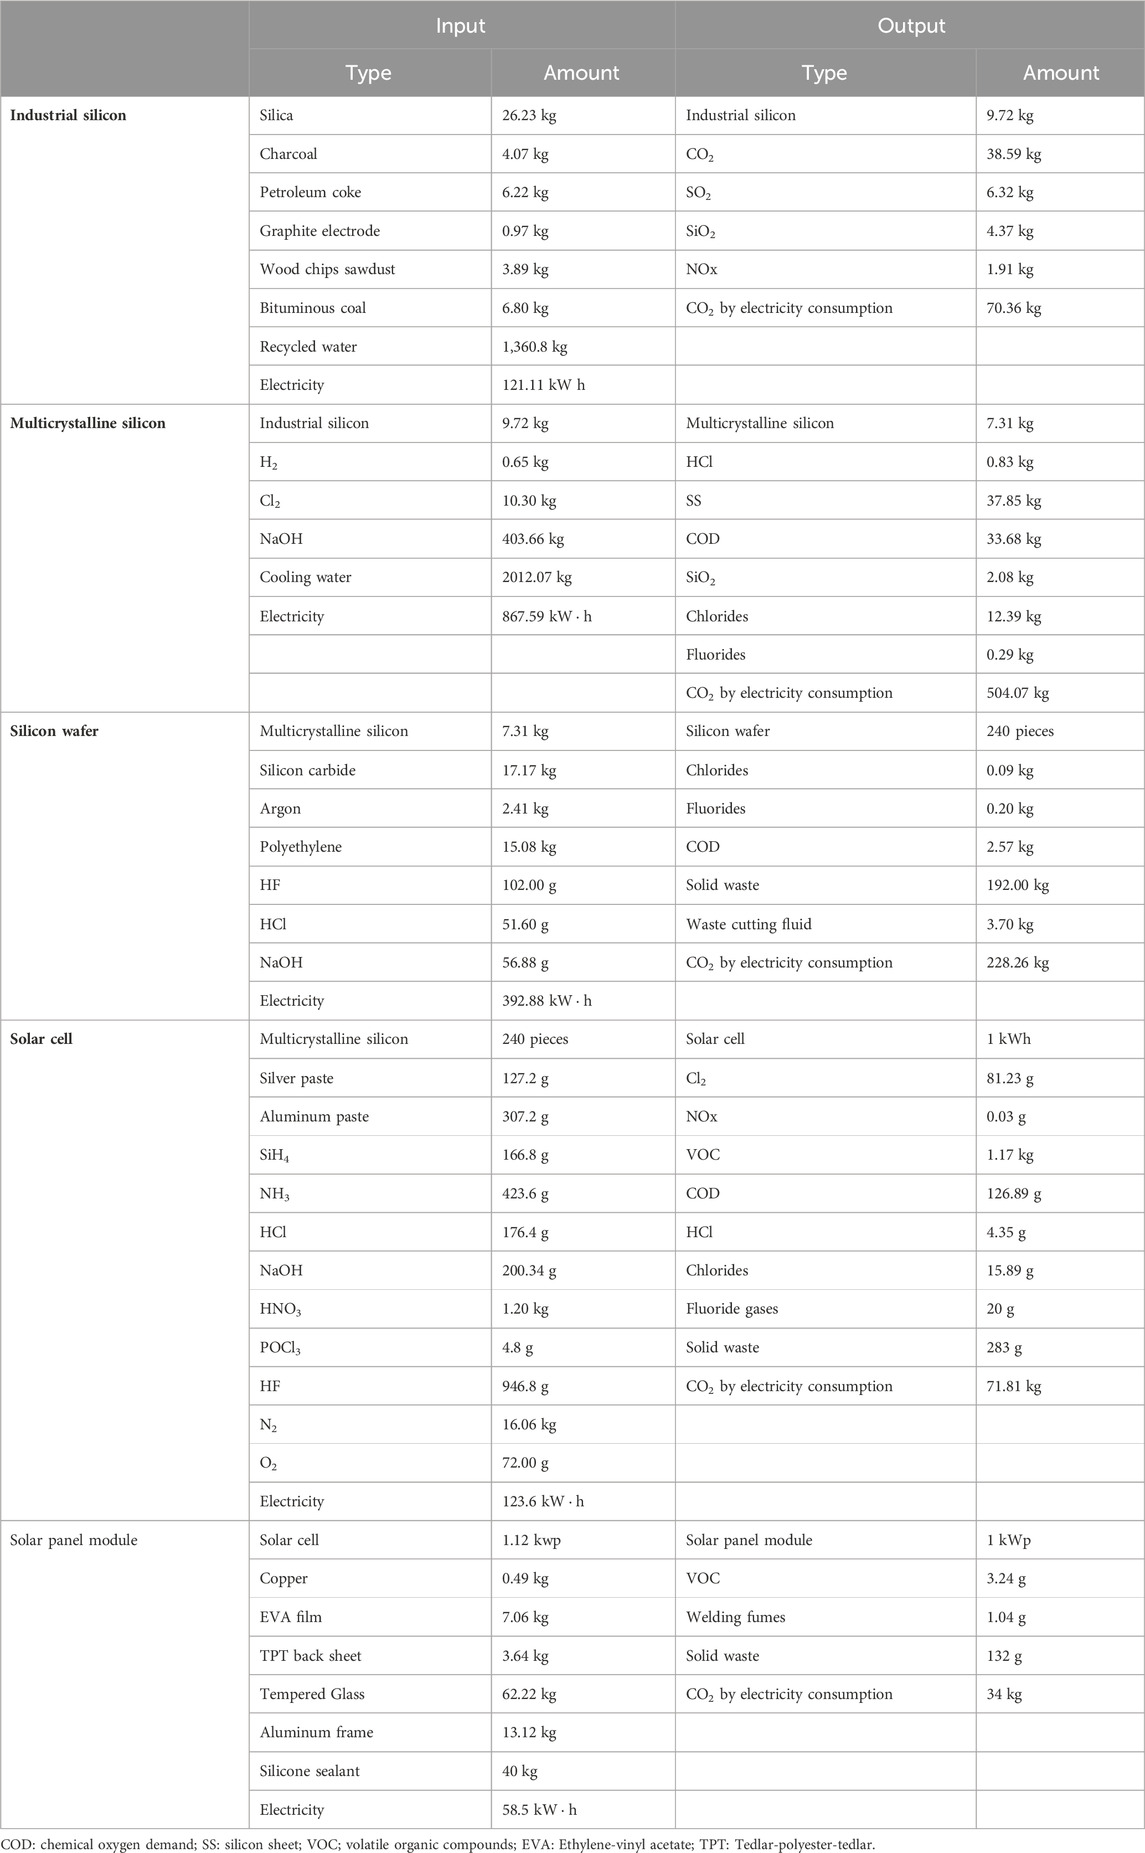
Table 1. Total input and output of multicrystalline silicon SPPG system.
PV power generation, a renewable resource, requires land occupation, varying by layout-distributed PV on rooftops and spare spaces in urban areas, and centralized PV in regions with longer sunlight exposure, as per regional planning. Although both types occupy land, the dispersed nature and complex land use of distributed PV make data collection challenging. Therefore, this study focuses on resource consumption during the manufacturing of PV components in Ningxia, including silica mining, industrial silicon production, and polycrystalline silicon production. After data processing and calculation, the total resource consumption, standard coal consumption and its corresponding carbon emission of the photovoltaic industry chain in Ningxia is shown in Table 2.
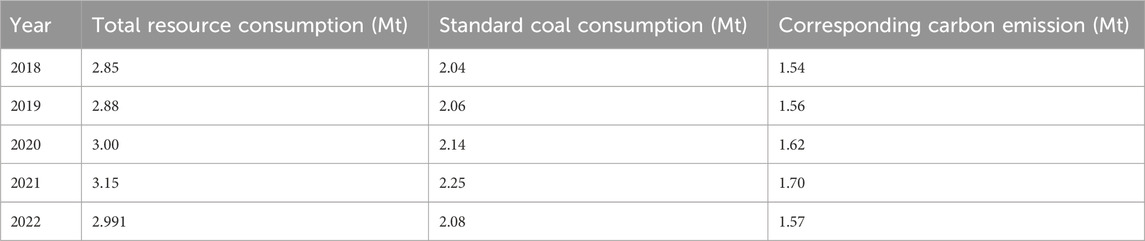
Table 2. Total coal consumption, standard coal consumption and its corresponding carbon emission of the photovoltaic industry chain in Ningxia.
For comparison, the emission and ecological footprints of coal power generation system is calculated to evaluate the performance of SPPG system. For the life-cycled assessment, a clean coal-fired project with 2 × 1000 MW ultra-supercritical power plant is used for the case study (Yu et al., 2017). For ecological footprints study, the coal resource consumption in the power generation process of coal-fired power generation in Ningxia is used for analysis and calculation. These data could be checked in the reference and official reports, which will not be presented here.
2.2 Life cycle assessment
The entire photovoltaic power generation system production chain is divided into four stages: raw material production stage, solar photovoltaic module system production stage, transportation stage and waste recycling and disposal stage (Guinee et al., 2011). Based on these four stages, this GHG emission of the system is calculated as follows:
where Ct is the total carbon emissions of the entire life cycle of the photovoltaic power generation system, kg; M is the total carbon emissions of the raw material production stage, kg; P is the total carbon emissions of the solar photovoltaic module system production stage, kg; T is the total carbon emissions in the transportation stage, kg; W is the total carbon emissions in the waste recycling disposal stage, kg.
The quantification of the GHG emissions from four stages, is conducted by a process-based life cycle assessment method, as presented in Eq. 2:
where EP is the total GHG emissions; AD refers to the activity amount, such as the consumption amount of silicon (t); EFelectricity is the emission factor of different processes.
Environmental impact assessment quantitatively evaluates impacts using inventory analysis data on resources, energy, and emissions. This process, governed by the International Society of Environmental Toxicology and Chemistry (ISETC), involves classification, characterization, and valuation. Key impact areas are resource utilization, human health, and ecosystem integrity, encompassing subcategories like mineral and fuel depletion, global warming potential, acidification, photochemical ozone formation, eutrophication, particulate matter, and solid waste management. The analysis should consider emissions that cause multiple types of impacts; if these impacts are independent, they should be included. Based on this model, the study categorizes the lifecycle inventories of SPPV and coal power generation. Key environmental impact categories for solar PV include resource consumption, fossil fuel usage, global warming potential, photochemical ozone creation, acidification, and eutrophication. Detailed classifications of the SPPV power generation inventory and coal power generation inventory are presented in Table 3.
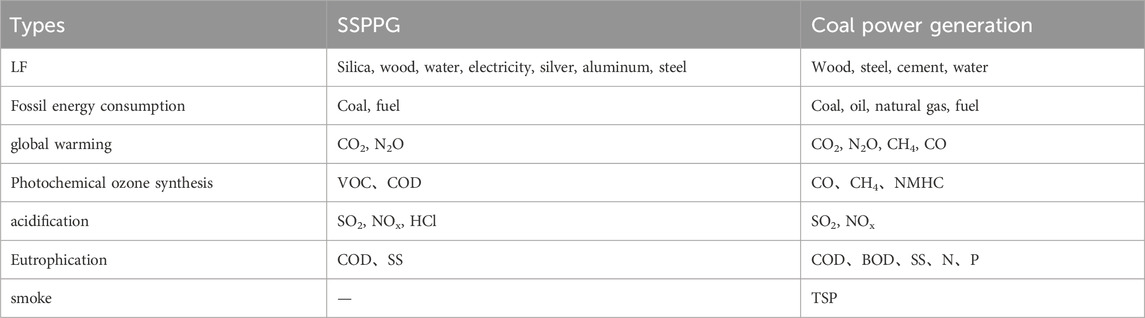
Table 3. Detailed classifications of the SPPV power generation inventory and coal power generation inventory.
The contribution of pollutant k to a specific environmental impact type t, denoted as
where
2.3 Ecological footprints
The ecological footprint serves as a sustainability metric based on terrestrial area (Wackernagel et al., 1999). Defined as the ecological land area needed to absorb the natural resources consumed and waste emitted by a specific population or region, it primarily includes arable land, forest land, land for fossil energy, buildable land, and water bodies. This method is the carbon footprint of energy consumption, which refers to the ratio of carbon emissions to the forest area conversion coefficient, as shown in Eq. 4:
Where CF represents the carbon footprint of energy consumption (in ten thousand hectares); C denotes the total carbon emissions from energy consumption (in ten thousand tons); and S is the conversion coefficient between carbon emissions and forest area (in tons per hectare), which is set to 6.49 t/hm2.
The calculation formula of carbon emissions is:
Where Pi is the consumption of fossil energy; Qi is the carbon emission coefficient of fossil energy.
Ecological footprint calculations are predicated on the fundamental fact that humans can determine most resources consumed and the quantity of waste produced; these resource flows and waste can be converted into corresponding bioproductive areas (Wackernagel, 1996). Therefore, the ecological footprint of an individual or a nation represents the productive area, including land and water bodies, that supplies all resources consumed and assimilates all waste generated by the populace. Due to the significant variation in bioproductive capacity across unit areas of cropland, fossil fuel land, pasture, and forest, it is necessary to convert different land types into a uniform standard for comparison. This is done by applying equivalence factors to the various bioproductive areas, to yield comparable bioproductive areas. The formula for calculating the ecological footprint is as follows:
where EF represents the ecological footprint in hm2; Ai is the per capita ecological footprint of the ith type of bioproduct;
The natural conditions and resource endowments of countries and regions vary greatly, as do the production capabilities per unit area of different types of land and the production areas per unit area of the same type of bioproducts. When calculating ecological carrying capacity, it is necessary to adjust the actual area of similar bioproductive lands in different countries and regions to enable comparisons. The formula for ecological carrying capacity is as follows:
where EC represents ecological carrying capacity in hm2; aj is the per capita actual area of the jth type of land; rj is the equivalence factor for the jth type of land; yj is the yield factor for the jth type of land.
The emergence of an ecological deficit is primarily to assess whether a country or region can sustain development through the analysis of ecological footprints and carrying capacity. An ecological deficit occurs when a region’s ecological footprint exceeds its carrying capacity, signifying unsustainable practices. Conversely, an ecological surplus within a region indicates sustainable development of the regional ecosystem. The formulas for calculating the ecological deficit or surplus are:
where ED represents the ecological deficit; ES represents the ecological surplus; EC is the ecological carrying capacity; EF is the ecological footprint.
3 Results and discussion
3.1 Life cycle assessment
3.1.1 Environmental impacts of solar photovoltaic power generation systems
To synthesize the pollutant emission figures and inventory analysis findings from previous sections on SPPG and coal power generation systems, a qualitative and quantitative analysis is conducted. This process involves transforming direct emission data of various environmental impact factors into potential environmental impact values. Such data characterization allows for a detailed comparative analysis of the two energy sources. The following is a characterization of the inventory data for both solar PV and coal power generation, with the processed results presented in Table 4.
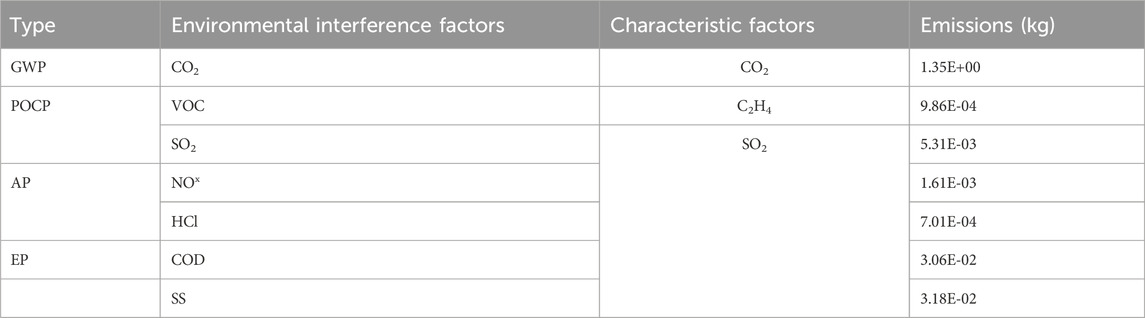
Table 4. Potential values of various environmental impacts of solar photovoltaic power generation systems.
The following clarifications are provided to supplement the data presented:
1 The emission data for the SPPG system represent the results obtained by converting the inventory analysis data from earlier sections to emissions per kilowatt-hour (kWh).
2 Due to the scarcity of literature on resource depletion coefficients and the dated nature of some parameters, their relevance is considered low. Since these coefficients are not central to the core research of this paper, they will not be analysed in detail.
3 The equivalence factors used for calculating the environmental impacts are sourced from reference (Author Anonymous, 2014).
Figure 2 compares the life cycle carbon emissions of different stages in SPPG system. The industrial silicon stage has a total emission value of 838.14 kg CO2-eq, with the highest contribution coming from the base category at 504.07 kg CO2-eq, followed by an additional 228.26 kg CO2-eq, 71.81 kg CO2-eq, and the topmost section at 34 kg CO2-eq. The base category is possibly representing the direct emissions from industrial processes, while the stacked segments could represent indirect emissions such as energy consumption, transportation, or other industrial activities. The multicrystalline silicon stage shows significantly lower total emissions, with a negligible contribution from the solar cell component (0.17 kg CO2-eq) and another minor contribution from the base category (3.24 kg CO2-eq). Moving to the silicon wafer stage, the total emissions are minimal, with no contribution from the solar cell component and a small emission value of 0.83 kg CO2-eq from the base category. The solar panel module stage has a total emission value of 198.42 kg CO2-eq, with the majority coming from the solar cell component at 126.89 kg CO2-eq, followed by the base category at 71.53 kg CO2-eq, and a minimal addition of 2.57 kg CO2-eq on top.
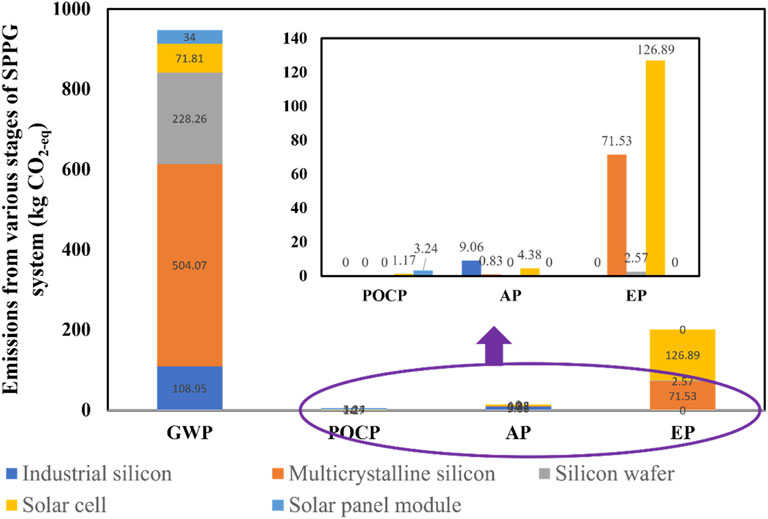
Figure 2. Life cycle carbon emissions of SPPG system.
In conclusion, the industrial silicon stage stands out as the most emission-intensive phase in the solar photovoltaic power generation system, significantly leading in environmental impact in terms of emissions. This highlights that the extraction and processing of silicon, crucial for solar panel production, are major sources of greenhouse gas emissions. In contrast, the multicrystalline silicon and silicon wafer stages have a considerably lower emission contribution, suggesting that these processes are more energy-efficient or inherently less intensive in terms of environmental impact. Moreover, the solar panel module stage, while contributing less to emissions than the industrial silicon stage, still accounts for a noteworthy portion of the total emissions, likely attributed to the final assembly and manufacturing processes of the solar panels. Therefore, to diminish the environmental footprint of solar photovoltaic power generation systems, it is imperative to concentrate efforts on reducing emissions particularly at the industrial silicon stage. This could be achieved through advancements in industrial methodologies or by enhancing energy efficiency within these processes.
3.1.2 Compassion of coal power system
Figure 3 presents data reveals comparative insights into the environmental impact potential, specifically GWP, POCP, AP, and EP of SPPG and coal power systems. For global warming potential, coal power systems exhibit a slightly higher potential value (1.58E+00) compared to solar PV systems (1.35E+00). This indicates that coal power systems have a greater propensity to exacerbate the greenhouse effect than solar PV systems, aligning with the conventional understanding of coal’s impact due to its carbon-intensive nature. When examining the photochemical ozone creation potential, the value for solar PV systems (9.86E-04) is approximately an order of magnitude higher than that of coal power (5.34E-04). The near-negligible potential of coal power in this category suggests that solar PV systems, despite their renewable status, may have a larger contribution to this environmental impact. This could be attributed to the life cycle emissions of volatile organic compounds during the manufacturing processes of solar panels. Regarding acidification potential, solar PV systems present a value (5.31E-03) that is just over half of what is reported for coal power systems (7.66E-03). This indicates that coal power has a more substantial acidifying effect on the environment, which is consistent with the emissions profile of coal combustion, known for releasing sulfur dioxide and nitrogen oxides that contribute to acid rain.
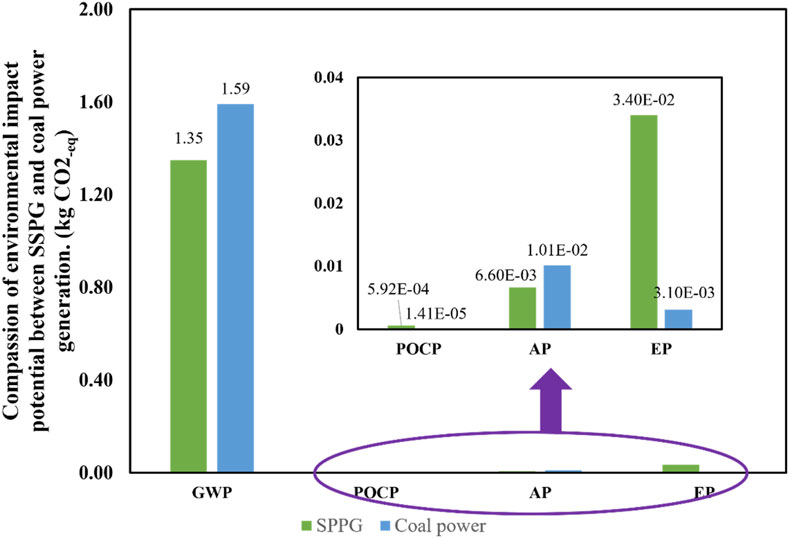
Figure 3. Compassion of environmental impact potential between SSPG and coal power generation.
While solar PV systems show a lower potential for global warming and acidification compared to coal power systems, they exhibit a higher potential for photochemical ozone creation. These findings highlight the importance of considering multiple dimensions of environmental impact when assessing the sustainability of energy systems. They also underscore the need for continued innovation and improvement in the production and deployment of solar PV technology to further minimize its environmental footprint.
To facilitate a comparative analysis of greenhouse gas emissions between SPPG and coal power, emissions per unit of electricity generated are standardized, and the contributions of each stage to greenhouse gas emissions for both SPPG and coal power are briefly described and contrasted. The standardization process begins with SPPG emissions. As previously mentioned, all inventory data related to solar PV generation is collected and calculated based on a peak power output of one kWp, which is the amount of electricity generated per hour by a one kWp solar PV system under optimal lighting conditions. The paper calculates the CO2 emissions per kilowatt-hour of electricity generated in the first year of the system’s life.
The annual electricity generation is calculated as follows:
where Ep represents the electricity generated, HA is the total annual solar radiation on a horizontal plane, and PAZ is the installed capacity of the system.
The total annual solar radiation for Ningxia is taken as the average annual radiation of 4,950–6,100 MJ/m2," which is 5525 MJ/m or 1,534.72 kWh/m2.
Next, emissions per kilowatt-hour of electricity generated are used as the comparative unit to account for the emissions per unit of electricity for both energy sources. It was found that solar PV power generation emits 1.35 kg of greenhouse gases per kWh of electricity generated, whereas coal power emits 4.81 kg of greenhouse gases per kWh.
This standardization and comparison demonstrate that per unit of electricity generated, coal power has a significantly higher greenhouse gas emission rate than SPPG, which underlines the greater environmental efficiency of SPPG over coal power in terms of GHG emissions.
3.1.3 Suggestions
Ningxia region, endowed with abundant solar energy resources and minimal overcast days, is exceptionally well-suited for the development of SPPG projects. The region, particularly Shizuishan, is also rich in silicon resources, further enhancing its suitability for PV development. Research indicates that the carbon emission recovery period for the PV industry is significantly shorter than the lifespan of PV power generation, highlighting its substantial advantages in energy conservation and emission reduction. The environmental benefits of PV power are especially notable, warranting robust government support for the sector’s growth. Governmental agencies should plan long-term development strategies and policies for the PV industry, standardizing and regulating the sector while encouraging the advancement of PV technologies. Continuous government support, including national subsidies, will promote the development of home-based distributed PV and grid-connected PV stations. Encouraging residents to sell surplus electricity to grid companies can lead to mutual benefits.
In the multicrystalline silicon production phase, which emits the most greenhouse gases, strict standards and regulations are necessary. This includes stringent entry criteria for the multicrystalline silicon industry and the elimination of substandard PV component manufacturers, alongside encouraging the development of new technologies. Research departments should actively develop new techniques to achieve low-cost, low-energy production goals. PV enterprises should carefully plan and manage their costs and carbon emissions to reduce financial burdens. Exploring new technologies for the disposal and recycling of PV waste can save resources and reduce land pollution.
Regarding coal power, a traditional energy source, its stability and technological maturity mean it cannot yet be fully replaced, despite its significant contribution to the greenhouse effect. Coal power enterprises should optimize their coal-fired power generation processes or improve flue gas treatment technologies. As a major source of CO2 emissions in China, exploring energy-saving and emission-reducing directions, particularly Carbon Capture and Storage (CCS) technology, is critical for the future of fossil fuels (Ladenburg et al., 2024). Besides the above, addressing environmental pollution is crucial. While not the focus of this paper, it is important to mention. The environmental impact of coal power, previously categorized in this paper as resource consumption, fossil fuel usage, global warming, acidification, smog, and eutrophication, requires enhanced management and control, especially in controlling greenhouse gas emissions.
3.2 Ecological footprints
3.2.1 Ecological carrying capacity nalysis
In Figure 4, we can observe specific values that inform the ecological carrying capacity in Ningxia. The per capita footprint of coal power generation shows a substantial increase from 0.033458 hm2 in 2018 to 0.033598 hm2 in 2022, indicating a consistent pressure on the ecological system. On the other hand, the per capita footprint of SPPG remains considerably lower, with values ranging from 0.1069 hm2 in 2018 to 0.1324 hm2 in 2022, well below the ecological surplus threshold. The per capita forest land area in Ningxia, serving as a measure of ecological carrying capacity, is at 0.112 hm2. This is crucial as it is used to compare the ecological footprints of both coal power generation and SPPG. The data reveals that the per capita footprint for coal power far exceeds this value, whereas PV power’s footprint is below, suggesting that SPPG remains within the region’s ecological carrying capacity.
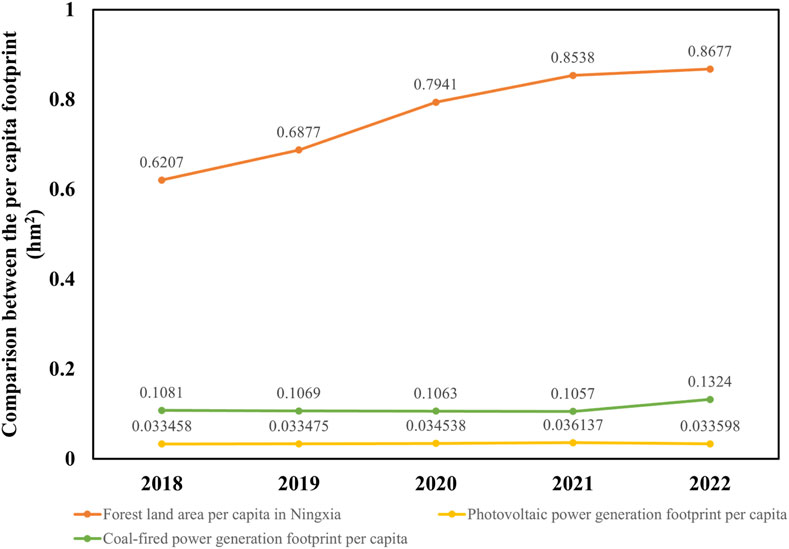
Figure 4. Comparison between the per capita footprint of photovoltaic power generation and coal-fired power generation in Ningxia and the per capita forest land area in Ningxia (Unit: hm2).
While Ningxia’s per capita forest land area is lower than the national average, indicating a relative scarcity of forest coverage, the region’s SPPG has not yet caused an ecological deficit, thanks to its clean energy production and the late start in its development. Despite Ningxia’s rich solar resources, the growth of the PV industry must be sustainable to ensure that the ecological footprint does not surpass the ecological carrying capacity in the future, thus avoiding undue environmental stress.
3.2.2 Ecological deficit
Figure 5 demonstrates the per capita ecological deficit caused by coal power generation in the Ningxia region from 2018 to 2022. The chart indicates a rising trend in the ecological deficit per capita for coal power generation in Ningxia, with specific values for the deficit increasing from 0.5126 hm2 in 2018 to 0.7353 hm2 in 2022. This trend reflects the region’s increasing installation of thermal power units and rapid socio-economic and industrial development, outpacing the relatively slow growth in ecological supply. This misalignment has led to a widening ecological deficit, with the deficit for the most recent year being a direct consequence of energy conservation and emission reduction measures not keeping pace with adjustments in the overall industrial structure of Ningxia’s power sector.
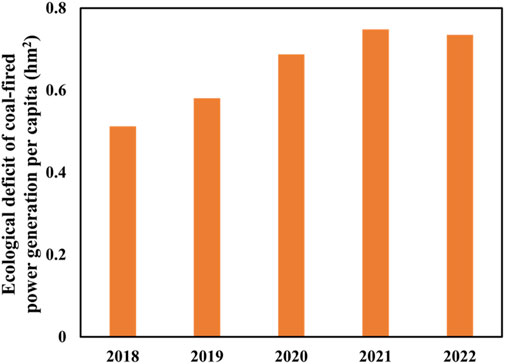
Figure 5. Ecological deficit of coal-fired power generation per capita in Ningxia from 2018 to 2022.
To address this, Ningxia must continue to optimize the installed structure of its power industry, reduce carbon emissions from thermal power units, and reinforce the gains made from converting farmland back to forest. The government should also increase investment in new energy projects like wind and solar photovoltaic power, promoting clean energy to replace traditional fossil fuels, thereby reducing coal consumption and air pollution. Additionally, by adjusting the industrial structure and improving enterprise profitability, Ningxia can foster a shift in its economic development model, effectively alleviating the regional ecological deficit caused by coal power generation.
3.2.3 Suggestions
The development of solar PV power enterprises in the Ningxia region offers significant potential, given its abundant sunlight and rare overcast days, making it an ideal locale for solar power projects. However, several critical factors must be considered for the successful implementation and operation of solar power stations. These include maintenance post-construction, efficiency in power generation, grid integration, the lifespan of solar power plants, and their abandonment rates. Addressing these concerns is essential for businesses in the industry.
At present, the carbon emissions from the production and manufacturing phases of the solar PV industry in Ningxia still result in ecological surpluses. The region’s rich silicon resources provide a distinct advantage in producing multicrystalline and monocrystalline silicon. However, it is crucial for manufacturers to minimize energy consumption across all processes, encourage the development of new technologies and processes, and phase out substandard PV component producers. Specifically, while Ningxia has made strides in PV equipment manufacturing, there is a need for more effort in developing high-precision and advanced products.
Solar PV companies should also plan meticulously regarding their production costs and carbon emissions. While the current carbon emissions from the solar PV industry in Ningxia indicate an ecological surplus, it is vital not to blindly increase production capacity without considering the region’s ecological carrying capacity. PV enterprises should actively seek new technologies for the disposal of solar PV waste, aiming to recycle and reuse various waste materials to conserve resources and reduce land pollution.
Besides SPPG, there are also some suggestions for coal-fired power generation companies. In Ningxia, a region abundant in coal resources, there’s an ecological deficit challenge due to the high carbon emissions from thermal power generation, which surpasses the area’s ecological carrying capacity. Despite this, thermal power continues to be a significant electricity source. Coal power enterprises in Ningxia should, therefore, prioritize optimizing their thermal units, focusing on shutting down smaller, more polluting ones to address this issue. As a significant contributor to CO2 emissions, the coal power sector is exploring energy conservation and emission reduction strategies. Among these, CCS technology has emerged as a promising approach to curb emissions in thermal power generation. Ningxia’s coal power enterprises are urged to innovate in these technologies and implement them promptly in their operations. Furthermore, with Ningxia’s reliance on coal for most of its thermal power, there is an opportunity to delve into clean coal technologies. Transforming and upgrading the coal power industry, coupled with increased investment in integrated coal power projects, is essential for the region’s move towards sustainable development in energy.
3.3 Comprehensive analysis
Figure 6 presents a comprehensive comparison of environmental impacts between an SPPG system and a coal power generation system. Each axis on the spider chart would represent a different dimensionless parameter related to environmental impacts, such as carbon footprint, energy efficiency, or pollutant emissions. The indexes of SPPG system’s performance on each environmental impact parameter is compared against the coal power generation, which is set as the baseline with an index value of 1. This normalization allows for an immediate visual grasp of how each system performs relative to the baseline coal power generation across multiple environmental criteria. The SPPG system, a renewable energy source, generally outperforms coal power in environmental impact, with a GWP that is 17.78% lower. However, in POCP, coal power is unexpectedly more efficient with 97.62% lower impact than SPPG. Coal power also shows a higher AP, at 53.03% above SPPG, while having a slightly better EP. Notably, ecological footprint of coal power generation system is almost 294% greater than SPPG, highlighting SPPG’s lower ecological impact. Despite SPPG’s advantages, the data reveals specific areas for potential improvement, especially considering the energy repayment ratio, emphasizing lifecycle sustainability.
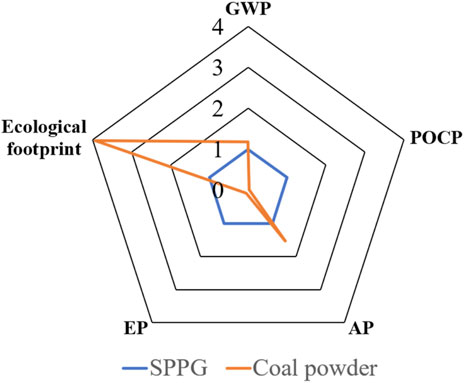
Figure 6. Comparison between SPPG system and coal power generation system.
By focusing on the energy repayment ratio instead of just the energy repayment time, the comparison considers the different lifespans of the power generation methods, which is crucial for an accurate assessment. This approach reflects an understanding that an energy source might take longer to ‘repay’ its energy investment but may still be more sustainable over a longer lifecycle. In conclusion, the figure demonstrates that the SPPG system is a more environmentally friendly option compared to coal power generation, with strengths in certain environmental impact parameters. However, there is still room for improvement and optimization to maximize its potential benefits over the lifecycle of the power generation system.
4 Implications and future perspectives
In recent years, with the rapid socio-economic development of urban areas, residents have elevated their demands for a better urban ecological environment. Over the past few decades, humanity has embarked on assessing the quality of the ecological environment, yet the measurement and quantification of natural resources remain challenging. Determining whether a region’s development is sustainable necessitates objective assessments using scientific models. These models not only accurately depict the developmental status of a region but also provide feasible strategies for regional development and timely planning.
This study focuses primarily on the Ningxia region, located in northwest China, characterized by its small population base and predominantly semi-arid climate. Transitioning from the initial post-establishment power shortages, where urban and rural areas relied on oil lamps, to its current state of widespread electrification, Ningxia now ranks at the forefront of thermal and renewable energy installation capacity in the northwest. This study conducts an ecological footprint model analysis of carbon resource consumption and carbon emissions during the production and manufacturing phases of both photovoltaic power and coal power generation in Ningxia. The research aims to ascertain the ecological gains and losses of photovoltaic and coal power generation in the region and offer suggestions for energy conservation and emission reduction in Ningxia’s power industry.
The paper meticulously delineates the system boundary, incorporating a variety of environmental impact potentials along with a full lifecycle evaluation. This approach is a step forward from the early lifecycle assessments of photovoltaic and coal power generation by researchers like Zhang and Zhu (Author Anonymous, 2014). Notably, this study expands on the carbon emissions from electricity consumption and the waste disposal stages of PV production, with an aspiration to make the lifecycle evaluation more comprehensive than previous literature. Compared to the analyses by He (Author Anonymous, 2017) and Sun (Author Anonymous, 2019), which were limited to inventory analyses of different lifecycle stages of photovoltaic and coal power, this paper delves into a more in-depth study and evaluation of environmental impacts.
However, the study faces challenges, particularly in data collection. Due to limitations in knowledge and data gathering, this paper focuses on multicrystalline silicon solar cells and ultra-supercritical thermal power plants. Other types, such as single-crystal silicon solar cells and subcritical power plants, have not been included, presenting an opportunity for future research. Additionally, the difficulty in collecting inventory data for Ningxia’s photovoltaic and coal power meant that the study often had to rely on other literature and averages, which might have introduced biases in the results. Future research opportunities also include a more detailed study of the impacts of photovoltaic power, with a focus on assessing the potential environmental impacts and calculating the economic costs and carbon emission recovery periods.
Furthermore, the paper encounters a significant challenge in obtaining accurate data for calculating the ecological footprint and carrying capacity of Ningxia. Complications arise from the need to account for resources consumed in the production of photovoltaic power and coal during power generation. The lack of comprehensive statistics on resource consumption and pollution emissions for both SPPG and coal power generation leads to approximations, potentially reducing the accuracy of the findings. Additionally, variations in fossil resource and energy conversion coefficients and carbon emission factors, due to differences in regional and production processes, further complicate the analysis. Consequently, future studies should aim to use various methods to collect more accurate data across different industries and products.
Despite the established concepts of ecological and carbon footprints, research focusing on the sustainable development of photovoltaic and coal power in Ningxia is still in its infancy. Addressing this gap, our study, which concentrates on the pollution issues of the power generation industry, contributes to the ongoing discourse on sustainability, particularly in the context of national initiatives for environmental conservation and emission reduction. Nonetheless, due to limitations in capability and time, the study inevitably has shortcomings, with several areas requiring further research and refinement. The future research will seek better methodologies to enhance the scientific rigor and validity of the analysis, fostering a more objective and comprehensive understanding of the environmental impacts of power generation in Ningxia.
5 Conclusion
In response to China’s imperative shift from fossil fuels to cleaner energy solutions, this investigation provides an exhaustive evaluation of the environmental impacts associated with the SPPG system relative to traditional coal power generation, with a particular focus on LCA and ecological footprint metrics in the Ningxia region. The study delineates that, throughout its life cycle, the SPPG system is responsible for substantially lower GHG emissions, amounting to 1,601.18 kg CO2-eq per 1 kWp installation, which equates to 1.35 kg of CO2 per kilowatt-hour of electricity generated—considerably less than the 4.81 kg/kW·h attributed to coal-powered systems. This disparity highlights the reduced environmental impact of solar power. Further analysis of the ecological footprint demonstrates that solar power generation in Ningxia maintains an ecological surplus, signifying its operation within the ecological carrying capacity of the region. This is in stark contrast to the ecological deficit perpetuated by coal power, which has been on an upward trajectory. Such a contrast accentuates the unsustainability of coal power and the environmental efficacy of the SPPG system. While the SPPG system emerges as the environmentally superior option, the study reveals potential areas for enhancement, particularly where coal power unexpectedly outperforms in categories such as POCP. These findings signal the critical need for ongoing technological refinement and innovation in SPPG to harness its full environmental potential. The insights garnered from this research are instrumental for energy sector decision-makers, advocating for a realignment of the industrial infrastructure towards sustainable and renewable energy sources to support China’s overarching objectives of carbon neutrality. The conclusion drawn from this analysis stresses the vital integration of renewable energy adoption with socio-economic development and ecological conservation. Future strategies must underscore the necessity for cutting-edge technology, supportive policy frameworks, and comprehensive assessment mechanisms to foster and facilitate China’s sustainable energy transition.
In this study, we utilized Life Cycle Assessment (LCA) and Ecological Footprint accounting methods to assess the environmental impacts of solar photovoltaic (PV) power generation. However, both methods come with inherent limitations. The LCA approach faces challenges in terms of data quality and availability, the diversity of technologies, regional differences, long-term temporal scales, and issues regarding recycling and disposal. These factors may affect the accuracy and reliability of our assessments. Conversely, Ecological Footprint accounting is limited in its methodological consistency, the comprehensiveness of environmental impacts, the scale of analysis, and the incorporation of socio-economic factors. This could lead to limitations in accurately reflecting the full environmental impacts of solar PV systems. Therefore, while these methods offer valuable insights into the environmental aspects of solar PV, these limitations must be considered when interpreting the results. Future research should aim to address these limitations to more accurately evaluate and understand the environmental benefits of solar PV technology.
Data availability statement
The original contributions presented in the study are included in the article/Supplementary Material, further inquiries can be directed to the corresponding author.
Author contributions
JL: Conceptualization, Data curation, Formal Analysis, Methodology, Writing–original draft, Writing–review and editing. HY: Conceptualization, Investigation, Resources, Supervision, Visualization, Writing–review and editing. LZ: Investigation, Project administration, Supervision, Writing–review and editing. HL: Investigation, Methodology, Writing–review and editing. YW: Data curation, Formal Analysis, Investigation, Writing–review and editing. CH: Data curation, Formal Analysis, Investigation, Writing–review and editing.
Funding
The author(s) declare that no financial support was received for the research, authorship, and/or publication of this article.
Acknowledgments
We extend our heartfelt gratitude to the Ningxia research community for their invaluable data contributions and to our peers for their insightful feedback. Special thanks are also due to the funding agencies and institutional support that facilitated the research, demonstrating the collaborative spirit vital for advancements in sustainable energy studies.
Conflict of interest
Author HL was employed by Ningxia Belite Chemical Cyanamide Development Co. Ltd.
The remaining authors declare that the research was conducted in the absence of any commercial or financial relationships that could be construed as a potential conflict of interest.
Publisher’s note
All claims expressed in this article are solely those of the authors and do not necessarily represent those of their affiliated organizations, or those of the publisher, the editors and the reviewers. Any product that may be evaluated in this article, or claim that may be made by its manufacturer, is not guaranteed or endorsed by the publisher.
Supplementary material
The Supplementary Material for this article can be found online at: https://www.frontiersin.org/articles/10.3389/fenrg.2024.1375820/full#supplementary-material
References
Ahmed, Z., Zafar, M. W., Ali, S., and Danish, S. (2020). Linking urbanization, human capital, and the ecological footprint in G7 countries: an empirical analysis. Sustain. Cities Soc. 55, 102064. doi:10.1016/j.scs.2020.102064
Alola, A. A., Bekun, F. V., and Sarkodie, S. A. (2019). Dynamic impact of trade policy, economic growth, fertility rate, renewable and non-renewable energy consumption on ecological footprint in Europe. Sci. Total Environ. 685, 702–709. doi:10.1016/j.scitotenv.2019.05.139
Author Anonymous (2014). Comparative study on life cycle assessment of photovoltaic power generation and coal-fired power generation (in Chinese). Environ. Sci. Manag. 39 (10), 86–90.
Author Anonymous (2017). Research on carbon emission of photovoltaic power generation based on life cycle evaluation (in Chinese). Nanjing University of Aeronautics and Astronautics.
Author Anonymous (2019). Comparative study of clean coal-fired power generation and photovoltaic power generation under the perspective of energy input return and economic value (in Chinese). Beijing: China University of Petroleum.
China Energy Statistical Yearbook (2021). E. sector. Available at: https://www.zgtjnj.org/navibooklist-n3022013309-1.html.
Gao, C., Zhu, S., Na, H., and You, H. (2021). Comprehensive comparison of multiple renewable power generation methods: a combination analysis of life cycle assessment and ecological footprint. Renew. Sustain. Energy Rev. 147, 111255. doi:10.1016/j.rser.2021.111255
Guinee, J. B., Huppes, G., Zamagni, A., Masoni, P., Buonamici, R., et al. (2011). Life cycle assessment: past, present, and future. Environ. Sci. Technol. 45 (90-6), 90–96. doi:10.1021/es101316v
Hong, J., Chen, W., Qi, C., Ye, L., and Xu, C. (2016). Life cycle assessment of multicrystalline silicon photovoltaic cell production in China. Sol. Energy 133, 283–293. doi:10.1016/j.solener.2016.04.013
Hossain, M. U., and Poon, C. S. (2018). Comparative LCA of wood waste management strategies generated from building construction activities. J. Clean. Prod. 177, 387–397. doi:10.1016/j.jclepro.2017.12.233
Huang, B., Zhao, J., Chai, J., Xue, B., Zhao, F., and Wang, X. (2017). Environmental influence assessment of China’s multi-crystalline silicon (multi-Si) photovoltaic modules considering recycling process. Sol. Energy 143, 132–141. doi:10.1016/j.solener.2016.12.038
Ladenburg, J., et al. (2024). Taking the carbon capture and storage, wind power, PV or other renewable technology path to fight climate change? Exploring the acceptance of climate change mitigation technologies – a Danish national representative study. Renew. Energy, 220.
Liu, W., Zhu, Q., Zhou, X., and Peng, C. (2019). Comparative analyses of different biogenic CO(2) emission accounting systems in life cycle assessment. Sci. Total Environ. 652, 1456–1462. doi:10.1016/j.scitotenv.2018.11.039
Liu, Z., Guo, Z., Song, C., Du, Y., Chen, Q., Chen, Y., et al. (2023). Business model comparison of slum-based PV to realize low-cost and flexible power generation in city-level. Appl. Energy 344, 121220. doi:10.1016/j.apenergy.2023.121220
Magelli, F., Boucher, K., Bi, H. T., Melin, S., and Bonoli, A. (2009). An environmental impact assessment of exported wood pellets from Canada to Europe. Biomass Bioenergy 33 (3), 434–441. doi:10.1016/j.biombioe.2008.08.016
Ningxia Statistical Yearbook (2022). Ningxia. Available at: https://nxdata.com.cn/files_nx_pub/html/tjnj/2022/indexfiles/indexch.htm?1=1.
Song, S., Liu, P., Xu, J., Chong, C., Huang, X., Ma, L., et al. (2017). Life cycle assessment and economic evaluation of pellet fuel from corn straw in China: a case study in Jilin Province. Energy 130, 373–381. doi:10.1016/j.energy.2017.04.068
Udomsirichakorn, J., and Salam, P. A. (2014). Review of hydrogen-enriched gas production from steam gasification of biomass: the prospect of CaO-based chemical looping gasification. Renew. Sustain. Energy Rev. 30, 565–579. doi:10.1016/j.rser.2013.10.013
Wackernagel, M. O. L., Bello, P., Linares, A. C., Falf´ an, I. S. L., García, J. M., Méndez Garcia, J., et al. (1999). National natural capital accounting with the ecological footprint concept. Ecol. Econ. 29 (375-90), 375–390. doi:10.1016/s0921-8009(98)90063-5
Wackernagel, M. R. W. (1996). Our ecological footprint:reducing human impact on the earth. Gabriela Island: New Sociely Publishers.
Wang, C., Zhang, L., Zhou, P., Chang, Y., Zhou, D., Pang, M., et al. (2019). Assessing the environmental externalities for biomass- and coal-fired electricity generation in China: a supply chain perspective. J. Environ. Manage 246, 758–767. doi:10.1016/j.jenvman.2019.06.047
Xu, L., Zhang, S., Yang, M., Li, W., and Xu, J. (2018). Environmental effects of China's solar photovoltaic industry during 2011–2016: a life cycle assessment approach. J. Clean. Prod. 170, 310–329. doi:10.1016/j.jclepro.2017.09.129
Yousri, D., Mirjalili, S., Machado, J. T., Thanikanti, S. B., elbaksawi, O., and Fathy, A. (2021). Efficient fractional-order modified Harris hawks optimizer for proton exchange membrane fuel cell modeling. Eng. Appl. Artif. Intell. 100, 104193. doi:10.1016/j.engappai.2021.104193
Yu, Z., Ma, W., Xie, K., Lv, G., Chen, Z., Wu, J., et al. (2017). Life cycle assessment of grid-connected power generation from metallurgical route multi-crystalline silicon photovoltaic system in China. Appl. Energy 185, 68–81. doi:10.1016/j.apenergy.2016.10.051
Zhang, B., and Gao, Y. (2023). The optimal capacity ratio and power limit setting method of the PV generation system based on the IGBT reliability and PV economy. Microelectron. Reliab. 148, 115145. doi:10.1016/j.microrel.2023.115145
Keywords: solar photovoltaic power generation, greenhouse gas emissions, ecological footprint, life cycle assessment, carbon mitigation
Citation: Luo J, Yang H, Zhang L, Liu H, Wang Y and Hao C (2024) A comparative study on the combination of life cycle assessment and ecological footprints: solar photovoltaic power generation vs. coal power generation in Ningxia. Front. Energy Res. 12:1375820. doi: 10.3389/fenrg.2024.1375820
Received: 24 January 2024; Accepted: 20 March 2024;
Published: 10 April 2024.
Edited by:
Sudhakar Babu Thanikanti, Chaitanya Bharathi Institute of Technology, IndiaReviewed by:
Sisir Kumar Yadav, Birla Institute of Technology and Science, IndiaMurali Krishna Tangirala, Chaitanya Bharathi Institute of Technology, India
Copyright © 2024 Luo, Yang, Zhang, Liu, Wang and Hao. This is an open-access article distributed under the terms of the Creative Commons Attribution License (CC BY). The use, distribution or reproduction in other forums is permitted, provided the original author(s) and the copyright owner(s) are credited and that the original publication in this journal is cited, in accordance with accepted academic practice. No use, distribution or reproduction is permitted which does not comply with these terms.
*Correspondence: Hexu Yang, eWFuZ2hleHUwNjA4QDEyNi5jb20=