 Ning Sun1
 Guangzeng You
95% of researchers rate our articles as excellent or good
Learn more about the work of our research integrity team to safeguard the quality of each article we publish.
Find out more
ORIGINAL RESEARCH article
Front. Energy Res. , 14 June 2024
Sec. Sustainable Energy Systems
Volume 12 - 2024 | https://doi.org/10.3389/fenrg.2024.1375210
This article is part of the Research Topic Low-Carbon Oriented Improvement Strategy for Flexibility and Resiliency of Multi-Energy Systems View all 24 articles
The optimization dispatching problem of the regional distribution network (DN) interconnection with the microgrid (MG) is studied in this paper. By installing flexible interconnection devices based on the soft open point (SOP) at the boundaries of DNs, the flexible interconnection can be achieved between distribution networks, and the distribution zoning model is established. A multiobjective DN–MG system optimization dispatching model for multi-area DNs considering distributed resources is established based on the distribution zoning model. By introducing intermediate coupling variables, the optimization dispatching problem of the DN–MG system is decomposed into MG sub-area optimization problems and DN sub-area optimization problems. On the basis of the above, a method based on the alternating direction method of multipliers (ADMM) is proposed to solve the optimization dispatching model. Finally, simulation verification shows that by application of the proposed method, the economic efficiency of the DN–MG system is improved effectively.
With the development of power systems, cooperation between different distribution networks (DNs) will be applied to achieve complementary power support between DNs. The power supply reliability will be improved, and it will promote local consumption of distributed power sources (Tabandeh A, 2022; Li T, 2023a; Xu J, 2024). The collaboration between microgrids (MGs) and DNs can not only alleviate the operational pressure of DNs but also reduce the operating costs of MGs (Li Z, 2023b; Chen X, 2023). In this background, realizing reasonable control of power generation and flexible interconnection devices within a flexible interconnected AC/DC distribution system between different regions is an urgent problem that needs to be solved in the economic operation of DN–MG. Domestic and foreign experts and scholars have also conducted relevant research on such optimization problems.
However, currently, soft open points (SOPs) are mostly applied for flexible connection of distributed generation (DG), flexible loads, energy storage (ES), electric vehicles (EVs), and other equipment (Aithal A, 2018; Yao C, 2018; Zhang J, 2021). In order to enhance network performance and flexibility, the rapid development of flexible interconnection technology based on SOPs realized flexible interconnection between feeders. Ebrahimi H (2024a) proposed that SOPs can be installed in the end feeders of the distribution network to improve network performance. Harmonic distortion, voltage imbalance, and active power loss can be minimized through active and reactive power control and selective harmonic current injection. The optimal active and reactive power control of the location and hourly control of SOPs in a distribution network can achieve minimum harmonic distortion and voltage unbalance. The regional interconnection between DNs has not been realized. In order to improve the flexibility of the power grid, Ehsanbakhsh M (2023) used SOPs to change the topology structure of the distribution network to improve the flexibility of the distribution network. The penetration capability range of renewable energy sources (RESs) is defined as an indicator for evaluating the flexibility of active distribution networks (ADNs). The optimal site and size of SOPs, the final network topology, and the penetration capability range of the RES are determined by solving a multiobjective robust optimization model and adopting flexibility improvement methods. Kamel T (2022) proposed a strategy to interconnect the railway electrification system with the local DN through SOPs, which achieved energy transmission at different power levels between the two systems. The flexibility and reliability of the two systems were improved. However, the direction of energy flow was not changed. Saboori H (2023) proposed a segmentation model based on SOPs to improve the resilience of DNs. This method effectively solved the internal topology reconstruction problem of DNs. However, the issue of improving resilience through collaboration between DNs has been ignored.
In order to address the negative impact of renewable energy on the power system, flexible operation of DN was realized to control the active power, reactive compensation, and voltage regulation by the application of SOPs (Rezaeian-Marjani S, 2022). However, the local consumption level of DG will be limited. The distribution network can flexibly exchange power through multi-terminal intelligent soft switches, provide local reactive power, and alleviate voltage exceeding limits. By the application of SOPs, the distribution network has gradually evolved into a highly controllable flexible interconnection architecture (Li P, 2022).
The DN can flexibly exchange power through multiple SOPs and provide local reactive power. The distribution network gradually evolved into a highly controllable flexible interconnection architecture through the connection of multiple SOPs. In order to alleviate the fluctuation of feeder power flow and load imbalance in DNs, an SOP was applied to provide accurate control of active and reactive power to realize flexible connection of feeders (Ji H, 2017). In order to determine the installation location of an SOP, a classic scenario was constructed based on Wasserstein distance metric to optimize the configuration method for SOPs (Wang C, 2016). However, this configuration method is only applicable to the optimized configuration of SOPs within a single DN.
At the same time, the uncertainty of renewable energy output and the uncertainty of multi-load demand significantly will increase the complexity of regional energy system optimization scheduling (Ma X, 2023). Ma X (2023) proposed a rolling mechanism based on the flexible loads to reduce the impact of DG on the power system. In addition, a two-stage multiobjective framework is proposed to manage the energy of MG (Karimi H, 2023). However, this article only studied from the perspective of MG and did not consider the operational status of the distribution network. (Li Z (2023c) proposed a multi-time-scale coordinated control strategy where EVs were modeled as the flexible loads to participate in multi-region dispatching tasks in the DN in the day-ahead stage. In the real-time stage, the charging load was defined as a controllable load to compensate for power errors caused by DG. Han C (2023) proposed a new SOP management strategy based on the model predictive control (MPC) framework. The proposed method corresponds to the factory modeling of voltage and network losses as a linear time-varying system, which provides better performance than traditional MPC methods in reducing network losses and improving voltage distribution based on the data clustering technology; Ebrahimi H (2024b) proposed a method to handle uncertain factors. By optimizing the installation position of SOPs, the expected values of active power loss and voltage deviation were reduced.
In the above research, the application of SOPs and the optimization dispatching problem of multiple time scales were studied, but the collaboration between DNs and MGs was not considered. In response to the current research shortcomings, the main contributions of this article are as follows:
(1) A regional optimization model is constructed based on the zoning of the distribution system. The interconnection between DNs is realized through SOPs. Based on the TOU, the power flow between DNs can be coordinated by the application of SOPs. Under the background of ensuring the safe and stable operation of a DN, collaborative support between DNs is realized. In addition, the operating cost of the DN is reduced.
(2) An optimized dispatching model for the DN–MG collaboration is proposed. While the MG ensures its own economic operation, the MG responds to TOU and the operating status of the DN. The flexible load within the microgrid can be adjusted according to TOU. By reducing the operating cost of MG through flexible load shifting, the purchase of electricity during various periods of MG is adjusted. Thereby, the operational pressure during peak load periods of the DN is alleviated.
(3) A multi-time-scale optimization method based on the alternating direction method of multipliers (ADMM) is proposed. On the basis of adopting multi-time-scale rolling optimization, the optimization problem is decomposed into several sub-problems. These sub-problems are solved by the ADMM. The simulation results show that the strategy proposed in this paper can effectively reduce the operating costs of the DN and MG.
The active distribution network (ADN) structure with the MG is shown in Figure 1. In addition to fixed topology parameters, the DN also includes local loads and DG. The distribution network is connected to the microgrid through a point of common coupling (PCC). The MG directly combines the DG with local user loads in a certain area. The DG will prioritize supplying power to the local load within the MG. When the DG in the MG is excessive or insufficient, the MG will interact with the DN for power. The MG can include diesel generators (DEG), photovoltaics (PV), wind power generation (WG), energy storage (ES), and local load. In addition, the local load can be flexibly adjusted to participate in demand response.
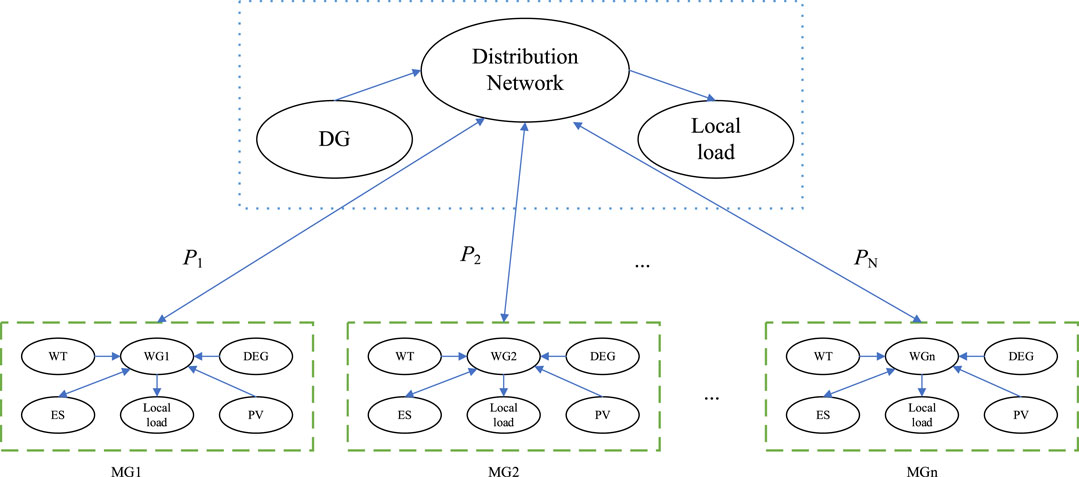
Figure 1. Distribution network structure with microgrids.
At the same time, DNs are interconnected through SOPs. Power interaction between the DNs is realized by controlling the flexible interconnection devices. The interconnection architecture of the distribution network is shown in Figure 2. DNs can be divided into several sub-DNs. Flexible interconnection between sub-DNs can be achieved through SOPs.
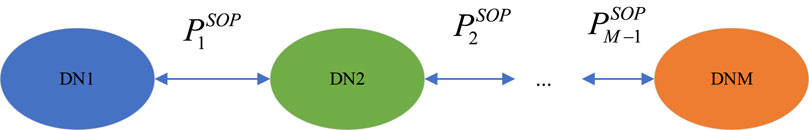
Figure 2. Interconnection architecture of the distribution network.
In this paper, the DistFlow model is applied to constrain the power flow of the DN:
Here,
At the same time, the DEG needs to meet the constraints of power upper and lower limits and the constraints of ramp rate:
Here,
The MG can include DEG, PV, WG, ES, and local electricity loads. Among them, the local electricity load can be adjusted flexibly, which can be powered by time-series translation. Therefore, the operational constraints of the MG are as follows:
where
Here,
The constraints of DEG in MGs are similar to those of DNs and will not be elaborated here.
Here,
The DNs are flexibly interconnected through SOPs with DC charging devices. The upper control center can achieve power flow direction control through voltage source converters (VSCs) on both sides of the SOP. In order to realize the regional division, the DC charging device and DN are the same optimized area. In addition, information exchange is carried out point-to-point with the adjacent DN side. The decoupled interaction power relationship is as follows:
where
At the same time, the upper limit constraint of interaction power is as follows:
where
The MG and DN are connected through a PCC. They are coupled and interconnected. In order to achieve partition calculation, the DN area in the coupling area between the DN and MG is defined as region H, and the MG area is defined as region L. The PCC will be decoupled into two independent regions. The relationship between the variables decoupled from two independent regions is as follows:
Here,
Based on the regional optimization model, the optimal dispatching model is established to realize economic optimization, and a rolling optimization dispatching model with multiple time scales is established.
The multi-time-scale dispatching architecture is shown in Figure 3. Due to fluctuations of the PV and WG, rolling optimization dispatching can effectively ensure the accuracy of optimization dispatching. The participating optimization period includes the current period and all the remaining unfinished periods to ensure that the optimization results of the current period are optimal.
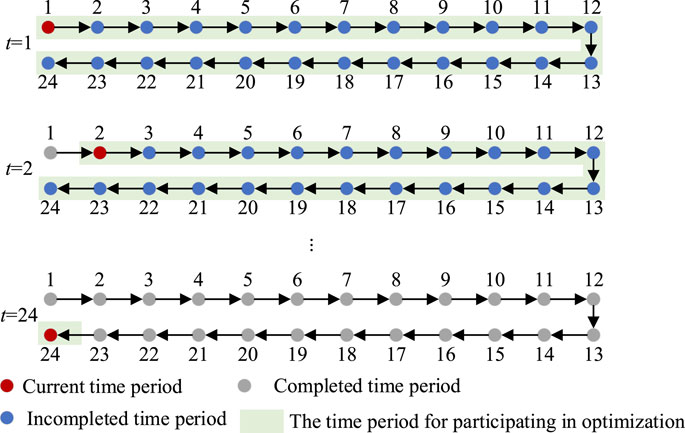
Figure 3. Multi-time-scale dispatching architecture.
It can be seen from Figure 3 that the dispatching strategy is divided into the completed time period and the period for participating in optimization. The completed time period is time-varying. The period for participating in optimization is also time-varying. The sum of the two time periods is fixed. The size of the completed time period increases sequentially from 1 to 24. The size of the period for participating in optimization decreases sequentially from 1 to 24. Therefore, the dispatching strategy has 24 calculation time scales.
The optimization dispatching models for each region are as follows:
where
The objective of the DNi regional economic optimization model is to optimize the economic efficiency of DNi and its regional boundaries, including the output cost of DEGs, the PCC at the partition boundary, and the interaction cost at the SOP.
where
The optimization objective of the regional economic optimization model for the MG is to minimize the operating costs of microgrids, including the output cost of the DEGs, the charging and discharging cost of the ES, and the interaction cost at the PCC of the partition boundary.
where
The economic optimization model of the DC charging device at the SOP is as follows:
where
The ADMM is an iterative algorithm used to solve convex optimization problems. This algorithm is suitable for large-scale data and distributed computing environments. The ADMM algorithm has the following advantages:
(1) ADMM can decompose large optimization problems into multiple smaller sub-problems to make the problem easier to solve.
(2) This algorithm is suitable for distributed computing environments. In addition, it allows multiple computing nodes to participate in the problem-solving process to improve the computational efficiency.
(3) ADMM usually has good convergence performance and can find near-optimal solutions within a finite number of iterations.
(4) During the iteration process, each sub-problem can independently perform sparse reconstruction and noise reduction operations to achieve high reconstruction accuracy.
Based on the optimization architecture and model mentioned above, an optimization dispatching method based on the ADMM is proposed. An augmented Lagrangian function is constructed, and the sub-problems are divided according to the framework structure of the optimization model.
where
Sub-problem 1 can be decomposed into two local sub-problems; namely, the optimization of DNi and DNi+1. The decision variables within the DN can be optimized by solving local sub-problems using the ADMM. The SOP serves as the boundary between two DN areas, and its injection power is optimized as an interaction variable during the calculation process.
For DNi
For DNi+1:
Here,
The original residual error, dual residual error, and iterative update mechanism for sub-problem 1 are as follows:
Here,
Here,
The selection of the penalty coefficient will affect the convergence speed of the algorithm. By balancing the original residual error and the dual residual error, the penalty coefficient can be adaptively adjusted according to the residual error, which can accelerate the convergence speed of the algorithm.
The decision variables are divided into two parts: 1) the interaction variables within the flexible interconnection devices of the DN; 2) the interaction variables between the PCC coupling part of the DN and MG. The optimization process is shown in Figure 4.
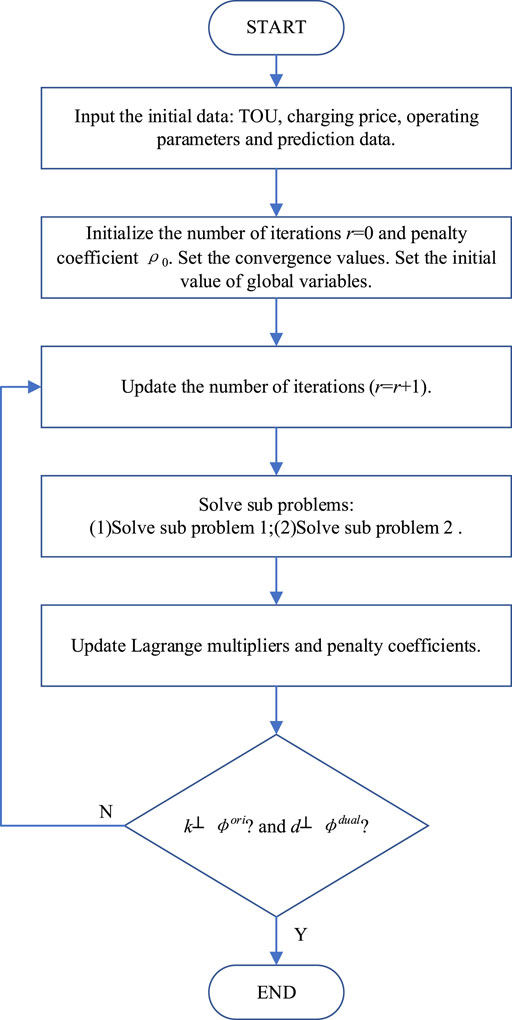
Figure 4. Topology structure.
The detailed optimization process is as follows:
Step 1: input the initial data. Input the TOU for regional purchase and sale, DC charging price for EVs, user flexible load, operating parameters of the DN and MG, and rolling prediction data for the PV and WG.
Step 2: initialize the number of iterations
Step 3: update the number of iterations (
Step 4: solving sub-problems.
(1) Solve sub-problem 1. At the flexible interconnection device SOP, the interaction data received by DNi from DNi+1 are
(2) Solve sub-problem 2. The interaction variables between the microgrid area and the connected distribution network are obtained through the PCC (
Step 5: Update Lagrange multipliers and penalty coefficients.
Step 6: Residual update and iteration termination determination. When
In order to verify the effectiveness of the optimization strategy, this paper selected two IEEE 33 node systems and two MGs as a study case. The topology structure is shown in Figure 5, and the load data of the DN are shown in Figure 6.
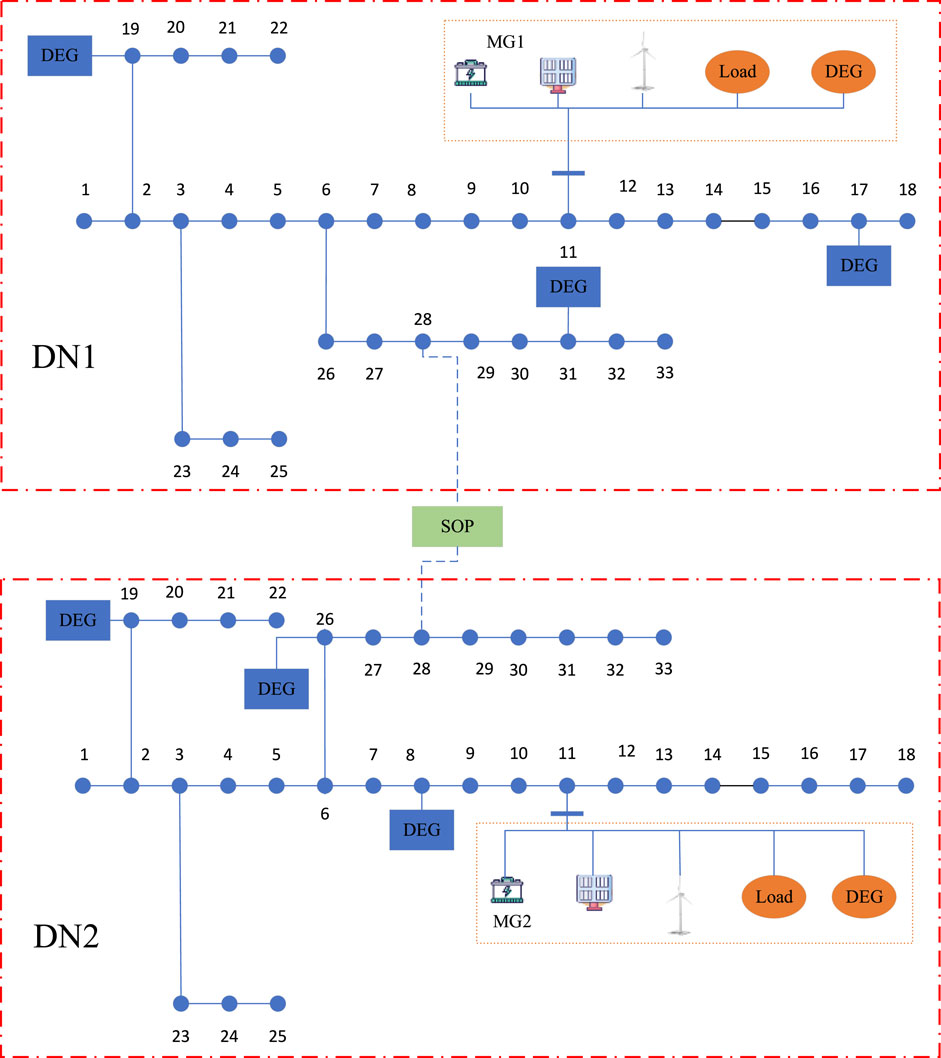
Figure 5. Topology structure.
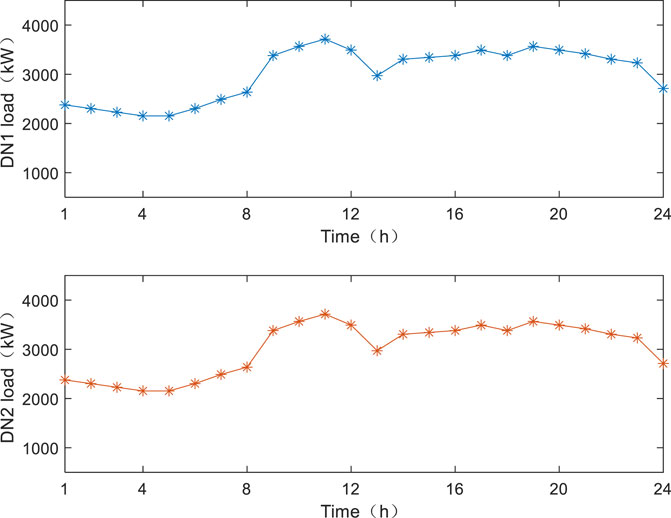
Figure 6. Load data of the distribution network.
In this paper, a multiple time-scale rolling optimization strategy is proposed to achieve a full-day optimization calculation. TOU is applied for purchasing and selling electricity between the regions, and the charging price for EVs is set based on TOU. The TOU is shown in Figure 7, and the charging price is shown in Figure 8.
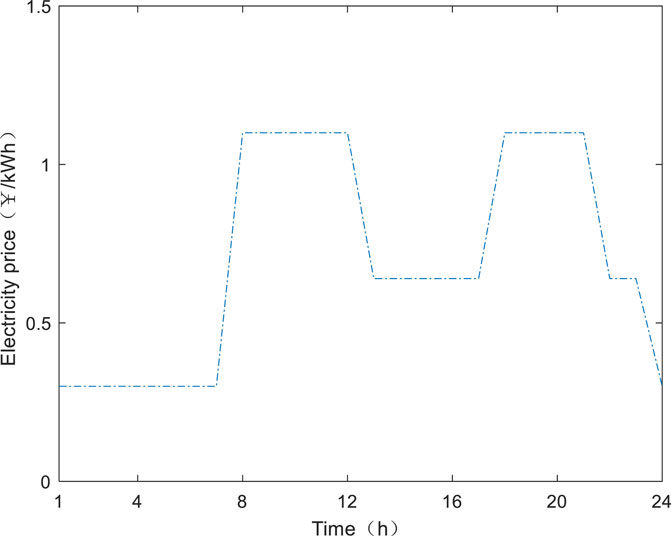
Figure 7. TOU of the distribution network.
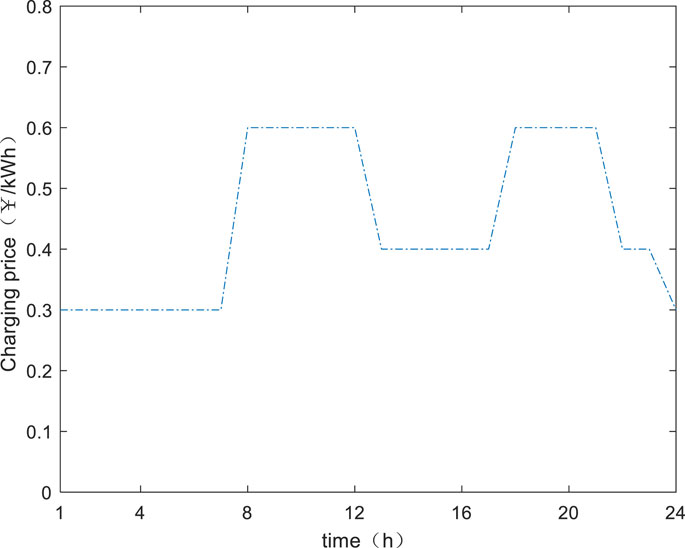
Figure 8. Charging price.
The PV output is shown in Figure 9.
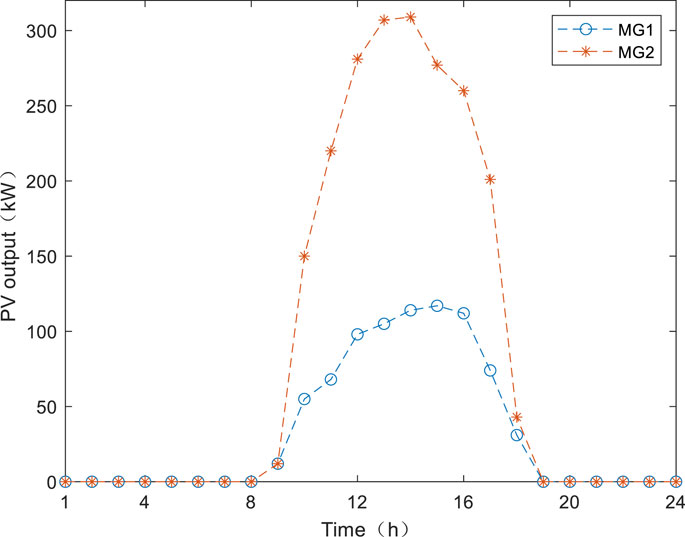
Figure 9. PV output of MGs.
The WG output is shown in Figure 10.
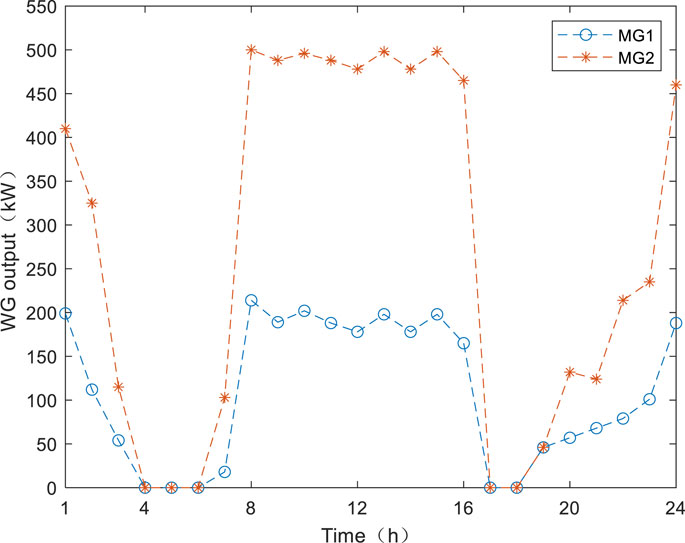
Figure 10. WG output of MGs.
The MG load curve is shown in Figure 11, and the adjustable range of the flexible load is shown in Figure 12 and Figure 13. The WG parameters and ES parameters are shown in Table 1, Table 2, Table 3, Table 4.
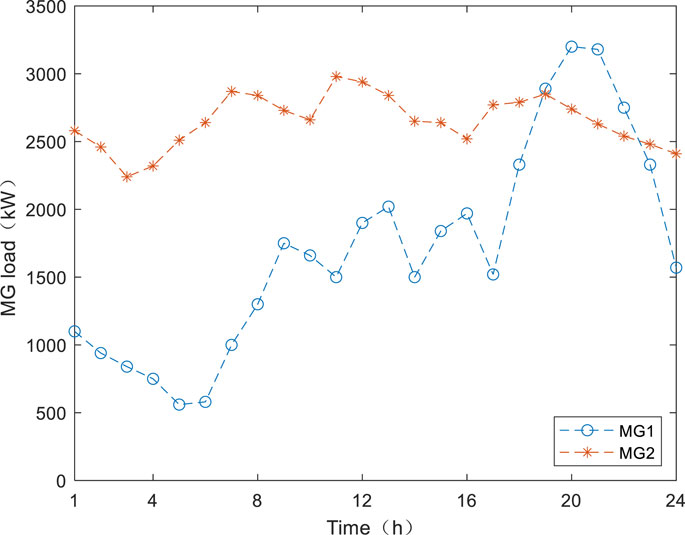
Figure 11. MG load curve.
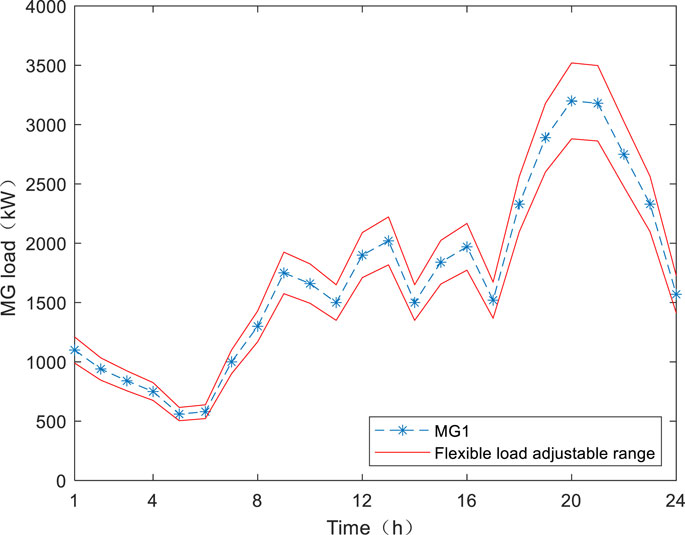
Figure 12. MG1 flexible load adjustable range.
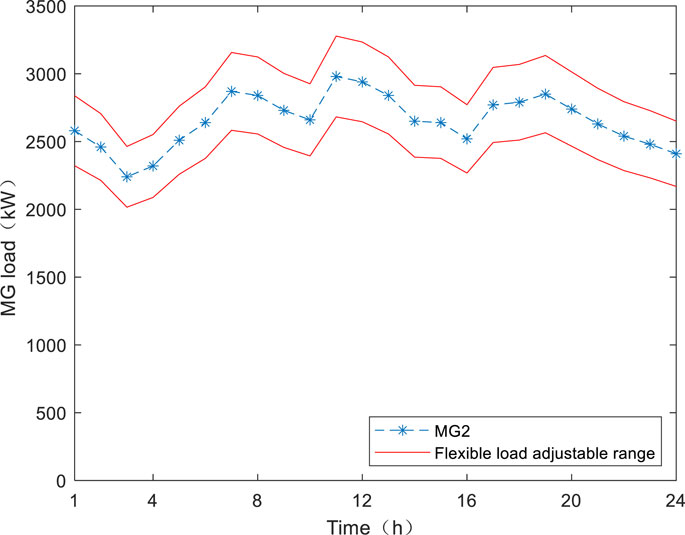
Figure 13. MG2 flexible load adjustable range.
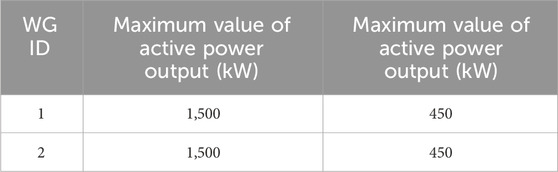
Table 1. WG parameters for MG1.
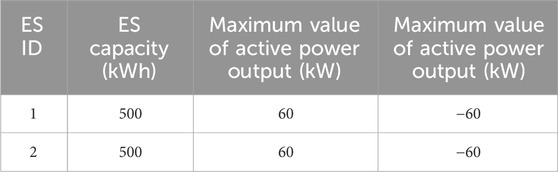
Table 2. ES parameters for MG1.
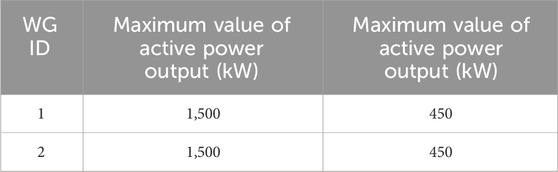
Table 3. WG parameters for MG2.

Table 4. ES parameters for MG2.
The comparison of the scenario settings is shown in Table 5. For scenario 1, SOP and flexible load are available. For scenario 2, SOP is available, but flexible load is not available. For scenario 3, flexible load is available, but SOP is not available. For scenario 4, flexible load and SOP are not available. The SOP parameters are shown in Table 6.

Table 5. Scenario setting.

Table 6. SOP parameters.
The operating costs for DN1 and DN2 for different scenarios are shown in Figure14 and Figure 15. For DN1, when the SOP is coordinated with flexible loads, the operating cost of DN1 is the lowest. Compared with scenario 2, the operating cost of DN1 has significantly decreased. Compared with scenario 3, due to the lack of an SOP interconnection between DN1 and DN2, there is no power interaction. These two DNs will operate independently of each other and lack collaborative assistance, which, to some extent, increases the operating cost of the DN. Comparison of scenario 2 with scenario 4 shows that due to the lack of an SOP interconnection between DN1 and DN2, the two networks are unable to interact with each other based on their operating status. The operating cost of DN1 is increased. On comparing scenario 3 with scenario 4, when the internal load of the MG can be flexibly controlled, the load can be adjusted based on TOU, and the operating cost of the DN is reduced.
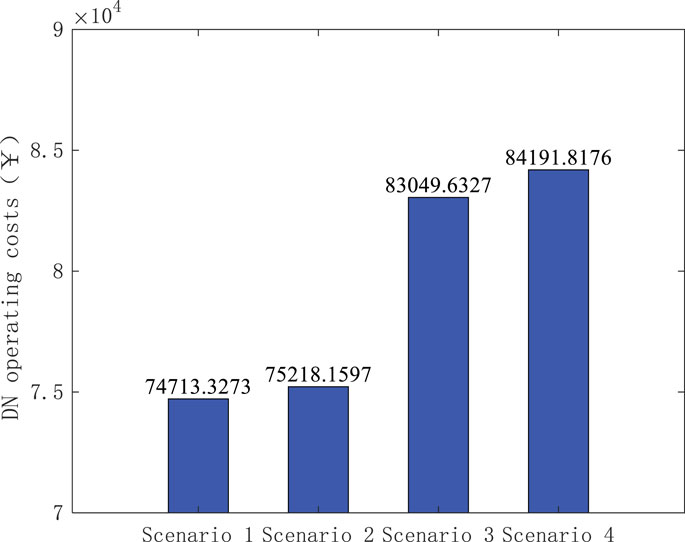
Figure 14. DN 1 operating cost.
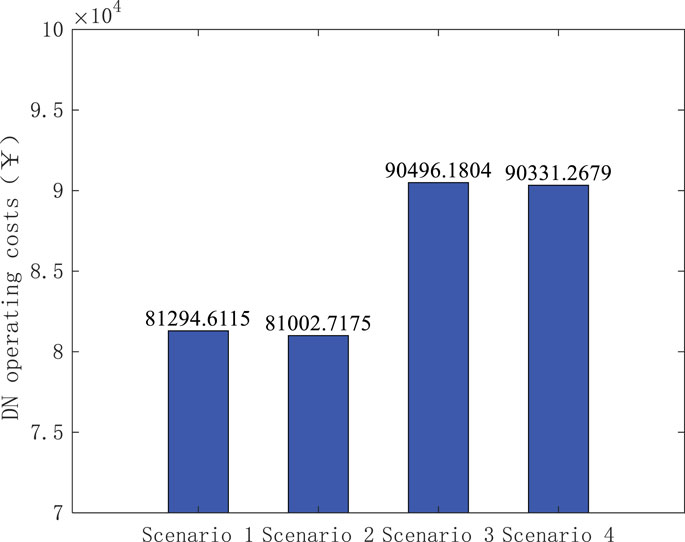
Figure 15. DN 2 operating cost.
The operating cost of DN2 in scenario 1 is ¥291.894 yuan higher than that of DN2 in scenario 2. The operating cost of DN2 has increased, but the operating cost of DN1 has decreased by ¥504.8324. The overall operating cost of the DN has reduced.
The comparison of the operating costs between MG1 and MG2 is shown in Figure 16 and Figure 17, respectively. According to Figure 16, it can be seen that the overall load of MG2 is greater than the overall load of MG1. Therefore, the operating costs of MG2 are higher than those of MG1. In scenario 2, due to the non-flexible regulation of load, the MG will purchase electricity from the DN according to the original plan during the peak load period of the DN. When the amount of load access is adjusted flexibly, MGs can adjust the time shift access of the load to reduce the operating costs and meet the demand for load access. In scenario 4, due to the lack of power interaction with the upper level DNs, MGs will increase the output power of the DEG to meet the load demand of the microgrid. When scenario 3 is adopted, the MG load can achieve time-shift access to reduce the purchase of electricity from the DN during weak DN periods and the peak time of TOU. At the same time, the power generation of DEGs is adjusted to optimize the operating costs of the MG.

Figure 16. MG 1 operating cost.
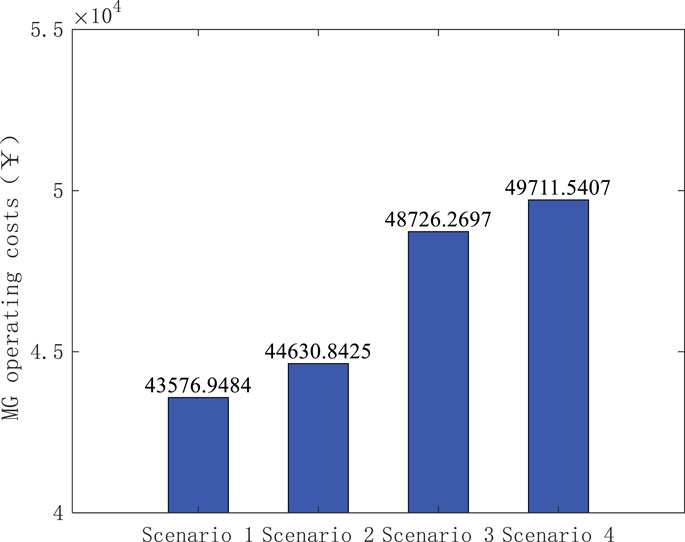
Figure 17. MG 2 operating cost.
The flexible load regulation curves of MG1 and MG2 are shown in Figure 18 and Figure 19, respectively. MG1 increases load during low load periods and reduces the load during peak load periods. The load fluctuations have been suppressed. The operational pressure during peak load periods has been alleviated. MG2 has a larger load access volume than that of MG1. That will be more evident in flexible load regulation. MG2 will increase load access volume during periods of low electricity prices in the DN, and MG2 will reduce load access volume during periods of high electricity prices to meet the demand for flexible loads.

Figure 18. MG load for scenario 1
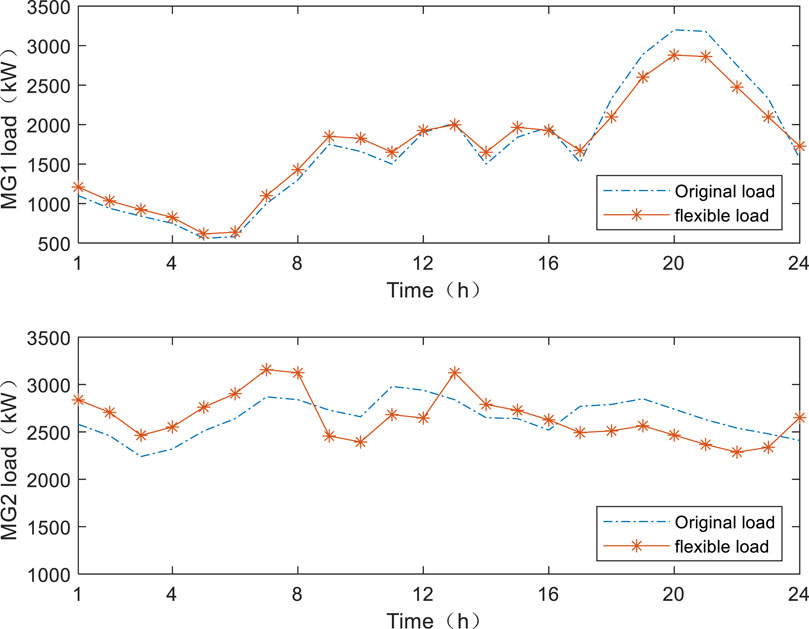
Figure 19. MG load for scenario 3
In this paper, the optimization dispatching problem of DN interconnection and DN–MG systems is studied. The flexible interconnection between DNs is realized by the application of the SOP, and the optimization dispatching of the DN–MG system is realized based on flexible loads. An optimization solution method based on the ADMM is proposed, which reduces the overall operating costs of DNs and MGs, and the operational efficiency of the DN–MG system is improved.
The original contributions presented in the study are included in the article/Supplementary Material; further inquiries can be directed to the corresponding author.
NS: conceptualization, resources, software, and writing–original draft. GY: conceptualization, methodology, project administration, writing–original draft, and writing–review and editing. XZ: funding acquisition, writing–original draft, and writing–review and editing. YL: writing–original draft and writing–review and editing. JW: writing–original draft and writing–review and editing. HZ: writing–original draft and writing–review and editing.
The author(s) declare that no financial support was received for the research, authorship, and/or publication of this article.
Authors NS, XZ, YL, JW, and HZ were employed by Chuxiong Power Supply Bureau of Yunnan Power Grid Co.
Author GY was employed by the Planning and Construction Research Center of Yunnan Power Grid Corporation, Kunming.
All claims expressed in this article are solely those of the authors and do not necessarily represent those of their affiliated organizations, or those of the publisher, the editors, and the reviewers. Any product that may be evaluated in this article, or claim that may be made by its manufacturer, is not guaranteed or endorsed by the publisher.
Aithal, A., Li, G., Wu, J., and Yu, J. (2018). Performance of an electrical distribution network with Soft Open Point during a grid side AC fault. Appl. Energy 227, 262–272. doi:10.1016/j.apenergy.2017.08.152
Chen, X., Zhai, J., Jiang, Y., Ni, C., Wang, S., and Nimmegeers, P. (2023). Decentralized coordination between active distribution network and multi-microgrids through a fast decentralized adjustable robust operation framework. Sustain. Energy, Grids Netw. 34, 101068. doi:10.1016/j.segan.2023.101068
Ebrahimi, H., Galvani, S., Talavat, V., and Farhadi-Kangarlu, M. (2024a). Optimal parameters setting for soft open point to improve power quality indices in unbalanced distribution systems considering loads and renewable energy sources uncertainty. Electr. Power Syst. Res. 229, 110155. doi:10.1016/j.epsr.2024.110155
Ebrahimi, H., Galvani, S., Talavat, V., and Farhadi-Kangarlu, M. (2024b). A conditional value at risk based stochastic allocation of SOP in distribution networks. Electr. Power Syst. Res. 228, 110111. doi:10.1016/j.epsr.2023.110111
Ehsanbakhsh, M., and Sepasian, M. S. (2023). Bi-objective robust planning model for optimal allocation of soft open points in active distribution network: a flexibility improvement approach. Electr. Power Syst. Res. 224, 109780. doi:10.1016/j.epsr.2023.109780
Han, C., Cho, S., Song, S. G., and Rao, R. R. (2023). Regression model-based adaptive receding horizon control of soft open points for loss minimization in distribution networks. Int. J. Electr. Power & Energy Syst. 151, 109130. doi:10.1016/j.ijepes.2023.109130
Ji, H., Wang, C., Li, P., Zhao, J., Song, G., Ding, F., et al. (2017). An enhanced SOCP-based method for feeder load balancing using the multi-terminal soft open point in active distribution networks. Appl. energy 208, 986–995. doi:10.1016/j.apenergy.2017.09.051
Kamel, T., Tian, Z., Zangiabadi, M., Wade, N., Pickert, V., and Tricoli, P. (2022). Smart soft open point to synergically improve the energy efficiencies of the interconnected electrical railways with the low voltage grids. Int. J. Electr. Power & Energy Syst. 142, 108288. doi:10.1016/j.ijepes.2022.108288
Karimi, H., Gharehpetian, G. B., Ahmadiahangar, R., and Rosin, A. (2023). Optimal energy management of grid-connected multi-microgrid systems considering demand-side flexibility: a two-stage multi-objective approach. Electr. Power Syst. Res. 214, 108902. doi:10.1016/j.epsr.2022.108902
Li, P., Wei, M., Ji, H., Xi, W., Yu, H., Wu, J., et al. (2022c). Deep reinforcement learning-based adaptive voltage control of active distribution networks with multi-terminal soft open point. Int. J. Electr. Power & Energy Syst. 141, 108138. doi:10.1016/j.ijepes.2022.108138
Li, T., Han, X., Wu, W., and Sun, H. (2023a). Robust expansion planning and hardening strategy of meshed multi-energy distribution networks for resilience enhancement. Appl. Energy 341, 121066. doi:10.1016/j.apenergy.2023.121066
Li, Z., Sun, Y., Yang, H., Wang, S., Shen, Y., Wang, X., et al. (2023c). A multi-time scale coordinated control and scheduling strategy of EVs considering guidance impacts in multi-areas with uncertain RESs. Int. J. Electr. Power & Energy Syst. 154, 109444. doi:10.1016/j.ijepes.2023.109444
Li, Z. L., Li, P., Xia, J., and Yuan, Z. P. (2023b). Cyber-physical-social system scheduling for multi-energy microgrids with distribution network coordination. Int. J. Electr. Power & Energy Syst. 149, 109054. doi:10.1016/j.ijepes.2023.109054
Ma, X., Peng, B., Ma, X., Tian, C., and Yan, Y. (2023). Multi-timescale optimization scheduling of regional integrated energy system based on source-load joint forecasting. Energy 283, 129186. doi:10.1016/j.energy.2023.129186
Rezaeian-Marjani, S., Talavat, V., and Galvani, S. (2022). Impact of soft open point (SOP) on distribution network predictability. Int. J. Electr. Power & Energy Syst. 136, 107676. doi:10.1016/j.ijepes.2021.107676
Saboori, H., and Heshmati, Y. (2023). Novel load partitioning and prioritization for distribution restoration with storage integrated-soft open point and energy-constrained resources. Electr. Power Syst. Res. 214, 108947. doi:10.1016/j.epsr.2022.108947
Tabandeh, A., Hossain, M. J., and Li, L. (2022). Integrated multi-stage and multi-zone distribution network expansion planning with renewable energy sources and hydrogen refuelling stations for fuel cell vehicles. Appl. Energy 319, 119242. doi:10.1016/j.apenergy.2022.119242
Wang, C., Song, G., Li, P., Ji, H., Zhao, J., and Wu, J. (2016). Optimal configuration of soft open point for active distribution network based on mixed-integer second-order cone programming. Energy Procedia 103, 70–75. doi:10.1016/j.egypro.2016.11.251
Xu, J., Liu, J., Wu, Z., Jiang, W., and Wu, Q. (2024). Multi-area state estimation for active distribution networks under multiple uncertainties: an affine approach. Int. J. Electr. Power & Energy Syst. 155, 109632. doi:10.1016/j.ijepes.2023.109632
Yao, C., Zhou, C., Yu, J., Xu, K., Li, P., and Song, G. (2018). A sequential optimization method for soft open point integrated with energy storage in active distribution networks. Energy Procedia 145, 528–533. doi:10.1016/j.egypro.2018.04.077
Keywords: distribution network, microgrid, soft open point, flexible load, alternating direction method of multipliers
Citation: Sun N, You G, Zhu X, Liu Y, Wu J and Zhu H (2024) A multi-time-scale optimization dispatching strategy for the regional DN–MG systems. Front. Energy Res. 12:1375210. doi: 10.3389/fenrg.2024.1375210
Received: 23 January 2024; Accepted: 22 May 2024;
Published: 14 June 2024.
Edited by:
Yumin Zhang, Shandong University of Science and Technology, ChinaReviewed by:
Haotian Ge, Hainan Normal University, ChinaCopyright © 2024 Sun, You, Zhu, Liu, Wu and Zhu. This is an open-access article distributed under the terms of the Creative Commons Attribution License (CC BY). The use, distribution or reproduction in other forums is permitted, provided the original author(s) and the copyright owner(s) are credited and that the original publication in this journal is cited, in accordance with accepted academic practice. No use, distribution or reproduction is permitted which does not comply with these terms.
*Correspondence: Guangzeng You, eXVubmFuZ3VpaHVhQDE2My5jb20=
Disclaimer: All claims expressed in this article are solely those of the authors and do not necessarily represent those of their affiliated organizations, or those of the publisher, the editors and the reviewers. Any product that may be evaluated in this article or claim that may be made by its manufacturer is not guaranteed or endorsed by the publisher.
Research integrity at Frontiers
Learn more about the work of our research integrity team to safeguard the quality of each article we publish.