 Shaopeng Fu1
 Lu Wang
94% of researchers rate our articles as excellent or good
Learn more about the work of our research integrity team to safeguard the quality of each article we publish.
Find out more
ORIGINAL RESEARCH article
Front. Energy Res., 11 April 2024
Sec. Sustainable Energy Systems
Volume 12 - 2024 | https://doi.org/10.3389/fenrg.2024.1374369
This article is part of the Research TopicAdvancing Urban Sustainability: Integrating Renewable Energy for Accelerated Zero-Carbon Community TransitionsView all 7 articles
For the residential building district heating (RBDH) system, choosing the appropriate combination of heat sources according to local conditions is the key to improving economic efficiency. In this study, three climatic regions in China were selected, namely, a hot summer and cold winter region, cold region, and severe cold region. Among them, Nanjing, Tianjin, and Shenyang were selected as typical representative cities in the hot summer and cold winter region, cold region, and severe cold region, respectively. Taking the levelized cost of heat (LCOH) as the economic evaluation index and considering the carbon emission cost of the system operation, the energy consumption and the CO2 emissions were analyzed. TRNSYS software was used to simulate and analyze the system performance. The multi-objective optimization based on a genetic algorithm was proposed to optimize system parameters. From an economic point of view, the SA system was suitable for the hot summer and cold winter region, the SAS system was suitable for the cold region, and the SE system was suitable for the severe cold region. The operation control strategy based on quality adjustment can reduce heating energy consumption and maintain indoor temperatures at approximately 20°C. The proportion of clean energy heating in the optimized heating system decreased after the multi-objective optimization strategy. However, the initial investment and maintenance costs of the system were reduced, which reduced the LOCH of the system. Therefore, the multi-objective optimization strategy can effectively reduce the heating costs.
With the rapid economic development, the demand for energy consumption has increased gradually. Building heating is the most critical part of global energy consumption and carbon dioxide emissions. It plays an important role in realizing energy structure transformation and industrial low-carbon development. With the rapid urbanization in China and the increase in residents’ demand for thermal comfort, the scale of district heating systems in China is constantly expanding, and its management and operations are increasingly digital (Lin et al., 2023). The district heating systems have become one of important subsystems of the smart city. According to Tsinghua University’s research (Lin et al., 2023), by the end of 2020, the heating area of northern China was approximately 15.6 billion m2, and the heating energy consumption was approximately 214 million tons of standard coal. However, existing district systems are usually large in scale and have complex operational scenarios. In order to ensure safety and heat demand, heating companies often increase heat intensity, which leads to overheating and wasted heat energy. Therefore, the management of heat demand and supply in district heating systems is a challenging problem.
If there is a mismatch between production and consumption, the generated unused heat may be lost from the heating pipe network (Zhang et al., 2023). Thermal storage systems (TES) are a promising solution to this problem because the heat storage system can store heat at hourly, daily, weekly, and seasonal frequencies while reducing heat loss (Gallo et al., 2016). The benefits of integrating thermal storage systems in a heating network are multiple (Verda and Colella, 2011; Colella et al., 2012; Eynard et al., 2012; Romanchenko et al., 2018) and include energy gains (valorization and recovery of waste energy and operation at nominal capacity) and economic gains (best efficiency and optimization of hourly tariffs). In addition, TES systems allow flexibility to limit the stop/restart sequences of the auxiliary power plants and reduce the installed back-up power (Réveillère et al., 2013; Saloux and Candanedo, 2020; Siddiqui et al., 2021). This allows for overall reductions in energy prices while reducing primary energy consumption and greenhouse gas emissions. Many researchers have studied the feasibility of integrating thermal storage systems into district heating systems. For example, borehole thermal energy storage has been found to be a suitable solution to solve the shortage of production and consumption of solar central heating systems in cold regions (Shah et al., 2018). Tian et al. studied the Danish hybrid solar district heating system with a heat storage system and standby boiler (Tian et al., 2018). The researchers found that using a reasonable water storage system can overcome the mismatch between the heat supply of solar power plants and the heat demand of buildings. Verda et al. analyzed the multi-scale heat storage tank model of the district heating system in Turin (Verda and Colella, 2011). The results show that primary energy consumption can be reduced by up to 12%, and the total cost can be reduced by up to 10%.
China is rich in solar energy resources (Wang et al., 2020). At the same time, in line with national and international policies, solar energy heating is the main way to achieve low-carbon development (Wang et al., 2023). Solar energy heating systems are mainly divided into single-family solar energy heating, distributed solar energy heating, and centralized solar district heating (CSDH) systems (Zhang et al., 2021). The CSDH system has the advantage of providing a greater energy output (Rämä and Mohammadi, 2017). Meanwhile, CSDH systems have characteristics of high thermal efficiency, high safety, and reliable system operation (Furbo et al., 2018; Kong et al., 2019). However, due to the intermittent shortage of solar energy, it is critical for CSDH systems to find an auxiliary heat source (AHS) with high cost performance (Bava et al., 2016). Common forms of AHS include the boiler system or heat pump system (Chen et al., 2022; Kong et al., 2022). The traditional design of AHS must ensure that the building can meet the heat load of the whole building. The optimal design of AHS would effectively reduce investment and operating costs. Huang et al. analyzed four types of CSDHS, namely, solar heat combined with the air source heat pump, the ground source heat pump combined with the solar heat and the air source heat pump, the solar heat combined with the gas boiler, and the solar heat combined with the gas boiler and seasonal heat storage (Huang et al., 2019). The research results pointed out the most economical heat collection area corresponding to these systems in northern Chinese cities. There are five climate regions in China, namely, the severe cold region, cold region, hot summer and cold winter region, hot summer and warm winter region, and mild region (Bai et al., 2020). The regions with heating demand mainly include the severe cold region, cold region, and hot summer and cold winter region (Han et al., 2023). Buildings in the mild region and the hot summer and warm winter region need not be heated due to their low geographical latitude. The choice of AHS depends on the characteristics of the climate and the nature of relevant national and economic policies. In addition, the unreasonable selection of AHS increases the operational energy consumption and equipment investment costs of CSDH systems. Therefore, the selection of AHS is an important factor in improving the energy consumption and cost of CSDH systems. Meanwhile, the initial investment of the composite heating system is higher, and the energy supply mode which varies randomly with the daily solar irradiation makes the configuration and operation control of the system more complex. Therefore, in order to evaluate the composite heating system comprehensively, it is necessary to carry out optimization research. The majority of research studies have devoted themselves to the parametric study, where each design parameter was varied, while the rest of the parameters were fixed; meanwhile, there are conflicts between some evaluating indicators. However, the multi-objective optimization method could be effectively applied to the problem.
In view of the above problems, according to meteorological conditions, Nanjing in the hot summer and cold winter region, Tianjin in the cold region, and Shenyang in the severe cold region were selected for the analysis. Based on the economies and policies of these cities, this study screened out the most suitable heating system structures for residential buildings in various heating areas. Then, a multi-objective optimization based on a genetic algorithm was proposed to optimize system parameters. The research results provide a reference for the structural design of RBDH systems in different climate regions in China.
The structure of the RBDH system is shown in Figure 1. The heat source structure of the RBDH system primarily includes the solar heat collector (SHC) system, the air source heat pump (AHP) with electric auxiliary heating, and the electric boiler (EB). The SHC system primarily consists of a solar heat collector, a water tank, a water pump 3, and a water pump 4. The SHC system exchanges heat with the water in the heating pipe network through plate heat exchanger 2. The heat storage tank is used to store the heat generated by the EB or AHP during the valley power. There are several electrical three-way valves in the RBDH system. This allows the system to realize the heating mode of multiple types of heat sources in combination, for example, the AHP system, AHP coupled heat storage tank (AS) system, SHC system coupled AHP (SA) system, SA system coupled heat storage tank (SAS) system, EB system, EB coupled heat storage tank (ES) system, SHC system coupled EB (SE) system, and SE system coupled heat storage tank (SES) system. The electric heating (EH) system exchanges heat with the water in the heating pipe network through plate heat exchanger 2. The hot water is then delivered to every user in the area through the heating pipe network.
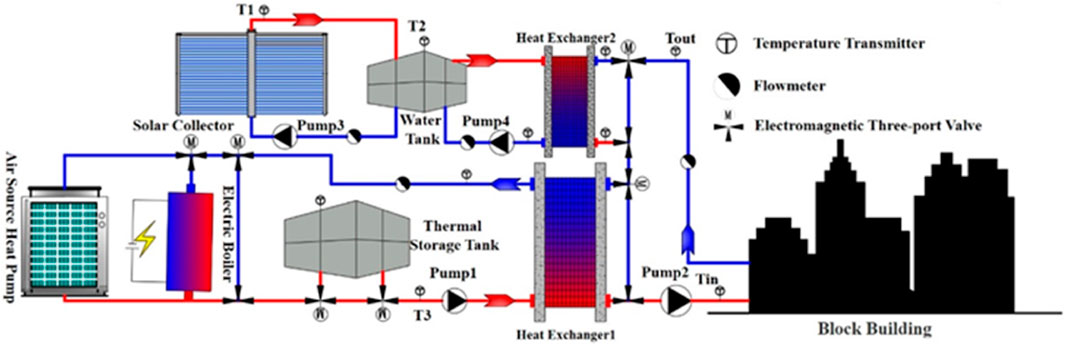
Figure 1. Structure of the RBDH system.
The running state of the SHC system depends on the outlet temperature of the collector and the temperature of the water tank. The control strategy of the SHC system is shown in Figure 2. When the outlet temperature of the solar collector is 5°C higher than the temperature of the water tank, water pump 3 begins to work. When the temperature of the water tank is higher than 50°C, water pump 4 starts to operate, and the SHC system exchanges heat with the water in the heating pipe network. When the temperature difference between the outlet of the solar collector and the water is below 3°C, water pump 3 stops working. When the temperature of the water tank is below 45°C, water pump 4 stops working. The operational status of the air source heat pump and electric boiler depends on the outlet temperature. When the outlet temperature of the AHP or EB is lower than 75°C, the equipment is ready to run. When the outlet temperature of the equipment is higher than 85°C, heating is stopped. When the RBDH system has the valley power storage mode, AHP or EB only operates during the valley power period. Otherwise, the SHC system stops heating and AHP or EB starts running.
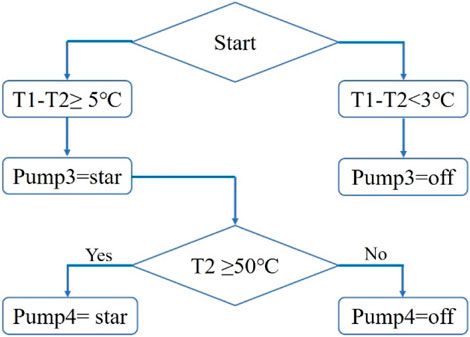
Figure 2. Control strategy diagram of the SHC system.
The heating system and the heat load were required by the building. This leads to unnecessary energy waste in the heating system. Therefore, the RBDH system can adopt the quality adjustment method. The return water T4 of the heating pipe network system adopts the district heating regulation method of quality regulation, while pump 4 of the SHC system adopts the district heating regulation method of quantity regulation (Sun et al., 2022).
The regulation Formulas 1–3 for heating quality are expressed as follows:
where Qr represents the relative heat load ratio, that is, the ratio of the actual heat load Qa to the design heat load Qd. mr stands for relative flow ratio, that is, the ratio of the actual flow ma to design the flow md. Ti represents the actual indoor temperature, °C. Tid represents the design indoor temperature, °C. Ta represents the actual outdoor temperature, °C. Tad represents the design outdoor temperature, °C. Tin and Tind represent the actual water supply temperature and the design water supply temperature, respectively, °C. Tout and Toutd represent the actual backwater temperature and design backwater temperature, respectively, °C. b is the heat transfer coefficient related to the type of the radiator.
According to formula (1), the formula for system quality regulation heating is derived as follows:
The Formulas 5, 6 for system quantity regulation heating are derived as follows:
where mSCd represents the design flow of water pump 4, kg/h. mSC represents the actual flow of water pump 4, kg/h.
The RBDH system model is built using TRNSYS software. The RBDH system model mainly includes the SHC system, AHP, EB, and the building model. The heating area of the residential building studied is 22,500 m2. The main design parameters of simulated models of heating systems in different regions are shown in Table 1. The outdoor temperature data for different regions are shown in Figure 3. The heating season in Nanjing lasts for 81 days, from 15 December to 5 March next year. During the heating season in Nanjing, the monthly average minimum ambient temperature is −0.7°C, and the monthly average maximum ambient temperature is 14.2°C. The heating season in Tianjin lasts for 121 days, from 15 November to 15 March next year. During the heating season in Tianjin, the monthly average minimum ambient temperature is −5.5°C, and the monthly average maximum ambient temperature is 12.6°C. The heating season in Shenyang lasts for 151 days, from 1 November to 31 March next year. During the heating season in Shenyang, the monthly average minimum ambient temperature is −16.5°C, and the monthly average maximum ambient temperature is 7.0°C.
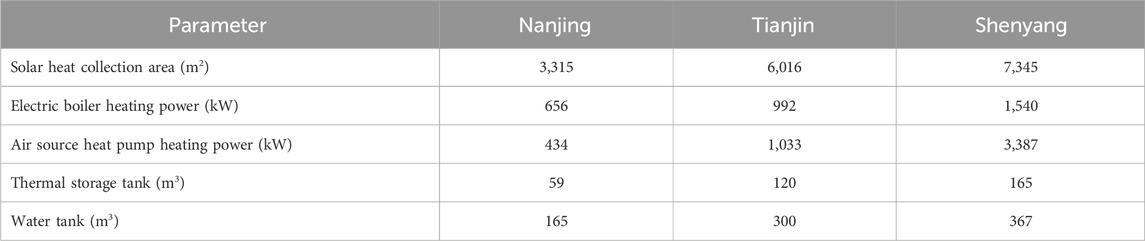
Table 1. Main parameters for system simulation in different cities.
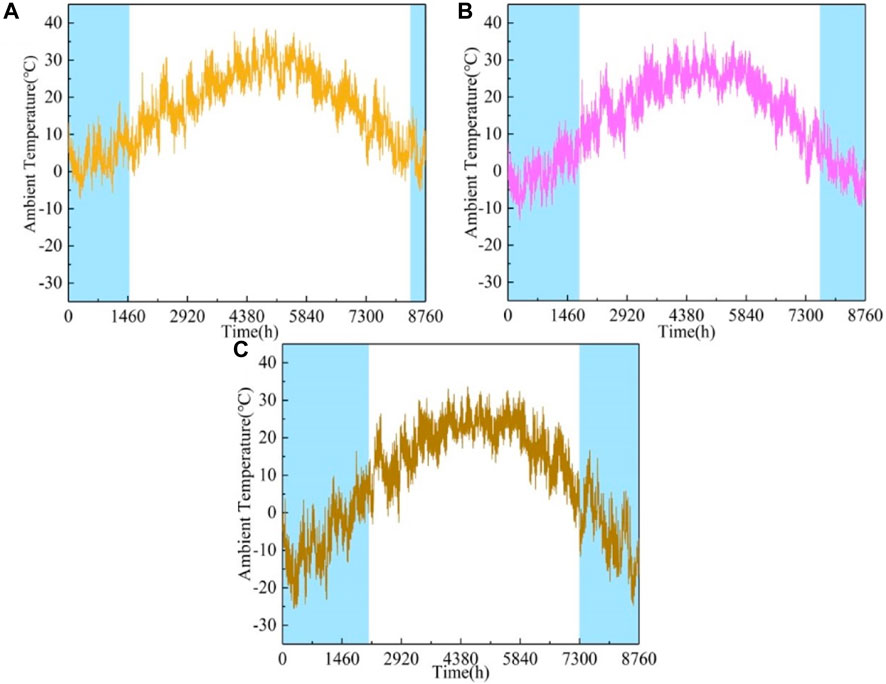
Figure 3. Annual ambient temperatures in different cities: Nanjing (A); Tianjin (B); and Shenyang (C).
The variation in the total solar radiation intensity for different regions is shown in Figure 4. During the heating season, the highest total solar radiation intensity in Nanjing is 60.9 kW/m2 in March, the lowest is 57.6 kW/m2 in December, and the average total solar radiation intensity for the whole heating season is 73.2 kW/m2. During the heating season, the highest total solar radiation intensity in Tianjin is 112.7 kW/m2 in March, the lowest is 51.6 kW/m2 in December, and the average total solar radiation intensity for the whole heating season is 70.2 kW/m2. During the heating season, the highest total solar radiation intensity in Shenyang is 119.9 kW/m2 in March, the lowest is 49.6 kW/m2 in December, and the average total solar radiation intensity for the whole heating season is 74.5 kW/m2.
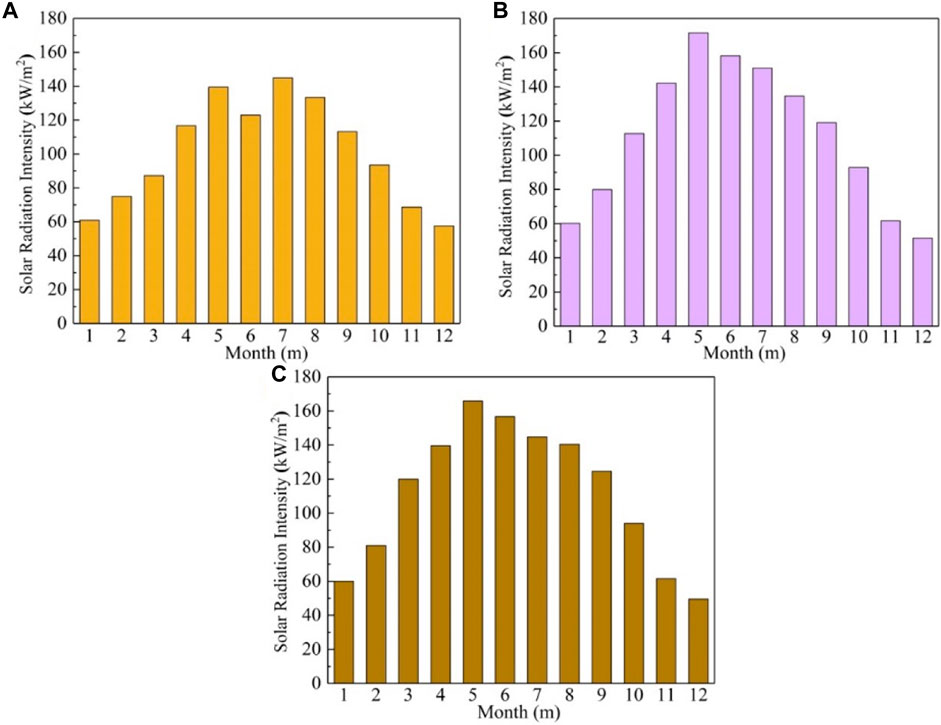
Figure 4. Annual ambient solar radiation intensity in different cities: Nanjing (A); Tianjin (B); and Shenyang (C).
The vacuum tube solar collector was used in this study. The evacuated tube design consists of an inner and outer tube. Its specific parameters are shown in Table 2 (Gong et al., 2020). The outer surface of the absorber tube (inner tube) is coated with a solar radiation absorption layer. The heat transfer fluid flows through the absorber tube absorbing heat.
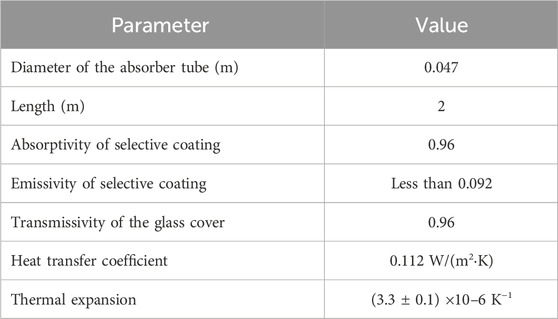
Table 2. Geometrical, optical, and thermal parameters.
According to Formulas 7–12, the energy conservation equation of the vacuum tube solar collector can be written as follows (Gong et al., 2020):
where Qtotal is the total heat absorbed by the absorber tube, kJ. Qu represents the useful heat, and Qloss is the energy loss, kJ.
where L is the length of the absorber tube, m. Dabs is the diameter of the absorber tube, m. ξabs is the absorptivity of the selective coating on the surface of the absorber tube, %. τgla is the transmissivity of the outer glass tube, %. It is the total solar radiation, W/m2.
where ha-g is the heat transfer coefficient in absorber tube’s vacuum part equal to 0.112 W/(m·K). Tf is the fluid temperature of the absorber tube, °C. Ta is the ambient temperature, °C. Ts is the sky temperature, °C. ɛabs is the absorptivity of the selective coating on the surface of the absorber tube. σ is the Stefan–Boltzmann constant.
In this paper, Type158 in the TRNSYS module library is used to simulate the hot water storage tank model. The internal energy of the storage water tank is equal to the input heat minus the output heat and the heat lost to the environment, with the heat loss into the environment primarily consisting of the heat loss from the tank top, bottom, and edge (Li et al., 2023).
where Cw is the specific heat capacity of the water, kJ/(kg·oC). Mw is the water flow, kg/h. Tw is the average temperature of the water in the tank, °C. Qin,tank is the input heat of the tank, kJ/h. Qout, tank is the output heat of the tank, kJ/h. Qloss, tank is the loss heat of the tank, kJ/h. Atank is the water tank’s surface area, m2.
The Formulas 13, 14 for calculating the coefficient of performance (COP) of the heat pump are expressed as follows (Li et al., 2023):
The formula for calculating the heat absorption of the heat pump evaporator is expressed as follows:
where COP is the coefficient of performance of the heat pump. QH is the actual heating capacity of the heat pump, kJ/h. WH is the power consumption of the heat pump, kJ/h. QW is the heat absorption of the heat pump evaporator, kJ/h.
The Formulas 15, 16 for calculating the outlet water temperature of the heat pump evaporator and condenser are represented as follows (Li et al., 2023):
where TS,OUT and TS,IN are the inlet and outlet water temperatures of the evaporator, °C. TL,OUT and TL,IN are the inlet and outlet water temperatures of the condenser, °C. MS is the heat medium mass flow of the evaporator, kg/h. ML is the heat medium mass flow of the condenser, kg/h.
LOCH is used as an index to evaluate the economic performance of heating systems (Zhang et al., 2021). During the entire life cycle of a heating system, the heat cost of generating 1 kWh can be expressed using the following Formula 17:
where PO is the initial investment of the system, CNY. Pc is the carbon trading price, 79.74 CNY/t (National carbon trading, 2023). So is the government subsidy to the system, CNY. RV is the system’s residual value, CNY. d is the discount rate, %. Y is the operating life of the system, year. y is the year of the operating life of the system, year. Cy is the maintenance cost of the system in the y year, CNY. Coy is the operating cost of the system for the y year, CNY. Pland is the system land use cost, CNY. Qy is the heat supply of the system in the y year, kWh.
According to the provisions of the National Bureau of Statistics of China, the value of d is 3% (Su et al., 2018). The land use cost of the system is not examined in this study. The residual value of the system is zero, and there is no government subsidy. Based on this assumption, the Formula 17 can be simplified as Formula 18:
where Cy is primarily provided by the SHC system, AHP, and EB. In this study, the annual maintenance cost of the system is 1% of the initial investment cost of the system. The cost and service life of each piece of equipment used in the calculation process are shown in Table 3.
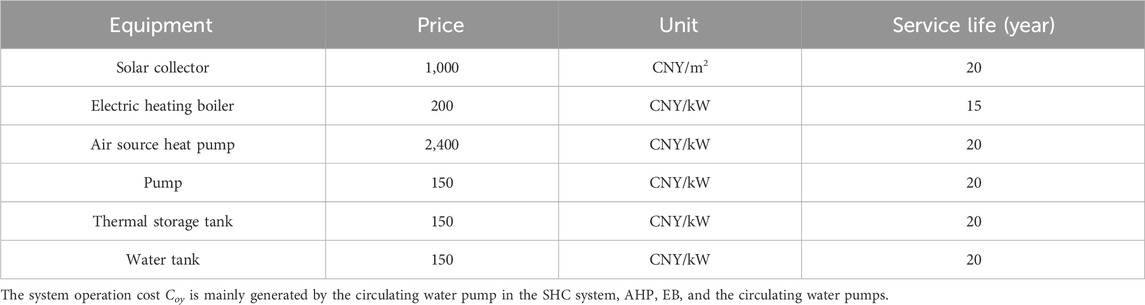
Table 3. Unit price and service life of equipment.
where PSHC is the power of the circulating water pump in the SHC system, kW. PEB is the EB heating power, kW. PAHP is the power of AHP equipment, kW. φ is the operating electricity price, CNY/kWh. The peak and valley electricity prices of different cities are shown in Table 4.

Table 4. Time-of-use electricity price in different cities.
In this study, the emission of carbon dioxide (CO2) produced in the heating process is used as an environmental analysis and evaluation index. CO2 is the main factor causing global warming. The calculation Formula 24 for the amount of pollutant gas produced by the heating system is expressed as follows:
where Mem is the pollutant gas emission, kg/m2. J is the conversion coefficient of fuel pollution gas emission, 2.493 kg/kg. PEC is the primary energy consumption, kg/m2.
The calculation Formula 25 for primary energy consumption of the RBDH system is expressed as follows:
where LHV is the low calorific value of the standard coal, 8.14 kWh/kg; Qd is the system heat supply of non-clean energy, kWh; ηe is the power generation efficiency, 0.35; ηnet is the transmission efficiency of the power grid, 0.92; ηeh is the thermoelectric conversion efficiency, 0.99; and a is the heating area, m2.
Multi-objective optimization problems originate from design, modeling, and programming problems of the complex system, which has more than one objective. The Pareto optimal solution is that there is no better solution to make at least one object better, while the other objects are not inferior. In other words, it is impossible to optimize some of the objectives without degrading others. In this paper, TRNSYS and MATLAB are used to solve the multi-objective optimization problem of the RBDH system. Based on MATLAB, non-dominated sorting genetic algorithms-II (NSGA-II) is used to solve the multi-objective problem of the RBDH system. The specific calculation process and steps are shown in Figure 5.
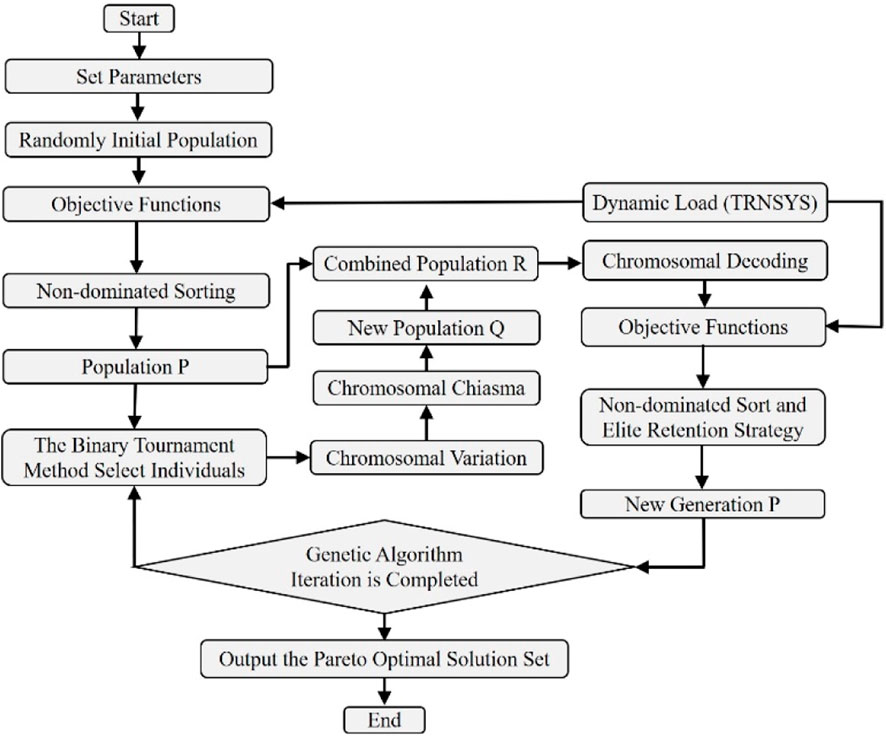
Figure 5. Flowchart of the genetic algorithm of multi-objective optimization.
The system energy consumption and LOCH are selected as the objectives. The optimization parameters are the solar collector, the water tank volume, the air source heat pump power, the electric boiler heating power, and the thermal storage tank volume. The parameter setting of genetic for multi-objective optimization is shown in Table 5. For the heat load, each heating system provides heat for satisfying the indoor heating temperature demand. Therefore, one of the constraints is that the indoor temperature is not lower than 20°C. Meanwhile, the CO2 emission of the optimized system should be lower than that of the pre-optimized system.
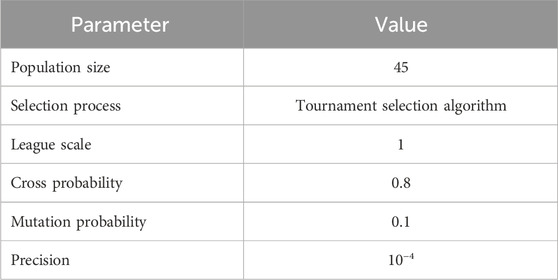
Table 5. Multi-objective optimization parameter based on the genetic algorithm.
As shown in Figure 6, the unit energy consumption of heating systems with different structures differed in different regions. The unit energy consumption of the EB system was considerably higher than that of the heating system with AHP as the heat source. This was because EB needed to consume electricity completely, and AHP had the ability to save energy (Zheng et al., 2024). Among them, the energy consumption of the AHP system in Nanjing was 72.17% lower than that of the EB system. The energy consumption of the AHP system in Tianjin was 65.13% lower than that of the EB system. The energy consumption of the AHP system in Shenyang was 55.67% lower than that of the EB system. This was because the COP of AHP decreased with the decrease in the ambient temperature. Therefore, the AHP system had a remarkable energy-saving effect in the hot summer and cold winter region.
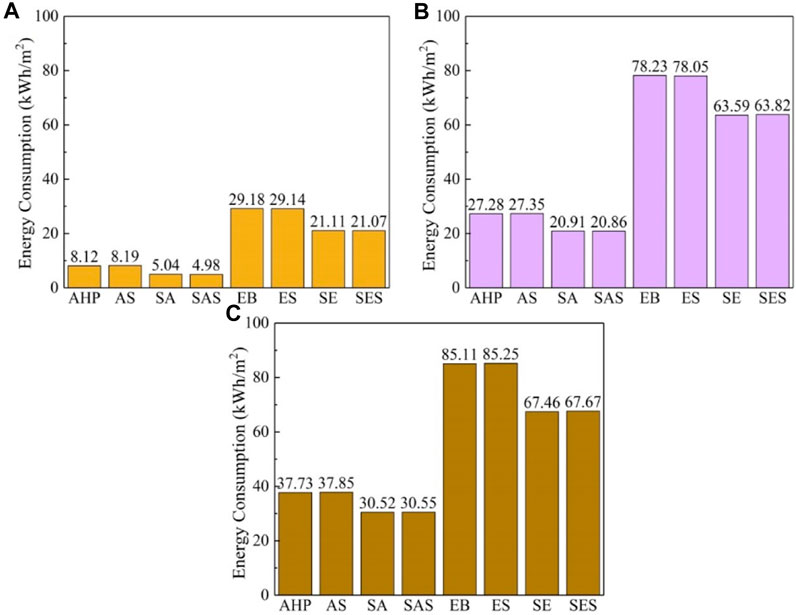
Figure 6. Energy consumption of different systems in different typical cities: Nanjing (A); Tianjin (B); and Shenyang (C).
The SHC system reduced the energy consumption of the EB system and AHP system. The energy consumption of the SA system and SE system in Nanjing was 37.93% and 27.66% lower than that of the AHP system and EB system, respectively. The energy consumption of the SA system and SE system in Tianjin was 23.35% and 18.71% lower than that of the AHP system and EB system, respectively. The energy consumption of the SA system and SE system in Shenyang was 19.11% and 20.74% lower than that of the AHP system and EB system, respectively. The thermal storage water tank in the electric heating system did not reduce the energy consumption of the system obviously. This was because the thermal storage water tank only played a role in the transfer of system energy consumption over time. For power plants, the electric heat storage can play a role in peak shaving and valley filling. Therefore, from the perspective of system energy consumption, the SHC system has excellent energy conservation for residential buildings in different regions.
Figure 7 shows the CO2 emissions of different heating systems in different regions. CO2 emissions from heating systems based on electric boiler systems were high. This was because the electric heating boiler needed to completely consume electricity. Moreover, the heating system was based on the air source heat pump needed to consume some electricity. The electricity consumption of the SHC system only came from the operation of the water pump. Therefore, the SHC system was beneficial to reduce the CO2 emission of the heating system. The heat storage water tank in the EB system or AHP system did not reduce the energy consumption of the system. Therefore, the thermal storage tank had limited effect on reducing CO2 emissions.
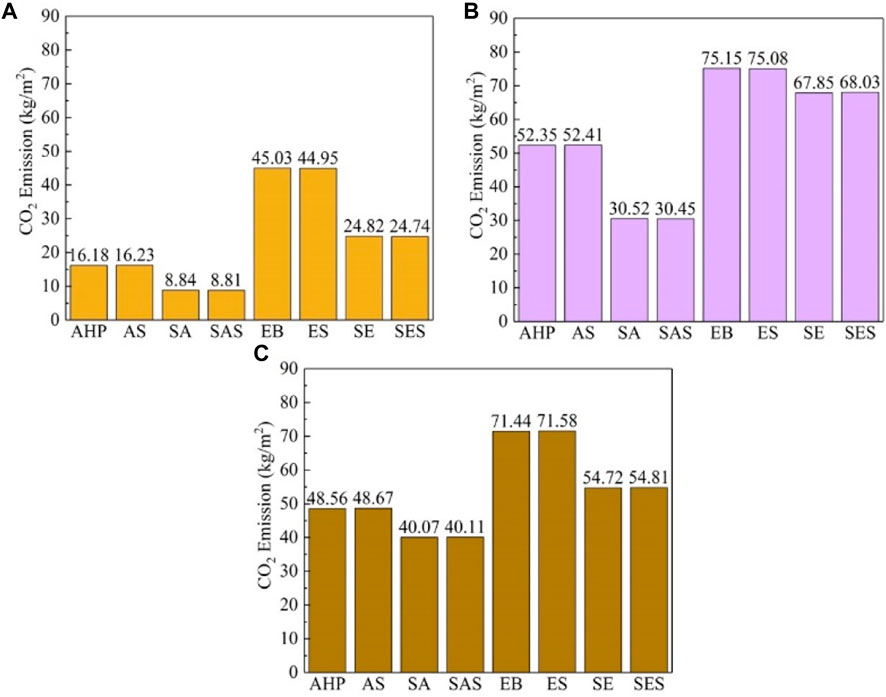
Figure 7. CO2 emission of different systems in different typical cities: Nanjing (A); Tianjin (B); and Shenyang (C).
The operating costs of different heating systems were calculated based on the time-of-use electricity price policy. Therefore, the valley electric heat storage was used to analyze the economic impact on the RBDH system. During the valley electricity period, the EB or AHP provided heat for the building and heated the heat storage water tank. During the no-valley electricity period, the EB and AHP stop working, and the heat storage tank releases heat, which was then used to heat the building. As shown in Figure 8, the LOCH of heating systems with different structures in different regions was in a different order without considering carbon trading. For different heating systems in Nanjing, the LOCH of the EB system was the lowest, and the LOCH of the SES system was the highest. Therefore, valley electricity storage heat was not conducive to improving the economies of heating systems in Nanjing. For different heating systems in Tianjin, the LOCH of the AHP system was the lowest and the LOCH of the SES system was also the highest. The valley electricity storage heat did not reduce the LOCH of the AS system and the ES system, but the SHC system reduced the LOCH of the SAS system. This was because the cost of building the heat storage tank was higher than the cost saved by the valley power storage. Therefore, the dynamic control method can be used to adjust the heat storage and release of the heat storage box, and the multi-objective optimization method can be used to optimize its volume. For different heating systems in Shenyang, the LOCH of the EB system was the lowest and that of the SAS system was the highest. The LOCH of the SE system was reduced using the SHC system. This may be due to the high solar radiation intensity in the severe cold region, which led to the large heat supply of the SHC system. Therefore, the economic benefit of the SHC system was high. From an economic point of view, the EB system was suitable for the hot summer and cold winter region, the AHP system was suitable for the cold region, and the SE system was suitable for the severe cold region.
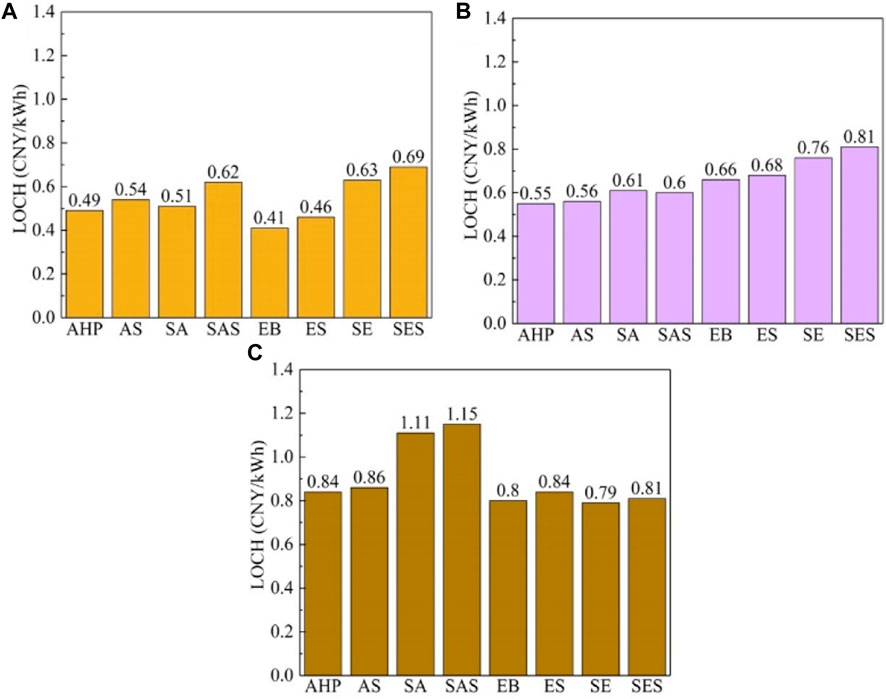
Figure 8. LOCH of different systems in different typical cities: Nanjing (A); Tianjin (B); and Shenyang (C).
The RBDH system should not only meet the heating needs of community users but also consider the economic costs caused by carbon emissions in the system operation. Considering the carbon transaction costs in LOCH, it is helpful in further analyzing the applicability of the RBDH system with different structures in different regions. As shown in Figure 9, the LOCH of different heating systems in different regions changed when considering carbon transaction costs. For different heating systems in Nanjing, the LOCH value of the SA system has become the lowest. The LOCH of the EB system and ES system increased the most by 29.27% and 32.61%, respectively. This was because the electricity consumed by EB produced a lot of CO2 emissions. For different heating systems in Tianjin, the LOCH value of the SAS system has become the lowest. The LOCH value of the SAS system with the best economy increased by 3.3%. The LOCH value of the AHP system increased by 15.54%. For different heating systems in Shenyang, the LOCH value of the SE system became the lowest. The LOCH value of the ES system increased the most, which was 11.90%. Therefore, considering the carbon transaction cost, the SA system was suitable for the hot summer and cold winter region, the SAS system was suitable for the cold region, and the SE system was suitable for the severe cold region.
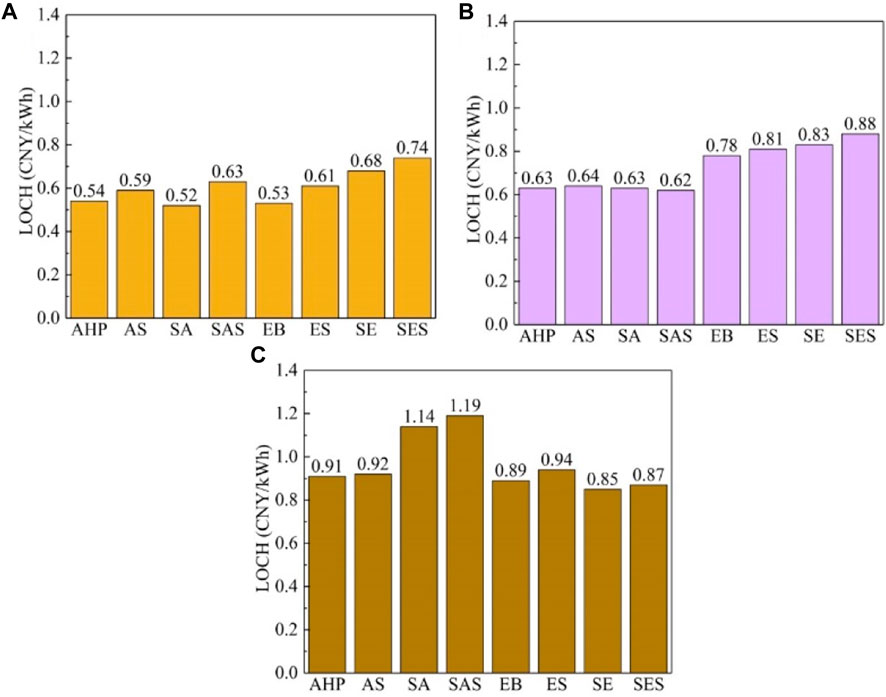
Figure 9. LOCH of different systems in different typical cities considering carbon trading: Nanjing (A); Tianjin (B); and Shenyang (C).
There is a general mismatch between supply and demand between the heat supply of heating systems suitable for different regions and the heat load required by buildings. Therefore, heating systems suitable for different regions were optimized. As shown in Figure 10, the energy consumption of different heating systems based on the quality adjustment was reduced. The energy consumption of the SAA (SA under adjustment) system was 25.40% lower than that of the SA system. The energy consumption of the SASA (SAS under adjustment) system was 24.93% lower than that of the SAS system. The energy consumption of the SEA (SE under adjustment) system was 38.85% lower than that of the SE system. As shown in Figure 11, the average indoor temperature of residents in different regions under the control of quality adjustment operation was controlled at approximately 20°C, and the average indoor temperature fluctuated slightly. The standard deviation of the average indoor temperature in Nanjing decreased by 62.04%. The standard deviation of the average indoor temperature in Tianjin decreased by 78.83%. The standard deviation of the average indoor temperature in Shenyang decreased by 61.13%. Therefore, the quality adjustment method is significant in reducing the energy consumption of the heating system.
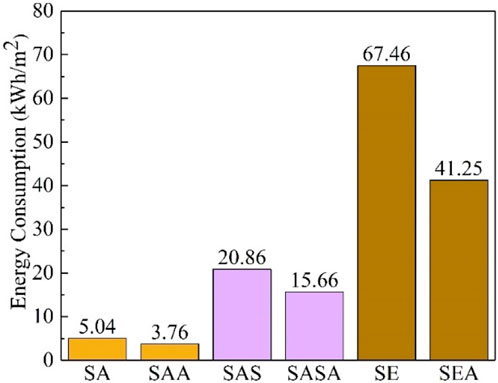
Figure 10. Energy consumption of different systems.
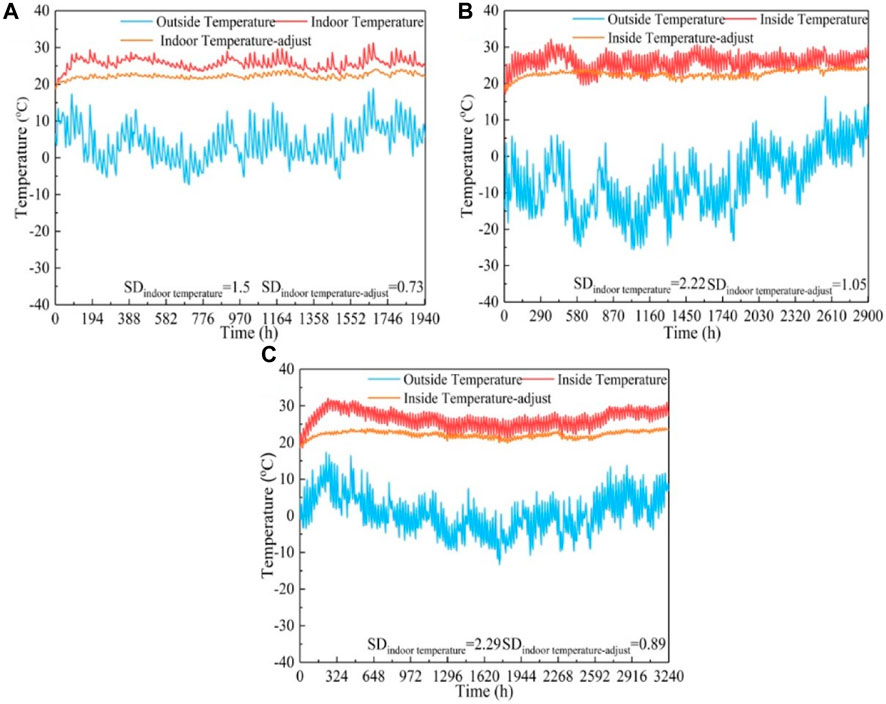
Figure 11. Temperature data in different typical cities: Nanjing (A); Tianjin (B); and Shenyang (C).
As shown in Figure 12, the CO2 emissions of different heating systems under quality adjustment operations were reduced. The CO2 emissions from the SA system decreased by 33.94%. The CO2 emissions from the SAS system decreased by 29.75%. The CO2 emissions from the SE system decreased by 33.39%. This was due to reduced system energy consumption. As shown in Figure 13, considering the carbon transaction cost, the LOCH of different heating systems under quality adjustment operation was increased. The LOCH value of the SA system increased by 11.53%. The LOCH value of the SAS system increased by 9.67%. The LOCH value of the SA system increased by 10.58%. This may be due to the reduction in heat supply and operating costs of heating systems under the control of quality regulation operations, but the initial investment of heating systems did not change.
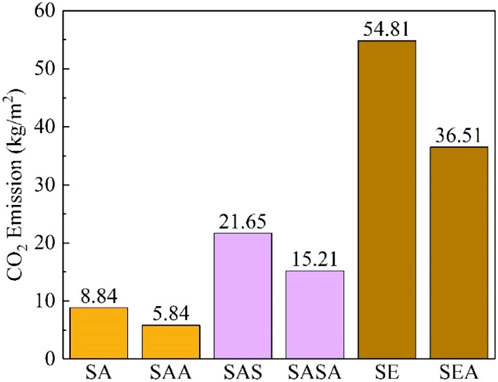
Figure 12. CO2 emission comparison data on different systems.
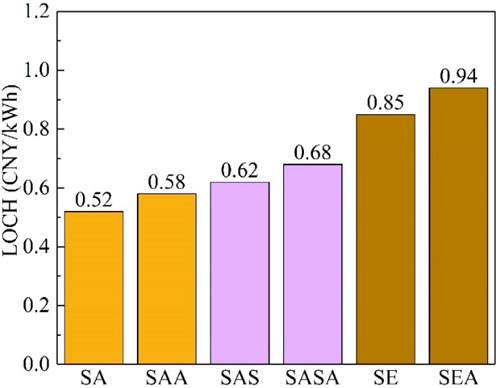
Figure 13. LOCH of different systems considering carbon trading.
The Pareto solution is shown in Figure 14. The vertical axis represents the LOCH, and the horizontal axis represents the energy consumption. Known above that LOCH and energy consumption were contradictory objectives, reducing energy consumption means increasing initial investment. As shown in Figure 14, for point b, the LOCH was the lowest, but the energy consumption was the highest. For point a, the energy consumption was the lowest, but the LOCH was the highest. When the optimization objective was only the cost, point b was the best solution.
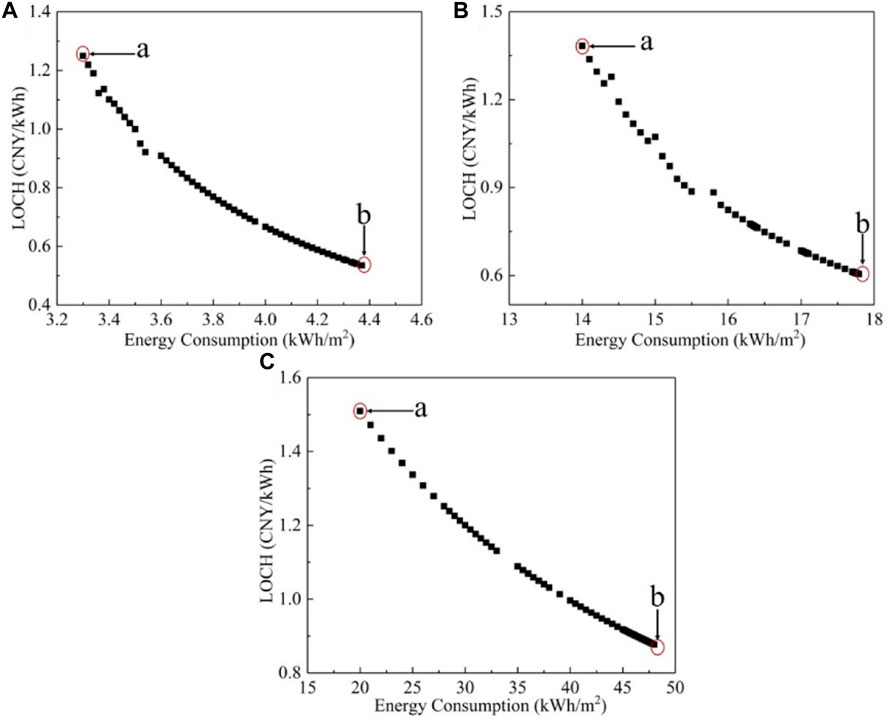
Figure 14. Pareto optimal solutions obtained from multi-objective optimization of different systems in different typical cities: Temperature data in different typical cities: Nanjing (A); Tianjin (B); and Shenyang (C).
The parameters of different heating systems after adopting the multi-objective optimization strategy are shown in Table 6. Figure 15 shows the energy consumption of different optimized heating systems. The energy consumption of different heating systems under the quality adjustment strategy was increased after optimization. The energy consumption of the optimized SAA (OSAA) system increased by 16.22% compared with that of the SAA system. The energy consumption of the optimized SASA (OSASA) system increased by 13.60% compared with that of the SASA system. The energy consumption of the optimized SEA (OSEA) system increased by 16.48% compared with that of the SEA system. It was attributed to the reduction in the solar collector area in optimized heating systems. As a result, the heat supply of clean energy for heating systems was reduced. As shown in Figure 16, the proportion of clean energy heating in the OSAA system was reduced by 57.34% compared with that in the SAA system. The proportion of clean energy heating in the OSASA system was reduced by 49.98% compared with that in the SASA system. The proportion of clean energy heating in the OSEA system was reduced by 59.40% compared with that in the SEA system. However, the proportion of clean energy heating in different heating systems had increased under the quality adjustment strategy. Among them, the proportion of clean energy heating in the SAA system had increased by 29.16% compared with that in the SA system. The proportion of clean energy heating in the SASA system had increased by 16.46% compared with that in the SAS system. The proportion of clean energy heating in the SEA system had increased by 11.82% compared with that in the SE system. This was because the heat supply of the heating system matched the heat load required by the building, which avoided the unnecessary waste of clean energy.
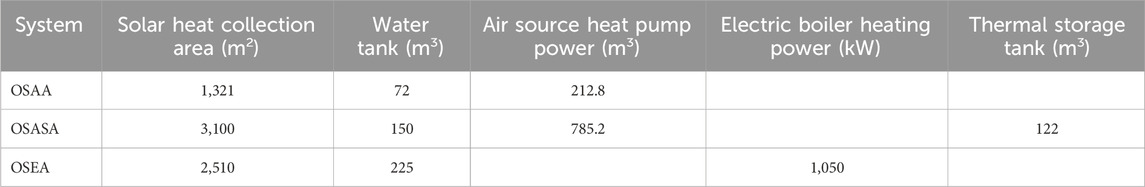
Table 6. Main parameters for different optimized systems.
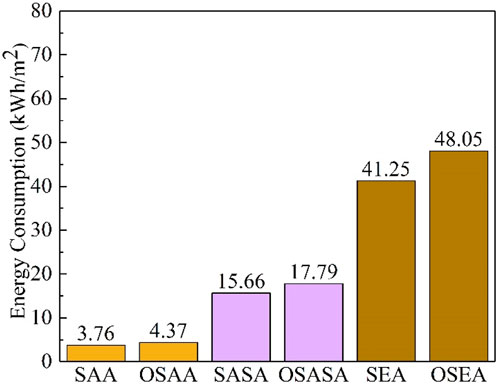
Figure 15. Energy consumption of different optimized systems.
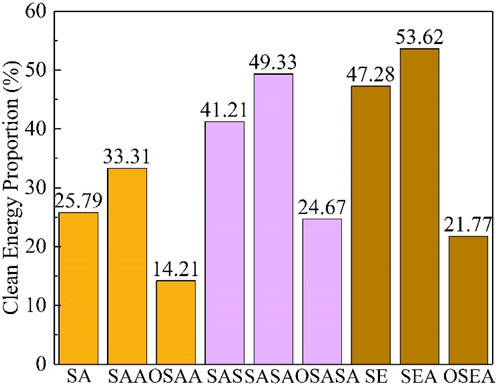
Figure 16. Clean energy proportion of different optimized systems.
After optimization, the reduction in the proportion of clean energy heating in different heating systems will lead to an increase in the CO2 emissions of the heating system. As shown in Figure 17, the CO2 emission of the OSAA system increased by 25.21% compared with that of the SAA system. The CO2 emission of the OSASA system increased by 20.16% compared with that of the SASA system. The CO2 emission of the OSEA system increased by 21.11% compared with that of the SEA system. The LOCH of different optimized heating systems considering carbon trading is shown in Figure 18. Although the energy consumption and CO2 emissions of different optimized heating systems increased, the LOCH of different optimized systems decreased. The LOCH of the OSAA system was 8.62% lower than that of the SAA system. The LOCH of OSASA system was 11.76% lower than that of the SASA system. The LOCH of the OSEA system was 7.45% lower than that of the SEA system. This was because the initial investment and maintenance costs of system construction were reduced. Therefore, the multi-objective optimization strategy can effectively reduce the heating cost.
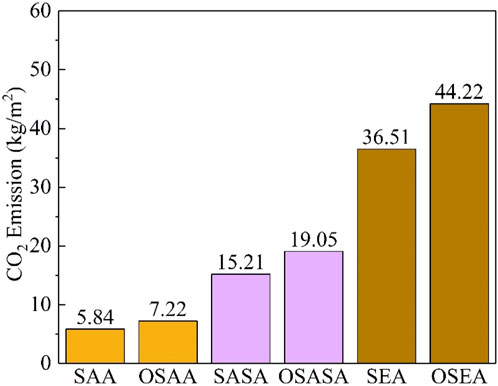
Figure 17. CO2 emission comparison data on different optimized systems.
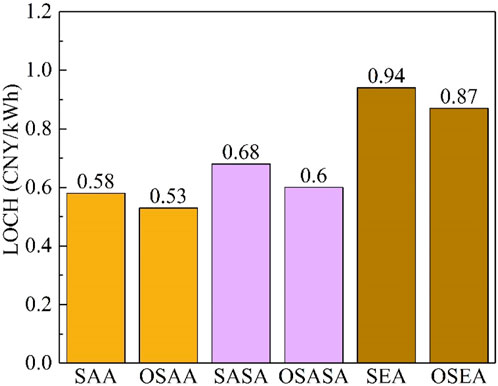
Figure 18. LOCH of different optimized systems considering carbon trading.
In order to study the applicability of different clean heating systems in residential buildings in different regions, the different heating systems were analyzed from the aspects of system energy consumption, CO2 emissions, and carbon transaction costs. The influence of quality adjustment strategies on the operational performance of different heating systems was studied. The multi-objective optimization based on a genetic algorithm was proposed to optimize parameters. The operation effect of the heating system before and after optimization was analyzed, which provided guidelines for the application of different clean heating systems in different regions. The main conclusions are as follows:
Under operation control without quality adjustment, the LOCH considered the carbon transaction cost during operation. The results showed that the SA system was suitable for the hot summer and cold winter region, the SAS system was suitable for the cold region, and the SE system was suitable for the severe cold region.
The analysis of heating systems with different structures suitable for different regions was carried out. The results showed that for the AS system and the ES system, the cost of building the heat storage tank was higher than the cost saved by the valley power storage.
In order to avoid excessive heat supply, the operation control strategy based on quality adjustment reduced heating energy consumption, maintained indoor temperatures at approximately 20°C, increased the proportion of clean energy heating, and reduced CO2 emissions but increased the LOCH of the RBDH system.
In order to reduce the heating cost of the system, the multi-objective optimization strategy was adopted to optimize the system parameters. The proportion of clean energy heating in the optimized heating system decreased, which led to increases in system energy consumption and CO2 emissions. However, the initial investment and maintenance costs of the system were reduced, which reduced the LOCH of the system. Therefore, the multi-objective optimization strategy can effectively reduce the heating cost.
The original contributions presented in the study are included in the article/Supplementary Material; further inquiries can be directed to the corresponding author.
SF: conceptualization and writing–review and editing. LW: writing–original draft. HL: formal analysis and writing–review and editing.
The author(s) declare that financial support was received for the research, authorship, and/or publication of this article. This work was supported by the Research and demonstration on low-carbon neighborhood planning and design technology (grant no. 20220109330730002).
The authors would like to thank the support of the Research and demonstration on low-carbon neighborhood planning and design technology (grant no. 20220109330730002). They would like to thank all the authors of this article for their contributions in this article.
Author LW was employed by Qingdao Economic and Technology Development Zone Haier Water-Heater Co., Ltd.
The remaining authors declare that the research was conducted in the absence of any commercial or financial relationships that could be construed as a potential conflict of interest.
All claims expressed in this article are solely those of the authors and do not necessarily represent those of their affiliated organizations, or those of the publisher, the editors, and the reviewers. Any product that may be evaluated in this article, or claim that may be made by its manufacturer, is not guaranteed or endorsed by the publisher.
Bai, L., Yang, L., Song, B., and Liu, N. (2020). A new approach to develop a climate classification for building energy efficiency addressing Chinese climate characteristics. Energy 195, 116982. doi:10.1016/j.energy.2020.116982
Bava, F., Nielsen, J. E., Knabl, S., Brunger, A., Furbo, S., and Fink, C. (2016). Results of IEA SHC Task 45: large scale solar heating and cooling systems. Subtask A: “Collectors and collector loop”. Energy Procedia 91, 546–556. doi:10.1016/j.egypro.2016.06.197
Chen, H., Fan, W., Cai, B., Li, G., WangAkhlaghi, Y. Y. G., Jiang, L., et al. (2022). Performance and economic evaluation of a solar-air hybrid source energy heating system installed in cold region of China. J. Build. Eng. 56, 104796. doi:10.1016/j.jobe.2022.104796
Colella, F., Sciacovelli, A., and Verda, V. (2012). Numerical analysis of a medium scale latent energy storage unit for district heating systems. Energy 45 (1), 397–406. doi:10.1016/j.energy.2012.03.043
Eynard, J., Grieu, S., and Polit, M. (2012). Predictive control and thermal energy storage for optimizing a multi-energy district boiler. J. Process Control 22 (7), 1246–1255. doi:10.1016/j.jprocont.2012.05.011
Furbo, S., Dragsted, J., Perers, B., Andersen, E., Bava, F., and Nielsen, K. P. (2018). Yearly thermal performances of solar heating plants in Denmark–Measured and calculated. Sol. Energy 159, 186–196. doi:10.1016/j.solener.2017.10.067
Gallo, A. B., Simões-Moreira, J. R., Costa, H. K. M., Santos, M. M., and Dos Santos, E. M. (2016). Energy storage in the energy transition context: a technology review. Renew. Sustain. Energy Rev. 65, 800–822. doi:10.1016/j.rser.2016.07.028
Gong, J., Jiang, Z., Luo, X., Du, B., Wang, J., and Lund, P. (2020). Straight-through all-glass evacuated tube solar collector for low and medium temperature applications. Sol. Energy 201, 935–943. doi:10.1016/j.solener.2020.03.069
Han, J., Zhang, C., Wang, L., Chang, Z., Zhao, Q., Shi, Y., et al. (2023). Research on operation optimization of heating system based on electric storage coupled solar energy and air source heat pump. Energy Eng. 120 (9), 1991–2011. doi:10.32604/ee.2023.029749
Huang, J., Fan, J., Furbo, S., Chen, D., Dai, Y., and Kong, W. (2019). Economic analysis and optimization of combined solar district heating technologies and systems. Energy 186, 115886. doi:10.1016/j.energy.2019.115886
Li, J., Wei, S., Dong, Y., Liu, X., and Novakovic, V. (2023). Technical and economic performance study on winter heating system of air source heat pump assisted solar evacuated tube water heater. Appl. Therm. Eng. 221, 119851. doi:10.1016/j.applthermaleng.2022.119851
Lin, X., Mao, Y., Chen, J., and Zhong, W. (2023). Dynamic modeling and uncertainty quantification of district heating systems considering renewable energy access. Appl. Energy 349, 121629. doi:10.1016/j.apenergy.2023.121629
National carbon trading, N. B. D. (2023). The national carbon market closed down1.42 % to 79.84 yuan/t today. Available online: https://www.nbd.com.cn/articles/2023-12-26/3181562.
Rämä, M., and Mohammadi, S. (2017). Comparison of distributed and centralised integration of solar heat in a district heating system. Energy 137, 649–660. doi:10.1016/j.energy.2017.03.115
Réveillère, A., Hamm, V., Lesueur, H., Cordier, E., and Goblet, P. (2013). Geothermal contribution to the energy mix of a heating network when using Aquifer Thermal Energy Storage: modeling and application to the Paris basin. Geothermics 47, 69–79. doi:10.1016/j.geothermics.2013.02.005
Romanchenko, D., Kensby, J., Odenberger, M., and Johnsson, F. (2018). Thermal energy storage in district heating: centralised storage vs. storage in thermal inertia of buildings, Energy Convers. Manag., 162, 26–38. doi:10.1016/j.enconman.2018.01.068
Saloux, E., and Candanedo, J. A. (2020). Optimal rule-based control for the management of thermal energy storage in a Canadian solar district heating system. Sol. Energy 207, 1191–1201. doi:10.1016/j.solener.2020.07.046
Shah, S. K., Aye, L., and Rismanchi, B. (2018). Seasonal thermal energy storage system for cold climate zones: a review of recent developments. Renew. Sust. Energ. Rev. 97, 38–49. doi:10.1016/j.rser.2018.08.025
Siddiqui, S., Macadam, J., and Barrett, M. (2021). The operation of district heating with heat pumps and thermal energy storage in a zero-emission scenario. Energy Rep. 7, 176–183. doi:10.1016/j.egyr.2021.08.157
Su, C., Madani, H., and Palm, B. (2018). Heating solutions for residential buildings in China: current status and future outlook. Energy Convers. Manage 177, 493–510. doi:10.1016/j.enconman.2018.10.005
Sun, Y., Chen, X., Wu, S., Wei, W., Wang, W., and Deng, S. (2022). Performance analysis of air source heat pump space heating system with an adaptive control for supply water temperature. Appl. Therm. Eng. 211, 118401. doi:10.1016/j.applthermaleng.2022.118401
Tian, Z., Perers, B., Furbo, S., and Fan, J. (2018). Thermo-economic optimization of a hybrid solar district heating plant with flat plate collectors and parabolic trough collectors in series. Energy Convers. Manag. 165, 92–101. doi:10.1016/j.enconman.2018.03.034
Verda, V., and Colella, F. (2011a). Primary energy savings through thermal storage in district heating networks. Energy 36 (7), 4278–4286. doi:10.1016/j.energy.2011.04.015
Verda, V., and Colella, F. (2011b). Primary energy savings through thermal storage in district heating networks. Energy 36 (7), 4278–4286. doi:10.1016/j.energy.2011.04.015
Wang, L., Guo, L., Ren, J., and Kong, X. (2022). Using of heat thermal storage of PCM and solar energy for distributed clean building heating: a multi-level scale-up research. Appl. Energy 321, 119345. doi:10.1016/j.apenergy.2022.119345
Wang, L., Yuan, J., Qiao, X., and Kong, X. (2023). Optimal rule based double predictive control for the management of thermal energy in a distributed clean heating system. Renew. Energy 215, 118924. doi:10.1016/j.renene.2023.118924
Wang, Z., Chen, H., Sun, X., Lu, H., and Wang, T. (2022). Optimizing the solar-air hybrid source heat pump heating system based on the particle swarm algorithm. Energy Rep. 8, 379–393. doi:10.1016/j.egyr.2022.05.098
Xiong, F., Wei, B., and Xu, F. (2022). Identification of arch dam mechanical parameters based on sensitivity analysis and Hooke–Jeeves algorithm optimization. Structures 46, 88–98. doi:10.1016/j.istruc.2022.10.052
Zhang, R., Wang, D., Liu, Y., Chen, Y., Fan, J., Song, C., et al. (2021). Economic optimization of auxiliary heat source for centralized solar district heating system in Tibetan Plateau, China. Energy Convers. Manage 243, 114385. doi:10.1016/j.enconman.2021.114385
Zhang, R., Wang, D., Liu, Y., Chen, Y., Fan, J., Song, C., et al. (2021a). Economic optimization of auxiliary heat source for centralized solar district heating system in Tibetan Plateau China. Energy Convers. Manage 243, 114385. doi:10.1016/j.enconman.2021.114385
Zhang, X., Yuan, J., Kong, X., Han, J., and Shi, Y. (2023). Coupling of flexible phase change materials and pipe for improving the stability of heating system. Energy 275, 127474. doi:10.1016/j.energy.2023.127474
Keywords: solar thermal energy, residential building, air source heat pump, clean heating system, peak–valley electricity
Citation: Fu S, Wang L and Long H (2024) Research on the optimization of the clean heating system for regional residential buildings based on the multi-objective optimization strategy. Front. Energy Res. 12:1374369. doi: 10.3389/fenrg.2024.1374369
Received: 22 January 2024; Accepted: 28 February 2024;
Published: 11 April 2024.
Edited by:
Jiangfeng Guo, Chinese Academy of Sciences (CAS), ChinaCopyright © 2024 Fu, Wang and Long. This is an open-access article distributed under the terms of the Creative Commons Attribution License (CC BY). The use, distribution or reproduction in other forums is permitted, provided the original author(s) and the copyright owner(s) are credited and that the original publication in this journal is cited, in accordance with accepted academic practice. No use, distribution or reproduction is permitted which does not comply with these terms.
*Correspondence: Lu Wang, d2wxMjEwaGVidXRAMTYzLmNvbQ==
Disclaimer: All claims expressed in this article are solely those of the authors and do not necessarily represent those of their affiliated organizations, or those of the publisher, the editors and the reviewers. Any product that may be evaluated in this article or claim that may be made by its manufacturer is not guaranteed or endorsed by the publisher.
Research integrity at Frontiers
Learn more about the work of our research integrity team to safeguard the quality of each article we publish.