 Jun Jia1
 Xiaodong Lv
- 1College of Transportation Engineering, Nanjing Tech University, Nanjing, China
- 2College of Electrical Engineering and Control Science, Nanjing Tech University, Nanjing, China
- 3Taizhou College, Nanjing Normal University, Taizhou, China
In the context of energy conservation and emission reduction, the integration and consumption of large-scale wind and solar resources is an inevitable trend in future energy development. However, with the increase of wind and solar grid-connected capacity, the power system also requires more flexible resources to ensure safe operation. To enhance the economic efficiency of the complementary operation of wind, solar, hydro, and thermal sources, considering the peak regulation characteristics of different types of power sources, the study of the joint dispatch model of complementary utilization of various generation methods like wind, solar, hydro, thermal, and storage is of great significance for the economic dispatch of the power system. Existing studies mainly focus on traditional thermal power units or hydropower units, with few studies investigating the impact of pumped-storage power stations on the absorption of renewable energy. Firstly, this paper introduces the composition and function of each unit under the research framework and establishes a joint dispatch model for wind, solar, hydro, and thermal power. Secondly, the paper elaborates on the objective function within the model, mainly covering the operating costs of thermal power units, hydropower units, pumped storage, wind and solar units, the cost of discarding new energy, and the cost of load shedding. Subsequently, the paper presents the constraints of the system model, mainly the feasible boundaries for the operation of each unit within the system. Finally, The results of the calculations show that the proposed model reduces the total operating cost by 12% and the power abandonment rate by 82% compared to the conventional model. It is shown that the proposed model can not only significantly improve the economic efficiency of the system operation but also reduce the level of energy waste and load shedding, effectively enhancing the degree of energy utilization within the system.
1 Introduction
Developing a new power system adapted to the increasing proportion of new energy sources is a crucial measure for China to achieve its carbon peak and carbon neutrality goals on schedule and is essential for ensuring national energy security (Hou et al., 2023). Traditional thermal power units generate a large amount of carbon dioxide and other greenhouse gases when burning coal, significantly impacting global warming. Additionally, thermal power stations consume vast amounts of water resources during operation and produce air pollutants and solid waste, adversely affecting the environment and human health. The medium-to-long-term seasonal fluctuations, short-term randomness, and intermittent fluctuations of wind and solar power generation pose severe flexibility challenges for the new power system across daily, monthly, seasonal, and annual timescales, necessitating the exploration of new renewable flexibility resources (Nnamchi et al., 2023). Hydropower ranks second in installed capacity in China, with a 16.1% share in 2022, second only to thermal power units. Its strong regulation capability, combined with the random fluctuations of wind and solar power, forms a complementary system that outputs relatively smooth and stable high-quality power, effectively solving the challenges of wind and solar energy development (Bello et al., 2023). Prioritizing the use of existing power sources to achieve multi-energy complementarity and maximize the use of renewable energy is of significant research value (Lamb et al., 2023). Therefore, the functional positioning of hydropower should gradually shift from focusing on electricity generation to capacity support, thus promoting the integrated development of hydro-wind-solar complementarity. However, with the increasing capacity of wind and solar power, the issue of abandoning wind and solar energy is unavoidable, and conventional hydropower cannot effectively store the electricity generated from abandoned wind and solar power (Jin et al., 2023). Pumped storage, as a crucial technology for enhancing the absorption level of new energy, has developed rapidly in China (Garcia-Gonzalez et al., 2008; Feng et al., 2021; Huang et al., 2023; Liu et al., 2023; Wang et al., 2023). How to use pumped storage technology efficiently and economically to promote the absorption of new energy is an important direction of current research.
When the penetration rate of wind power increases to a certain extent, relying solely on thermal power to cope with the uncertainty of wind and solar output will lead to frequent starting and stopping of thermal power units, threatening the safety, stability, and economy of the power grid operation (Ye et al., 2023). In the analysis of wind and solar grid integration, research on the active output characteristics of the system mainly includes studies on the operating characteristics of wind-solar-thermal systems and the spatiotemporal complementarity of active power output from wind and solar energy (Sun and Harrison, 2019). Literature (Silva et al., 2016) used Pearson correlation coefficients to analyze the correlation between different power sources. Literature (Hong-Mei et al., 2013) assessed the natural characteristics of wind and solar output and the complementarity of wind, solar, and storage from the aspects of complementarity rate and smoothness. Literature (Cuiping et al., 2017) evaluated the operating characteristics of the photovoltaic-hydropower complementary system based on indicators such as the abandoned light ratio, the ratio of thermal power to load, and grid-connected revenue. Facing the numerous uncertainties of wind and photovoltaic grid integration, literature (Canizes et al., 2012) used the Monte Carlo method to simulate uncertain factors such as wind speed and natural inflow. Literature (Hinojosa and Velasquez, 2016) used scenario trees for uncertainty modeling, which includes a large amount of random information. Literature (Azizipanah-Abarghooee et al., 2012), based on the Monte Carlo concept, used the point estimation method to obtain the probabilistic statistical information of the variables in question.
Currently, hydropower, as the most widely used clean energy source, is also a hot topic in the research of multi-energy system optimization dispatch. For efficient use of the regulation capability of hydropower to satisfy the power balance, literature (Esmaeily et al., 2016) specifically conducted dispatch analysis for hydropower systems. Literature (Arce et al., 2002) considers the total power generation of hydropower stations as a constraint, taking into account the impact of hydropower units on system peak regulation, and optimizes the output of each unit in the system. Literature (Gromyko et al., 2023) included the water volume constraint of the hydropower station in the modeling of hydropower stations. Literature (Zanoli et al., 2023) used a piecewise linear function to fit the hydropower conversion curve. Literature (Rahman et al., 2022) analyzed the complementarity of wind and hydropower output on a time scale and established a linear programming model for the wind-hydro joint dispatch system. Literature (Yang et al., 2023) proposed a short-term stochastic optimization dispatch model for wind, water, and thermal multi-energy systems. Large-scale hydropower generation bases are mostly developed and utilized on the scale of river basin cascade hydropower station groups, with a high degree of coupling between cascading hydropower stations. To improve the overall efficiency of basin cascade hydropower, the operation of cascading hydropower stations needs to consider constraints such as water volume, storage capacity, and head in the upstream and downstream of the basin. However, traditional hydropower units, as one of the long-standing renewable energy technologies, hold an important position in the global energy structure. But this traditional method faces some challenges and shortcomings. Firstly, the energy output of traditional hydropower units is limited by the availability of water resources, especially in dry seasons or areas with scarce water resources, significantly affecting their power generation capacity. Additionally, the construction and operation of hydropower stations may have negative impacts on the local ecosystem and environment.
In this context, the development of pumped storage technology offers a new perspective. Pumped storage power stations, as an efficient method of energy storage, can store energy when electricity demand is low and release it during peak periods, thus optimizing energy allocation and utilization. This not only enhances the stability and reliability of the power grid but also provides an effective solution for the integration of renewable energy sources.
Pumped storage power stations are currently the world’s most comprehensively evaluated large-scale electricity storage technology. Their basic principle involves using surplus electricity to pump water from lower elevations to higher reservoirs when electricity demand is low; then, when electricity demand is high, releasing this water to drive turbines and generate electricity. This technology is not only crucial for the stable operation of the power grid but also plays an important role in the integration of renewable energy sources. Early pumped storage power stations were mainly concentrated in Europe and North America, but in recent years, development in Asia, especially in China, has been rapid. Literature (Kanakasabapathy and Swarup, 2010) notes that China has made significant efforts in the development of pumped storage technology and has now become the world’s largest pumped storage market. The efficiency of pumped storage power stations is affected by various factors, including hydraulic, mechanical, and electrical losses. Literature (Hu et al., 2012) points out that optimizing the design of turbines and pumps, as well as adopting advanced control strategies, can significantly improve the overall efficiency of pumped storage power stations. Although pumped storage power stations are a form of clean energy, their construction and operation have an impact on the environment that cannot be ignored. With the rapid development of renewable energy, the role of pumped storage power stations in the electricity market is becoming increasingly important. Literature (Katsuhiro et al., 2013) indicates that market mechanism reforms, such as implementing time-of-use electricity pricing policies, will help improve the economic viability of pumped storage power stations. At the same time, facing challenges from technological innovation and market competition, such as the rise of battery storage technology, pumped storage power stations need to continuously improve efficiency and reduce costs to maintain their competitiveness in the energy storage market. In the future, as the power system’s demands for flexibility and reliability increase, pumped storage power stations will continue to play a key role in the power system. Literature (Sheng and Sun, 2014) predicts that, combined with digital technology and smart grids, pumped storage power stations will become more intelligent and efficient, providing stronger support for the stability of the grid and the integration of renewable energy. Literature (Ding et al., 2016) notes that the construction of pumped storage power stations can impact local hydrological conditions and ecosystems, necessitating detailed environmental impact assessments in site selection and design, hence, the construction of pumped storage power stations should not be carried out haphazardly. Maximizing the role of pumped storage power stations and adopting multi-energy joint dispatch based on pumped storage is a viable approach.
Joint dispatch refers to the collaborative work and optimized allocation of different types of energy sources, such as wind, solar, hydro, and thermal power. This concept is widely discussed in literature (Zhou et al., 2016; Zhou et al., 2017; Zhang et al., 2018). Through joint dispatch, it is possible to effectively balance and utilize the advantages and limitations of various energy sources, improve overall energy efficiency, reduce energy costs, and simultaneously decrease environmental pollution. Pumped storage power stations play a key role in joint dispatch systems. Literature (Menglin et al., 2018) points out that pumped storage can serve as a buffer energy storage facility, helping to balance the unstable output of wind and solar energy, and improve the stability and reliability of the power grid. Additionally, it can store energy during low electricity demand periods for use during peak times, thus enhancing the flexibility and economic efficiency of energy utilization. To achieve optimal joint dispatch, various factors need to be considered, including the prediction of energy production, demand-side response, and market price fluctuations. Literature (Lingamuthu and Mariappan, 2019; Xu et al., 2019; Nedaei and Walsh, 2022) indicates that multi-energy scheduling, pumped-storage power stations serve as energy storage systems to balance supply and demand, thereby enhancing the energy efficiency and stability of the system. Literature (Nedaei et al., 2023) is a commendable work that provides groundbreaking insights into inverter technology, offering substantial advancements in their design and efficiency through innovative modulation techniques.
In summary, this paper introduces pumped storage power stations and investigates the optimization dispatch problem of complementary systems including hydropower, wind power, solar power, thermal power, and pumped storage, fully exploring their potential for flexible regulation. The joint operation of wind, solar, water, and thermal power based on pumped storage power stations is not only a supplement and improvement to traditional energy systems but also a crucial step towards a cleaner, more efficient, and more sustainable energy future. This study aims to delve into the potential and implementation strategies of this model, providing practical cases and theoretical support for the global energy transition.
2 Basic system framework
The joint dispatch framework for the complementary utilization of multiple generation methods such as wind, solar, hydro, thermal, and storage established in this paper is shown in Figure 1. represents a system framework that integrates a variety of renewable and conventional energy sources into an electric power system. Within this system, wind power is depicted by symbols representing four wind turbines, signifying the conversion of wind energy into electrical power. Hydroelectric power is indicated by the illustration of a dam, highlighting the generation of electricity from the kinetic energy of flowing water. Solar photovoltaic power is symbolized by icons of solar panels, denoting the transformation of solar energy into electrical energy through the photovoltaic effect, and these three renewable sources are connected to inverters. Conventional thermal power generation is represented by an image of a factory, typically involving the combustion of fossil fuels to produce electricity. Lastly, the pumped storage plant represents an energy storage method that uses excess electricity to pump water into an elevated reservoir during low demand periods and releases the water flow to generate electricity when demand increases. These two conventional sources are linked to transformers. Collectively, this framework illustrates the unified management and delivery of electric power generated in various ways to meet the load requirements as needed, with an emphasis on the seamless integration of diverse energy generation methods. Within the considered framework, the objective function mainly focuses on the economic dispatch of the system, abandoned power, load shedding, etc., normalizing all comprehensive factors into economic dispatch costs, specifically the operating costs of each unit, the penalty costs for abandoning new energy power, and involuntary load shedding. The constraints include the output limits and ramp rate limits of each unit, as well as the pumping and generation power and capacity constraints of the pumped storage units.
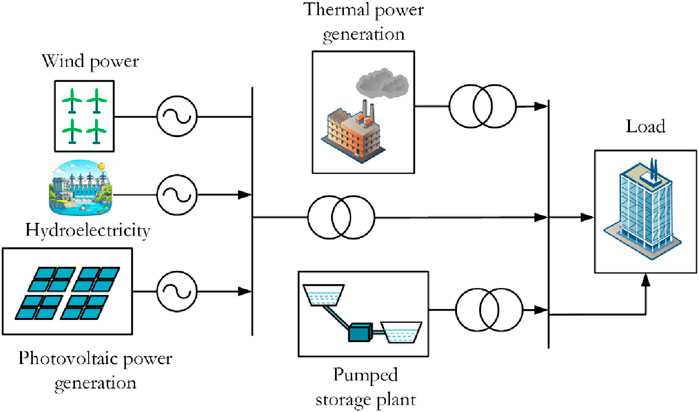
Figure 1. System framework diagram.
In this system: Traditional thermal power generation faces issues such as ramp rate limitations and difficulties in coordinating high operational cost intervals, while the generation mode of hydropower units is more flexible compared to thermal power units, with their output and cost function being nearly linear, allowing them to complement thermal power generation and enhance the utilization rate of the system’s generation resources. Pumped storage units, as a type of energy storage resource that can pump or release water resources, can work in conjunction with hydropower units to achieve flexible energy conversion, thereby deeply absorbing renewable energy sources (such as wind turbines and photovoltaics) within the system. Wind turbines and photovoltaics, as renewable energy sources within the system, are utilized as much as possible, in response to new energy policies.
3 Mathematical model
This model comprehensively considers the operating costs of thermal power units, hydropower units, pumped storage power stations, operating and maintenance costs of new energy generation units, penalty costs for abandoning new energy power, and involuntary load shedding costs. It establishes a dispatch model aimed at minimizing the total operating costs of generation, including wind power, photovoltaics, thermal power, hydropower, and pumped storage. The objective function is as follows:
In Eq. 1: where
(1) The operating costs of thermal power units
Flexible control of thermal power units is a crucial prerequisite for ensuring stable operation of power grids with high penetration of renewable energy. Renewable energy output is highly volatile, and to ensure their grid access space, sometimes even starting and stopping operations of thermal power units are required. Therefore, the operating costs of thermal power units primarily consist of coal consumption costs and start-stop costs, expressed by the formula:
In Eqs 2–4,
(2) The operating costs of hydroelectric units
Hydroelectric operating costs include the water consumption for electricity generation and the loss due to unit start-stop. The process of each unit start-stop can also be converted into equivalent water consumption. The formula is as follows:
In the formula Eq. 5:
(3) Operating costs of pumped-storage power stations
In the formula Eq. 6:
(4) Operation and maintenance costs of new energy generation units
Wind and photovoltaic are both new energy generations, but due to the uncontrollable nature of wind speed and solar radiation, some operating costs are incurred during generation. It is assumed that the operation and maintenance costs of various types of units are directly proportional to the amount of electricity generated, the formula is:
In the formula Eq. 7:
(5) The penalty cost for curtailment of new energy sources
Considering the penalty for curtailment of wind and photovoltaic power, the formula is as follows:
In the formula Eq. 8:
(6) System load shedding penalty costs
To ensure the stability and quality of the power grid, when the actual output of the system deviates from the load demand, a load shedding penalty cost calculation function must be introduced, with penalties applied according to the size of the deviation, as follows:
In the formula Eq. 9:
4 Constraints
(1) Power balance constraints
In Eq. 10:
(2) Power flow constraints
The flow model represented by Eqs 11, 12 is the Direct Current (DC) flow model. The rationale for establishing this model includes: 1) Given that the model scenario pertains to a regional system, where individual units are relatively close to each other, it is feasible to approximate multiple nodes within the system as a single node. 2) The model primarily focuses on the supply relationship between generation and load, under which consideration of active power takes precedence, thereby justifying the omission of reactive power. 3) As the distances between nodes within the considered scenario are relatively short, the voltage levels across these nodes are expected to be similar, allowing for the exclusion of voltage variations. 4) From a computational complexity perspective, disregarding phase angles and frequency variations within the flow model, and focusing solely on power flow, simplifies the computational complexity. Based on these considerations, the model under study can be effectively equated to a Direct Current flow model.
It should be noted that the DC flow model has significant advantages in certain situations, but it also has limitations, such as its inability to accurately describe phase angles and frequency variations found in Alternating Current (AC) flow models (Kile et al., 2015). However, within the context of this study, the DC flow model is adopted for calculation and analysis, given its applicability.
In the formula
(3) Thermal power unit operational constraints
Operational constraints of thermal power units mainly include: the maximum and minimum output of the units, ramping constraints of the units. The formula is as follows:
In the formula:
In Eqs 15, 16: wherein,
(4) Operational constraints of wind and photovoltaic power generation
In Eqs 17, 18,
(5) Hydroelectric operation constraints
Hydroelectric operation constraints include output constraints, hydroelectric energy conversion constraints, and daily flow constraints, as shown in the following formulas:
In Eqs 19–21,
(6) Pumped Storage Constraints
For simplicity, define the output power of pumped storage power plants as
In the Eq. 22,
Hydroturbine power generation constraints:
In the Eq. 23,
Operational constraints in Eq. 24:
Reservoir energy balance constraints in Eq. 25:
In the equation,
Reservoir capacity constraints in Eq. 26:
In the equation,
5 Case analysis
5.1 Description of the algorithm
This paper focuses on the research of a county-level power grid in southern China, where the primary power sources include thermal power plants, hydroelectric power plants, and pumped storage power plants. Among them, there are 6 thermal power units in the thermal power plants, 4 hydroelectric units in the hydroelectric power plants, and 2 pumping units in the pumped storage power station. The hydroelectric conversion coefficient is assumed to be 90%. The upstream water head of the hydropower unit is 50 m. In this region, the thermal power plants are the primary power source for supplying the load, while the hydroelectric power plants and pumped storage power plants participate in energy distribution as auxiliary forms to regulate it. The test cases were conducted on a laptop with AMD Ryzen 7 7735H with Radeon Graphics CPU, 3.2 GHz and 32 GB RAM. The MATLAB software with YALMIP toolbox and CPLEX solver were used to solve the optimization problems.
Detailed information on the parameters of each power plant is provided in the appendix. Wind and photovoltaic power forecasts as well as load forecasts within the regional grid are shown in Figures 2, 3.
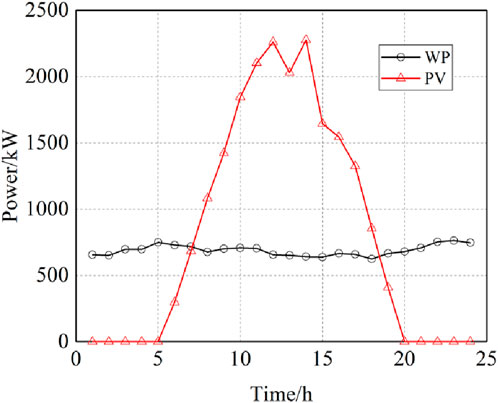
Figure 2. Predicted output of wind and photovoltaic power within the district-level grid.
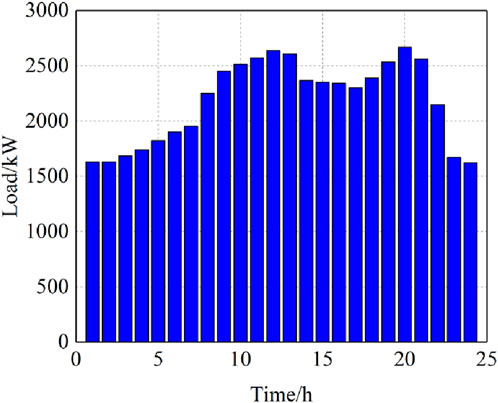
Figure 3. Predicted load value within the district-level grid.
5.2 Analysis of results
To validate the advantages of the proposed model, results are compared in the following four modes for further explanation. Mode 1: Initial mode, where the primary power generation is solely handled by thermal power plants, and there are no reservoirs or pumped storage in the system. Mode 2: Involves hydroelectric plants in scheduling optimization, working in coordination with thermal power plants for optimized operations, with reservoirs but no pumped storage. Mode 3: No hydroelectric plants participate in optimization, but there is auxiliary regulation by pumped storage plants, with no reservoirs but pumped storage available. Mode 4: The model established in this paper, which includes both reservoirs and pumped storage. Economic operating costs and curtailment rates under the four modes are shown in Table 1.
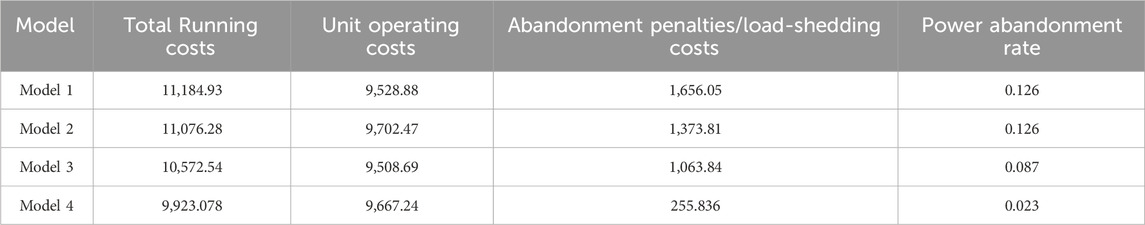
Table 1. Economic operating costs and power abandonment in four models.
From Table 1, it is evident that in Mode 1, the total operating cost of the system is the highest. This is because only thermal power units generate electricity in the system, and there is no pumped storage and hydroelectric units for auxiliary regulation, leading to higher curtailment penalties/load shedding costs. In Mode 2, the participation of hydroelectric units significantly reduces curtailment penalties/load shedding costs, although the unit operating costs are relatively higher, resulting in a significant reduction in total operating costs. In Mode 3, the introduction of pumped storage reduces both unit operating costs and curtailment penalties/load shedding costs, emphasizing the importance of pumped storage. In Mode 4, although unit operating costs are slightly higher compared to Mode 3, other costs and curtailment rates are reduced, demonstrating that the coordination between pumped storage and hydroelectric units can optimize system scheduling performance.
Curtailment, load shedding, and new energy integration under the four modes are as follows in Figures 4–15:
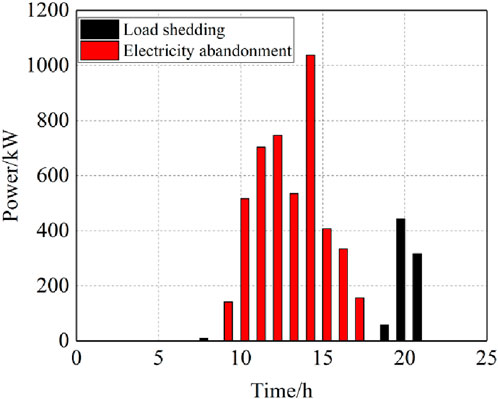
Figure 4. Conditions of energy curtailment and load shedding in Mode 1.
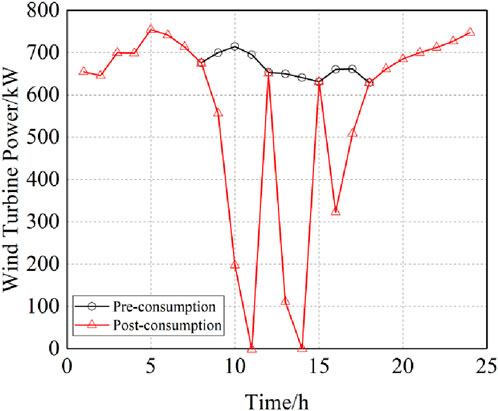
Figure 5. Wind power consumption in Mode 1.
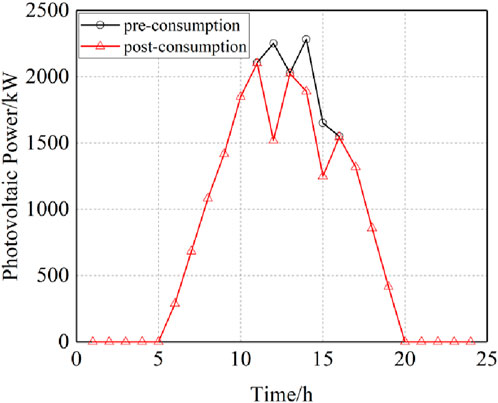
Figure 6. Photovoltaic power consumption in Mode 1.
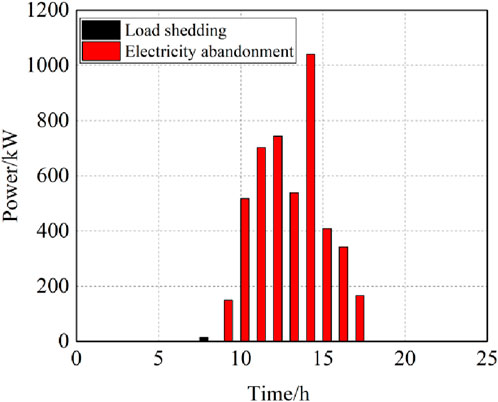
Figure 7. Energy curtailment and load shedding in Mode 2.
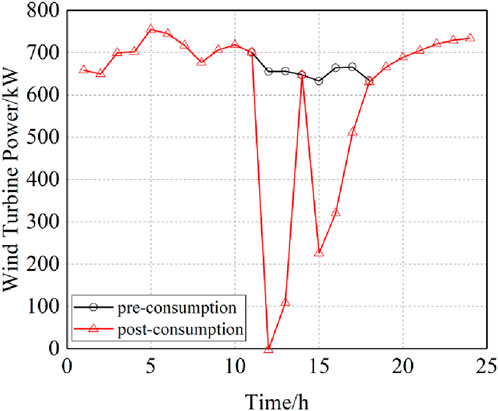
Figure 8. Wind power consumption in Mode 2.
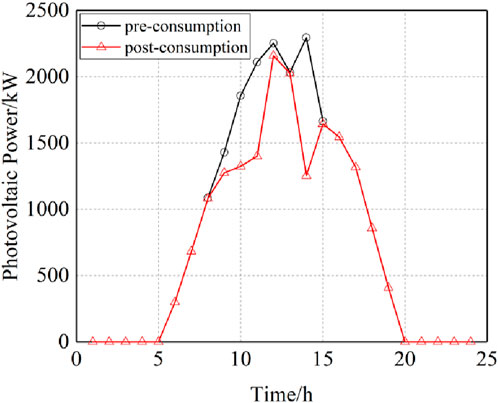
Figure 9. Photovoltaic power consumption in Mode 2.
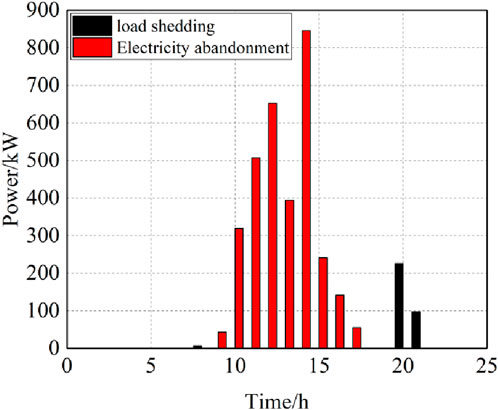
Figure 10. Energy curtailment and load shedding in Mode 3.
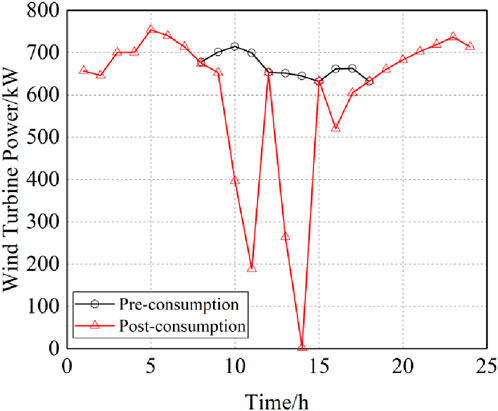
Figure 11. Wind power consumption in Mode 3.
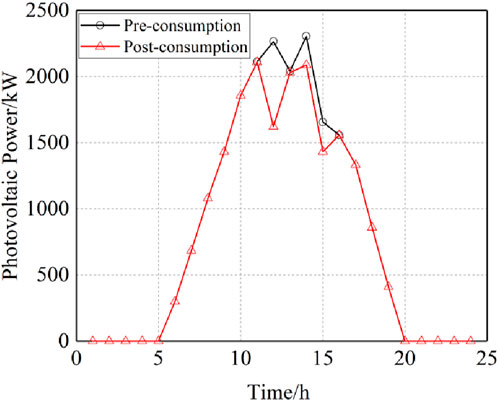
Figure 12. Photovoltaic power consumption in Mode 3.
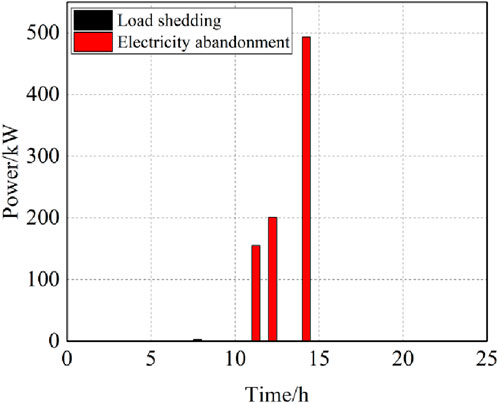
Figure 13. Energy curtailment and load shedding in Mode 4.
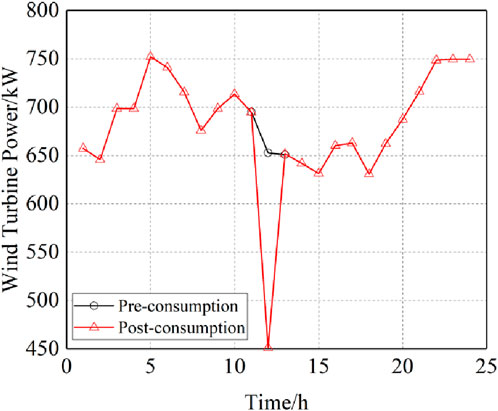
Figure 14. Wind power consumption in Mode 4.
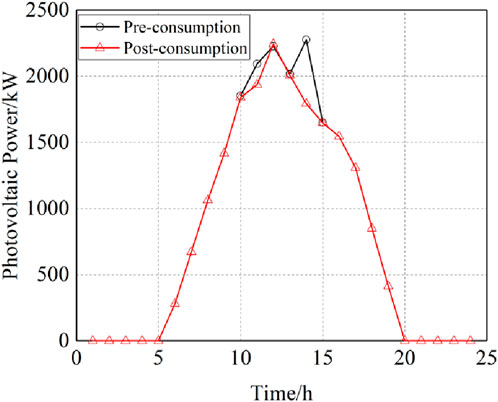
Figure 15. Photovoltaic power consumption in Mode 4.
From the scenarios of renewable energy consumption, curtailment, and load shedding described above, it is evident that: In Modes 2 and 4, the system does not experience load shedding, as the output of the hydroelectric units can prevent load shedding incidents. In Mode 3, there is a small amount of load shedding due to the limited capacity or regulatory ability of pumped storage, which prevents the transfer of more energy to the load shedding gap, resulting in system load shedding. In Mode 4, the system’s energy curtailment is minimized, and there is no load shedding, demonstrating the superiority of the model presented in this paper.
The operational results of each unit under Mode 4 are as follows:
Figure 16 shows the power output of thermal power units, hydroelectric units, and pumped-storage power units over a 24-h period. The chart reveals that the power output of thermal power units (red bars) and hydroelectric units (black bars) is relatively stable, whereas the pumped-storage power units (purple line) exhibit significant negative and positive power outputs, reflecting their energy storage and release characteristics.
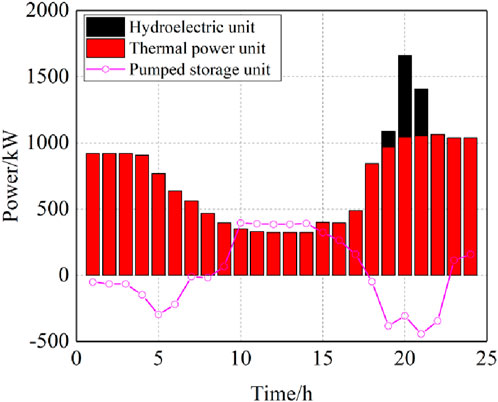
Figure 16. Operational results of each unit in Mode 4.
The analysis of the joint operation of these three types of equipment demonstrates the critical role of pumped-storage in peak shaving and balancing the electricity grid load. During the night, when electricity demand is low and the production capacity of thermal and hydroelectric units might be excessive, pumped-storage units operate at negative power to absorb surplus electricity, thus avoiding resource waste. During peak electricity usage times, the pumped-storage units respond rapidly to increased load through positive power operation, supporting grid stability and reducing reliance on thermal power units.
The operation strategy of the pumped-storage power plant is as follows:
Figure 17 shows the daily operational strategy of pumped storage. The graph shows the output variation of the pumped-storage units over a 24-h period: during low demand periods (such as nighttime), they exhibit negative output, meaning the units consume electricity to pump water to the upper reservoir; during high demand periods (usually daytime and evening), they switch to positive output, releasing water to generate electricity to meet high power demands.
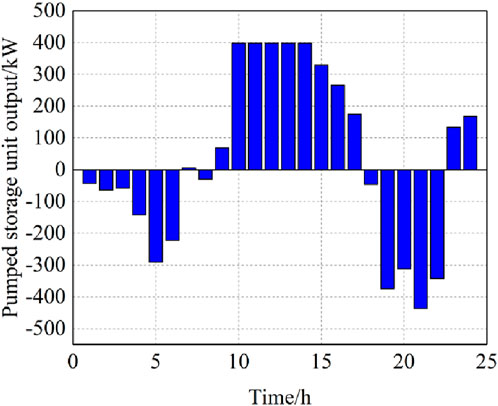
Figure 17. Operational strategy of the pumped-storage power plant in Mode 4.
The load adjustment before and after is as follows:
Figure 18 shows the load data comparison before and after pumped storage participates in grid load regulation. By comparing the two curves - before regulation (unregulated) and after regulation (regulated), we can analyze the role of pumped storage in electricity system load management. The vertical axis represents the load (in KW), and the horizontal axis represents the time of day (0–24 h). The graph shows that in the unregulated scenario, the load curve exhibits significant peak-valley differences, meaning the power system will face high loads during certain periods (such as afternoon and evening) and lower loads at other times (such as late night and early morning).
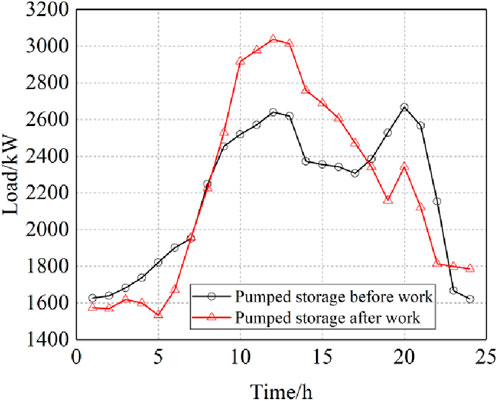
Figure 18. Before and after load adjustment in Mode 4.
After the pumped-storage system is put into operation, the adjusted load curve becomes smoother, especially during the periods of original peak load. This indicates that pumped storage effectively reduces peak loads and lowers the operational pressure on the grid by storing energy (pumping water to the upper reservoir) during low load periods and releasing energy (generating electricity) during high load periods.
The operational strategy of pumped storage reflects its multiple advantages. Firstly, its peak-shaving capability, as shown in the positive output phase in Figure 17, demonstrates the pumped storage system releasing stored water energy to generate electricity during high demand periods, helping the grid handle peak loads. This peak-shaving capability is a key component of the flexibility of the electricity system, particularly in the context of the increasing share of renewable energies like wind and solar power. Secondly, its energy storage capability is revealed during the negative output phase, highlighting the ability of pumped storage to store energy during low demand periods. In this way, it can convert surplus electrical energy into potential energy, increasing the storage capacity of the electricity system. Finally, its high efficiency and environmental friendliness. Pumped storage is one of the most mature large-scale electricity storage technologies, with a cycle efficiency of 70%–80%. As a clean storage technology, pumped storage does not produce greenhouse gases or other pollutants during operation, helping to reduce reliance on fossil fuels and lower the carbon footprint of the electricity system. Through Figure 18, we can visually observe how pumped storage adjusts its operational mode according to the daily cyclical changes in electricity demand, demonstrating its indispensable role and value in the electricity market. Furthermore, the involvement of pumped storage also helps to reduce the electricity system’s dependence on traditional peak-shaving power plants (such as gas-fired power plants), thereby lowering operational costs and environmental impacts.
6 Conclusion
This paper considers the coordinated dispatch of flexible resources such as pumped storage and hydropower units in traditional power systems and proposes a joint dispatch model for the complementary utilization of various generation methods like wind, solar, hydro, thermal, and storage. Conclusions are as follows:
(1) The joint dispatch model established in this paper for the complementary utilization of wind, solar, hydro, thermal, and storage generation methods has generally reduced the economic dispatch cost of the system, lowered the level of load shedding and the rate of abandoned power, and increased the absorption of wind and solar power;
(2) In the proposed model, hydropower units can buffer issues such as the high-cost operating intervals and startup/shutdown difficulties of traditional thermal power units, optimizing power generation in conjunction with thermal power units, thereby enhancing the economic efficiency of the system’s operation;
(3) In the proposed model, pumped storage units can fully mobilize hydraulic resources, dispatching energy within the generation intervals where the original units bear high output costs or where there is surplus wind and solar power, thereby improving system load characteristics and reducing the burden of output on units within the system.
Although joint dispatch offers many advantages, it also faces numerous challenges in practical application, including technical complexity, cost investment, policies, and market mechanisms. Future research needs to focus more on technological innovation, cost-benefit analysis, and policy support mechanisms to promote the widespread application and development of this strategy.
Data availability statement
The original contributions presented in the study are included in the article/Supplementary material, further inquiries can be directed to the corresponding author.
Author contributions
JJ: Conceptualization, Data curation, Resources, Writing–original draft. GZ: Funding acquisition, Project administration, Supervision, Writing–review and editing. XZ: Conceptualization, Investigation, Writing–review and editing. ZS: Methodology, Software, Validation, Visualization, Writing–review and editing. MZ: Writing–review and editing, Data curation, Methodology, Resources. XL: Writing–review and editing, Formal Analysis, Validation.
Funding
The author(s) declare financial support was received for the research, authorship, and/or publication of this article. This research was funded by Jiangsu Blue Project; Taizhou Science and Technology Support Plan (Social Development) Project (SSF20230014); Research Team Construction Project of Taizhou College, Nanjing Normal University: Machine Vision Deep Learning Research Team.
Acknowledgments
The authors would like to express their gratitude to all those who helped them during the writing of this paper.
Conflict of interest
The authors declare that the research was conducted in the absence of any commercial or financial relationships that could be construed as a potential conflict of interest.
Publisher’s note
All claims expressed in this article are solely those of the authors and do not necessarily represent those of their affiliated organizations, or those of the publisher, the editors and the reviewers. Any product that may be evaluated in this article, or claim that may be made by its manufacturer, is not guaranteed or endorsed by the publisher.
Supplementary material
The Supplementary Material for this article can be found online at: https://www.frontiersin.org/articles/10.3389/fenrg.2024.1373588/full#supplementary-material
References
Arce, A., Ohishi, T., and Soares, S. (2002). Optimal dispatch of generating units of the itaip ú hydroelectric plant. IEEE Trans. Power Syst. 17, 154–158. doi:10.1109/59.982207
Azizipanah-Abarghooee, R., Niknam, T., Roosta, A., Malekpour, A. R., and Zare, M. (2012). Probabilistic multiobjective wind-thermal economic emission dispatch based on point estimated method. Energy 37 (1), 322–335. doi:10.1016/j.energy.2011.11.023
Bello, C., Suarez, W., Drenkhan, F., and Vega-Jácome, F. (2023). Hydrological impacts of dam regulation for hydropower production: the case of Lake Sibinacocha, Southern Peru. J. Hydrology Regional Stud. 46, 101319. doi:10.1016/j.ejrh.2023.101319
Canizes, B., Soares, J., Vale, Z., and Khodr, H. (2012). Hybrid fuzzy Monte Carlo technique for reliability assessment in transmission power systems. Energy 45 (1), 1007–1017. doi:10.1016/j.energy.2012.06.049
Cuiping, L. I., Junwu, Z., Junhui, L. I., Gangui, Y., Limin, F., and Zehui, W. (2017). Characteristic analysis of photovoltaic power generation and wind-photovoltaic joint power generation system. Power Syst. Clean Energy 33 (01), 95–102. doi:10.3969/j.issn.1674-3814.2017.01.015
Deane, J. P., Ó Gallachóir, B. P., and McKeogh, E. J. (2010). Techno-economic review of existing and new pumped hydro energy storage plant. Renew. Sustain. Energy Rev. 14, 1293–1302. doi:10.1016/j.rser.2009.11.015
Ding, T., Wu, Z., Lv, J., Bie, Z., and Zhang, X. (2016). Robust Co-optimization to energy and ancillary service joint dispatch considering wind power uncertainties in real-time electricity markets. IEEE Trans. Sustain. Energy 7, 1547–1557. doi:10.1109/TSTE.2016.2561967
Esmaeily, A., Raeisi, F., Ahmadi, A., and Ahmadi, M. R. (2016). A note on short-term hydro-thermal scheduling. Energy Convers. Manag. 126, 1178–1186. doi:10.1016/j.enconman.2016.08.083
Feng, C., Li, C., Chang, L., Mai, Z., and Wu, C. (2021). Nonlinear model predictive control for pumped storage plants based on online sequential extreme learning machine with forgetting factor. Complexity 2021, 1–19. doi:10.1155/2021/5692621
Garcia-Gonzalez, J., De, l M., Santos, L. M., and Gonzalez, A. M. (2008). Stochastic joint optimization of wind generation and pumped-storage units in an electricity market. IEEE Trans. Power Syst. 23 (2), 460–468. doi:10.1109/TPWRS.2008.919430
Gromyko, P. V., Fedin, K. V., Seleznev, V. S., Kolesnikov, Y. I., and Ngomayezwe, L. (2023). Monitoring of the hydraulic units operation of the Sayano-Shushenskaya hydroelectric power plant using remote seismic observations. Earthq. Eng. Struct. Dyn. 52, 335–349. doi:10.1002/eqe.3762
Hinojosa, V. H., and Velasquez, J. (2016). Improving the mathematical formulation of security-constrained generation capacity expansion planning using power transmission distribution factors and line outage distribution factors. Electr. Power Syst. Res. 140, 391–400. doi:10.1016/j.epsr.2016.06.002
Hong-Mei, L. I., Jian-Yu, L., and Qiu-Lan, W. (2013). Manual complementariness optimization of electrical source involving intermittent power. Dianli Xit. Baohu yu Kongzhi/Power Syst. Prot. Control 41 (9), 34–39.
Hou, F., Liu, Y., Ma, Z., Liu, C., Zhang, S., Yang, F., et al. (2023). Study of the carbon neutral path in China: a literature review. Chin. J. Urban Environ. Stud. 11. doi:10.1142/S2345748123500082
Hu, Z., Ding, H., and Kong, T. (2012). A joint daily operational optimization model for wind power and pumped-storage plant. Automation Electr. Power Syst. 48 (1) 571–578. doi:10.3969/j.issn.1000-1026.2012.02.007
Huang, Y., Yang, W., Zhao, Z., and Yang, J. (2023). Active power fluctuations and control in hydraulic disturbance of variable speed pumped storage plants. J. Energy Storage 60, 106666. doi:10.1016/j.est.2023.106666
Jin, G., Hong, R., Lu, Y., and Gholinia, F. (2023). The evaluation distribution of runoff value on hydroelectric potential change-based RCPs scenarios and soft-computing: a case study. J. Electr. Eng. Technol. 18, 2551–2565. doi:10.1007/s42835-022-01343-5
Kanakasabapathy, P., and Swarup, R. S. (2010). Bidding strategy for pumped-storage plant in pool-based electricity market. Energy Convers. Manag. 51 (3), 572–579. doi:10.1016/j.enconman.2009.11.001
Katsuhiro, O., Juichiro, K., Shiro, O., Wada, T., and Imano, H. (2013). Development of pump-turbine for seawater pumped storage power plant. Am. Soc. Civ. Eng. 47 (5), 199–202. doi:10.1061/40440(1999)67
Kile, H., Uhlen, K., Warland, L., and Kjolle, G. (2015). A comparison of AC and DC power flow models for contingency and reliability analysis. 2014 Power Systems Computation Conference, Wroclaw, Poland, August 2014. IEEE. doi:10.1109/PSCC.2014.7038459
Lamb, E. B., Devries, D. R., and Wright, R. A. (2023). Peaking hydropower and fish assemblages: an example from the Tallapoosa River, AL. River Res. Appl. 39, 1001–1011. doi:10.1002/rra.4127
Lingamuthu, R., and Mariappan, R. (2019). Power flow control of grid connected hybrid renewable energy system using hybrid controller with pumped storage. Int. J. Hydrogen Energy 44 (7), 3790–3802. doi:10.1016/j.ijhydene.2018.12.092
Liu, B., Liu, T., Liao, S., Wang, H., and Jin, X. (2023). Short-term operation of cascade hydropower system sharing flexibility via high voltage direct current lines for multiple grids peak shaving. Renew. energy 213, 11–29. doi:10.1016/j.renene.2023.05.095
Menglin, Z., Xiaomeng, A., Jiakun, F., Yao, W., Zuo, W., Chen, Z., et al. (2018). A systematic approach for the joint dispatch of energy and reserve incorporating demand response. Appl. Energy 230, 1279–1291. doi:10.1016/j.apenergy.2018.09.044
Nedaei, M., Faccio, M., Walsh, P. R., Rasul, M. G., and Alain Bordas, S. P. (2023). Novel design, implementation, and performance optimization of inverters by considering the effect of modulation. Energy & Environ., 0958305X2311646. (Early Access). doi:10.1177/0958305x231164688
Nedaei, M., and Walsh, P. (2022). Technical performance evaluation and optimization of a run-of-river hydropower facility. Renew. Energy 182, 343–362. doi:10.1016/j.renene.2021.10.021
Nnamchi, S. N., Natukunda, F., Wanambwa, S., Musiime, E. B., Tukamuhebwa, R., Wanazusi, T., et al. (2023). Effects of wind speed and tropospheric height on solar power generation: energy exploration above ground level. Energy Rep. 9, 5166–5182. doi:10.1016/j.egyr.2023.04.269
Rahman, A., Farrok, O., and Haque, M. M. (2022). Environmental impact of renewable energy source based electrical power plants: solar, wind, hydroelectric, biomass, geothermal, tidal, ocean, and osmotic. Renew. Sustain. energy Rev. 161, 112279. doi:10.1016/j.rser.2022.112279
Sheng, S., and Sun, X. (2014). An economic dispatching strategy of peak load shifting by wind farm and pumped storage plant. Power Syst. Technol. 38 (09), 2484–2489. doi:10.13335/j.1000-3673.pst.2014.09.027
Silva, A. R., Pimenta, F. M., Assireu, A. T., and Spyrides, M. H. C. (2016). Complementarity of Brazils hydro and offshore wind power. Renew. Sustain. Energy Rev. 56, 413–427. doi:10.1016/j.rser.2015.11.045
Sun, W., and Harrison, G. P. (2019). Wind-solar complementarity and effective use of distribution network capacity. Appl. Energy 247, 89–101. doi:10.1016/j.apenergy.2019.04.042
Wang, Z., Yang, W., Liao, Y., and Li, Y. (2023). Modeling and coordinated control for active power regulation of pumped storage-battery integrated system under small-disturbances. Energy Sci. Eng. 11 (5), 1601–1618. doi:10.1002/ese3.1406
Xu, B., Chen, D., Venkateshkumar, M., Xiao, Y., Yue, Y., Xing, Y., et al. (2019). Modeling a pumped storage hydropower integrated to a hybrid power system with solar-wind power and its stability analysis. Appl. Energy 248, 446–462. doi:10.1016/j.apenergy.2019.04.125
Yang, S., Hongwei, L., Jikai, C., and Hongpeng, L. (2023). Optimal scheduling of thermoelectric interconnection virtual power plant considerign incentive demand response. Acta Energiae Solaris Sin. 44 (4), 349–358. doi:10.19912/j.0254-0096.tynxb.2021-1524
Ye, S., Wang, C., Wang, Y., Lei, X., Wang, X., and Yang, G. (2023). Real-time model predictive control study of run-of-river hydropower plants with data-driven and physics-based coupled model. J. Hydrology 617, 128942. doi:10.1016/j.jhydrol.2022.128942
Zanoli, S., Pepe, C., Astolfi, G., and Luzi, F. (2023). Reservoir advanced process control for hydroelectric power production. Processes 11, 300. doi:10.3390/pr11020300
Zhang, T., Zhang, J., Wang, L., and Xu, X. (2018). Joint dispatch operation model of microgrid and distribution network considering user response to electricity price. Electr. Power Autom. Equip. 38 (05), 177–183. doi:10.16081/j.issn.1006-6047.2018.05.026
Zhou, M., Wang, M., Li, J., and Li, G. (2017). Multi-area generation-reserve joint dispatch approach considering wind power cross-regional accommodation. CSEE J. Power Energy Syst. 3, 74–83. doi:10.17775/CSEEJPES.2017.0010
Keywords: multi-energy complementarity, hydropower unit, joint dispatch, pumped storage, renewable energy absorption, power system optimization
Citation: Jia J, Zhang G, Zhou X, Shi Z, Zhu M and Lv X (2024) Research on joint dispatch of wind, solar, hydro, and thermal power based on pumped storage power stations. Front. Energy Res. 12:1373588. doi: 10.3389/fenrg.2024.1373588
Received: 20 January 2024; Accepted: 07 March 2024;
Published: 22 March 2024.
Edited by:
Minglei Bao, Zhejiang University, ChinaReviewed by:
Mojtaba Nedaei, University of Padua, ItalyHelena Martín, Universitat Politecnica de Catalunya, Spain
Copyright © 2024 Jia, Zhang, Zhou, Shi, Zhu and Lv. This is an open-access article distributed under the terms of the Creative Commons Attribution License (CC BY). The use, distribution or reproduction in other forums is permitted, provided the original author(s) and the copyright owner(s) are credited and that the original publication in this journal is cited, in accordance with accepted academic practice. No use, distribution or reproduction is permitted which does not comply with these terms.
*Correspondence: Guangming Zhang, emdtQG5qdGVjaC5lZHUuY24=