 Mohammed Alqahtani
95% of researchers rate our articles as excellent or good
Learn more about the work of our research integrity team to safeguard the quality of each article we publish.
Find out more
ORIGINAL RESEARCH article
Front. Energy Res. , 05 April 2024
Sec. Wind Energy
Volume 12 - 2024 | https://doi.org/10.3389/fenrg.2024.1373586
This article is part of the Research Topic Co-operative Progress in Distributed Wind and Hydrokinetic Energy Systems View all 4 articles
The constant need for fuel to meet the commercial sector’s ever-increasing demand has driven researchers to discover and optimize renewable energy resources, paving the way for sustainable production of reliable and clean energy resources. The goal of the current work is to close the gap in process parameter optimization needed to convert wind energy wake from traffic on highways into electrical energy utilizing vertical-axis wind turbines (VAWTs). The energy output from the VAWT is analyzed to investigate how it is impacted by the variations in multiple parameter settings. Using the central composite design (CCD), a three-level four-factor array was used to investigate the following parameters: VAWT vertical distance (VD) and horizontal distance (HD) as continuous parameters, while road side (S) and location (L) of VAWT as categorical parameters. To find the most important parameter, response surface methodology (RSM) optimization and an analysis of variance (ANOVA) test are performed. L accounts for 66.67% of the total variable, with S coming in second with 51.80%. Using the best results from RSM and ANOVA, a confirmation test is run, and the results show yields of 88.75% ± 0.05% and 87.5% ± 0.05%, respectively. Therefore, RSM and ANOVA can be utilized equally for optimization at the same VAWT design. Lastly, the findings of the economic and environmental evaluation demonstrate that, in comparison to the basic settings, VAWT operating at optimal settings can save up to 180% and 200% more energy and reduce carbon emissions, respectively.
There has been a recent global spike in the consumption of all forms of energy due to factors such as urbanization, population growth, and rising living standards. The majority of the heat and electricity generated from fossil fuel resources in 2013 was produced as byproducts, which comprised roughly 42% of global emissions. Over-reliance on fossil fuel resources leads to serious environmental problems like acid rain, global warming, and desertification in addition to unstable fuel prices. With 23% of all CO2 emissions worldwide, the transportation sector was the second largest source of greenhouse gas emissions (Xiao et al., 2019; International Energy Agency IEA, 2024). Consequently, it is essential that research and development efforts concentrate on renewable energy sources that are not harmful to the environment. In 2014, the global wind power capacity reached 369,553 MW. At least 84 countries use wind power as part of their energy portfolio to meet their energy needs at the moment (Half-year Report WWEA, 2014; Global Wind Statistics, 2024), contributing to 4% of the world’s total electric power consumption.
There are many studies focused on improving different energy resources to make the power supply to consumers more reliable, sustainable, and safe. For instance, Li et al. (2024) proposed a particle swarm optimization (PSO) technique to accurately identify the parameters of the circuit model under dynamic stress test (DST) conditions. A three-dimensional multi-phase model of PEMFC is created by Chen et al. (2024) to investigate the effects of the cathode channel structure on PEMFC performance. It is suggested that the tube outlet improves heat transfer from the burned gas to the combustor wall (Zuo et al., 2023a). Zuo et al. (2023b) designed a hydrogen-fueled micro planar combustor with cavity in order to achieve high-energy output power and energy conversion efficiency for a micro-thermophotovoltaic system. A double S-channel cold plate to cool a prismatic LiFePO4 battery was designed by Zuo et al. (2022). A combination of response surface methodology (RSM) and non-dominated sorting genetic algorithm (GA) is used by Zuo et al. (2024) to trade-off the aforementioned performance metrics. RSM and GA are combined to deal with the problem of multi-objective optimization of a multi-channel cold plate in the presence of sporadic pulsing flow as well (Zuo et al., 2023c). In addition, Chen et al.(2023) combined the RSM and GA to maximize the performance of a proton exchange membrane fuel cell. Furthermore, multi-objective optimization using RSM and non-dominated sorting GA is performed on a tiny U-channel cold plate with SiO2 nanofluid to achieve better results (Jing et al., 2022).
The exploitation of the wind generated by the traffic and converting it into a usable form of energy has gathered the attention of researchers in the recent years. The relationship between wind energy and wind speed (WS) is strong, with wind energy being greater at higher elevations and along coasts. However, low-speed wind energy can also be used as a source of energy, particularly for dispersed energy requirements. The vertical-axis wind turbine (VAWT) is one of the wind turbines that are used to harvest the wind energy from vehicles wake on highways. Liew et al. (2020) and Uddin et al. (2022) conducted a review to maximize the electric output by making the best use of the wind energy. To suggest a location for the vertical VAWT on the highway, the possibility of a small wind turbine is explored by Al-Aqel et al. (2016). In Han et al. (2019), a computational fluid dynamics (CFD) investigation with various car models is presented to replicate the energy harvesting system from the highway traffic.
Numerous studies and applications of wind energy exist (Nimje and Gandhi, 2020). There are few studies on VAWTs, and most studies on wind turbines concentrate on large horizontal-axis wind turbines with a kW level or above (Peng et al., 2018). The capture efficiency of Wind Energy Capture Device (WECD) and the relationship between WECD and the vehicle in the multilane operating condition of cars and trucks are still being investigated in Wenyu Hu et al. (2023). The primary large-scale wind tunnel trials on VAWTs carried out over the previous 15 years are reviewed critically in Battisti et al. (2018). In reality, certain unique working conditions must be met when using tiny VAWTs as energy sources (Qi et al., 2020). This type of wind energy can significantly increase VAWT’s wind energy utilization rate because it has benefits that natural wind energy does not. Overcoming wind resistance is the primary fuel energy consumption during high-speed driving (He et al., 2022). The dynamic pitch control strategies in double-VAWT arrangements were first investigated by Xu et al. (2023). Using CFD simulations, the various configurations that have been demonstrated to offer improved performance studied by Barnes and Hughes (2019) were examined in order to determine the most efficient layout based upon both the average VAWT efficiency and efficient use of the area. Li et al. (2023) suggested a novel design for convex-shaped wind concentrator straight-bladed vertical-axis wind turbines or SB-VAWTs. A systematic experimental test campaign was carried out in an anechoic wind tunnel with the aim of improving the understanding of the noise pollution caused by the VAWT in urban areas (Li et al., 2022). Improving the energy utilization efficiency can be indirectly attained if wind energy produced while operating a vehicle is effectively utilized (Wang et al., 2017; Ren et al., 2022). A practical, low-cost method of gathering renewable wind energy using inexpensive materials, VAWT, has been constructed by Kumar Rathore et al. (2021) to deliver energy alongside the highway.
The optimization of the operations of the VAWT on highways, especially from the design stand point, has been the focus of many literature reports. For instance, in Joachim et al. (2021), two-dimensional CFD simulations of an isolated VAWT and co- and counter-rotating pairs of VAWTs were carried out to ascertain turbine layouts. A new VAWT design that dynamically changes its blade shape based on the tip speed ratio (TSR) and azimuthal angle is presented by Baghdadi et al. (2020). Using three-dimensional CFD simulations, Tian et al. (2020) attempted to solve the optimal VAWT type for highway wind energy recovery and the optimal gap between VAWTs if they are planted in an array. The energy harvesting capabilities of wind turbines inside the train tunnel with varying design parameters were investigated by Guo et al. (2020), using a three-dimensional model. Peng et al. (2020) used the Taguchi method to optimize the power performance of twin VAWTs. Pourrajabian et al. (2021) implemented the genetic algorithm in relation to the design and optimization problem for wind turbine blades to achieve the maximize output power. The impact of the blade number (solidity) on the power and thrust coefficients of a small-scale horizontal-axis wind turbine HAWT was examined experimentally and numerically by Eltayesh et al. (2021). Ding et al. (2022) elaborated on the development of methodology in wind load uncertainty modeling and conducted a systematic review of the state-of-the-art technology for wind turbine fatigue reliability. The platform, tower, mooring system, and blade-pitch controller are all optimized (Hegseth et al., 2020) as part of an integrated design using a linearized aero-hydro-servo-elastic floating wind turbine model.
The authors discovered from the aforementioned literature reviews that no research has been conducted on taking into account the combined effects of road sides, vertical and horizontal distances, and other parameters on the VAWT performance. The contribution of this paper can be listed as follows:
• To show how the locations on highways affect the performance of the VAWT and to investigate the combined effects of the four parameters and their three levels on the energy harvested by the VAWT.
• To determine the effect of parameter variation on the VAWT performance by taking into account road sides, vertical and horizontal distances, and their percentage contribution from each parameter.
• To pinpoint the “optimal values” that subsequent researchers can use as a guide when studying traffic wind harvesting with the VAWT. The experiments entail gathering and preparing wind speed data under various parameter settings. For this study, RSM and ANOVA are used in conjunction with a central composite design (CCD) design of experiment. The best values from both approaches were used in a confirmation test that the authors also conducted.
• Finally, the outcomes of the current study are contrasted with those of other investigators.
The rest of this paper is structured as follows: Section 2 summarizes the data collection and methodology. Section 2.2 defines the problem and the experimental procedures. Section 3 contains the findings of the computational trials. Finally, Section 4 examines the findings and potential future studies.
A set of locations on Al-Hizam road around the city of Abha, Saudi Arabia, have been selected for data collection and analysis (Figure 1).
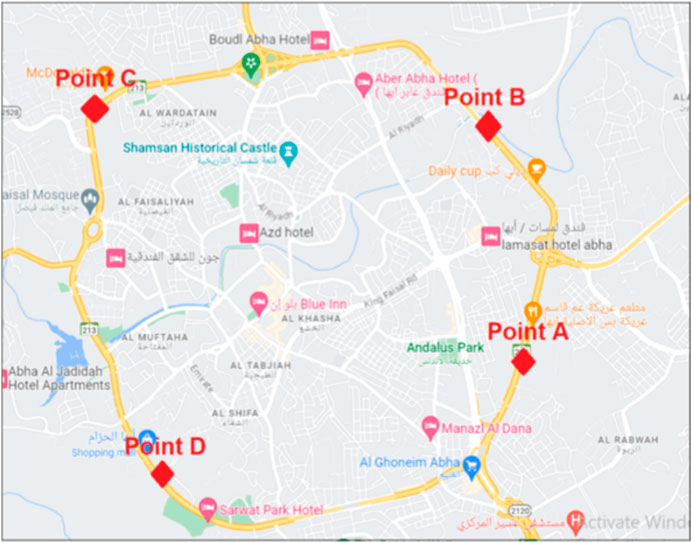
Figure 1. Selected points at the AL-Hizam road, Abha city.
Figure 2 illustrates a box plot of the average WS at different points on Al-Hizam road. The figure shows wide variations in the collected WS data at point D. In contrast, point A demonstrates the lowest variations in WS data. The average WS values at points A, B, C, and D are 2.5, 2.6, 6.5, and 8.5 km/h, respectively.
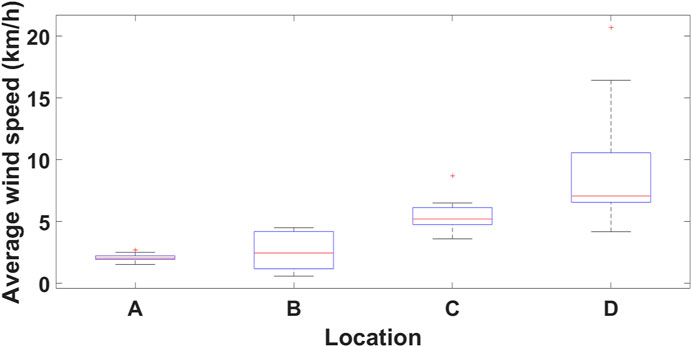
Figure 2. Box plot of the average wind speed at different locations.
The average WS data profiles have been collected using an anemometer (Figure 3). All the data were collected on a time window (16:00-21:00) and different parameter settings at four locations distributed on the Al-Hizam road. To block the effect of seasonality in the data, the data have been gathered on three consecutive days (the month of July 2023).
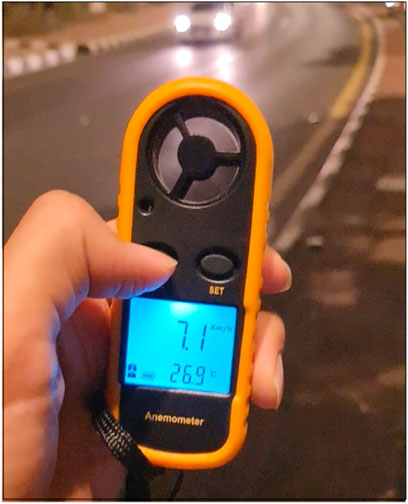
Figure 3. Average WS data collection using the anemometer at point D on Al-Hizam road, Abha city, July 2023.
Table 1 below shows the parameters used in this study along with their selected values. The values of the parameters were selected based on the feasibility and size of the Al-Hizam road in Abha city.
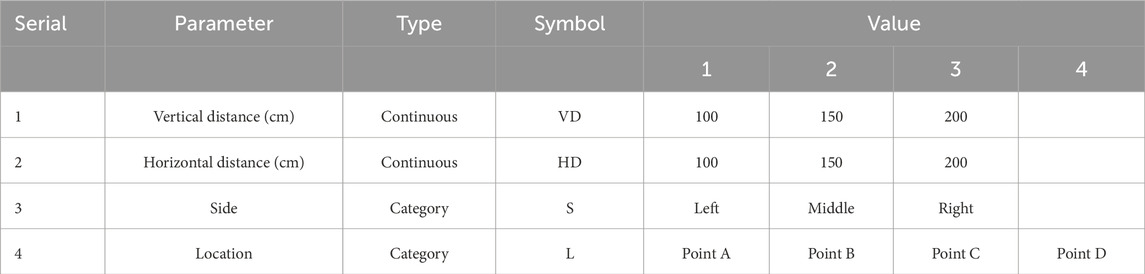
Table 1. Parameters for the experiment.
The first step in the experiment is gathering the WS data from various points along the Al-Hizam road. The independent parameters taken into account for this study are shown in Table 2. After carefully examining the limits for which the experiment will be conducted and reviewing a number of previous research works (Morbiato et al., 2014; Hegseth et al., 2020), the values used in this study have been determined.

Table 2. Maximum and minimum values of the considered parameters.
Utilizing the commercial numerical solver Minitab 19, the CCD design was built. Using the same design of experiments (DOEs) by CCD, response surface methodology (RSM) is introduced with the goal of optimizing the solution. Many researchers have used RSM (Noshadi et al., 2012; Hamze et al., 2015; Costarrosa et al., 2018; Latchubugata et al., 2018) because it offers a more precise and near-term solution to the current issue through higher-order interactions. RSM typically includes a wide range of statistical and mathematical techniques based on appropriate empirical models that are obtained in relation to the experimental design. To ascertain which of all the parameters under study is the most significant, an analysis of variance (ANOVA) test has been performed and compared with RSM’s data. Additionally examined are the conversion rates’ mean and percentage error.
In this study, the wind speed generated by traffic is measured at different locations, heights, sides of the road (both bounds), and horizontal distance. For simplification purposes, the data have been collected at the same time 5 pm at week days. Then, the data have been analyzed using Minitab v19.1 using the RSM package.
To determine the optimal VAWT installations on the road, we select the WS (km/h) as the performance measure for each setting.
Table 3 shows the analysis of variance (ANOVA) for the wind speed as a response affected by four factors including (1) vertical distance (VD), (2) horizontal distance (HD), (3) road side, and (4) location of the VAWT. Furthermore, the interactions among the four factors were analyzed to determine their influence on the wind speed. It is clear from the table that all of the factors and their interactions are having significant influence on the response except VD*HD, VD*side, and HD*side interactions.
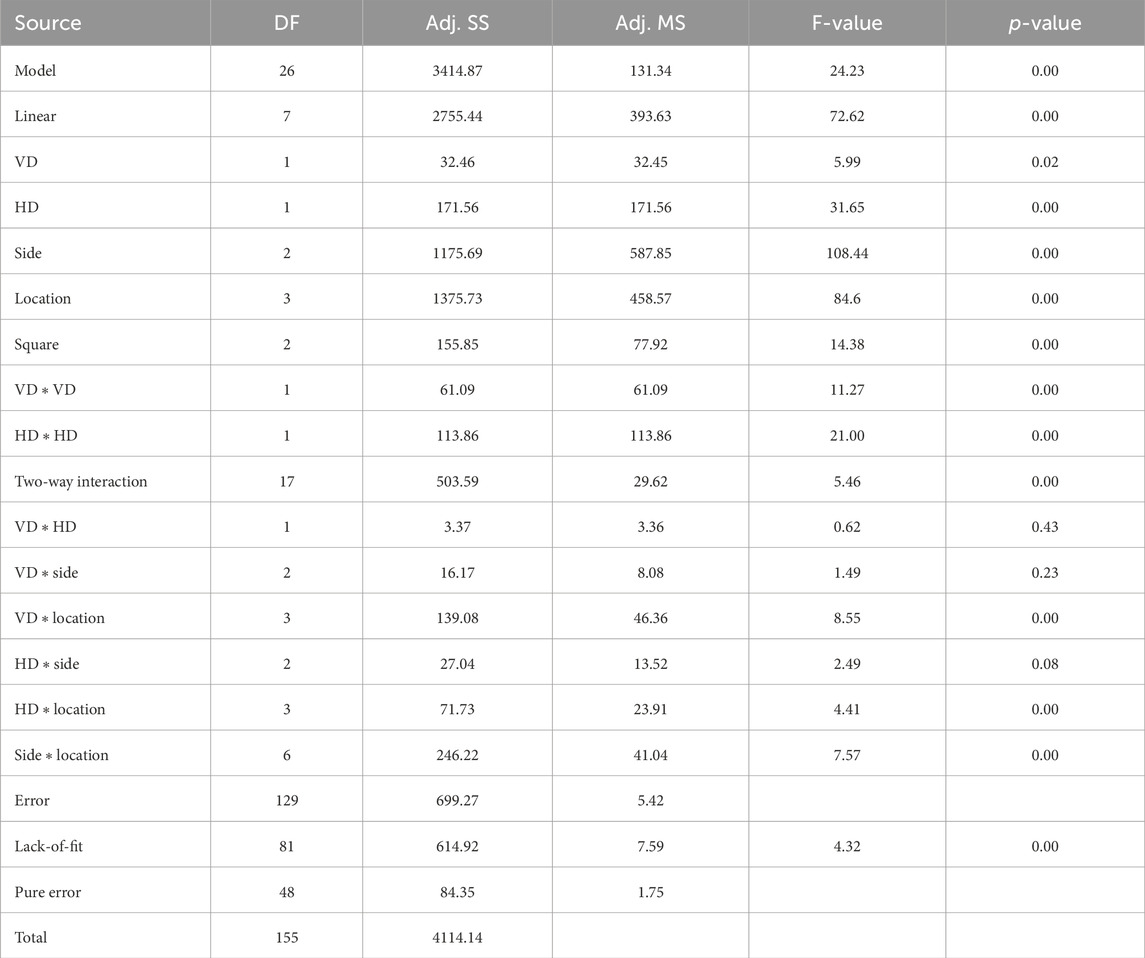
Table 3. ANOVA table of factors and their p-values.
In this section, the effects of the chosen factors are evaluated.
Figure 4 shows the average effects of VD, HD, side, and locations on the average wind speed.
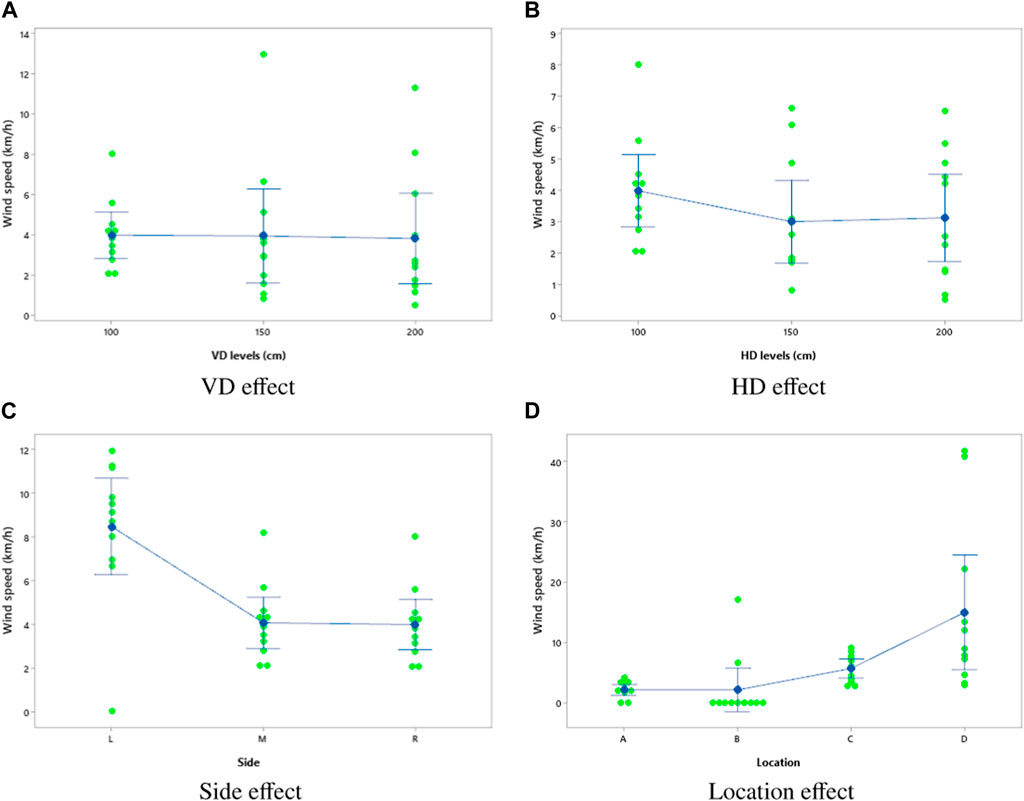
Figure 4. Average effects of (A) VD, (B) HD, (C) side, and (D) location on the harvested wind speed.
Figure 4A presents an interval plot of the average WS as a function of the VD to evaluate the effects of the VD on the average WS. From the figure, this factor demonstrates a very low impact on the response. As the values of VD change, the average changes in the response cannot exceed 5%.
Figure 4B illustrates an interval plot of the average WS as a function of the HD to assess how the HD affects the mean WS. This element appears to have more effect on the WS than VD as the average changes in the WS reach 25% as the values of HD fluctuate.
To assess the impact of the side on the average WS, Figure 4C shows an interval plot of the average WS as a function of the side. This element appears to have a significant effect on the response, based on the figure. The average WS changes substantially as the VAWT stationed in different sides. Shifting a VAWT from one side to another has an impact on WS that reaches 125%.
An interval plot of the average WS as a function of the location is shown in Figure 4D to evaluate the effect of the location on the average WS. Based on the figure, it seems that this component significantly affects the WS. The average changes in the WS change significantly as the VAWT is shifted from one location to another, considering that moving VAWTs to different positions affects WS by up to 200%.
In this part, we investigate the joint effects of factors on the WS. Figure 5 below demonstrates how the factors (VD, HD, and side) interact to influence the WS. For simplification purposes, we will consider the interaction effects of HD, VD, and side only. The location factor has demonstrated the most significant influence on the response in the previous section.
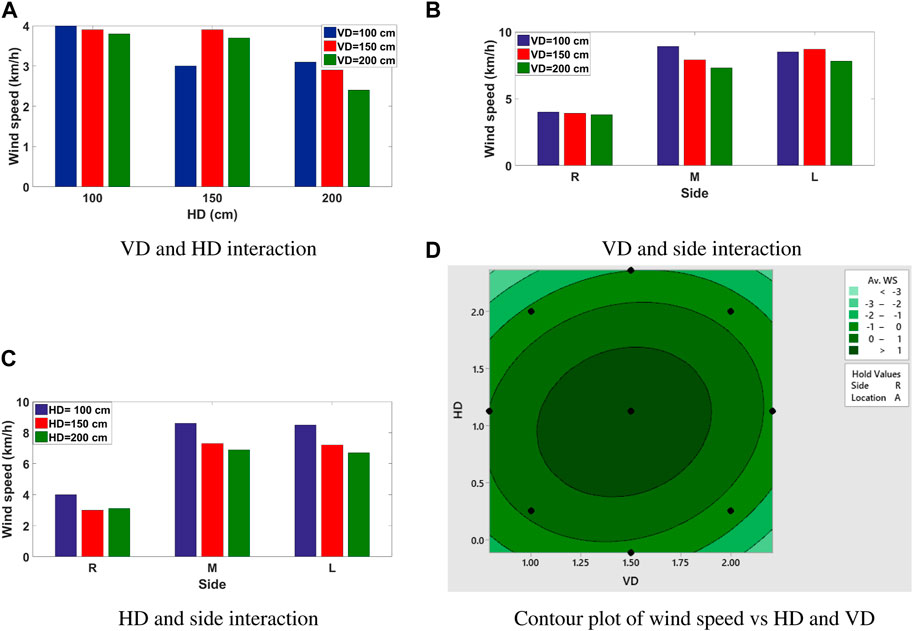
Figure 5. Average effects of factor interactions (A) VD and HD, (B) VD and side, (C) HD and side, and (D) contour plot of the VD and HD interaction.
Figure 5A below depicts the joint effect of HD and VD on the response. It is clear from the figure that the interaction of HD and VD has the highest effect at HD = 150 cm and VD = 100 and 150 cm. This is because the decay in WS accounts for 30%. The figure also shows that the joint effect of HD and VD on the WS is at its lowest levels when HD = 100 cm and VD = 100 and 150 cm with 5.26% only. Furthermore, Figure 5D shows the contour plot of the VD and HD interaction, and it can be seen that the WS has its highest values when VD and HD are ranging between 120–180 cm and 50–150 cm, respectively.
Figure 5B below shows how side and VD together affect the response. Figure 5B demonstrates that the joint effect of side and VD highly affects the WS at the middle side of the road, while VD increases from 100 to 200 cm. The increase in WS accounts for 28.57%. It is also noted that the simultaneous effect of side and VD on the WS is at its lowest levels when the VAWT is installed at the right side of the road and VD ranges between 100 and 150 cm with 2.50% only.
Figure 5C below demonstrates how side and HD interact to influence the WS. It is noted from Figure 5C that placing the VAWT on the middle or on the left side of the road makes no difference as HD changes. On the contrary, placing the VAWT at the right side causes a slight effect of 25% on the WS as HD changes.
In this analysis, the focus is on system operations (i.e., VAWT operation and energy yield), while the investment, design, and configuration costs will be ignored. Eq. 1 represents the objective function which aims to maximize the average wind speed, consequently increase the power output from the VAWT. The energy output from the VAWT is calculated as follows (Alqahtani and Hu, 2020):
where Av. WS is the average energy output from the wind turbine, ρ is the air density, A is the sweeping area, and v is the wind velocity. αij, βij, γij, ζ, ω, and τ are constants, and their values are shown in Table 1.
Eq. 2 is used to ensure that the optimization is conducted such that the height of the VAWT (VD) is bounded by the upper limit VDmax and lower limit VDmin.
Eq. 3 shows that the horizontal distance (HD) between the road and the VAWT is constrained by the upper and lower boundaries of HDmax and HDmin, respectively.
The side on the road (S) on which the VAWT installed is either on the left, right, or the middle according to Eq. 4, where Si is a binary variable (i.e., 0 or 1).
According to Eq. 5, the location where the VAWT is installed (L) should be in one of four locations on the Al-Hizam road. Lj is a binary (i.e., 0 or 1) variable.
Figure 6 illustrates the significant factors that have impact on the response and their levels of influence. Figure 6A shows the normal plot of the factors’ effects on the WS. According to the normal plot, there are effects of all of the factors (VD, HD, side, and location) on the WS and their interactions, except for three interactions including t VD*HD, VD*side, and HD*side interactions. Figure 6B, on the other hand, shows the levels of the factors’ influence. The side and location on the road on which the VAWT is placed have the most effect on the harvested wind speed. In contrast, the interaction of VD and HD has the lowest impact on the response.
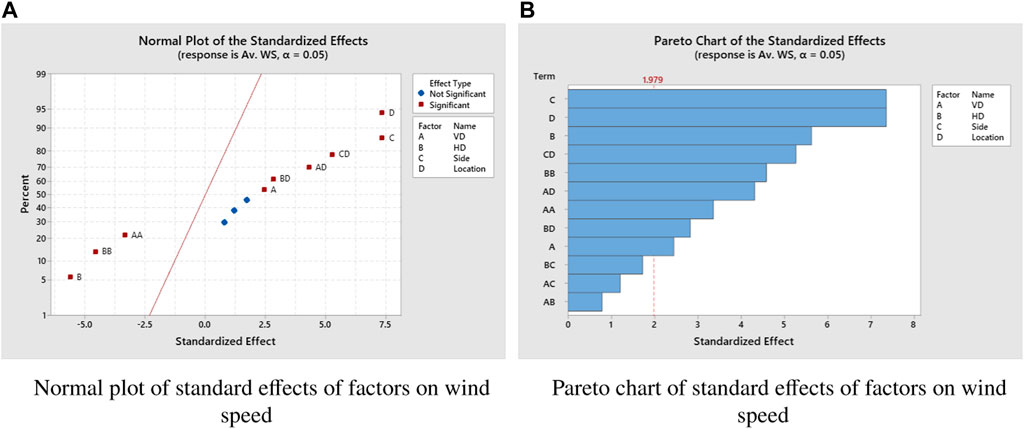
Figure 6. Levels of factors’ effects on the response. (A) Normal plot of standard effects of factors on wind speed. (B) Pareto chart of standard effects of factors on wind speed.
Figure 7 shows a plot of residuals and distribution of the response’s values. Figures 7A,B show the normal probability plot of the average WS. The plot shows that the values are circulating around the mean, which demonstrates that the values of the average WS are normally distributed. Thus, from the plots in Figure 7, the residuals of the response are normally and independently distributed; consequently, the model is adequate to undergo the ANOVA analysis.
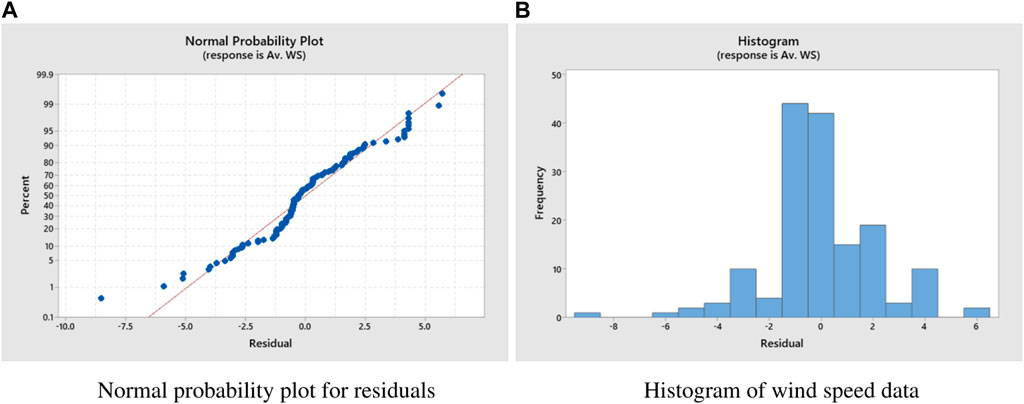
Figure 7. Model adequacy plots. (A) Normal probability plot for residuals. (B) Histogram of wind speed data.
Regression models are useful for testing the effect of the parameters under study, as demonstrated by the experimental yield value, because they highlight the best relationship between the dependent and independent variables. The steps that will be followed for the central composite design (CCD) are presented in Figure 8.
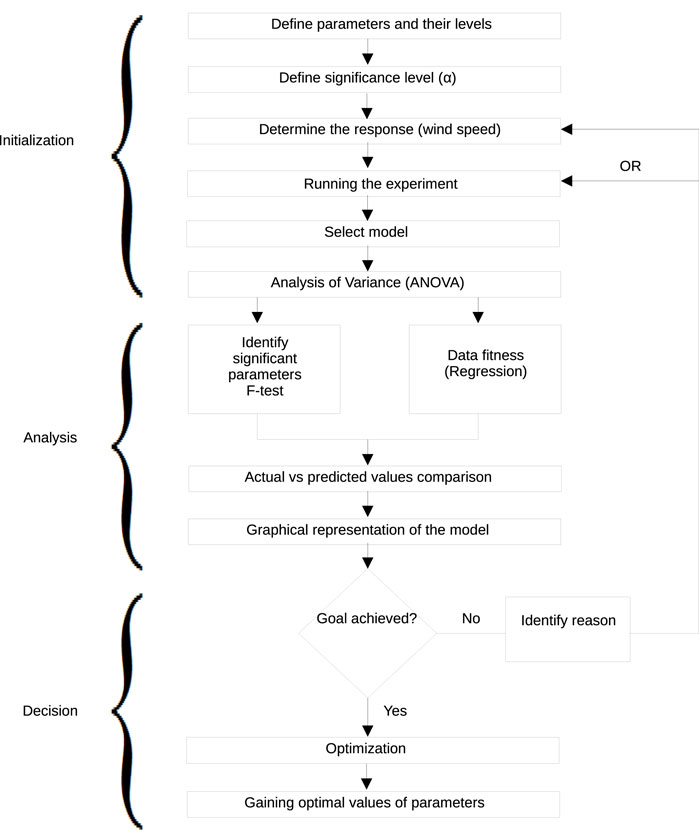
Figure 8. Central composite design flow diagram.
By applying the CCD design, a user-defined custom response surface design was used to build the suggested RSM model. Table 5 tabulates the RSM model, which displays the experimental and predicted values of WS conversion and the error between the two.
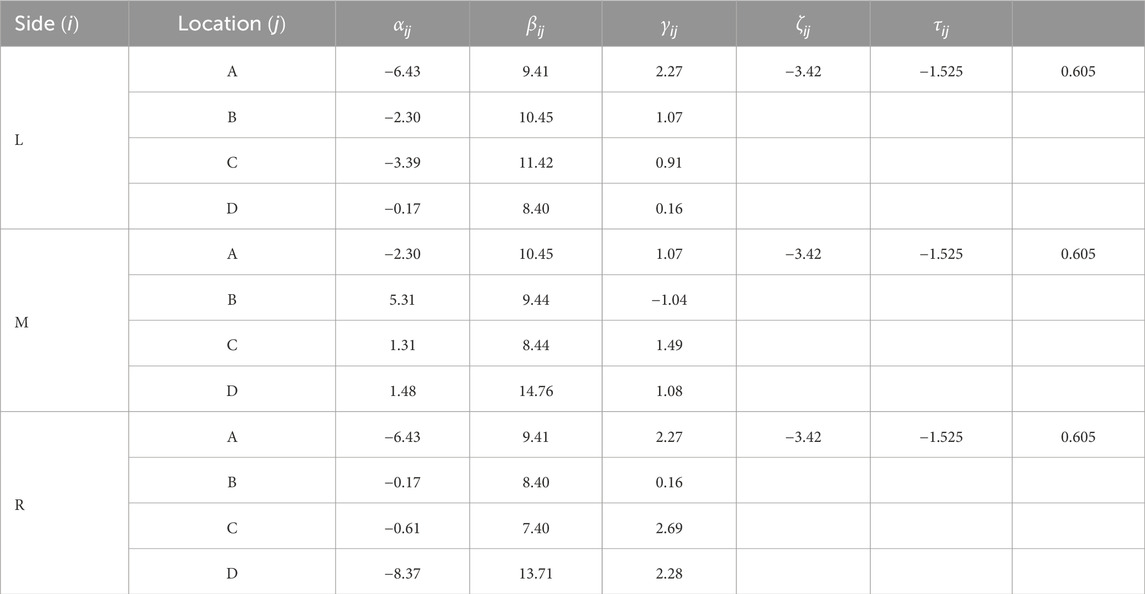
Table 4. Parameter values used in the regression and optimization.
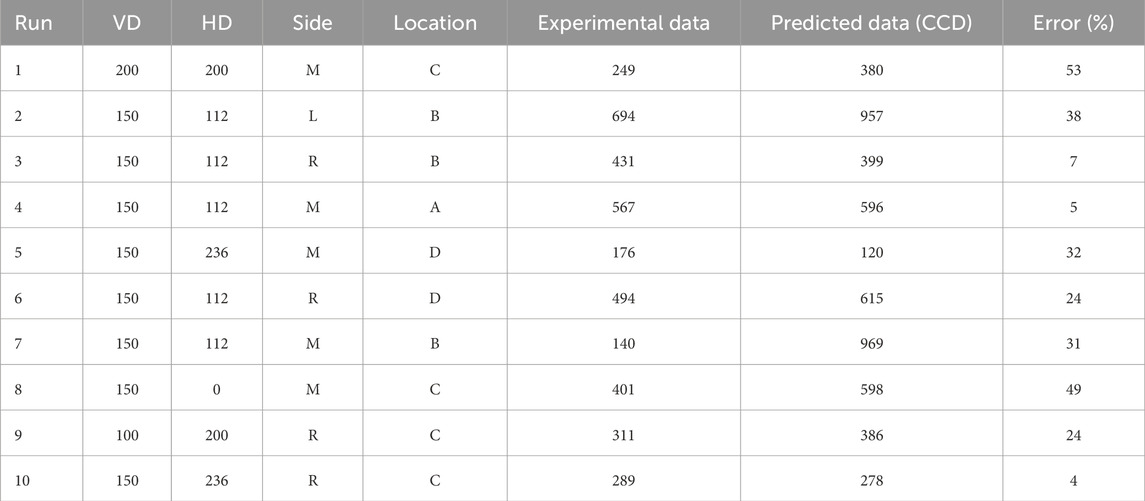
Table 5. Comparison of the predicted data vs. the experimental data for different cases.
Table 5 compares the predicted and experimental results. From the table, the CCD prediction shows an acceptable performance since the average prediction error is approximately 27%.
Figure 9 indicates the optimal settings of the VAWT for maximum WS. By establishing the likely values for each operating parameter, such as 200 cm of VD, 100 cm of HD, left side, and installed at site D, it is possible to acquire the maximum WS (yield) of 18.27 (km/hr).
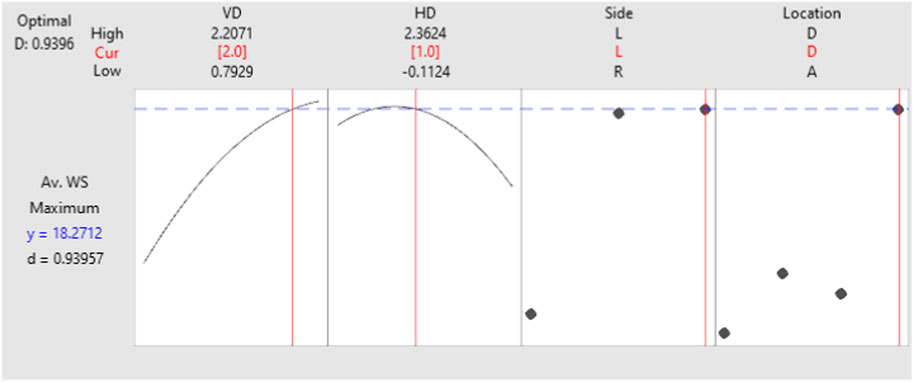
Figure 9. RSM response with optimal VAWT settings for maximum WS.
Figure 10 depicts an hourly power generation of the VAWT with basic settings versus optimal settings. The midpoint for each parameter is selected to represent the basic settings of the VAWT (before optimization). The figure shows that the performance of the VAWT is much better than the basic settings, especially during the peak hours. The power yield with the optimal settings has been increased by 69% compared to the basic settings.
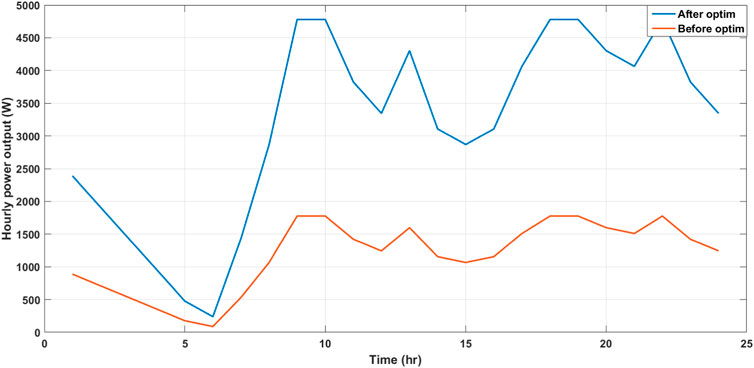
Figure 10. Hourly power output of the VAWT before and after optimization.
The main effects of the continuous factors (VD and HD) and categorical factors (side and location) are illustrated in Figure 11. The VD has its maximum effect on the WS approximately 170 cm. In contrast, the VD has its lowest impact at 100 cm. On the contrary, HD demonstrated a significant influence on the WS at 50 cm and lowest effect at 200 cm. The figure also shows that installing the VAWT on the left side of the road causes it to harvest the greatest deal of the WS, whereas the right side demonstrates the slowest WS. Furthermore, the D location indicates the highest levels of WS, while location A shows the slowest WS due to heavy traffic at location A and lightest at location D.
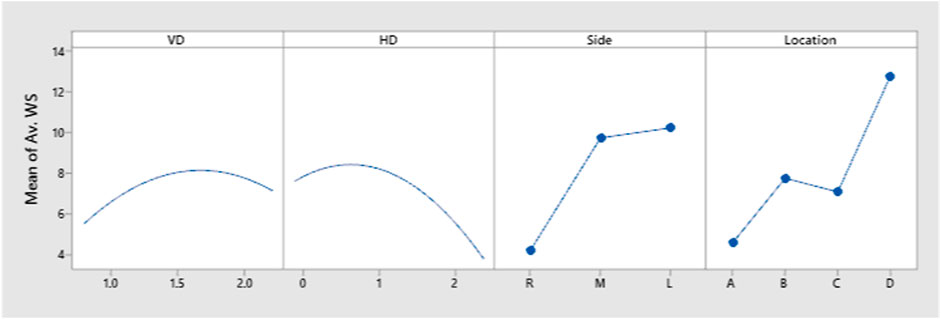
Figure 11. Main effect plot for means of wind speed.
The surface plot of VD and HD v and their effect on the average WS are shown in Figure 12. The maximum output of the response occurs at almost the middle points of each factor, namely, at 150 cm of the VD and at 100 cm of the HD, which demonstrates the non-linearity effect of the VD and HD interaction on the response.
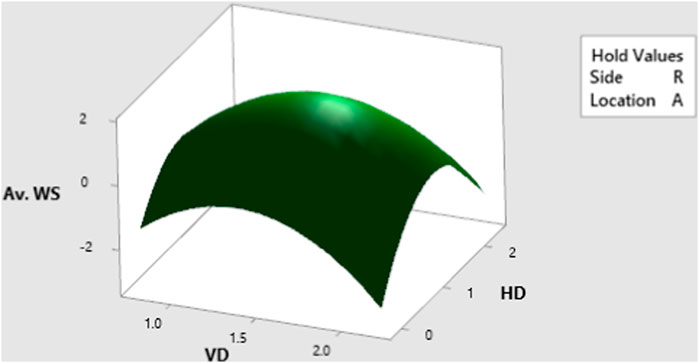
Figure 12. Surface plot of average vs. HD and VD.
Figure 13 illustrates the effects of the interactions among the four factors on the average WS. The interaction among the side and the location factors shows the highest impact on the WS since it reaches almost double the effects of the rest interactions. On the other hand, the figure shows the lowest readings of effects caused by VD and HD interactions. This emphasizes that side and location and their interactions have the major impact on the average WS compared to VD and HD and their interactions showing the minor influence on the average WS.
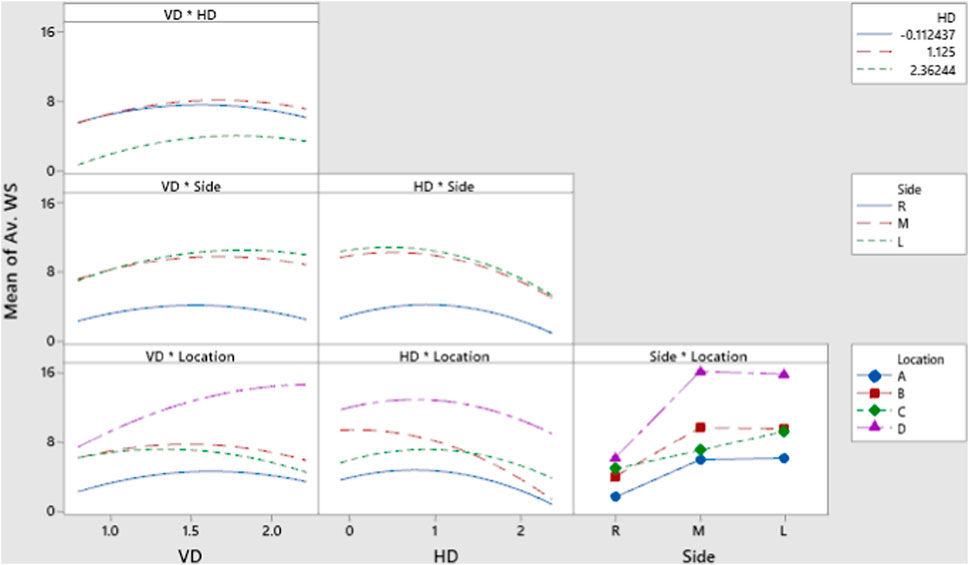
Figure 13. Interaction plot for average wind speed vs. HD, VD, side, and location.
In this part, we will assess the implementation of the VAWT as the energy supplier before and after optimization to highlight the improvement on both energy savings and pollution reduction. Figure 14 represents the energy savings and CO2 reduction using basic and optimal settings of the VAWT. The cost and carbon generation data were taken from (Energy Information Administration EIA, 2024; Pennstate extension. calculate costs for on site electricity generation, 2024).
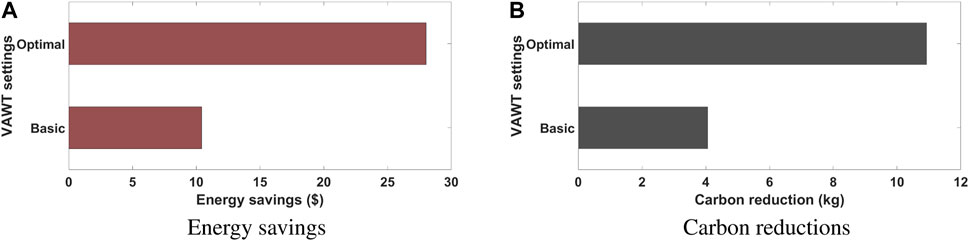
Figure 14. Economic and environmental impacts of the VAWT with different settings. (A) Energy savings. (B) Carbon reductions.
Figure 14 illustrates the improvement in VAWT’s performance with optimal settings compared to basic settings in terms of energy savings and carbon reduction. It is shown in Figure 14A that the VAWT with optimal arrangements can save up to 180% more energy savings than the VAWT with basic settings. Moreover, the VAWT can reduce up to 200% more carbon emissions when operated with optimal settings, as demonstrated in Figure 14B.
Wind energy wake generated by traffic on highways was used as a clean and reliable energy resource. Three vertical distances and three horizontal distances are used to fix the VAWT on highways to harvest the wind energy, and three road sides at four locations distributed on the Al-Hizam road are used. Using CCD’s design of experiment, a three-level four-factor array is built: VAWT vertical distance (VD), VAWT horizontal distance (HD), road sides (S), and VAWT locations (L). The best optimal values and percentage contribution for each parameter are found using RSM and ANOVA. The ideal values are often used in an affirmation test. The influence of a combination of operating factors, such as VAWT vertical and horizontal distances, has been investigated and is evaluated in relation to wind energy conversion. CCD’s analysis is used for RSM, and it predicts an optimal yields. According to the ANOVA, the locations and the road sides at which the VAWT is installed contribute the most percentages to the wind energy conversion process (66.67% and 51.80%, respectively). The yield of the confirmation test, which used the optimal values of the parameters from both RSM and ANOVA, was 88.75% ± 0.05% and 87.50% ± 0.10%, respectively. These results are comparable to those of most other researchers in the field. Although RSM offers a superior answer because of the stronger parameter interaction, comparable optimization may be carried out using ANOVA, using the same experiment design. Finally, the results from the economic and environmental assessment show that the VAWT with optimal settings can incur up to 180% and 200% more energy savings and carbon reduction, respectively, compared to the basic settings.
The raw data supporting the conclusion of this article will be made available by the authors, without undue reservation.
MA: conceptualization, data curation, formal analysis, funding acquisition, investigation, methodology, project administration, resources, software, supervision, validation, visualization, writing–original draft, and writing–review and editing.
The author(s) declare that financial support was received for the research, authorship, and/or publication of this article. The authors extend their appreciation to the Deanship of Scientific Research at King Khalid University for funding this work through large group research project under the grant number RGP2/239/44.
The author would like to thank King Khalid University for supporting this research.
The author declares that the research was conducted in the absence of any commercial or financial relationships that could be construed as a potential conflict of interest.
All claims expressed in this article are solely those of the authors and do not necessarily represent those of their affiliated organizations, or those of the publisher, the editors, and the reviewers. Any product that may be evaluated in this article, or claim that may be made by its manufacturer, is not guaranteed or endorsed by the publisher.
Al-Aqel, A. A., Lim, B. K., Mohd Noor, E. E., Yap, T. C., and Alkaff, S. A. (2016). “Potentiality of small wind turbines along highway in Malaysia,” in 2016 International Conference on Robotics, Automation and Sciences (ICORAS), Melaka, Malaysia, 05-06 November 2016, 1–6.
Alqahtani, M., and Hu, M. (2020). Integrated energy scheduling and routing for a network of mobile prosumers. Energy 200, 117451. doi:10.1016/j.energy.2020.117451
Baghdadi, M., Elkoush, S., Akle, B., and Elkhoury, M. (2020). Dynamic shape optimization of a vertical-axis wind turbine via blade morphing technique. Renew. Energy 154, 239–251. doi:10.1016/j.renene.2020.03.015
Barnes, A., and Hughes, B. (2019). Determining the impact of vawt farm configurations on power output. Renew. energy 143, 1111–1120. doi:10.1016/j.renene.2019.05.084
Battisti, L., Persico, G., Dossena, V., Paradiso, B., Raciti Castelli, M., Brighenti, A., et al. (2018). Experimental benchmark data for h-shaped and troposkien vawt architectures. Renew. energy 125, 425–444. doi:10.1016/j.renene.2018.02.098
Chen, Z., Zuo, W., Zhou, K., Li, Q., Huang, Y., and Jiaqiang, E. (2023). Multi-objective optimization of proton exchange membrane fuel cells by rsm and nsga-ii. Energy Convers. Manag. 277, 116691. doi:10.1016/j.enconman.2023.116691
Chen, Z., Zuo, W., Zhou, K., Li, Q., Yi, Z., and Huang, Y. (2024). Numerical investigation on the performance enhancement of pemfc with gradient sinusoidal-wave fins in cathode channel. Energy 288, 129894. doi:10.1016/j.energy.2023.129894
Costarrosa, L., Leiva-Candia, D. E., José Cubero-Atienza, A., José Ruiz, J., and Dorado, M. P. (2018). Optimization of the transesterification of waste cooking oil with mg-al hydrotalcite using response surface methodology. Energies 11 (2), 302. doi:10.3390/en11020302
Ding, L., Zhu, S.-P., Correia, J. A. F. O., Abílio, M. P., Veljkovic, M., and Berto, F. (2022). Fatigue reliability of wind turbines: historical perspectives, recent developments and future prospects. Renew. Energy 200, 724–742. doi:10.1016/j.renene.2022.09.093
Eltayesh, A., Castellani, F., Burlando, M., Hanna, M. B., Huzayyin, A. S., Hesham, M., et al. (2021). Experimental and numerical investigation of the effect of blade number on the aerodynamic performance of a small-scale horizontal axis wind turbine. Alexandria Eng. J. 60 (4), 3931–3944. doi:10.1016/j.aej.2021.02.048
Energy Information Administration (EIA) (2024). How much carbon dioxide is produced per kilowatthour of u.s. electricity generation? Available at: https://www.eia.gov/tools/faqs/faq.php?id=74&t=11 (Accessed February 22, 2024).
Global Wind Statistics (2024). Gwec. Available at: https://www.gwec.com (Accessed November 9, 2023).
Guo, Z., Liu, T., Xu, K., Wang, J., Li, W., and Chen, Z. (2020). Parametric analysis and optimization of a simple wind turbine in high speed railway tunnels. Renew. Energy 161, 825–835. doi:10.1016/j.renene.2020.07.099
Half-year Report WWEA (2014). Awea. Available at: https://www.awea.org/resources/fact-sheets/state-facts-sheets (Accessed November 9, 2023).
Hamze, H., Akia, M., and Yazdani, F. (2015). Optimization of biodiesel production from the waste cooking oil using response surface methodology. Process Saf. Environ. Prot. 94 (1–10), 1–10. doi:10.1016/j.psep.2014.12.005
Han, F., Bandarkar, A. W., and Yilmaz, S. (2019). “Energy harvesting from moving vehicles on highways,” in 2019 IEEE Energy Conversion Congress and Exposition (ECCE), Baltimore, MD, USA, 29 September 2019 - 03 (IEEE), 974–978.
He, J., Zheng, L., Zhang, X., Wang, H., Dong, W., Du, E., et al. (2022). Towards carbon neutrality: a study on China’s long-term low-carbon transition pathways and strategies. Environ. Sci. Ecotechnology 9, 100134. doi:10.1016/j.ese.2021.100134
Hegseth, J. M., E Bachynski, E., and Martins, J. R. R. A. (2020). Integrated design optimization of spar floating wind turbines. Mar. Struct. 72, 102771. doi:10.1016/j.marstruc.2020.102771
International Energy Agency (IEA) (2024). co2 emissions from fuel combustion-highlight. Available at: https://www.iea.org (Accessed November 9, 2023).
Jing, L., Zuo, W., Jiaqiang, E., Zhang, Y., Li, Q., Sun, K., et al. (2022). Multi-objective optimization of mini u-channel cold plate with sio2 nanofluid by rsm and nsga-ii. Energy 242, 123039. doi:10.1016/j.energy.2021.123039
Joachim, T. H., Mahak, M., and Tzanakis, I. (2021). Numerical modelling and optimization of vertical axis wind turbine pairs: a scale up approach. Renew. Energy 171, 1371–1381. doi:10.1016/j.renene.2021.03.001
Kumar Rathore, M., Agrawal, M., and Baredar, P. (2021). Energy production potential from the wake of moving traffic vehicles on a highway by the array of low economic vawt. Mater. Today Proc. 46, 5272–5277. doi:10.1016/j.matpr.2020.08.638
Latchubugata, C. S., Kondapaneni, R. V., Kumar Patluri, K., Virendra, U., and Vedantam, S. (2018). Kinetics and optimization studies using response surface methodology in biodiesel production using heterogeneous catalyst. Chem. Eng. Res. Des. 135, 129–139. doi:10.1016/j.cherd.2018.05.022
Li, F., Zuo, W., Zhou, K., Li, Q., Huang, Y., and Zhang, G. (2024). State-of-charge estimation of lithium-ion battery based on second order resistor-capacitance circuit-pso-tcn model. Energy 289, 130025. doi:10.1016/j.energy.2023.130025
Li, S., Chen, Q., Ye, L., Pröbsting, S., Yang, C., Zheng, X., et al. (2022). Experimental investigation on noise characteristics of small scale vertical axis wind turbines in urban environments. Renew. Energy 200, 970–982. doi:10.1016/j.renene.2022.09.099
Li, Y., Tong, G., Ma, Y., Fang, F., and Tagawa, K. (2023). Numerical study on aerodynamic performance improvement of the straight-bladed vertical axis wind turbine by using wind concentrators. Renew. Energy 219, 119545. doi:10.1016/j.renene.2023.119545
Liew, H. F., Baharuddin, I., Rosemizi, A. R., Muzamir, I., and Hassan, S. I. S. (2020). Review of feasibility wind turbine technologies for highways energy harvesting. J. Phys. Conf. Ser. 1432, 012059. doi:10.1088/1742-6596/1432/1/012059
Morbiato, T., Borri, C., and Vitaliani, R. (2014). Wind energy harvesting from transport systems: a resource estimation assessment. Appl. Energy 133, 152–168. doi:10.1016/j.apenergy.2014.07.055
Nimje, A. A., and Gandhi, N. M. (2020). Design and development of small wind turbine for power generation through high velocity exhaust air. Renew. Energy 145, 1487–1493. doi:10.1016/j.renene.2019.06.065
Noshadi, I., Amin, N. A. S., and Parnas, R. S. (2012). Continuous production of biodiesel from waste cooking oil in a reactive distillation column catalyzed by solid heteropolyacid: optimization using response surface methodology (rsm). Fuel 94, 156–164. doi:10.1016/j.fuel.2011.10.018
Peng, H. Y., Han, Z. D., Hj Liu, K. L., and Lam, H. F. (2020). Assessment and optimization of the power performance of twin vertical axis wind turbines via numerical simulations. Renew. Energy 147, 43–54. doi:10.1016/j.renene.2019.08.124
Peng, T., Ou, X., Yuan, Z., Yan, X., and Zhang, X. (2018). Development and application of China provincial road transport energy demand and ghg emissions analysis model. Appl. Energy 222, 313–328. doi:10.1016/j.apenergy.2018.03.139
Pennstate extension. calculate costs for on site electricity generation (2024). Extension. Available at: https://extension.psu.edu/calculate-costs-for-on-site-electricity-generation (Accessed February 22, 2024).
Pourrajabian, A., Dehghan, M., and Rahgozar, S. (2021). Genetic algorithms for the design and optimization of horizontal axis wind turbine (hawt) blades: a continuous approach or a binary one? Sustain. Energy Technol. Assessments 44, 101022. doi:10.1016/j.seta.2021.101022
Qi, L., Zheng, P., Wu, X., Duan, W., Li, L., and Zhang, Z. (2020). A hybrid wind-photovoltaic power generation system based on the foldable umbrella mechanism for applications on highways. Sol. Energy 208, 368–378. doi:10.1016/j.solener.2020.07.082
Ren, L., Zhou, S., Peng, T., and Ou, X. (2022). Greenhouse gas life cycle analysis of China’s fuel cell medium-and heavy-duty trucks under segmented usage scenarios and vehicle types. Energy 249, 123628. doi:10.1016/j.energy.2022.123628
Tian, W., Song, B., and Mao, Z. (2020). Numerical investigation of wind turbines and turbine arrays on highways. Renew. Energy 147, 384–398. doi:10.1016/j.renene.2019.08.123
Uddin, R., Al Araf, A., Khan, R., Ahammed, F., et al. (2022). Smart vertical axis highway wind turbine. Int. J. Eng. Adv. Technol. Stud. 10 (4), 20–36. doi:10.37745/ijeats.13/vol10n42036
Wang, H., Ou, X., and Zhang, X. (2017). Mode, technology, energy consumption, and resulting co2 emissions in China’s transport sector up to 2050. Energy Policy 109, 719–733. doi:10.1016/j.enpol.2017.07.010
Wenyu Hu, E. J., Leng, E., Zhang, F., Chen, J., Ma, Y., and Ma, Y. (2023). Investigation on harvesting characteristics of convective wind energy from vehicle driving on multi-lane highway. Energy 263, 126062. doi:10.1016/j.energy.2022.126062
Xiao, Y., Zuo, X., Kaku, I., Zhou, S., and Pan, X. (2019). Development of energy consumption optimization model for the electric vehicle routing problem with time windows. J. Clean. Prod. 225, 647–663. doi:10.1016/j.jclepro.2019.03.323
Xu, Z., Chen, J., and Chun, L. (2023). Research on the adaptability of dynamic pitch control strategies on h-type vawt close-range arrays by simulation study. Renew. Energy 218, 119231. doi:10.1016/j.renene.2023.119231
Zuo, W., Li, D., Jiaqiang, E., Xia, Y., Li, Q., Quan, Y., et al. (2023b). Parametric study of cavity on the performance of a hydrogen-fueled micro planar combustor for thermophotovoltaic applications. Energy 263, 126028. doi:10.1016/j.energy.2022.126028
Zuo, W., Li, D., Li, Q., Cheng, Q., Zhou, K., and Jiaqiang, E. (2023c). Multi-objective optimization of multi-channel cold plate under intermittent pulsating flow by RSM and NSGA-Ⅱ for thermal management of electric vehicle lithium-ion battery pack. Energy 283, 129085. doi:10.1016/j.energy.2023.129085
Zuo, W., Li, F., Li, Q., Chen, Z., Huang, Y., and Chu, H. (2024). Multi-objective optimization of micro planar combustor with tube outlet by rsm and nsga-ii for thermophotovoltaic applications. Energy 291, 130396. doi:10.1016/j.energy.2024.130396
Zuo, W., Wang, Z., Jiaqiang, E., Li, Q., Cheng, Q., Wu, Y., et al. (2023a). Numerical investigations on the performance of a hydrogen-fueled micro planar combustor with tube outlet for thermophotovoltaic applications. Energy 263, 125957. doi:10.1016/j.energy.2022.125957
Zuo, W., Zhang, Y., Jiaqiang, E., Jing, L., Li, Q., and Zhang, G. (2022). Performance comparison between single s-channel and double s-channel cold plate for thermal management of a prismatic lifepo4 battery. Renew. Energy 192, 46–57. doi:10.1016/j.renene.2022.04.116
Keywords: vertical-axis wind turbine, distributed energy resource, renewable energy, response surface methodology, central composite design
Citation: Alqahtani M (2024) Optimization of VAWT installation with spatial and temporal complexity considerations. Front. Energy Res. 12:1373586. doi: 10.3389/fenrg.2024.1373586
Received: 20 January 2024; Accepted: 12 March 2024;
Published: 05 April 2024.
Edited by:
Juan Carlos Jauregui, Autonomous University of Queretaro, MexicoReviewed by:
Jesus Alejandro Franco Piña, Universidad Nacional Autónoma de México, MexicoCopyright © 2024 Alqahtani. This is an open-access article distributed under the terms of the Creative Commons Attribution License (CC BY). The use, distribution or reproduction in other forums is permitted, provided the original author(s) and the copyright owner(s) are credited and that the original publication in this journal is cited, in accordance with accepted academic practice. No use, distribution or reproduction is permitted which does not comply with these terms.
*Correspondence: Mohammed Alqahtani, bS5hbHFhaHRhbmlAa2t1LmVkdS5zYQ==
Disclaimer: All claims expressed in this article are solely those of the authors and do not necessarily represent those of their affiliated organizations, or those of the publisher, the editors and the reviewers. Any product that may be evaluated in this article or claim that may be made by its manufacturer is not guaranteed or endorsed by the publisher.
Research integrity at Frontiers
Learn more about the work of our research integrity team to safeguard the quality of each article we publish.