 Bingsong Chen
 Yi Wang1*
- 1NARI Technology Co., Ltd., Nanjing, China
- 2State Grid Jiangsu Electric Power Co., Ltd., Nanjing, China
With a high percentage of distributed new energy sources connected to the power system, the power grid needs to reserve a larger margin to deal with the uncertainty of renewable energy outputs, leading to an increase in the cost of controlling the margins for the safe operation of the power grid. In order to reduce costs and increase efficiency, a quantitative assessment of new energy output uncertainty is needed. In this paper, a quantitative assessment method of new energy output uncertainty based on the prediction error is proposed, which makes use of a graph database to efficiently obtain massive new energy historical data, uses the clustering in quest (CLIQUE) algorithm to cluster the new energy historical data, and calculates the renewable energy real power confidence interval based on a given new energy power prediction, taking account of the impact of prediction errors caused by the new energy uncertainty and realizing the quantitative description of new energy output uncertainty. Finally, the method is calculated and analyzed together with the actual example data to verify the practical effect of the method.
1 Introduction
With the proposal of the “dual-carbon” goal, clean and low-carbon energy will be developed and utilized on a large scale. According to the plan, the share of renewable energy generation in China is expected to exceed 50% by 2060, becoming the mainstay of electricity. However, new energy output has strong uncertainty and volatility (Chongqing and Liangzhong, 2017), and the large-scale penetration of new energy greatly increases the complexity and risk level of the power grid, which has a significant impact on the reliable and economic operation of the power grid (Lingling et al., 2018; Changjiu et al., 2020).
As the penetration rate of distributed new energy continues to increase (Zhang and Shen, 2024), there are obvious contradictions in response to the uncertainty of new energy resources in the preservation of consumption and the safe operation of the power grid (Zhi et al., 2020), in which the insufficient new energy perception ability is one of the main factors, mainly manifested in the difficulty of modeling refinement of distributed new energy field stations and the lack of credibility of power prediction (Chao et al., 2021), which seriously restricts the ability of the grid control department to control the power generation capacity of new energy stations (Jinghua et al., 2022). For dealing with the uncertainty of new energy, the power grid needs to reserve a larger margin (Dong et al., 2023), leading to an increase in the cost of controlling the margin for the safe operation of the power grid and, at the same time, improving the difficulty of balancing and guaranteeing the supply of power in the power grid. In order to reduce costs and increase efficiency, there is an urgent need to carry out research on the quantitative assessment of the uncertainty of new energy output, which requires analyzing a large amount of new energy historical data and thus puts high demands on the large-scale and rapid acquisition of new energy data.
The graph database as a non-relational database emerged in the last decade; its unique node and data format have a natural fit with the grid topology, and it has a wide range of applications in power system analysis and data mining (Guangyi et al., 2017). Zheng et al. (2022) used graph databases to construct and apply power grid data models to realize high-performance, large-scale power grid topology analysis operations. Guangyi et al. (2020) proposed concepts and methods for in-memory computation on graph databases and investigated a real-time network topology analysis method for power grids that incorporates node-parallel and hierarchical computational mechanisms. Houming et al. (2012) proposed a fast-power network topology analysis method based on a graph database, which maps multi-state devices into multi-nodes.
Most of the above studies on graph databases focus on the field of power grid topology analysis. The complex and huge network structure of the power grid predetermines the complexity of its data system, and the application of graph databases to solve problems such as new energy data acquisition has a natural advantage.
Unlike conventional energy sources, new energy output is intermittent, volatile, and uncertain. In the problems of grid power flow analysis, unit commitment, and economic dispatch considering the case of new energy access (Zhiyu et al., 2022), new energy power uncertainty is specifically represented by the accuracy of the mathematical portrayal of the prediction error, and it can have a significant impact on the optimization results (Huajie et al., 2012). The day-ahead prediction error of the actual new energy power presents a large kurtosis and skewness, and the use of the classical normal distribution description will produce a large error, so some scholars have proposed a new statistical model for the prediction of wind and light. Bludszuweit et al. (2008) proposed using beta distribution to fit the prediction error with reference to the prediction results of the persistence model (PM). Tewari et al. (2011) proposed using a combination of discrete distribution and continuous function to describe the prediction error. Yutong (2020) introduced seasonal variables and incorporated kernel density estimation to give the distribution model of PV power prediction error under different seasons.
Most of the above studies on the uncertainty of new energy power use a certain mathematical distribution to fit the distribution pattern of new energy prediction error; however, with the development of distributed power generation technology (Caixia et al., 2023), different types of new energy are integrated (Tan et al., 2023), and the prediction error of their combined output no longer obeys a single mathematical distribution.
Aiming at the above problems and needs, this paper proposes a quantitative assessment method of new energy output uncertainty based on prediction error using a graph database to efficiently obtain massive new energy historical data and analyzes the coupling relationship between the predicted power and prediction error using the clustering in quest (CLIQUE) algorithm. Based on the given new energy prediction power, the new energy actual power confidence interval can be obtained according to the corresponding prediction error distribution interval, which achieves the quantitative assessment of new energy power uncertainty, promotes the consumption of distributed new energy, improves the safety level of grid operation, and promotes the intelligent development of the dispatching system adapted to new energy as the main body.
2 New energy data acquisition method based on a graph database
2.1 Introduction to the graph database
A graph database consists of a collection of data based on graph structure and a computation engine based on graph traversal. The graph database uses vertices and edges to represent the data model. Data attributes are stored in vertices and edges, and relationships between data are described by edges between vertices (Yuning and Bingbing, 2022). Querying a collection of data based on graph structure is also known as graph traversal or graph computation. In the data model of a graph database, each vertex or edge can be equipped with computational functions, which are both data storage units and dynamic computational units. Parallelized graph computation can be easily achieved by performing local computation based on each vertex in the graph independently and carrying out information exchange through edges.
2.2 Grid modeling based on a graph database
Building a grid model based on a graph database is the basis for applying graph computation technology to power system analysis and computation. The CIM/E model is a specification for describing power system models proposed by the State Grid Corporation of China (Yaozhong et al., 2006; Weimin et al., 2013). In this paper, we follow the CIM/E specification to build a grid model based on a graph database, and at the same time, we adapt the characteristics of the graph database to maximize the access efficiency of the model.
The graph model (GM) in a graph database can be represented as a ternary:
where N = { n1, n2, n3, … , nt } is a non-empty finite set of vertices and t elements in N denote t vertices; R = { r1, r2, r3, … , rs } is the edge set consisting of edges connecting ordered vertex even pairs (ni, nj) in the vertex set N; s elements in R denote s edges and satisfy R ⊆ N × N; and L is the set of vertex attributes and edge attributes. Vertices and edges can have multiple attributes. Different types of vertices or edges are distinguished by their IDs. There can be several different edges between vertices, and the number of their attributes can be expanded dynamically.
Power system devices, such as buses, breakers, disconnectors, generators, and loads, are defined as vertices, and connection lines between devices are defined as edges in the graph database. In addition, in order to establish topological associations between devices, the physical node attributes describing the topological relationships between devices in the CIM/E model are defined as vertices. The correspondence between the grid entities and graph database elements is shown in Table 1, and an example of the grid model based on the graph database is shown in Figure 1.
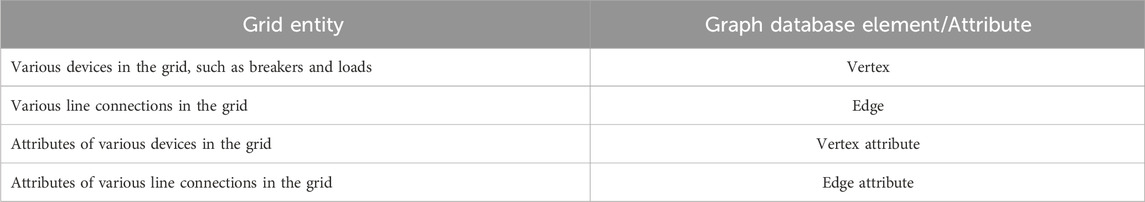
Table 1. Correspondence between grid entities and graph database elements.

Figure 1. Example of a grid model based on a graph database.
2.3 New energy data acquisition process based on a graph database
The new energy data acquisition process for a certain range of new energy based on the graph database (taking the information of all new energy units connected through topological relationships under one main transformer as an example) contains the following steps:
1) In the given new energy plant station, select a main transformer and then find transformer’s medium-voltage side winding (labeled TransformerWinding2) and low-voltage side winding (labeled TransformerWinding3). These two windings of the same transformer are associated with each other by the same value of the transformer identification attribute.
2) For the medium-voltage side winding TransformerWinding2 obtained in step 1, find the physical node adjacent to it.
3) For the physical node found in step 2, query whether it has a neighboring generator. If there is a neighboring generator, determine whether it is a new energy generator based on the generator node attribute ‘generator type’ (generator type is PV or wind power), and record the generator ID value if it is a new energy generator.
4) Continue querying neighboring physical nodes from the physical node found in step 2.
5) For the physical node found in step 4, query whether it has a neighboring generator. If there is a neighboring generator, determine whether it is a new energy generator based on the generator node attribute ‘generator type’ (generator type is PV or wind power), and record the generator ID value if it is a new energy generator.
6) Continue to search for its neighboring nodes and repeat steps 4–5 until it has no neighbors.
7) For the low-voltage side winding TransformerWinding3 obtained in step 1, similar to the processing of the medium-voltage side winding, repeat steps 2–6 to find all the new energy generators connected to low-voltage side winding, and record the ID value of each new energy generator connected to low-voltage side winding.
8) Based on the IDs of the new energy generators found, obtain the required new energy generator information through the database query code.
3 New energy uncertainty analysis based on CLIQUE clustering
3.1 Cluster analysis of new energy historical data based on the CLIQUE algorithm
The CLIQUE algorithm is a combination of density-based and mesh-based clustering methods and provides a new way of thinking about cluster analysis of high-dimensional data by introducing the concept of subspace clustering. The CLIQUE algorithm can explore the global distribution pattern of the data space by recognizing the density of cells in the data space. The central idea of the CLIQUE algorithm is as follows:
1) Given a large collection of multidimensional data points, which are usually not evenly distributed in the data space, the CLIQUE distinguishes between sparse and ‘crowded’ regions (or cells) in the space in order to discover the global distribution pattern of the data collection.
2) A cell is dense if the number of data points in the cell exceeds a certain input model parameter. A cluster in CLIQUE is defined as the largest set of connected dense cells.
CLIQUE performs multidimensional clustering in two steps:
In the first step, CLIQUE divides the n-dimensional data space into mutually disjoint rectangular cells (Gengsheng et al., 2008) and identifies the dense cells in it. This work is performed for each dimension. The intersecting subspaces representing dense cells form a candidate search space in which higher-dimensional dense cells may exist (Lu and Zhang, 2020).
In the second step, CLIQUE generates a minimized description for each cluster. For each cluster, it determines the largest region that covers connected dense cells and then determines the smallest coverage (Xiangxiang and Dengsheng, 2012).
Compared to other clustering algorithms, such as k-means clustering and DBSCAN clustering, the CLIQUE algorithm does not need to set the initial number of clusters and does not need to assume any standard data distribution. It scales linearly with the size of the input data and has good scalability when the dimensionality of the data increases. The CLIQUE algorithm is very effective for clustering high-dimensional data in large-scale databases. In addition, the time and space complexity of the algorithm are linear, and the calculation speed is faster. The CLIQUE algorithm is a grid-based clustering method. The classification boundary in the clustering result is a grid boundary, so the boundary is a flat straight line, which makes it easy to determine the coupling relationship between the new energy prediction power and the prediction error. Therefore, the CLIQUE algorithm is selected for clustering new energy historical data.
The process of analyzing new energy historical operation information based on the CLIQUE algorithm contains the following steps:
1) Take {P1 = P’} and {P2 = P-P’}, i.e., the historical prediction power and historical prediction error, as clustering data.
2) Intercept the two-dimensional data of {P1} and {P2} under the same time scale at the same time period as the original clustering data. Adjust the grid parameters and density parameters of clustering according to the distribution of clustered points in the original data of clustering, and carry out the CLIQUE clustering algorithm to analyze the coupling relationship between the predicted power and prediction error.
3.2 New energy actual power confidence interval calculation
The CLIQUE algorithm is used for the new energy historical data to analyze the coupling relationship between the predicted power and prediction error. Based on a given new energy prediction power, the confidence interval of the new energy actual power at the same moment as the prediction power can be obtained according to the corresponding prediction error distribution interval, which can effectively quantify the uncertainty of the new energy output (Sicheng and Weiqing, 2023).
Based on the coupling relationship between the prediction power and prediction error obtained from the cluster analysis, the lower and upper limits of the corresponding new energy prediction error are obtained according to the range of prediction power intervals to which the given new energy prediction data belong. The lower limit of the new energy prediction error is denoted as ERRgd, and the upper limit of the new energy prediction error is denoted as ERRgu.
Based on the given new energy power prediction value, the corresponding lower limit of the new energy actual power confidence interval is denoted as
where Pe is the given new energy power prediction value and ERRgd is the lower limit of the new energy prediction error.
The upper limit of the new energy actual power confidence interval is denoted as
where ERRgu is the upper limit of the new energy prediction error.
Based on the lower and upper limits of the new energy actual power confidence interval, the new energy actual power confidence interval is expressed as [Ped, Peu].
It should be noted that the above calculation step is based on the predicted power of new energy at a single moment to calculate the confidence interval of the actual power of new energy at the same moment. On this basis, for the new energy prediction data over a period of time, the predicted power at each time point can be used to calculate the new energy actual power confidence interval at the same time following the above calculation step, and the new energy actual power confidence interval in the target time period can be obtained by traversing all the time points based on the prediction data.
4 Example analysis result
4.1 New energy data acquisition based on a graph database
Combining the topology of a model system containing some new energy plant stations, the CIM/E data are converted into vertex and edge datasets and loaded into a graph database to build a corresponding physical node graph model of the power system. Based on this graph database test dataset, the above method is used to obtain information on all new energy units under a certain main transformer connected through topological relationships, as shown in Table 2.
In Table 2, the left side contains the main transformer winding ID as the starting point of the search path and the right side contains the ID of the new energy generator found. For this graph database test dataset, a part of the new energy generators are found in main transformer low-voltage side winding (ID: 117375065841997076), and the rest of the new energy units are found in main transformer medium-voltage side winding (ID: 117375065841997077).
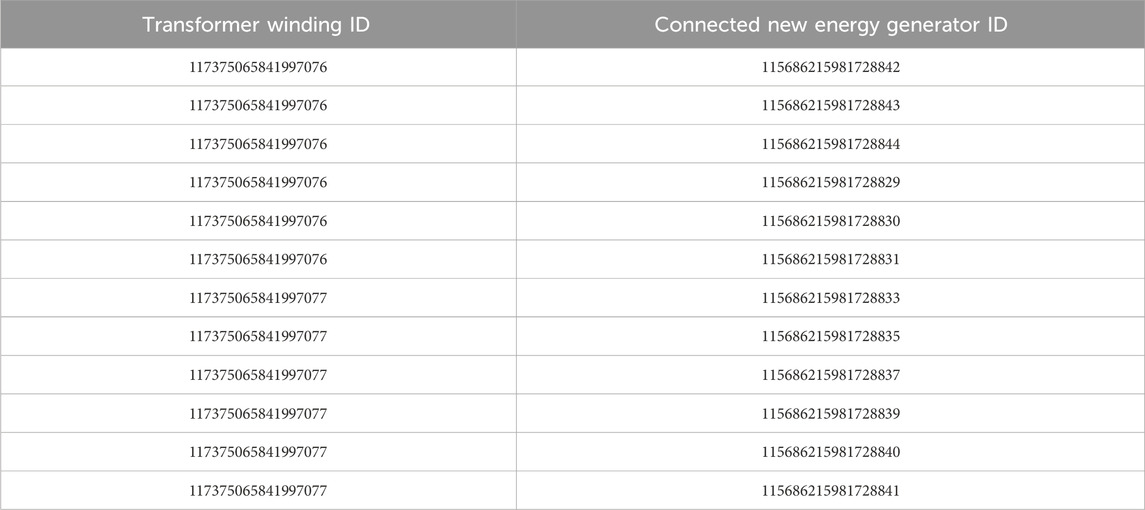
Table 2. Transformer winding and new energy generators found from winding.
In Table 3, based on the ID of the new energy generator found, the information of the new energy generator searched under the main transformer, such as generator type and generator output, is obtained by the SQL query statement.
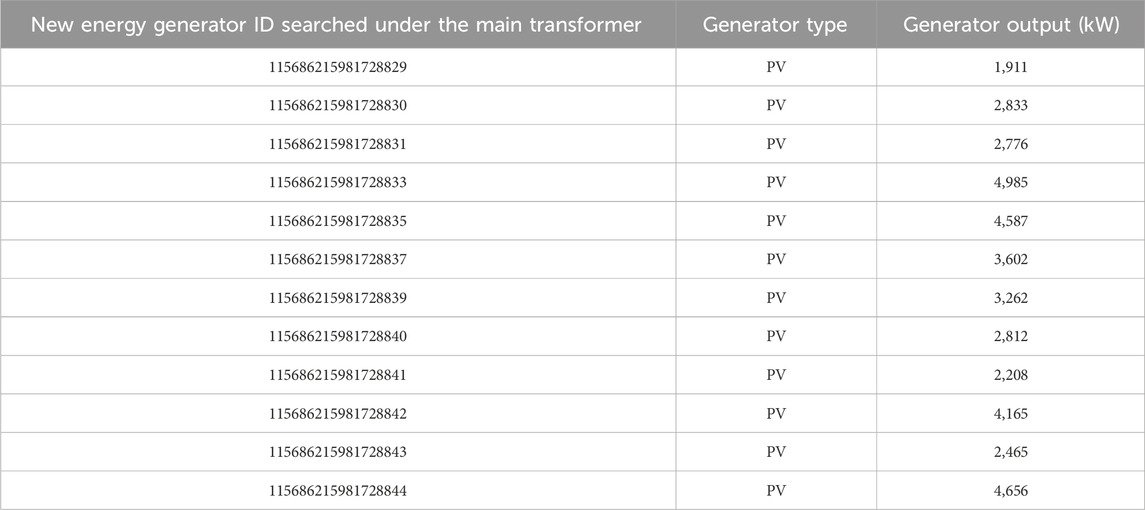
Table 3. New energy generator information searched under the main transformer.
4.2 New energy historical data clustering analysis based on the CLIQUE algorithm
Based on the new energy historical data in a region obtained from the graph database, the new energy historical prediction and measured data are analyzed using the above method, and the operational distribution characteristics of the new energy historical prediction power and prediction error are obtained through the CLIQUE clustering method, as shown in Figure 2.
Based on Figure 2, the distribution intervals of prediction errors for new energy sources at different prediction power levels can be summarized, as shown in Table 4.

Figure 2. Operational distribution characteristics of new energy prediction power and prediction error.
According to Figure 2 and Table 4, the fluctuation range of the prediction error is the largest when the new energy prediction power is 500 kW–1,000 kW. The range of fluctuation of the prediction error is the smallest when the predicted power is > 2,500 kW.
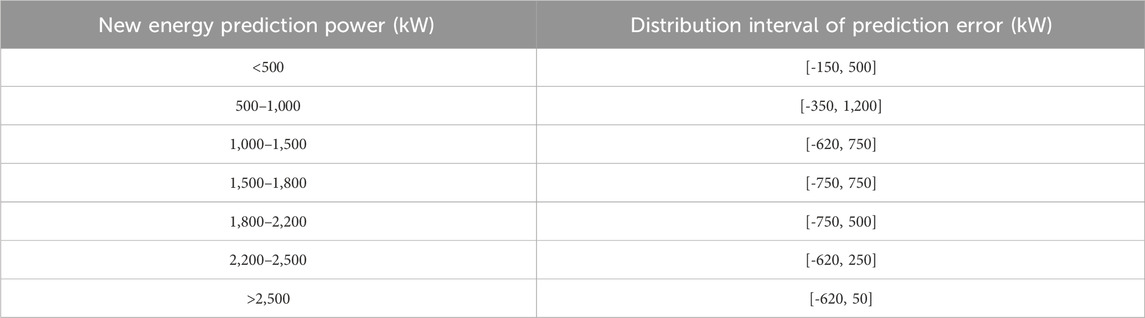
Table 4. Distribution intervals of prediction errors.
The new energy historical data in two different regions are analyzed and compared using the CLIQUE algorithm to obtain the coupling relationship between the new energy prediction power and prediction error in different regions, as shown below.
As can be seen from Figure 3 and Figure 4, the maximum range of new energy prediction error fluctuation in region 1 is [-2,000, 1,250], and the maximum range of new energy prediction error fluctuation in region 2 is [-2,500, 1,750]. According to the clustering results, it can be found that the new energy characteristics of different regions are more different.
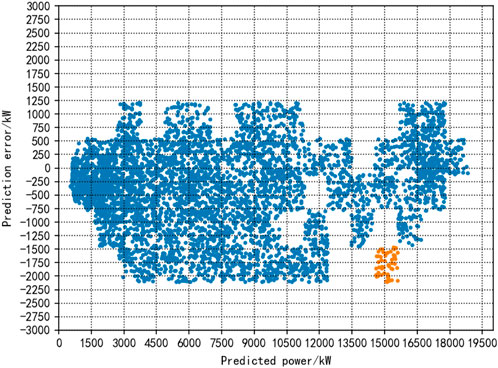
Figure 3. Distribution characteristics of new energy prediction power and prediction error in region 1.
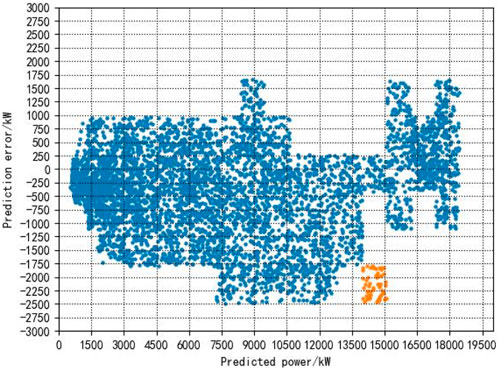
Figure 4. Distribution characteristics of new energy prediction power and prediction error in region 2.
4.3 New energy actual power confidence interval
For the region to which the new energy data analyzed in Figure 2 belongs, based on the new energy prediction data within a given day’s time, the new energy actual power confidence interval within this day is calculated according to the corresponding prediction error distribution interval, as shown in Figure 5.
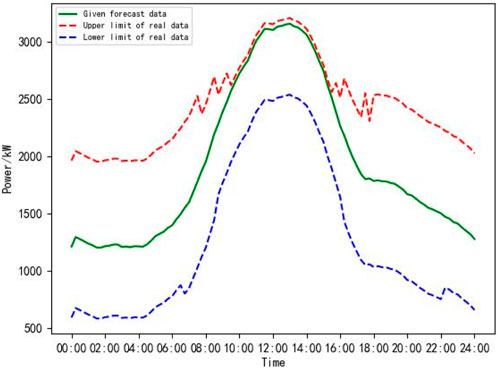
Figure 5. Confidence interval of actual power of new energy in one day.
In Figure 5, the red line represents the upper limit of the actual power confidence interval, and the blue line represents the lower limit of the actual power confidence interval. It can be seen that using the data-driven new energy uncertainty analysis method proposed in this paper, the new energy actual power confidence interval in the target time period is obtained, and the impact of the prediction error caused by new energy uncertainty is taken into account, realizing the quantitative description of new energy output uncertainty.
5 Conclusion
In this paper, we use a graph database to efficiently obtain massive new energy historical data and propose a method to quantitatively assess the uncertainty of new energy output based on prediction error using the CLIQUE algorithm to quickly analyze the coupling relationship between new energy prediction power and prediction error. Based on the given new energy prediction power, the new energy actual power confidence interval can be calculated according to the corresponding prediction error distribution interval, which takes into account the impact of the prediction error caused by new energy uncertainty and realizes the quantitative assessment of new energy power uncertainty, which helps improve the security and stability of the grid after the new energy is connected to the grid and promotes the new energy consumption of the grid. Our proposed method has a good application prospect. At present, the proposed method mainly uses the CLIQUE algorithm to analyze the new energy output uncertainty. In the future, artificial intelligence technology will be introduced to study the effect of its application in the field of new energy output uncertainty assessment.
Data availability statement
The datasets presented in this article are not readily available because the datasets are collected from the actual grid and are subject to external confidentiality requirements according to company regulations. Requests to access the datasets should be directed to BC, Y2hlbmJpbmdzb25nQHNnZXByaS5zZ2NjLmNvbS5jbg==.
Author contributions
BC: conceptualization, data curation, formal analysis, investigation, methodology, and writing–original draft. YW: conceptualization, funding acquisition, methodology, resources, and writing–review and editing. LW: funding acquisition, resources, supervision, and writing–review and editing. ZH: data curation, project administration, and writing–review and editing.
Funding
The author(s) declare that financial support was received for the research, authorship, and/or publication of this article. This research was funded by the National Key Research and Development Program Project (Graph Computing Analysis and Optimization Software for Ultra-Scale Grid Equipment Nodes, 2022YFB2404200).
Conflict of interest
Authors BC and YW were employed by NARI Technology Co., Ltd. Authors LW and ZH were employed by State Grid Jiangsu Electric Power Co., Ltd.
Publisher’s note
All claims expressed in this article are solely those of the authors and do not necessarily represent those of their affiliated organizations, or those of the publisher, the editors, and the reviewers. Any product that may be evaluated in this article, or claim that may be made by its manufacturer, is not guaranteed or endorsed by the publisher.
References
Bludszuweit, H., Dominguez-Navarro, J. A., and Llombart, A. (2008). Statistical analysis of wind power forecast error. IEEE Trans. Power Syst. 23, 983–991. doi:10.1109/tpwrs.2008.922526
Caixia, T., Zhongfu, T., Zhe, Y., Yujie, W., Shiping, G., and Lei, P. (2023). Study on grid price mechanism of new energy power stations considering market environment. Renew. Energy 203, 177–193. doi:10.1016/j.renene.2022.12.065
Changjiu, Z., Tiejun, Z., Mengmeng, R., Ye, T., Xiaoying, X., and Yiguo, N. (2020). Voltage analysis of electric heating and photovoltaic scale access to low-voltage agricultural networks. J. Power Syst. Automation 32, 40–48. doi:10.19635/j.cnki.csu-epsa.000498
Chao, D., Yu, W., Changyun, W., Yan, X., and Pengfeng, L. (2021). Distributed resilient control for energy storage systems in cyber–physical microgrids. IEEE Trans. Industrial Inf. 17, 1331–1341. doi:10.1109/tii.2020.2981549
Chongqing, K., and Liangzhong, Y. (2017). Key scientific issues and theoretical research framework of high percentage renewable energy power system. Power Syst. autom. 41, 3–11.
Dong, Y., Chao, D., Changyun, W., and Wei, W. (2023). Finite-time distributed resilient tracking control for nonlinear MASs with application to power systems. IEEE Trans. Automatic Control, 1–16. doi:10.1109/TAC.2023.3332777
Gengsheng, D., Chengqi, L., and Yan, X. (2008). Research and implementation of CLIQUE clustering algorithm based on grid and density. Comput. Mod. 12, 8–11.
Guangyi, L., Kewen, L., and Di, S. (2017). Graph computation and its applications in smart grid. Honolulu, USA: IEEE International Congress on Big Data, 507–510. doi:10.1109/bigdatacongress.2017.75
Guangyi, L., Renchang, D., Yi, L., Kewen, L., Zhiwei, W., Chen, Y., et al. (2020). Development of real-time network analysis application for energy management system based on graph computing. J. Electrotechnol. 35, 2339–2348. doi:10.19595/j.cnki.1000-6753.tces.190901
Houming, J., Hao, S., and Zhen, K. (2012). A fast power network topology analysis method based on graphical database. Comput. Syst. Appl. 21, 173–176.
Huajie, D., Zechun, H., and Yonghua, S. (2012). Stochastic optimization of the daily operation of wind farm and pumped-hydro-storage plant. Renew. Energy 48, 571–578. doi:10.1016/j.renene.2012.06.008
Jinghua, Y., Jiang, C., Zhi, C., and Yuxuan, L. (2022). “The optimal decision-making method of planned outage and demand side management based on the confidence interval of new energy prediction,” in 2022 4th International Conference on Power and Energy Technology (ICPET), Beijing, China, July 28-31, 2022, 944–951. doi:10.1109/icpet55165.2022.9918508
Lingling, S., Meichao, Z., Ning, W., Qingquan, J., and Guangyu, D. (2018). Research on access capacity of distributed photovoltaic power generation based on voltage deviation opportunity constraint. J. Electrotechnol. 33, 1560–1569. doi:10.19595/j.cnki.1000-6753.tces.170185
Lu, J., and Zhang, L. (2020). Data mining technology of computer testing system for intelligent machining. Neural Comput. Appl., 1–11. doi:10.1007/s00521-020-05369-6
Sicheng, W., and Weiqing, S. (2023). Capacity value assessment for a combined power plant system of new energy and energy storage based on robust scheduling rules. Sustainability 15, 15327. doi:10.3390/su152115327
Tan, C., Tan, Z., Yin, Z., Wang, Y., Geng, S., and Pu, L. (2023). Study on grid price mechanism of new energy power stations considering market environment. Renew. Energy 203, 177–193. doi:10.1016/j.renene.2022.12.065
Tewari, S., Geyer, C. J., and Mohan, N. (2011). A statistical model for wind power forecast error and its application to the estimation of penalties in liberalized markets. IEEE Trans. Power Syst. 26, 2031–2039. doi:10.1109/tpwrs.2011.2141159
Weimin, M., Yaozhong, X., Guodong, J., Dandan, X., Junliang, L., Zhibin, M., et al. (2013). A comparative analysis of the grid model exchange standards CIM/E and CIM/XML China. Grid Technol. 37, 936–941.
Xiangxiang, Q., and Dengsheng, L. (2012). A new outlier mining method based on CLIQUE in multi-database. Adv. Mater. Res. 532, 959–963. doi:10.4028/www.scientific.net/amr.532-533.959
Yaozhong, X., Hongzhu, T., Yisong, L., and Junjie, S. (2006). Power system data model description language. E. Power Syst. Autom. 10, 48–51+92.
Yuning, L., and Bingbing, F. (2022). Overview of the development of graph databases. Comput. Syst. Appl. 31, 1–16. doi:10.15888/j.cnki.csa.008713
Yutong, H. (2020). “Uncertainty analysis of photovoltaic power generation and its interval prediction study,” (Beijing: North China Electric Power University). [dissertation]. doi:10.27140/d.cnki.ghbbu.2020.000485
Zhang, X., and Shen, J. (2024). Master–slave game operation scheduling strategy of an integrated energy system considering the uncertainty of wind and solar output. Front. Energy Res. 11, 1291728. doi:10.3389/fenrg.2023.1291728
Zheng, C., Junbo, Z., Ge, C., and Zhihao, C. (2022). Construction and application of CIM/XML of power grid based on RedisGraph. Electr. Power Inf. Commun. Technol. 20, 1–8. doi:10.16543/j.2095-641x.electric.power.ict.2022.04.001
Zhi, C., Qiang, D., Dan, X., Chi, Z., and Yi, S. (2020). “Generation schedule considering branch security check under new energy access,” in 2020 IEEE Sustainable Power and Energy Conference (iSPEC), Chengdu, China, 23-25 November 2020, 331–336. doi:10.1109/ispec50848.2020.9351051
Zhiyu, L., Tao, W., Zhiqiang, W., Jingxiang, L., and Jiuye, Z. (2022). “Research and application of optimization strategy for new energy on-grid consumption capacity,” in 2022 9th International Forum on Electrical Engineering and Automation (IFEEA), Zhuhai, China, November 4-6, 2022, 736–739. doi:10.1109/ifeea57288.2022.10038079
Keywords: new energy generation, graph database, uncertainty, prediction error, clustering in quest algorithm
Citation: Chen B, Wang Y, Wei L and Hu Z (2024) Quantitative assessment method of new energy output uncertainty based on the prediction error. Front. Energy Res. 12:1372465. doi: 10.3389/fenrg.2024.1372465
Received: 18 January 2024; Accepted: 13 March 2024;
Published: 26 March 2024.
Edited by:
Yu Huang, Nanjing University of Posts and Telecommunications, ChinaReviewed by:
Chao Deng, Nanjing University of Posts and Telecommunications, ChinaHaixiang Zang, Hohai University, China
Copyright © 2024 Chen, Wang, Wei and Hu. This is an open-access article distributed under the terms of the Creative Commons Attribution License (CC BY). The use, distribution or reproduction in other forums is permitted, provided the original author(s) and the copyright owner(s) are credited and that the original publication in this journal is cited, in accordance with accepted academic practice. No use, distribution or reproduction is permitted which does not comply with these terms.
*Correspondence: Yi Wang, d2FuZy15aTJAc2dlcHJpLnNnY2MuY29tLmNu