 Oscar A. Bustos-Brinez
 Alvaro Zambrano-Pinto1
 Javier Rosero Garcia
- 1EM&D Research Group, Electrical and Electronics Engineering Department, Faculty of Engineering, Universidad Nacional de Colombia, Bogotá, Colombia
- 2MindLab Research Group, Systems and Industrial Engineering Department, Faculty of Engineering, Universidad Nacional de Colombia, Bogotá, Colombia
With the continued growth of smart grids in electrical systems around the world, large amounts of data are continuously being generated and new opportunities are emerging to use this data in a wide variety of applications. In particular, the analysis of data from distribution systems (such as electrical substations) can lead to improvements in real-time monitoring and load forecasting. This paper presents a methodology for substation data analysis based on the application of a series of data analysis methods aimed at three main objectives: the characterization of demand by identifying different types of consumption, the statistical analysis of the distribution of consumption, and the identification of anomalous behavior. The methodology is tested on a data set of hourly measurements from substations located in various geographical regions of Colombia. The results of this methodology show that the analysis of substations data can effectively detect several common consumption patterns and also isolate anomalous ones, with approximately 4% of the substations being identified as outliers. Therefore, the proposed methodology could be a useful tool for decision-making processes of electricity distributors.
Introduction
The incorporation of Smart Grids to electrical networks allows a wide variety of innovations in their management, both in terms of grid infrastructure and information processing, with the primary goal of ensuring a more reliable and efficient supply of electricity to end users while lowering costs and potential risks to operators (Dileep, 2020). The infrastructure that supports Smart Grids, known as Advanced Metering Infrastructure (AMI), includes on-site metering devices (located at transmission lines, distribution nodes, and end users), communication networks to connect such devices, and servers that store the data that is being continuously generated. While the analysis of these amounts of data poses significant challenges in terms of computing power and economic investment, the insights obtained from such process can be used in multiple ways to improve the overall operation of the network (Chakraborty and Sharma, 2016). Various applications have been developed based on data generated by Smart Grids (Bhattarai et al., 2019), including, among many others, real-time optimization of power distribution from generators (Paul et al., 2023), reduction of prices through tariff schemes adapted to consumption (Aurangzeb et al., 2021), assessments of the integration of renewable energy sources given their inherent variability (Mostafa et al., 2022; Paul, 2022), and “demand response”, a mechanism designed to increase the stability of the network through changes at times of peak consumption through strategies such as user incentives or automated monitoring (Siano, 2014; Siddiquee et al., 2021).
Integrating Smart Grids into existing power networks is a complex and expensive process that faces significant and varied challenges in both developed and developing countries. In particular, in the case of Colombia, the growth of Smart Grids has been accompanied by a notable increase in the country’s overall electricity demand and a boost to the diversification of Colombian energy sources, mainly hydroelectric and wind power (Colmenares Quintero et al., 2022). As a result, intelligent management of energy demand and distribution has become a priority for utilities and government agencies responsible for overseeing nationwide and regional distribution and regulating the Colombian energy market (Giral Ramírez et al., 2017; Téllez Gutiérrez et al., 2018). The adoption of AMI systems in the Colombian power grid has been gradually reaching different levels of the network, including end users and power distribution substations, that serve limited areas such as small towns or neighborhoods of a large city (Garcia-Guarin et al., 2019). However, the challenging geographical conditions of Colombia, a highly mountainous country with a wide variety of climates, have limited the development of reliable communication networks and the integration of small local grids (Echeverri Martínez et al., 2020), which constraint the expansion of Smart Grids throughout the country (Molina C et al., 2019).
In scenarios such as the Colombian power network, where Smart Grids are still expanding and have relatively low capabilities, grid operators and other stakeholders are looking for fast and undemanding ways to process the data generated by the network and obtain meaningful information. Therefore, this paper proposes a methodology focused on the analysis of data from electrical substations, so that its results are centered around geographic areas rather than individual users and thus allowing the results to be more focused on regional electrical distribution. The methodology comprises three stages of data processing: dimensional reduction, consumption characterization through clustering, and statistical analysis through density estimation. The results of these three processes (each involving two different methods) include the segmentation of different substation consumption behaviors and the identification of the most common and rarest consumption profiles, that is, the detection of rare or anomalous behaviors. Our proposal is tested by using a series of three data sets provided by three Colombian grid operators, that contain hourly active power measurements made by AMI devices located at 394 electrical substations, covering a period between 2019 and mid-2022. Our methodology is a lightweight, easy-to-implement alternative, suitable for small grid operators; we prove it is able to quickly identify the most frequent behaviors in daily electrical consumption on substations, and also to isolate unexpected or infrequent patterns. The main contributions of this work can be described as:
I. The formulation of a comprehensive methodology for the analysis of electricity consumption measurements in substations. This methodology is composed of data preprocessing, dimensional reduction analysis, segmentation analysis and density estimation analysis. For each of these analyses, two different methods are applied in order to guarantee the robustness of the results.
II. The application of the proposed methodology on three data sets made up of consumption measurements in electrical substations in different regions of Colombia, that shows it is capable of finding common and anomalous behaviors in multiple ways. Since the methodology is composed of different data analysis methods, the results of each are presented in the form of plots and compared using performance metrics.
III. A comparison of the main results obtained for the data sets, highlighting differences and similarities between the three scenarios, and establishing the main advantages of the proposed methodology, together with some possible areas for improvement.
The structure of this paper is as follows: Section 2 provides an overview of related work on worldwide cases of Smart Grids and AMI implementation, as well as a literature review of the most commonly used techniques for analyzing data generated by Smart Grids. Section 3 gives a view of the characteristics of the data sets and presents the framework in which the selected data analysis methods are applied, establishing the order in which they are applied. The results of this process on the data from the three grid operators are presented in Section 4, and the conclusions of the work are presented in Section 5.
Background and related work
Smart Grids overview
Classic power grids, originally designed to distribute power from a few generating hubs to a large number of end users, are currently in dire need of change. The pressure to improve the power grid system can be traced, among other issues, to its inefficiency and environmental footprint, a notable increase in electricity demand in recent years, and the growing importance of less reliable energy sources like renewables (Muench et al., 2014). Increasingly sudden fluctuations in energy supply and demand require efficient and rapid control of power distribution to maintain acceptable levels of quality and reliability. Smart Grids promise to address these challenges, enabling precise and efficient control of large areas of the grid (Berger and Iniewski, 2012), addressing peak demand and other load issues (Bhattarai et al., 2019), allowing a precise management of renewable energy sources (Paul, 2022; Li et al., 2020; Saxena et al., 2021), and giving greater flexibility to address the rising demand of electric mobility, such as electric vehicles and ships (Ismail et al., 2023; Kumar and Panda, 2023).
Smart Grids and AMI infrastructure have been implemented over the last decade in different regions of the world with varying degrees of success. An interesting example of Smart Grids development was presented as part of the implementation of a smart cities scheme in Sydney, Australia between 2009 and 2014. This process was relatively successful, but was also held back by high costs, regulatory issues and poor government leadership (Lovell, 2020). At national level, although there have been serious investments in smart metering and renewable sources, other issues had emerged, including the low levels of grid integration and communication problems in remote areas (Haidar et al., 2015). A more optimistic case is China, where the government’s push for energy efficiency has allowed an accelerated development of smart grid implementation in large areas, albeit with poorly defined horizons and an outdated, fossil-fuel based network that is not well suited to the requirements of Smart Grids (Yu et al., 2012). In the case of Europe, the regulatory frameworks of the European Union have promoted a series of programs that seek standardization among operators in different countries. The geographic and economic particularities of each region make it difficult to draw general conclusions (Fotis et al., 2022), but the most successful projects have been developed following the smart cities paradigm, integrating Smart Grids with transport and water management in large and mid-sized cities across Europe (Farmanbar et al., 2019).
Regarding the implementation of Smart Grids in developing countries, two paradigmatic cases are those of India and Brazil. In the first case, the obsolescence of the country’s electricity grid and the reluctance of consumers to the high costs of AMI meters have been progressively solved through the development of a clear regulatory framework and a strong collaboration between the Indian government and industry organizations (Kappagantu and Daniel, 2018; Asaad et al., 2021). In the second case, Brazil has an electricity grid based on renewable sources, and regulators are the main drivers for the implementation of smart grids in the country to manage the grid efficiently and detect energy losses and illegal connections. The vast and challenging geography, the lack of strong investment in modernization and the technological lag are cited as the main challenges (Di Santo et al., 2015).
Among the challenges that are often common in these cases, it is important to recall those related to leveraging the data obtained as a result of Smart Grid deployment. Although these data have the potential to provide valuable insights for network operators, their exploitation on a large scale is generally difficult and presents several important issues (Mohamed et al., 2019). Data is generated continuously and in large volumes, quickly overwhelming the capabilities of the information systems of the operators and preventing effective analysis; in addition, it is often difficult to integrate data from different operators and from multiple local grids, which hinders the formulation of nationwide conclusions (Bhattarai et al., 2019; Tu et al., 2017). This represents a long-term loss of value, both for companies that could better understand the consumption patterns of their users, and for government agencies interested in formulating more efficient energy distribution policies (Moreno Escobar et al., 2021).
Data analysis methods on Smart Grids
With the development and growth of Smart Grids, processing the data they generate has become one of the main sources of information for electric grid managers. The results of data analysis can be applied to problems such as demand response, identification of profiles or prediction of consumption or long-term costs, among others (Bustos-Brinez et al., 2023). The data generated, however, are generated in large volumes and are increasingly complex, so they usually start with a pre-processing stage that includes data downsizing (Kotsiopoulos et al., 2021). In general, dimensional reduction makes it possible to obtain results with greater efficiency and improve visualization, at the cost of a small loss of information. One of the most commonly used techniques for this purpose is Principal Component Analysis (PCA), a method that constructs linear combinations of existing features by minimizing the loss of information measured by variance (Salem and Hussein, 2019). In the electricity sector, this technique and its variations have been used as part of analysis schemes aimed at managing demand response (Kafash Farkhad and Akbari Foroud, 2023) or detecting IT security breaches in the data generated by Smart Grids (Acosta et al., 2020).
Once data reduction has been performed, there are a large number of applications in which different combinations of methods are used for various purposes. Some of these applications focus, for example, on the identification of load profiles. In this area, the preferred methods are clustering techniques, that aim to segment the data into a series of groups (called “clusters”) such that the data in each group are similar to each other and very different from those in other groups (Si et al., 2021). The most well-known clustering algorithm is K-Means, a distance-based method that constructs a previously defined number of clusters in such a way that minimizes their inner variances by centering each cluster around a central point known as “centroid”. The predefined number of clusters (denoted as
Another commonly used clustering method is called Density-based Spatial Clustering of Applications with Noise (DBSCAN), a method that allows the construction of clusters of highly variable sizes and determines some rare or anomalous values that might not belong to any group. The method relies on the definition of dense areas through the revision of the neighborhoods of data points; this depends on two parameters, the size of the considered neighborhood (determined by a parameter called
There are many other types of data analysis methods that are used in different applications of Smart Grids. In the area of load forecasting, dimensional reduction can be accompanied by regression models [(Mukherjee et al., 2021)-MU1] or classification models such as Support Vector Machines (Ayub et al., 2020). The analysis of the best physical location of devices storing Smart Grid data can be performed with optimization models on graphs (Gallardo et al., 2021). Detection of cybersecurity weaknesses or data injection attacks can be addressed by mechanisms such as neural networks and deep learning [(Vimalkumar and Radhika, 2017; Mukherjee et al., 2022)-MU2], and other unwanted network intrusions, such as power theft, can be addressed through the combination of clustering methods like DBSCAN with density estimation methods like Gaussian Mixtures (Zheng et al., 2017). The latter method is based on the assumption that the data come from a series of normal distributions that may or may not be correlated, and whose parameters are found by the model. The base assumption is the number of different gaussians that make up the distribution. A Gaussian Mixture model similar to the previous one is also used in the area of electric mobility for the identification of load profiles and flexibility analysis, making an analogy between the different gaussians and the groups obtained by clustering models (Märtz et al., 2022).
Finally, some models are used in the area of renewable energies, including the identification of energy generation profiles and their contrast with consumption profiles (Miguel et al., 2016) or the analysis of the distribution of solar energy generation in different geographical areas using density estimation (Bouhorma et al., 2023). In the latter case, where the density presents forms with multiple modes that are difficult to analyze analytically, the algorithm chosen is Kernel Density Estimation (KDE), which constructs a non-parameterized distribution from the sum of the contributions of each data point, measured through a transformation function called a kernel. The distributions obtained with this method, although they do not have an analytical form, are capable of modeling a wide variety of complex scenarios (Hu et al., 2021).
Methodology
A graphical summary of the stages of the proposed methodology and the models included in each stage is presented in Figure 1. By sequentially applying these analysis methods, a series of approximations to the cluster segmentation and probabilistic distribution of the data are constructed. These results are combined to create a robust model of substation consumption that takes into account the different types of behaviors that can occur and separates them into different groups, and also captures the general distribution of the data to point out the most common and most anomalous behaviors. Next, we present a detailed description of the steps performed at each stage.
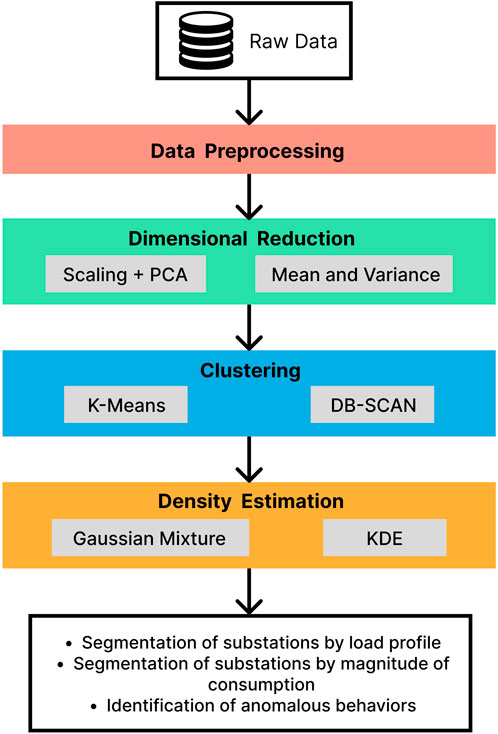
Figure 1. Structure of the proposed methodology. It consists of four stages: data pre-processing, dimensional reduction, clustering analysis and density estimation. The main results obtained through its application to electrical substation data are also presented.
Data preprocessing
The expected input to the methodology is a set of AMI measurement records containing at a minimum information on the substation where the measurement is taken, the date and time of the measurement, and the value of the measurement. Measurements should be taken every hour continuously, so that substations have records associated with each of the 24 h of the day. Under these conditions, a substation is discarded for further analysis if it has missing or null measurements. For substations with complete measurements, their associated records are preprocessed according to the scheme proposed in (Bustos-Brinez et al., 2023), with the aim of summarizing the consumption of the substations in average load profiles. For each substation considered, all its associated records are isolated and then divided into 24 groups, each one corresponding to the hour of the day (from 0 to 23) in which the measurement was taken. The average values of these 24 groups are obtained and then collected in a load profile corresponding to a vector of dimension 24, where the first value corresponds to the average of the measurements of hour 0, the second value to the average of the measurements of hour 1, and so on until hour 23. In this way, each substation ends up being represented by a load curve made from the averages of its records for each hour of the day.
Dimensional reduction
Once the average load curves have been constructed, each substation is represented by 24 values that depict its average consumption behavior throughout the day. However, not all of these values carry the same amount of information, or some of them can be seen as redundant in some cases. Therefore, in order to maximize the efficiency of subsequent analyses (both in terms of processing time and use of computational resources), it is important to establish how many values are sufficient to analyze the consumption behavior with a small loss of information. Two approaches are chosen for this purpose, considering the examples given in (Duarte et al., 2022) (where dimensional reduction is also stated as a powerful tool for graphical representation of high-dimensional data). The first approach involves a MinMax scaling, which transforms the values in the profiles to the range
Profile characterization
Since two-dimensional reduction approaches are applied, which generate two alternative representations for each substation, there is a separate analysis for each one of them. The two-dimensional representations are used to identify and isolate different electricity consumption behaviors, in a similar fashion to market segmentation. In particular, it is desired to find behaviors that can be associated with different types of end-users, distinguishing between Residential, Commercial and Industrial load profiles. In (Di Santo et al., 2015), these are identified as follows: Residential users tend to show low consumption in the early morning and peaks in the afternoon or evening, Commercial users have high consumption in the afternoon and lower consumption in the morning and evening, and Industrial users show a more uniform consumption through all the day. Figure 2 shows some of the expected patterns for each user type, representing profiles as 24-h plots.
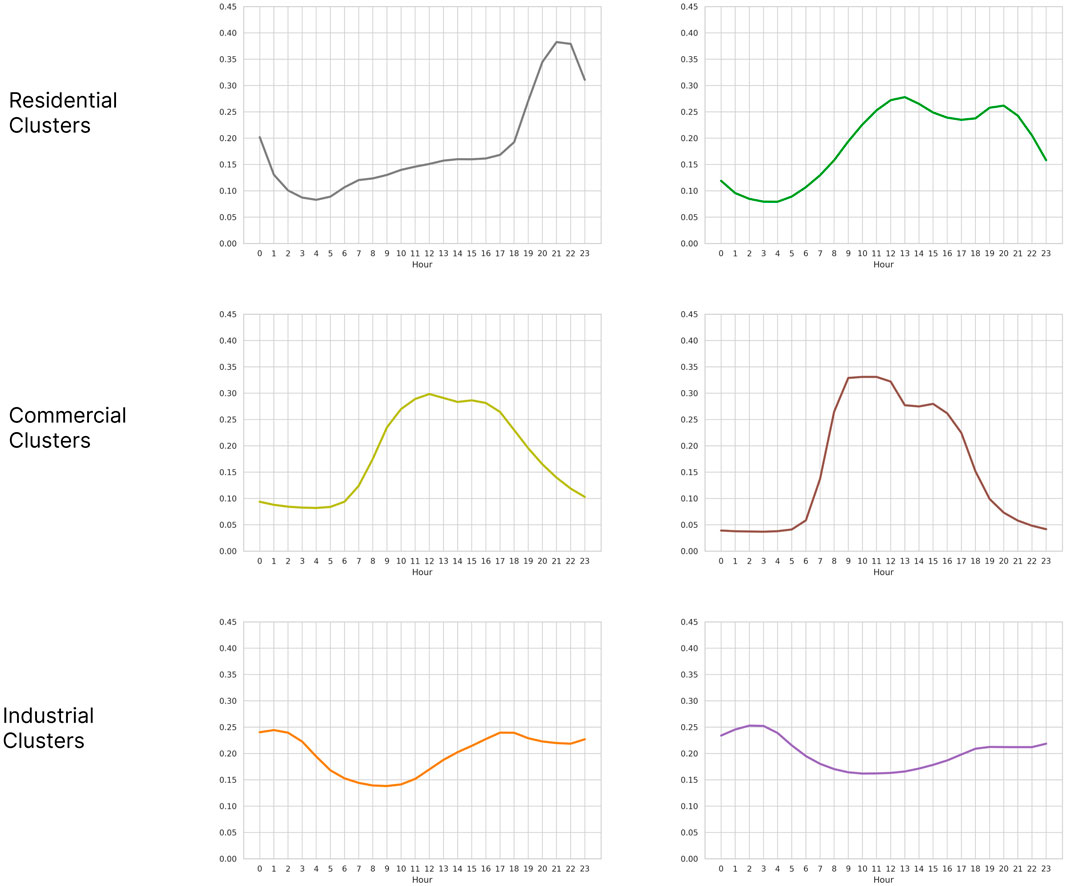
Figure 2. 24-h plots of some behaviors associated with different types of end users. In general, Residential users show low consumption in the morning and spikes in the afternoon or evening, Commercial users show more consumption in the afternoon and less in the night, and Industrial users tend to have stable consumption throughout the day. The plots have been generated using data from (Bustos-Brinez et al., 2023).
In this stage, two different methods are selected to perform the segmentation of profiles into clusters: DBSCAN and K-Means. These methods depend on a set of hyperparameters that strongly influence the quality of the results. Most of these parameters are set to default values (suggested by the Scikit-Learn Python implementation), leaving only some to be optimized by a grid search process. For DBSCAN, the selected hyperparameters are eps (searched between 0.10 and 0.25 with steps of 0.01) and min_samples (searched from 2 to 5). In general, small values of eps lead to the formation of a larger number of smaller clusters. For K-Means, the main hyperparameter is k, the number of clusters, searched from 3 to 10.
Consumption distribution
In this last stage, the goal is to build a statistical model of the data that helps to identify the most common behaviors exhibited by the substations and allows to perform density estimation and other statistical tests. This statistical model is set up to emulate a density function for the data points, that is, to have higher values in regions where data points appear densely packed and lower values in regions where data points are scarce. Since data points are represented as points in a plane, the density model can also be represented in a plane as a contour plot. The construction of this density model is done twice, choosing two different methods, commonly used for this task: Gaussian Mixture and KDE. Although other, more powerful methods can be used, we select these two methods because of their ease of implementation (both are available as part of the Scikit-Learn Python library) and their interpretability (for Gaussian Mixture, high-density regions are associated with a series of bivariate Gaussian distributions, and for KDE, the density of an area is made up of the weighted contributions of all nearby data points, resulting in higher densities where points lie in higher numbers). Similar to the previous stage, the two models are run separately, and there are a few hyperparameters that undergo grid search optimizations. For Gaussian Mixture, the selected hyperparameter is the number of components (that is, the different Gaussian distributions that compose the overall model), searched between 3 and 8. For KDE, with a fixed Gaussian kernel function, the selected hyperparameter is the bandwidth, a value that controls how much area the contribution of a data point is able to influence; the value of the bandwidth was searched between 0.10 and 0.50 with steps of 0.05 for PCA-based points, and between 0.10 and 0.30 with steps of 0.02 for mean-variance points.
One application of these models that is explored is the identification of the most infrequent data points (anomalies), under the assumption that these appear in low-density regions, and the rarer a data point is, the lower its density value is. These anomalies, due to their rarity, could indicate failures in energy distribution, errors/vulnerabilities in data collection or fraudulent consumption. To identify which points are anomalous and which are not, it is necessary to identify a boundary value, from which a separation between regions of high density and regions of low density can be established. This value usually depends on the number of anomalies assumed to be present in the data, or on a pre-specified percentage of anomalies; in this case, we look for thresholds that leave out a number of points similar to that identified by the segmentation methods. The values taken by the selected threshold in each scenario depend on the values of the contour lines in the density functions built by each model.
Results and analysis
Datasets
The proposed methodology has been tested against a group of four data sets provided by three operators of the Colombian power grid, located in different regions of the country. In total, the four data sets contain active energy measurements for 394 substations, and the number of substations in each data set can be seen in Table 1. In this work, only the records corresponding to the year 2021 will be taken into account, since each data set covers a different time period. All records in each data set share a common structure, containing an alphanumeric identifier of the substation assigned by the respective operator, the date of the measurement separated into year, month and day, the time of the measurement (since only one measurement is taken per hour) and the value of the respective measurement, which can be an integer or a float value depending on the operator.
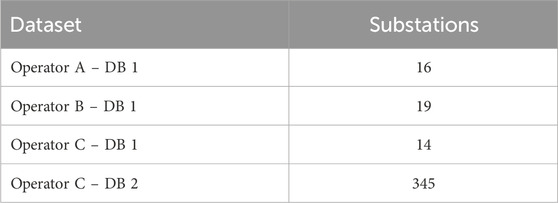
Table 1. Number of substations whose measurements are contained on each dataset.
The proposed methodology was implemented separately for each of the network operators; in this way it is possible to observe how the results change depending on whether there is a large or small amount of data. This analysis is possible because there is much more information available for one of the operators than for the other two. Since two different methods are applied at each stage, the outputs of each are shown for comparison.
Operator A
This grid operator delivered data from 16 grid substations, and its substations are located in the central region of Colombia.
MinMax Scaling and PCA
The first mechanism of dimensional reduction consists in the application of a MinMax scaling followed by the application of PCA. Figure 3 presents a summary of the results of the different methods applied on the data of Operator A, when starting with this method in the dimensional reduction phase. From these data points, the characterization stage is performed, using the two chosen clustering techniques. For DBSCAN, the selected parameters are
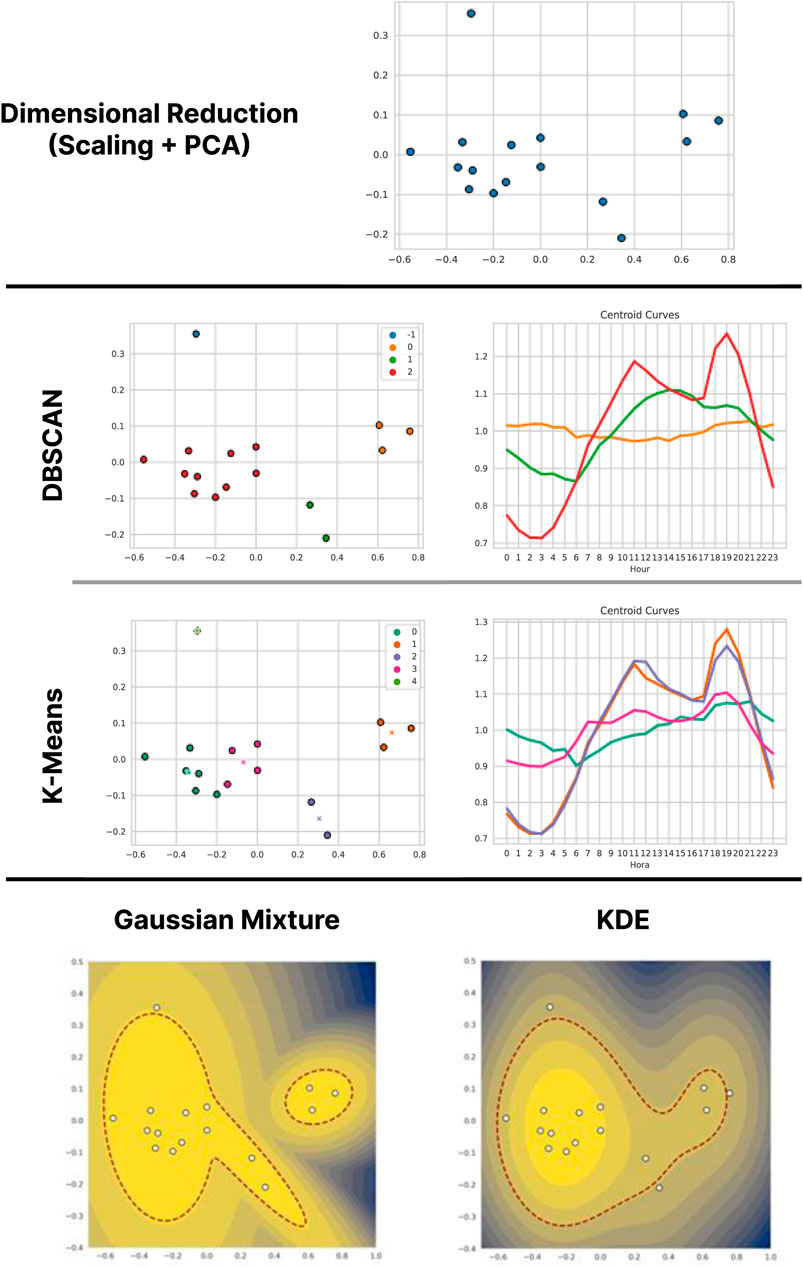
Figure 3. Results of the application of the methodology (with dimensional reduction by Scaling and PCA) on the data of Operator A.
In the final stage of the methodology, two different models for density estimation are applied to the data, which allow the identification of anomalous points. The first model is Gaussian Mixture; given the previous results of the clustering methods, it is decided to use three Gaussians. The last level in Figure 3 on the left shows the contour lines of the distribution constructed by the method, where warmer colors represent higher density. The three Gaussian distributions can be distinguished, although two of them overlap. The second density estimation model applied is KDE. The last level in Figure 3 on the left shows the distribution contour lines. The obtained approximation is mostly dominated by the Residential points. The red lines in the two plots represent the level curve corresponding to the separation threshold. In the case of Gaussian Mixture, only one anomalous point is left out, precisely the point that the clustering methods isolated. As for KDE, the separation threshold leaves out three points: the point isolated by the clustering methods, a Commercial type point and an Industrial type point.
Mean and Variance
The second dimensional reduction mechanism uses two main trend measures: the mean and the variance, which are more correlated with each other than the components obtained by PCA. Figure 3 shows the data points in a two-dimensional space where the mean and standard deviation (to keep the units the same) are the X and Y axes respectively. With this new representation of the data, we proceed with the characterization stage, using both DB-SCAN (with the same parameters
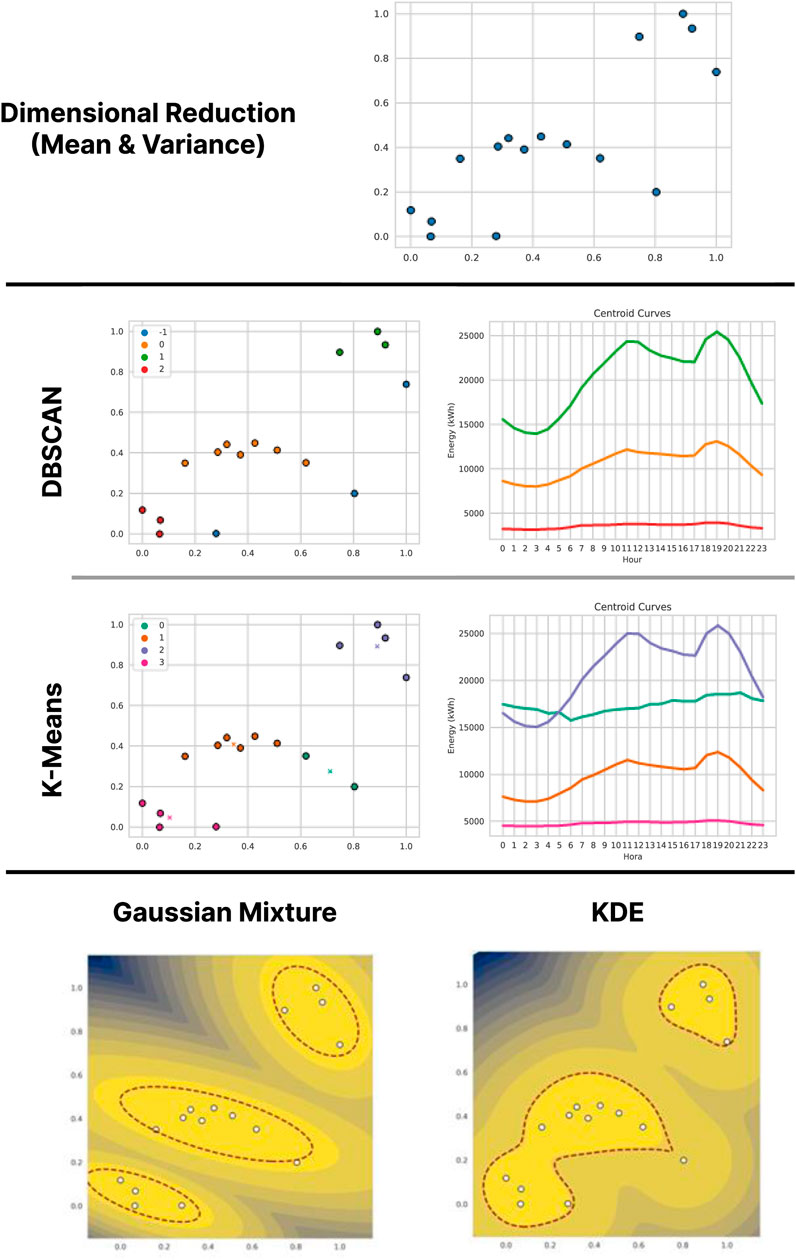
Figure 4. Results of the application of the methodology (with dimensional reduction by Mean and Variance) on the data of Operator A.
Finally, on this alternate representation of the data the density estimation models are applied. The results are shown in the last level of Figure 4. For the Gaussian Mixture model, three Gaussians were again used, which are clearly distinguishable and roughly correspond to the three clusters found by DBSCAN. Only one data point falls outside the separation threshold, one of the three previously detected by DBSCAN. As for KDE, the approximation obtained effectively separates data with high mean and variance values from data with lower means and variances. Again, the only point detected as anomalous is the same as with Gaussian Mixture. This point has a high mean and a very low variance, which could indicate that it corresponds to an Industrial type point, with high and constant energy consumption.
Results Comparison
For this operator’s data, the first dimensional reduction alternative (PCA) favors the distinction of the different types of consumption. Residential, Commercial and Industrial behaviors can be found represented by well-defined clusters, with Residential forming the majority group. The second alternative of dimensional reduction (Mean and Variance), proposes a characterization much more focused on the magnitude of consumption, in which the grouping methods coincide in separating the clusters by distinguishing between high, medium and low consumption. Between the two results it is possible to establish a relationship, presented in Figure 5, where the clusters obtained in the first analysis (with DBSCAN) are plotted on the points obtained in the second analysis. The more Industrial and Commercial substations show less variance for their mean (they are more to the right in their magnitude clusters) and the Residential ones show more variance (more to the left in their magnitude clusters). From this relationship, a strong correlation can be determined between the trend measures of a substation and its behavior, so it would be sufficient for the operator to obtain the mean and variance of the substation to approximately categorize its behavior.
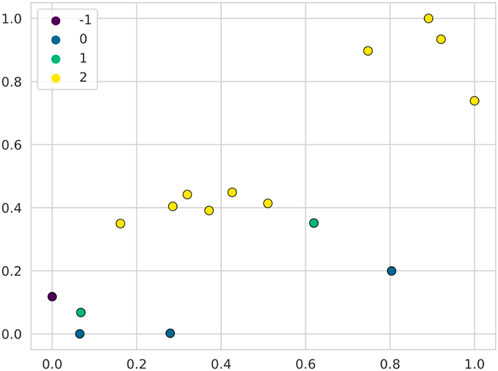
Figure 5. Comparison of results between the two analyzes carried out on the data of Operator A. The yellow dots correspond to the Residential cluster, the green ones to the Commercial cluster and the blue ones to the Industrial cluster. The outlier point is shown in purple.
The density estimation models also show some similarities. The different types of consumption can be approximately modeled by intermixed Gaussian distributions, since both models propose relatively similar distributions in which the contour lines present shapes similar to ellipses. However, the anomalies detected in each case correspond to different substations. When reducing by PCA, the outlier found is characterized by the high number of peaks in its load curve. When reducing by mean and variance, the outlier is detected due to its remarkably low variance for its mean, i.e., a very flat consumption curve. Both of these anomalous substations could be of potential interest to the network operator, as they could indicate unstable service performance or unexpected consumption variations.
Operator B
This grid operator delivered data for 19 network substations. These substations are located in the northwest region of Colombia.
MinMax Scaling and PCA
Figure 6 presents a summary of the results of the different methods on the data of Operator B, when starting with dimensional reduction by MinMax and PCA scaling. The application of DBSCAN (with the same parameters selected in the previous case) generates three clusters and three outlier points. The average consumption curves of each cluster show behaviors that are not so different from each other. Although all the curves present two peaks, one at noon and the other at 18 to 19 h, and the shapes of their curves point to a Residential profile, where the main distinction is in the magnitude of the noon peak. K-Means, applied to find
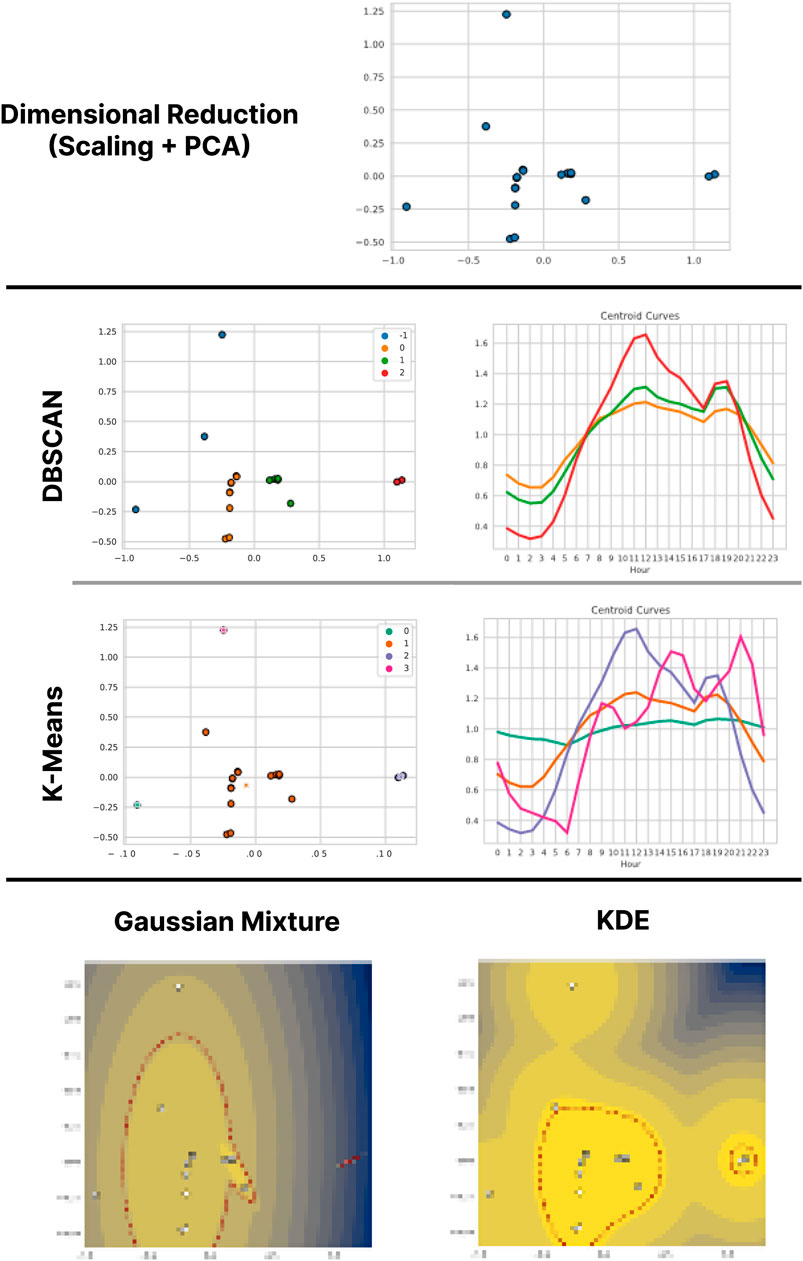
Figure 6. Results of the application of the methodology (with dimensional reduction by Scaling and PCA) on the data of Operator B
Regarding density estimation, the models coincide in identifying the two points isolated by K-Means as anomalous. In the Gaussian Mixture model, the turquoise cluster of K-Means dominates the estimation, suggesting that the model indicates as more frequent the Residential behavior with moderate variations. On the other hand, KDE forms two well-defined high-density areas, which include the two large clusters found by K-Means. The three anomalous points indicated by the model are also the same as in DBSCAN; these coincidences between the two methods suggest that the KDE results may be a robust approximation for these data.
Mean and Variance
Figure 7 presents the results of the different methods on the data of operator B, using as new dimensions the mean and standard deviation of the consumption data. Again, it is observed that high values of mean usually imply high values of variance. DBSCAN identifies three clusters and a single outlier point, whose isolation is due more to its separation from other points than to having a very high or low variance for its mean. The three clusters obtained clearly correspond to low, intermediate and high consumption. The K-Means method, for which this time a value of
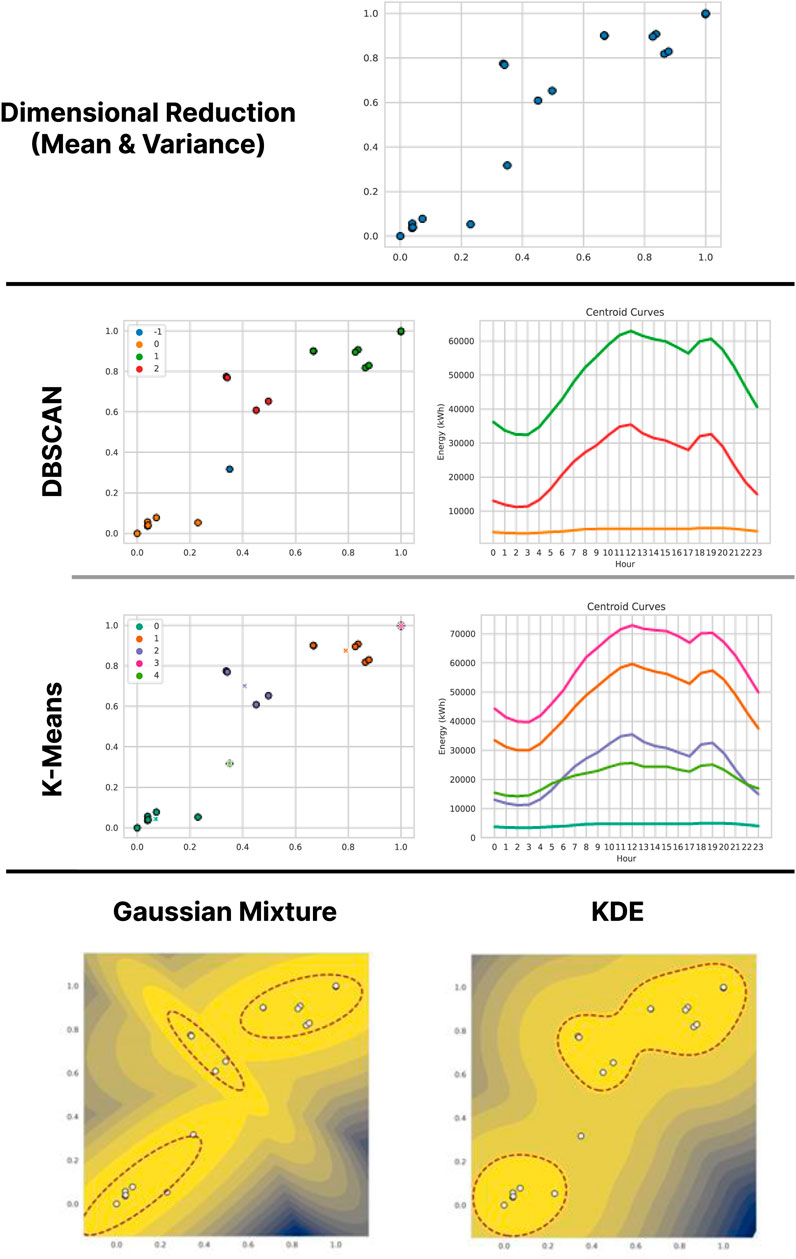
Figure 7. Results of the application of the methodology (with dimensional reduction by Mean and Variance) on the data of Operator B
In terms of estimation, the Gaussian Mixture model is much more aligned with the results of the clustering methods: the three Gaussians are very clearly distinguishable, and correspond to the DBSCAN clusters both in their range and in that the same point is detected as anomalous, albeit by little difference from the threshold value. The separation of this point is much more marked in KDE, which also clearly distinguishes the three clusters found by DBSCAN even though the intermediate and high consumption clusters tend to be grouped together because of the similarity in their variances.
Results Comparison
The first dimensional reduction alternative (Scaling and PCA) was less effective to distinguish different types of consumption than for the previous analysis. This may suggest that the data from this operator present more similar behaviors among themselves, or that in each substation of this operator there is a high proportion of Residential users. The less common consumption profiles can be seen in the centroid curves found by K-Means in both cases, where the isolated points show profiles that tend towards Industrial or Commercial (although without leaving Residential). Other points that are isolated by the methods show either a high number of peaks and valleys, or intermediate consumption levels with very low variances.
Despite this apparent difference between the two analyses, a new relationship emerges when applying the clusters of the first analysis (with K-Means) on the points of the second analysis, as can be seen in Figure 8. The large central cluster of the first analysis with K-Means (marked in dark blue) encompasses precisely the points that appear to better follow a linear relationship between mean and standard deviation, and the anomalous ones correspond precisely to the points that deviate most from the trend, either up or down. This correlation between the mean and variance of a substation with the degree of anomaly of its behavior presents another tool to quickly detect if a substation is behaving strangely. Deviations from the central tendency can have different meanings, with upward deviation being associated with Commercial behavior and downward deviation with Industrial behavior.
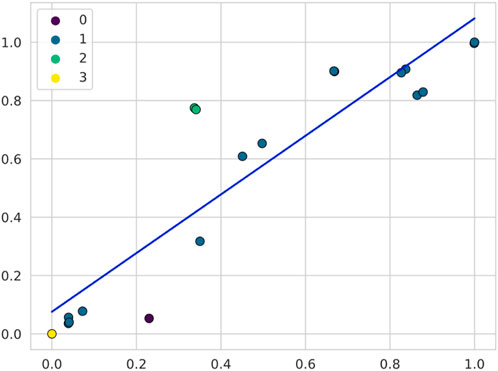
Figure 8. Comparison of results between the two analyses carried out on the data of Operator B. The points of colors other than blue indicate the behaviors indicated as strangest in the first analysis. A trend line is added to observe the relative separation of these points.
In addition, anomalous behaviors tend to appear more in consumptions with low means. The estimation models suggest that substations tend to exhibit Residential behavior with high magnitude but relatively smooth peaks, and that variances tend to be either very low or very high. Although the two estimation methods tend to agree, KDE has better identification of outliers. The results suggest that the operator could focus his attention on the substations where there are more abrupt changes in consumption (possible indicators of distribution instability) or on the isolated K-Means points in Figure 7, whose consumption has a similar profile to that of other substations but its magnitude is notably lower or higher, which could indicate a scenario of measurement disturbances or a possible energy loss.
Operator C
This grid operator delivered data from 359 network substations, located in the central and western regions of Colombia. During the pre-processing of this data, 24 substations were discarded due to the high number of null records they presented.
MinMax Scaling and PCA
Figure 9 presents the results of the different methods on the valid data of operator C, when starting with dimensional reduction by MinMax and PCA scaling. Unlike the previous cases, these data are much more numerous and much more concentrated in a central area. When performing the DBSCAN application (where new parameter values were selected,
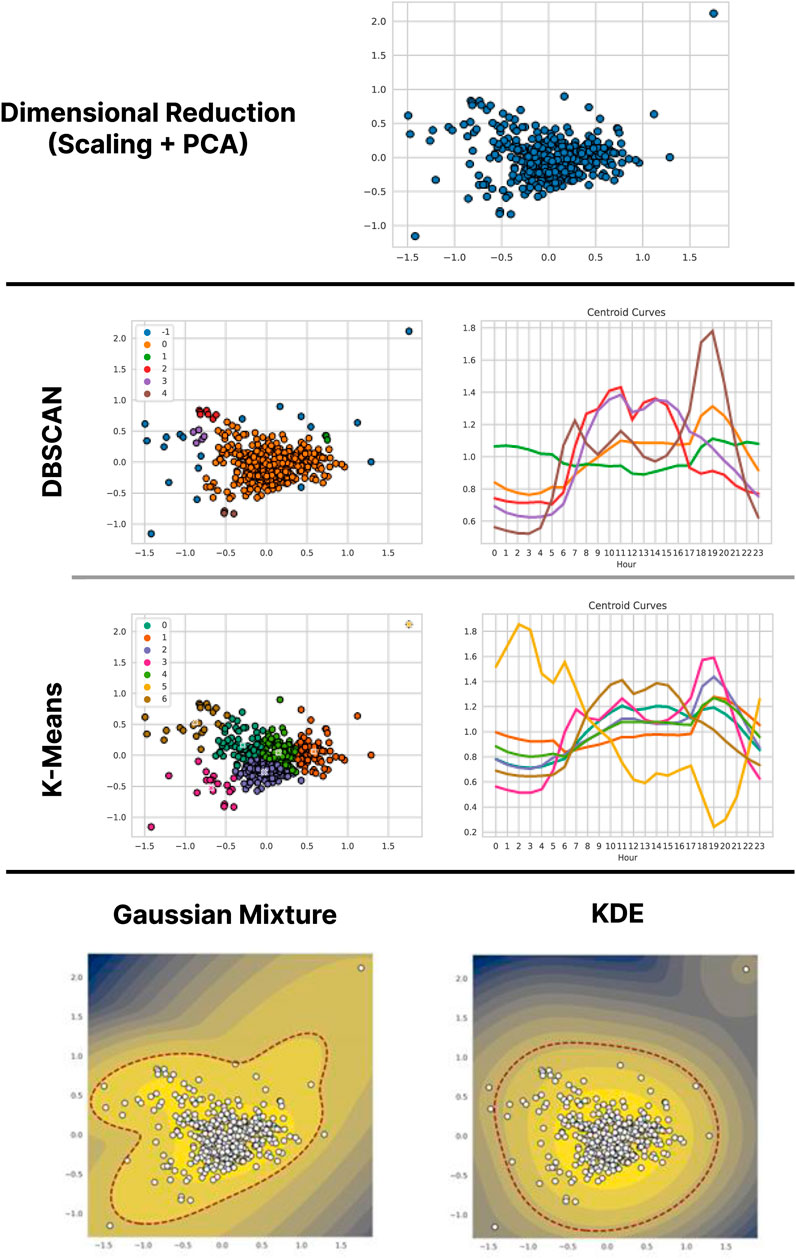
Figure 9. Results of the application of the methodology (with dimensional reduction by Scaling and PCA) on the data of Operator C.
For K-Means, a search of
The density estimation models tend to resemble each other much more closely than on previous occasions, with an area of high density dominated by the central cluster. In this case, the Gaussian mixture model uses five Gaussians, and the separation threshold leaves six points on the outside, only two of which are relatively far from the edge. However, these outside points tend to alter the shape of the distribution, causing large empty areas to remain inside the threshold. KDE, on the other hand, generates a distribution whose contour lines are more elliptical and much more centered on the main cluster; thus, the model leaves only four anomalous points, especially isolating the yellow point separated by K-Means.
Mean and Variance
Figure 10 presents the results of the different methods on the C operator data, starting with dimensional reduction by mean and variance. The vast majority of the data have been concentrated in a large group of low mean and variance values, and the remainder are in a more dispersed group with high means and variances. Between the two groups there is only a single point. DBSCAN (with same parameters as before) gathers almost all points with low mean and low variance into one large central cluster, leaving only two small clusters and two outliers. For the high mean and high variance points, the method separates them into three clusters and leaves two more outliers. The intermediate point is also labeled as an outlier. For its part, K-Means (with parameter
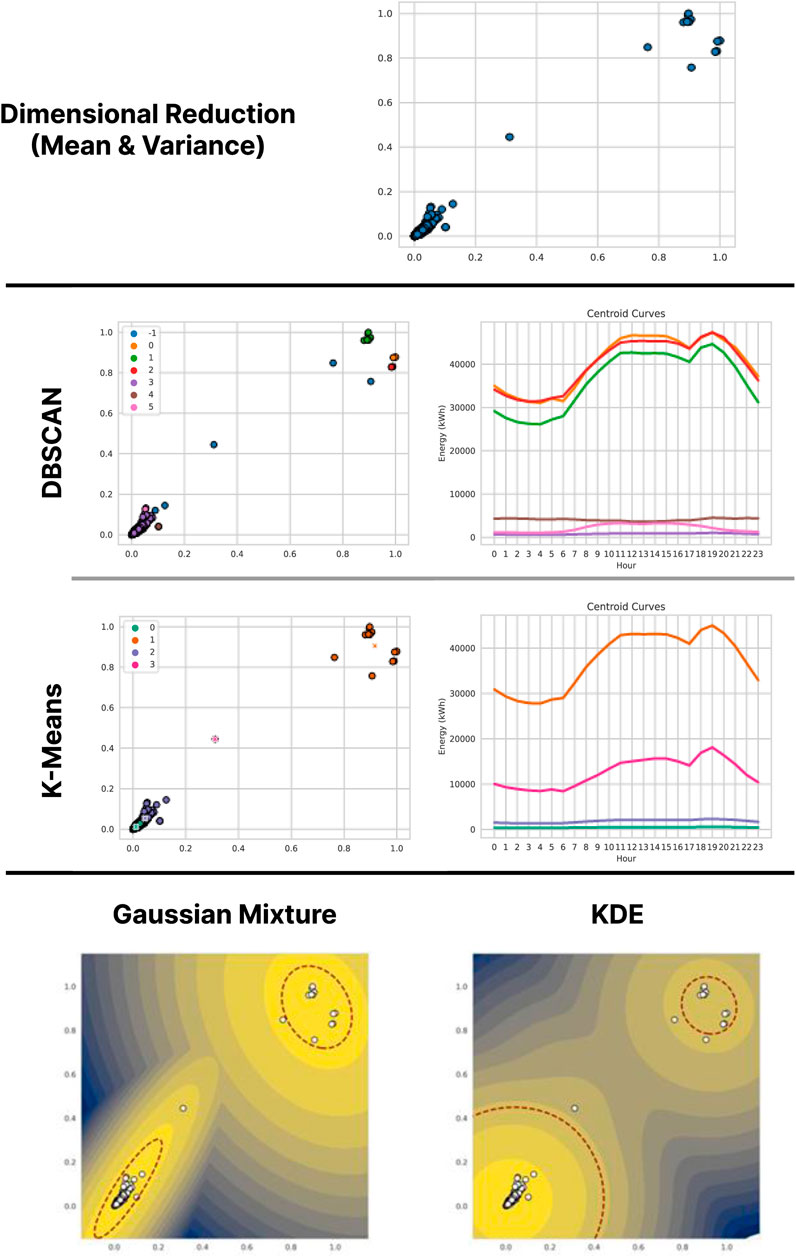
Figure 10. Results of the application of the methodology (with dimensional reduction by Mean and Variance) on the data of Operator C.
Both density estimation methods propose models that are more consistent with the separation proposed by K-Means, i.e., two areas of high density at opposite corners of the plots. The Gaussian Mixture proposal encircles almost all points in two Gaussians and leaves two points as anomalous. KDE gives greater prominence to the region of low mean and variance, which can be seen in the size of the area surrounded by the threshold curve, much larger there than in the other region. In this model, three points remain as anomalous.
Results Comparison
In contrast to the previous cases, the data from this operator presented an additional challenge to the methods. This was due to both the quantity and the distribution of the data. In terms of computational complexity, the methods showed slightly longer run times, as they encountered twenty times more points than in the previous cases. Furthermore, the points are not scattered as before, but highly concentrated in a small area. However, the points at the edges of this area show interesting behaviors that contrast openly with the points in its center, both in their profiles and in their magnitudes.
In terms of profiles, the methods suggest a higher frequency of Residential type behaviors, represented by a large central group (DBSCAN orange cluster). The divisions of this group found by K-Means show only slight variations of the consumption profile. At the edges of the main group, there are the more Commercial type profiles (appearing towards the left of the graph) and Industrial type profiles mixed with Residential (further to the right of the graph). This suggests that, in general, Residential profiles forms a large part of this operator’s consumption, being dominant in almost all substations. Only one substation presents a really different consumption from the others, suggesting the operator to review the electric service conditions in the corresponding area.
Regarding the magnitudes, the model finds two well differentiated groups, which roughly correspond to the two databases provided by the operator. The large separation between the two groups indicates that substation consumptions could be addressed in two different ways: high consumption substations, for example, could require a larger amount of equipment to guarantee service quality, or the operator could prioritize the construction of new distribution stations in their areas of influence.
By applying the clusters of the first analysis obtained by DBSCAN on the points of the second analysis, shown in Figure 11, it is observed that the linear trend found in operator B is approximately maintained. The Figure, for visual reasons, considers only the cluster of low means and variances. The large central cluster dominates the trend as it is much more numerous, and the smaller clusters and outliers tend to appear at the edges of the group, with the more Commercial clusters (in red and purple) above the trend line, while the more Industrial points (in green) appear below the line.
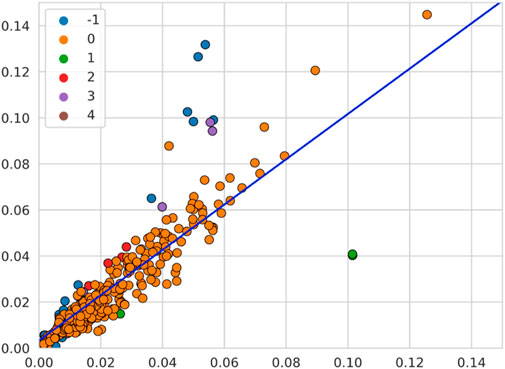
Figure 11. Comparison of results between the two analyses carried out on the data of Operator C. The orange points belong to the massive central cluster, and other colors represent minor clusters and outliers.
Models based on Gaussian Mixture tend to show large regions of high density (bright yellow) but the anomalous points appear to alter both the shape and size of the contour lines. This variability is an undesirable behavior in the models. In contrast, KDE results are much more robust, as these points have less impact and contour lines are clearly defined around the areas with more points. The latter model makes it possible to identify all those points that require attention by the operator, either because of their relatively strange profiles or because of the range of their average consumption.
Results discussion
The quality of the findings of the methodology on each case (particularly in terms of segmentation) have been measured by using three metrics: silhouette score, Davies-Bouldin score, and Calinski-Harabasz score, all of which are calculated using their respective implementations in Scikit-Learn Python library. The values of these metrics for each analysis are shown in Table 2, highlighting (in bold) the best metric for each operator (higher values for silhouette and Calinski-Harabasz score, lower values for Davies-Bouldin). Although the values of the metrics for each operator are pretty similar, regardless of the dimensional reduction strategy or clustering method being used, in all cases they seem to lean towards either PCA (the case for Operator A) or mean and variance (the case for operators B and C).
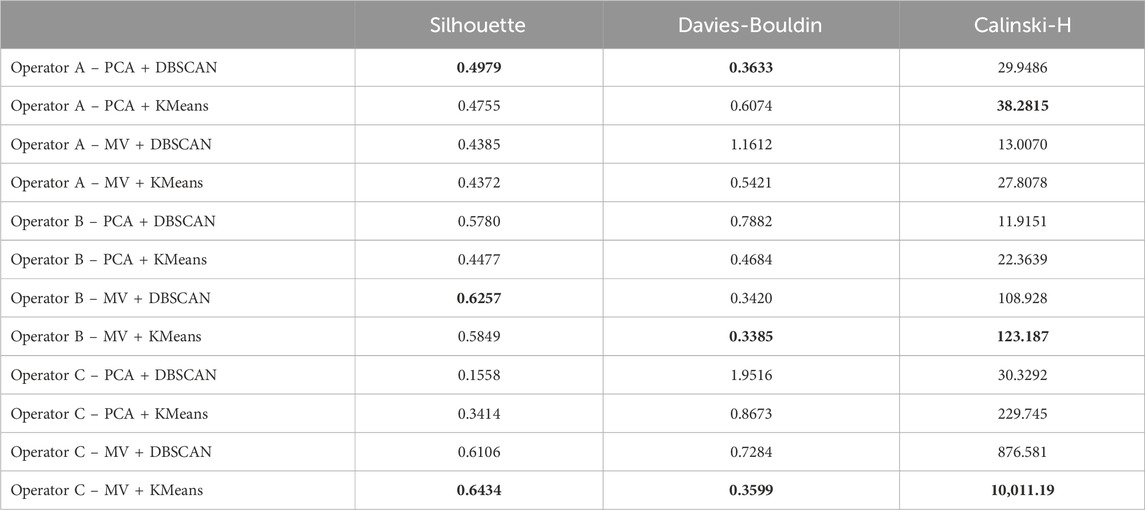
Table 2. Summary of performance metrics of the clustering methods in each application of the proposed methodology. The best value for each metric and dataset is highlighted in bold.
Since two of the operators provided information from less than twenty substations, the transformations of the data points achieved a high dispersion for both cases, which allowed the clear identification of distinct user profiles. This differentiation occurs both in the shape of the profile (identifying Residential, Commercial and Industrial profiles) and in its magnitude (clearly separating high, intermediate and low consumption). In contrast, the third operator provided data from more than three hundred substations, and the transformations generated in both cases a large and very dense central group with some scattered points at the edges. The average behavior of this central group (with residential and low magnitude consumption) contrasts with that of the smaller groups. However, all the analyses of the data provided by the operators are consistent in some elements, especially in the shapes of the profiles. Residential profiles tend to be similar for all operators and clearly dominate the majority of clusters, showing that users connected to the substations show this type of behavior much more frequently. Commercial and Industrial profiles from different operators are also similar to a lesser extent, suggesting that the clusters of profiles can be extrapolated to the entire territory of Colombia and serve as a national planning tool, especially when considering the hours of consumption peaks.
As for the estimation models, Gaussian Mixture tends to better model clusters with few points, while KDE is more robust for large clusters. Data points detected as anomalous by the methods (16 anomalous substations on all operators’ data from a total of 394) usually have consumption profiles with a large number of peaks and valleys in their curves and intermediate levels of consumption. Figure 12 shows the profiles of some of the anomalies identified by the multiple analyses, and although some of them appear to slightly correspond to one or other type of user (mainly Residential or Commercial), the peaks and falls of their profiles are much more abrupt and frequent than in other substations. Some of the anomalous substations appear to serve areas such as industrial parks or are located near hydroelectric sources. In other cases, the rare patterns could be related to sudden fluctuations, blackouts, illicit connections or other problems with the power supply or distribution infrastructure.
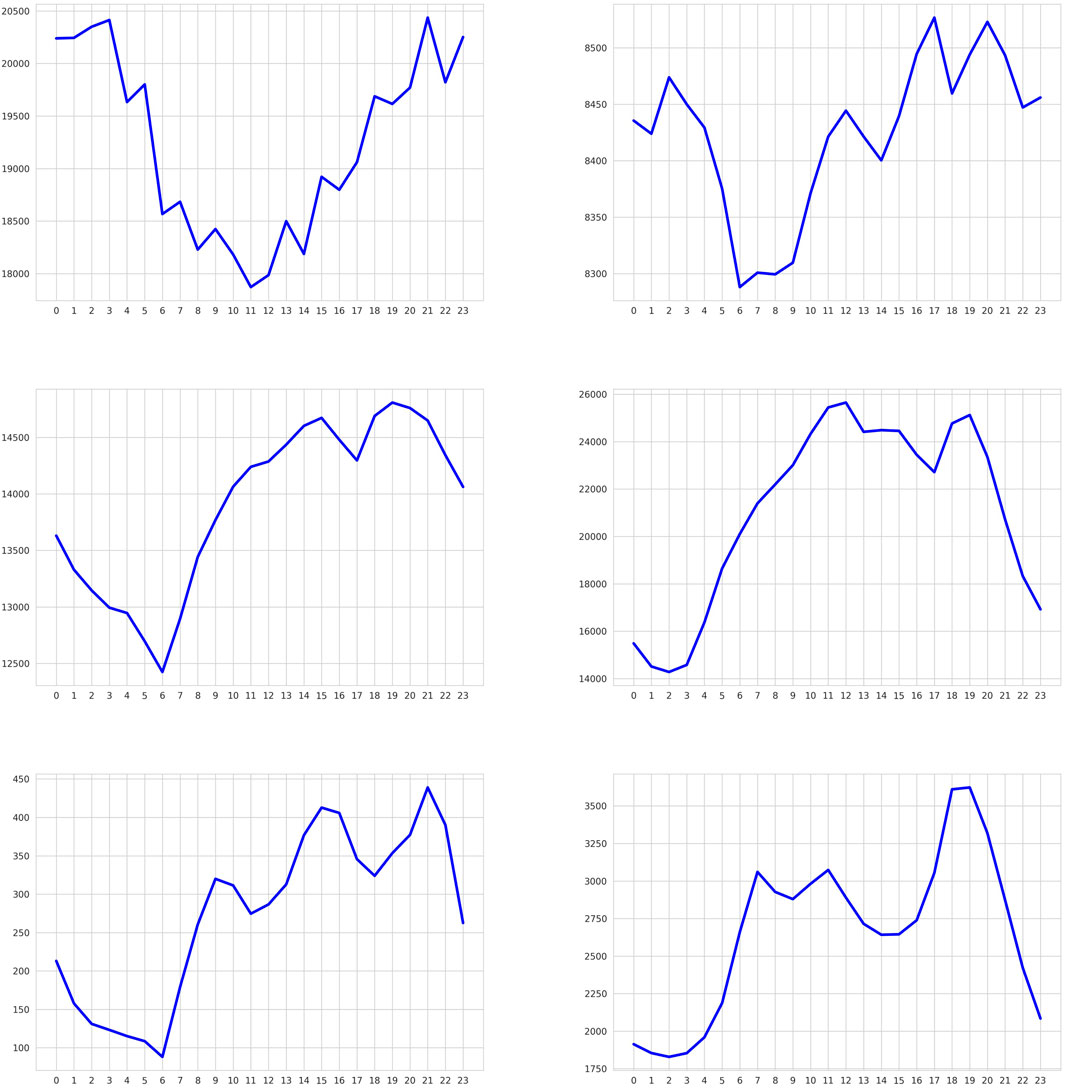
Figure 12. Load profile curves of six of the identified anomalous substations. These profiles show behaviors that contrast with the majority of the substations by having sudden changes (peaks and troughs) at different hours of the day.
Advantages and disadvantages
The methodology offers several advantages over other approaches to data analysis for load profiling. The different techniques used in all stages are well-known and relatively simple in terms of complexity, either being linear (KDE, PCA, KMeans) or quadratic (Gaussian Mixture, DBSCAN) in time with respect to the number of data points. The relatively low time complexity of the methods allows for a fast implementation of the methodology that can be adapted to multiple dataset structures and programming languages, being particularly useful for small grid operators which may not have strong computational capabilities. To determine if this proposal is a suitable solution in the Colombian scenario, the methodology and its results were shared with one of the grid operators. The operator expressed a favorable opinion of the proposal after a detailed observation, and found that it is possible to apply the methodology directly to the measurement data of its substations as they are stored. The most interesting results from its perspective were found in the detection of anomalous points.
It is important to mention that this proposal has also some drawbacks. Many of the selected methods rely on certain assumptions that simplify calculations but do not necessarily reflect the real behavior of the data, such as the normality assumption for Gaussian Mixture. Other relevant assumption is related to data quality since the methodology only discards substations with null values, thus being vulnerable to data injection attacks or other cybersecurity-related issues. Additionally, searching for the best parameters is a challenging task that could be resource intensive, due to the fact that optimal parameters are highly dependent on the intrinsic nature of the data. More complex methodologies could represent different relations among data points without the need for prior assumptions or parameter tuning. However, many advanced techniques are developed using specific programming frameworks and often exhibit high computational complexity, which can hinder their reproducibility and make them less useful for grid operators.
Conclusion
In this work, a methodology to analyze data from AMI measurements on electrical substations is presented. This proposal consists of three main stages (dimensional reduction, clustering and density estimation), in each of which a series of data analysis methods are successively applied to the data in order to characterize the consumption patterns of the substations (relating these patterns to common types of end users) and to isolate substations with rare or anomalous behavior. The methodology is applied to the consumption data of 394 electrical substations measured by three operators of the Colombian electrical grid. The quality of the different groupings generated by the methodology for each operator’s data was measured through three metrics, that tended to favor the separation between substations with low and high consumption. Regarding the detection of anomalous behavior, density estimation models are used, since anomalies can be understood as points located in regions of low density. The two models used in each scenario usually agree in their results, and the anomalous behaviors (identified in 16 substations) show significant differences with the usual behavior of the substations. Since the data analysis methods selected as part of the methodology are well-known, efficient and easy to implement, this proposal can contribute to the standardization of processes for analyzing electricity consumption data in Colombia and other developing countries. The results obtained can potentially help grid operators, government agencies and other stakeholders of the electric power system to better understand the differences and similarities in electricity consumption patterns between different regions, and to identify the underlying elements that generate anomalies (distribution failures, service outages, erroneous or missing data, power theft, infrequent changes in consumption) in order to propose mechanisms for their study and eventual resolution.
Data availability statement
The raw data supporting the conclusions of this article will be made available by the authors, without undue reservation.
Author contributions
OB-B: Formal Analysis, Investigation, Methodology, Writing–original draft. AZ: Formal Analysis, Conceptualization, Supervision, Validation, Writing–review and editing. JR Garcia: Conceptualization, Writing–review and editing, Funding acquisition, Resources.
Funding
The author(s) declare that financial support was received for the research, authorship, and/or publication of this article. This research was supported by Electrical Machines and Drives (EM&D) from Universidad Nacional de Colombia, Red de cooperación de soluciones energéticas para comunidades, code: 59384
Conflict of interest
The authors declare that the research was conducted in the absence of any commercial or financial relationships that could be construed as a potential conflict of interest.
Publisher’s note
All claims expressed in this article are solely those of the authors and do not necessarily represent those of their affiliated organizations, or those of the publisher, the editors and the reviewers. Any product that may be evaluated in this article, or claim that may be made by its manufacturer, is not guaranteed or endorsed by the publisher.
References
Acosta, M. R. C., Ahmed, S., Garcia, C. E., and Koo, I. (2020). Extremely randomized trees-based scheme for stealthy cyber-attack detection in smart grid networks. IEEE access 8, 19921–19933. doi:10.1109/access.2020.2968934
Asaad, M., Ahmad, F., Alam, M. S., and Sarfraz, M. (2021). Smart grid and Indian experience: a review. Resour. Policy 74 (74), 101499. doi:10.1016/j.resourpol.2019.101499
Aurangzeb, K., Aslam, S., Mohsin, S. M., and Alhussein, M. (2021). A fair pricing mechanism in smart grids for low energy consumption users. IEEE Access 9, 22035–22044. doi:10.1109/access.2021.3056035
Ayub, N., Javaid, N., Mujeeb, S., Zahid, M., Khan, W. Z., and Khattak, M. U. (2020). “Electricity load forecasting in smart grids using support vector machine,” in Advanced information networking and applications: proceedings of the 33rd international conference on advanced information networking and applications (AINA-2019) 33 (Springer), 1–13.
Berger, L. T., and Iniewski, K. (2012). Smart grid applications, communications, and security. John Wiley and Sons.
Bhattarai, B. P., Paudyal, S., Luo, Y., Mohanpurkar, M., Cheung, K., Tonkoski, R., et al. (2019). Big data analytics in smart grids: state-of-the-art, challenges, opportunities, and future directions. IET Smart Grid 2, 141–154. doi:10.1049/iet-stg.2018.0261
Bouhorma, N., Martín, H., de la Hoz, J., and Coronas, S. (2023). A comprehensive methodology for the statistical characterization of solar irradiation: application to the case of Morocco. Appl. Sci. 13 (5), 3365. doi:10.3390/app13053365Available at: https://www.mdpi.com/2076-3417/13/5/3365.
Bustos-Brinez, O. A., Duarte, J. E., Pinto, A. Z., González, F. A., and Rosero, J. A. (2023). A method for the characterization of energy demand aggregate based on electricity data provide from AMI systems and metering in substations. Energies 17 (1), 87. doi:10.3390/en17010087
Chakraborty, A. K., and Sharma, N. (2016) “Advanced metering infrastructure: Technology and challenges,” in 2016 IEEE/PES transmission and distribution conference and exposition (T&D), Dallas, TX, May, 03–05, 2016 (IEEE), 1–5.
Colmenares Quintero, R. F., Mera Paz, J. A., Volkan Oral, H., and Saygin, H. (2022). Smart grids to lower energy usage and carbon emissions: case study examples from Colombia and Turkey.
Dileep, G. (2020). A survey on smart grid technologies and applications. Renew. energy 146, 2589–2625. doi:10.1016/j.renene.2019.08.092
Di Santo, K. G., Kanashiro, E., Di Santo, S. G., and Saidel, M. A. (2015). A review on smart grids and experiences in Brazil. Renew. Sustain. Energy Rev. 52, 1072–1082. doi:10.1016/j.rser.2015.07.182Available at: https://www.sciencedirect.com/science/article/pii/S1364032115008291.
Duarte, O. G., Rosero, J. A., and Pegalajar, M. d. C. (2022). Data preparation and visualization of electricity consumption for load profiling. Energies 15 (20), 7557. doi:10.3390/en15207557
Echeverri Martínez, R., Caicedo Bravo, E., Morales, W. A., and Garcia-Racines, J. D. (2020). A bi-level multi-objective optimization model for the planning, design and operation of smart grid projects. Case study: an islanded microgrid. Int. J. Energy Econ. Policy 10 (4), 325–341. doi:10.32479/ijeep.9343
Farmanbar, M., Parham, K., Arild, Ø., and Rong, C. (2019). A widespread review of smart grids towards smart cities. Energies 12 (23), 4484. doi:10.3390/en12234484
Fotis, G., Dikeakos, C., Zafeiropoulos, E., Pappas, S., and Vita, V. (2022). Scalability and replicability for smart grid innovation projects and the improvement of renewable energy sources exploitation: the flexitranstore case. Energies 15 (13), 4519. doi:10.3390/en15134519Available at: https://www.mdpi.com/1996-1073/15/13/4519.
Gallardo, J. L., Ahmed, M. A., and Jara, N. (2021). Clustering algorithm-based network planning for advanced metering infrastructure in smart grid. IEEE Access 9, 48992–49006. doi:10.1109/access.2021.3068752
Garcia-Guarin, J., Rivera, S., and Rodriguez, H. R. (2019). Smart grid review: reality in Colombia and expectations. J. Phys. Conf. Ser. 1257 (1), 012011. doi:10.1088/1742-6596/1257/1/012011
Giral Ramírez, W. M., Celedón Flórez, H. J., Galvis Restrepo, E., and Zona Ortiz, A. T. (2017). Redes inteligentes en el sistema eléctrico colombiano: Revisión de tema. Tecnura 21 (53), 119–137. doi:10.14483/22487638.12396Available at: https://revistas.udistrital.edu.co/index.php/Tecnura/article/view/12396.
Haidar, A. M., Muttaqi, K., and Sutanto, D. (2015). Smart Grid and its future perspectives in Australia. Renew. Sustain. Energy Rev. 51, 1375–1389. doi:10.1016/j.rser.2015.07.040
Hu, J., Yin, W., Ye, C., Bao, W., Wu, J., and Ding, Y. (2021). Assessment for voltage violations considering reactive power compensation provided by smart inverters in distribution network. Front. Energy Res. 9, 713510. doi:10.3389/fenrg.2021.713510
Ismail, A. A., Mbungu, N. T., Elnady, A., Bansal, R. C., Hamid, A. K., and AlShabi, M. (2023). Impact of electric vehicles on smart grid and future predictions: a survey. Int. J. Model. Simul. 43 (6), 1041–1057. doi:10.1080/02286203.2022.2148180
Kafash Farkhad, M., and Akbari Foroud, A. (2023). Adaptive distributed demand side management with weighted dimension reduction for energy resource management in smart grid. IET Generation, Transm. and Distribution 17, 2612–2633. doi:10.1049/gtd2.12842
Kappagantu, R., and Daniel, S. A. (2018). Challenges and issues of smart grid implementation: a case of Indian scenario. J. Electr. Syst. Inf. Technol. 5 (3), 453–467. doi:10.1016/j.jesit.2018.01.002Available at: https://www.sciencedirect.com/science/article/pii/S2314717218300175.
Kotsiopoulos, T., Sarigiannidis, P., Ioannidis, D., and Tzovaras, D. (2021). Machine learning and deep learning in smart manufacturing: the smart grid paradigm. Comput. Sci. Rev. 40, 100341. doi:10.1016/j.cosrev.2020.100341
Kumar, N., and Panda, S. K. (2023). Smart high power charging networks and optimal control mechanism for electric ships. IEEE Trans. Industrial Inf. 19 (2), 1476–1483. doi:10.1109/tii.2022.3170484
Li, Y., Wang, C., and Li, G. (2020). A mini-review on high-penetration renewable integration into a smarter grid. Front. Energy Res. 8 (84). doi:10.3389/fenrg.2020.00084
Lovell, H. (2020). “The promise of smart grids,” in Smart and sustainable cities? (London, United Kingdom: Routledge), 24–38.
Märtz, A., Langenmayr, U., Ried, S., Seddig, K., and Jochem, P. (2022). Charging behavior of electric vehicles: temporal clustering based on real-world data. Energies 15 (18), 6575. doi:10.3390/en15186575
Miguel, P., Goncalves, J., Neves, L., and Martins, A. G. (2016). Using clustering techniques to provide simulation scenarios for the smart grid. Sustain. Cities Soc. 26, 447–455. doi:10.1016/j.scs.2016.04.012
Miraftabzadeh, S. M., Colombo, C. G., Longo, M., and Foiadelli, F. (2023). K-means and alternative clustering methods in modern power systems. IEEE Access 11, 119596–119633. doi:10.1109/access.2023.3327640
Mohamed, A., Refaat, S. S., and Abu-Rub, H. (2019). A review on big data management and decision-making in smart grid. Power Electron. Drives 4 (39), 1–13. doi:10.2478/pead-2019-0011
Molina, C. J. D., Sanchez, O. D. E., Buitrago, A. L. F., and Zapata, U. J. A. (2019). Challenges and opportunities of smart grids implementation: a case of Colombia electricity sector, in 2019 FISE-IEEE/CIGRE conference- living the energy transition (FISE/CIGRE), Medellin, Colombia, December 04–06, 2019 (IEEE), 1–6. Available at: https://ieeexplore.ieee.org/abstract/document/8985022/.
Moreno Escobar, J. J., Morales Matamoros, O., Tejeida Padilla, R., Lina Reyes, I., and Quintana Espinosa, H. (2021). A comprehensive review on smart grids: challenges and opportunities. Sensors 21 (21), 6978. doi:10.3390/s21216978
Mostafa, N., Ramadan, H. S. M., and Elfarouk, O. (2022). Renewable energy management in smart grids by using big data analytics and machine learning. Mach. Learn. Appl. 9, 100363. doi:10.1016/j.mlwa.2022.100363
Muench, S., Thuss, S., and Guenther, E. (2014). What hampers energy system transformations? the case of smart grids. Energy policy 73, 80–92. doi:10.1016/j.enpol.2014.05.051
Mukherjee, D., Chakraborty, S., Abdelaziz, A. Y., and El-Shahat, A. (2022). Deep learning-based identification of false data injection attacks on modern smart grids. Energy Rep. 8, 919–930. doi:10.1016/j.egyr.2022.10.270
Mukherjee, D., Chakraborty, S., Ghosh, S., and Mishra, R. K. (2021). Application of deep learning for power system state forecasting. Int. Trans. Electr. Energy Syst. 31 (9), 12901. doi:10.1002/2050-7038.12901
Paul, K. (2022). Multi-objective risk-based optimal power system operation with renewable energy resources and battery energy storage system: a novel Hybrid Modified Grey Wolf Optimization–Sine Cosine Algorithm approach. Trans. Inst. Meas. Control, 014233122210799. doi:10.1177/01423312221079962
Paul, K., Sinha, P., Bouteraa, Y., Skruch, P., and Mobayen, S. (2023). A novel improved manta ray foraging optimization approach for mitigating power system congestion in transmission network. IEEE Access 11, 10288–10307. doi:10.1109/access.2023.3240678
Ravinder, M., and Kulkarni, V. (2023). Intrusion detection in smart meters data using machine learning algorithms: a research report. Front. Energy Res. 11, 1147431. doi:10.3389/fenrg.2023.1147431
Salem, N., and Hussein, S. (2019). Data dimensional reduction and principal components analysis. Procedia Comput. Sci. 163, 292–299. doi:10.1016/j.procs.2019.12.111Available at: https://www.sciencedirect.com/science/article/pii/S1877050919321507.
Saxena, V., Kumar, N., Singh, B., and Panigrahi, B. K. (2021). An MPC based algorithm for a multipurpose grid integrated solar PV system with enhanced power quality and PCC voltage assist. IEEE Trans. Energy Convers. 36 (2), 1469–1478. doi:10.1109/tec.2021.3059754
Si, C., Xu, S., Wan, C., Chen, D., Cui, W., and Zhao, J. (2021). Electric load clustering in smart grid: methodologies, applications, and future trends. J. Mod. Power Syst. Clean Energy 9 (2), 237–252. doi:10.35833/mpce.2020.000472
Siano, P. (2014). Demand response and smart grids—a survey. Renew. Sustain. energy Rev. 30, 461–478. doi:10.1016/j.rser.2013.10.022
Siddiquee, S. S., Howard, B., Bruton, K., Brem, A., and O'Sullivan, D. T. (2021). Progress in demand response and it’s industrial applications. Front. Energy Res. 9, 673176. doi:10.3389/fenrg.2021.673176
Téllez Gutiérrez, S. M., Rosero García, J., and Céspedes Gandarillas, R. (2018). Advanced metering infrastructure in Colombia: benefits, challenges and opportunities. Ing. Desarro. 36 (2), 469–488. doi:10.14482/inde.36.2.10711
Tu, C., He, X., Shuai, Z., and Jiang, F. (2017). Big data issues in smart grid–A review. Renew. Sustain. Energy Rev. 79, 1099–1107. doi:10.1016/j.rser.2017.05.134
Vimalkumar, K., and Radhika, N. (2017). “A big data framework for intrusion detection in smart grids using Apache spark,” in 2017 International conference on advances in computing, communications and informatics (ICACCI), Udupi, India, September 13–16, 2017 (IEEE), 198–204.
Yang, J., Zhao, J., Wen, F., and Dong, Z. (2018). A model of customizing electricity retail prices based on load profile clustering analysis. IEEE Trans. Smart Grid 10 (3), 3374–3386. doi:10.1109/tsg.2018.2825335
Yu, Y., Yang, J., and Chen, B. (2012). The smart grids in China—a review. Energies 5 (5), 1321–1338. doi:10.3390/en5051321
Keywords: electrical data analysis, Smart Grids, electrical grid management, demand characterization, anomaly detection
Citation: Bustos-Brinez OA, Zambrano-Pinto A and Rosero Garcia J (2024) Application of data analysis techniques for characterization and estimation in electrical substations. Front. Energy Res. 12:1372347. doi: 10.3389/fenrg.2024.1372347
Received: 17 January 2024; Accepted: 14 August 2024;
Published: 27 August 2024.
Edited by:
Almoataz Abdelaziz, Ain Shams University, EgyptReviewed by:
Masoud Dashtdar, Islamic Azad University, Bushehr, IranMahamad Nabab Alam, National Institute of Technology Warangal, India
Venkatakrishnan G. R., SSN College of Engineering, India
Copyright © 2024 Bustos-Brinez, Zambrano-Pinto and Rosero Garcia. This is an open-access article distributed under the terms of the Creative Commons Attribution License (CC BY). The use, distribution or reproduction in other forums is permitted, provided the original author(s) and the copyright owner(s) are credited and that the original publication in this journal is cited, in accordance with accepted academic practice. No use, distribution or reproduction is permitted which does not comply with these terms.
*Correspondence: Javier Rosero Garcia, amFyb3Nlcm9nQHVuYWwuZWR1LmNv