 Qing Wang
 Jiawei Zhang1,2
- 1CNPC Engineering Technology R&D Company Limited, Beijing, China
- 2National Engineering Research Center for Oil & Gas Drilling and Completion Technology, Beijing, China
- 3Daqing Oilfield Company Limited, Daqin, Heilongjiang, China
In the process of oil and gas drilling, it is of great significance to accurately predict the drag coefficient and settling rate of cuttings in the drilling fluid for hydraulic parameters and borehole cleaning. In this paper, particle settling experiments were used to obtain the final settling velocity of 196 groups of spherical particles and 224 groups of terrestrial high-clay pure-shale cuttings in the power-law fluid. Based on data analysis, a settlement drag coefficient model suitable for irregular-shaped shale cuttings was established. The model can be used to predict the settlement drag coefficient and settling velocity of irregular-shaped shale cuttings in power-law fluid, which can provide theoretical guidance for wellbore cleaning and hydraulic parameter optimization in Daqing Gulong shale oil drilling operations.
1 Introduction
The resources of shale oil in Daqing Oilfield Gulong are huge, have broad prospects for exploration and development, and are an important replacement field for the Daqing oilfield (Sun et al., 2021; Wang et al., 2021). At present, the long horizontal well drilling method is mainly used in shale oil development in Daqing Oilfield Gulong. However, due to the requirements of cost reduction and efficiency increase, the drilling speed is urgent. For example, the design depth of GY2-Q1-H4 was reached in only 13.77 days, with an average rate of penetration (ROP) of over 40 m/h. High ROP means that more cuttings of larger size are generated. The problem of borehole cleaning caused by inadequate cuttings migration has gradually become the main contradiction in horizontal well drilling operations in the shale oil area of Daqing Oilfield Gulong. Moreover, other problems, such as difficulty pulling out of a hole and casing running obstructions, affect the well construction cycle.
When drilling, fluid circulation needs to be stopped in operations such as drill bit replacement and single root connection. Cuttings in drilling fluid settle and deposit to form cuttings beds in highly deviated well sections and horizontal wells (Liu et al., 2017; Moreira et al., 2017). Key parameters such as the final settling velocity of cuttings, the bed formation thickness, and the re-starting velocity of particles on the surface of the cuttings are all related to the settling drag coefficient of cuttings (Larsen et al., 1997; Duan et al., 2008; Sorgun, 2013). Therefore, an in-depth study of the settlement law of Gulong shale cuttings in drilling fluid and the settlement drag coefficient model of Gulong shale cuttings can be obtained based on this, which is the basic work to understand the borehole cleaning problem of shale oil horizontal wells and can provide a basis for optimizing the rheology and circulation rate of drilling fluid.
The settlement law of rock debris can be revealed from the study on the settlement of spherical particles. A large number of experimental studies on the settlement law of spherical particles in Newtonian fluid have been carried out all over the world (Cheng, 2008; Barati et al., 2014), and a relatively high-precision prediction model has been obtained. However, the shape of shale cuttings is highly irregular, and most drilling fluids belong to non-Newtonian fluids with certain shear dilutions (Mengbo et al., 2014; Wang and Liu, 1996). Whether the previous model for predicting the settling drag coefficient of spherical particles in Newton fluid is suitable for predicting the settling drag coefficient of irregular shale cuttings in non-Newtonian fluid is questionable (Guo et al., 2010; Wang et al., 2010). To address the aforementioned issues, this study established a predictive model for the settlement resistance coefficient of spherical particles in power-law fluids through regression analysis of settlement experimental data. On this basis, a shape factor (circularity c) is introduced to describe the two-dimensional geometric characteristics of particles, and a resistance coefficient model for predicting shale cuttings in power-law fluids is established. Based on the obtained resistance coefficient prediction model, the sedimentation velocity of cuttings is calculated using the iterative method. The accuracy of the model prediction is judged by analyzing the average relative error between the calculated sedimentation velocity and the measured sedimentation.
2 Methods
2.1 Experimental apparatus and procedure
The settling test device is a plexiglass cylinder with an inner diameter of 100 mm and a height of 1,500 mm. The debris settlement track was captured by a Revealer 2F04C (Revealer 2F04C). The image acquisition area is set 300 mm away from the bottom of the cylinder, which can ensure not only that the cuttings can reach the final settling velocity but also avoid the influence of the end effect on the settling velocity. At the same time, in order to reduce the interference of uncertain factors in the experiment, each group of experiments of spherical particles is repeated at least three times, and in the subsequent data processing, only the experimental data with a maximum relative error of less than 5% are reserved for fitting the relationship of the drag coefficient.
2.2 Experimental materials and fluid rheological parameters
In order to make the settlement drag coefficient and prediction model have a wide range of particle Reynolds numbers, three materials, namely stainless steel, zirconia, and glass, are selected for the settlement experiment of spherical particles, and the Daqing Oilfield Gulong shale debris is selected for the settlement experiment of irregular-shaped particles. In order to reduce the influence of the wall effect on the experiment, the ratio of particle diameter to the diameter of the experimental round tube is kept at a low level. The particles used in the experiment include stainless steel, zirconia, glass, and grains of shale. Their physical parameters are as follows: particle equivalent diameter de (mm) and the density (kg/m3) of the four materials are 1/2/3/4/5, 1/2/3/4/5, 1/2/3/4/5, and 2.1–5.7, 7,930, 6,080, 2,500, and 2073, respectively.
The aqueous solution of sodium carboxymethylcellulose (CMC) was used as the power-law base fluid, with a mass concentration range of 0.25%–2%. The rheological properties of the fluid at experimental temperature were measured by Anto Paar MCR 92, and the rheological parameters of the test fluid were fitted by the rheological model of a power-law fluid
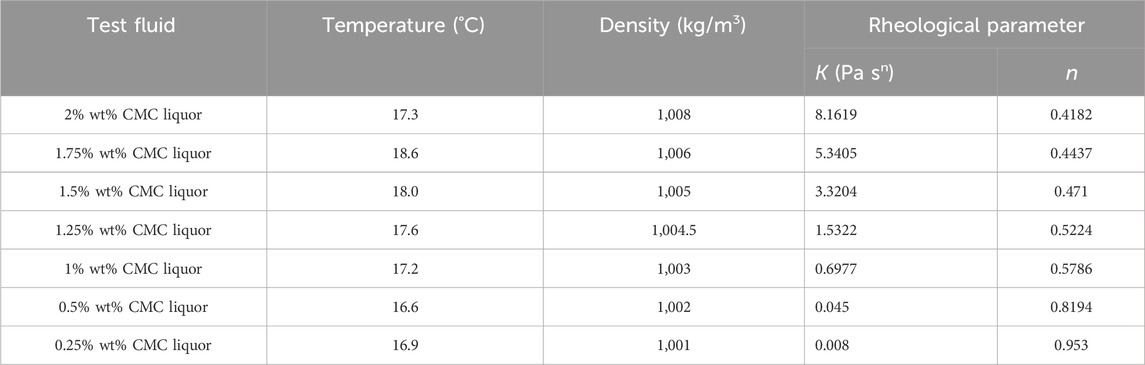
Table 1. Physical and rheological parameters of CMC solution with different concentrations.
3 Results
3.1 Shape characterization of shale in Daqing Gulong
Particle shape is an important factor affecting the settling speed and state of the object. Some scholars have pointed out that when Res > 100 (Res—particle Reynolds number), the debris settlement track is oscillating, while when Res < 100, the settlement track is stable (Fang, 1992). Circular degree c is more suitable for the establishment of a prediction model without considering the secondary motion in the process of particle settlement (Dioguardi and Mele, 2015). Therefore, in the case of a low particle Reynolds number Res < 100, it is feasible to establish a prediction model of the debris settlement drag coefficient in the power-law fluid by introducing circularity. Circularity c refers to the ratio of the circumference of the largest projection surface of a particle to the circumference of its equivalent circle. As a two-dimensional shape parameter is sensitive to the irregularity of the particle profile, it is relatively easy to measure. It is defined as follows:
where dA is the diameter of the equivalent circle of the largest projector surface of the particle, m; P is the maximum projector surface circumference of the particle, m.
The circularity of target particles is measured by the function named “analyzing particles” in the image particle analysis software ImageJ. The circularity in the ImageJ user guide is defined as (Shah et al., 2006)
where AP is the surface area of the largest projector surface of the particle, m2.
For a spherical particle, c = 1, while for any other shaped particle, c < 1. The image conversion examples of selected shale cuttings are shown in Figure 1.
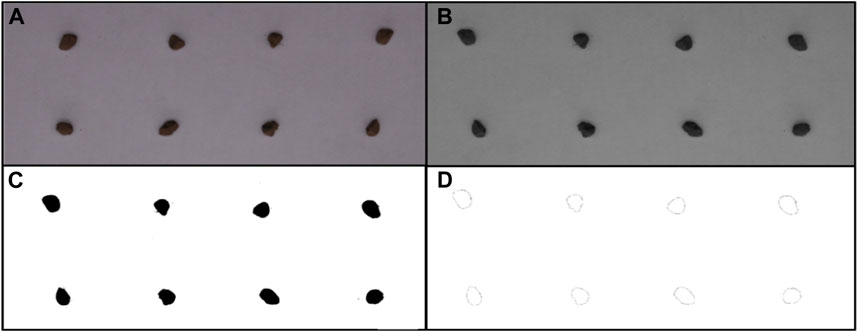
Figure 1. Image conversion example of Daqing Gulong shale cuttings. (A) Original RGB image; (B) gray image; (C) image threshold; (D) drawing contour.
The parameter distribution of roundness and equivalent diameter of shale cuttings in the 224 groups obtained in the experiment is shown in Figure 2A. The equivalent diameter of shale cuttings is 3.2–4.2 mm, with a median of 3.7 mm. The roundness ranges from 0.65 to 0.87, with a median value of 0.76. The roundness of most shale cuttings is concentrated between 0.7 and 0.85.
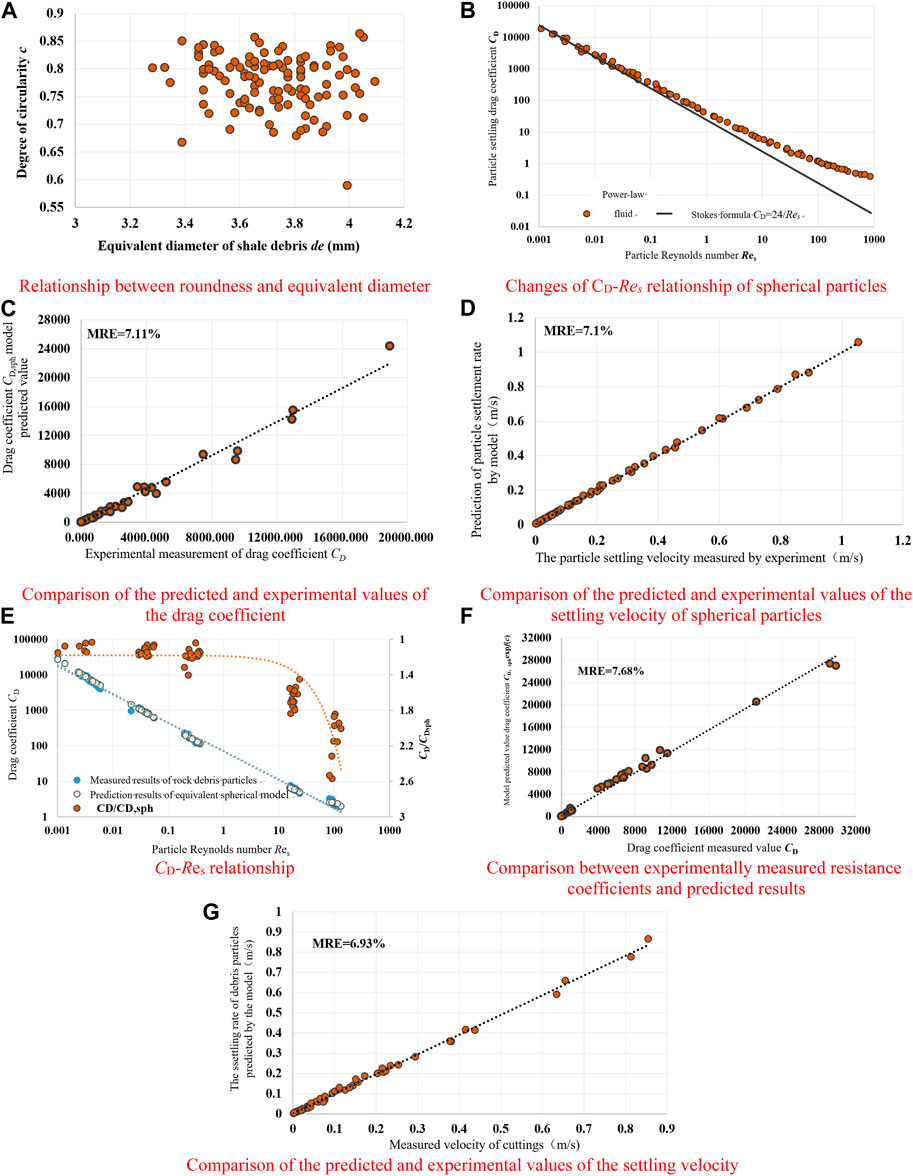
Figure 2. Test and analysis results. (A) Relationship between roundness and equivalent diameter; (B) changes in the CD and Res relationship of spherical particles; (C) comparison of the predicted and experimental values of the drag coefficient; (D) comparison of the predicted and experimental values of the settling velocity of spherical particles; (E) CD–Res relationship; (F) comparison between experimentally measured resistance coefficients and predicted results; (G) comparison of the predicted and experimental values of the settling velocity.
3.2 Establishment and analysis of the settling drag coefficient model of spherical particles
The drag coefficient CD is defined as the ratio of the fluid viscous force and the kinetic energy of the particles in the process of particle settlement, which is the main parameter to describe the particle settlement behavior. The drag coefficient can be calculated according to the properties of the fluid and particles and the settling velocity:
where ρl is the density of the fluid, g is the gravitational acceleration, Vt is the settling velocity,
Reynolds Res is defined as the ratio between the inertia force and the viscous force received by the particle and is another major parameter to describe the settling behavior of the particle. For a power-law fluid, the particle Reynolds number Res expression is as follows:
First, the settling experiment of spherical particles was carried out, and the relationship between the drag coefficient CD (Formula (3)) and the Reynolds number Res (Formula (4)) was established. The settlement experimental data of 196 groups of spherical particles were analyzed, and the relationship between CD and Res was drawn using logarithmic coordinates (Figure 2B). It can be seen from the figure that predicting the settlement drag coefficient of spherical particles in a power-law fluid using the Stokes formula (CD = 24/Res) could lead to a large error. For example, in the case of Res < 0.1, the mean relative error (MRE) between the experimental results of settling in the power-law fluid and the predicted results of the Stokes formula is as high as 30.16%, indicating that the rheological properties of non-Newtonian fluids have a significant effect on the fluid–particle interaction. In this case, the calculation of the settling drag coefficient of a sphere in a non-Newtonian fluid by Newton’s correlation will result in a large error.
Researchers have put forward a prediction relationship for the settlement drag coefficient of spherical particles in non-Newtonian fluids, such as the settlement drag coefficient model proposed by Shah and Chhabra (Khan and Richardson, 1987):
where CD is the drag coefficient, Res is the Reynolds number of particles, and
The drag coefficient model proposed by Khan and Richardson (Machač et al., 1995) is as follows:
where CD is the drag coefficient and Res is the Reynolds number of particles.
The drag coefficient model proposed by Machač (Kelessidis and Mpandelis, 2004) is as follows:
where
The drag coefficient model proposed by Kelessidis and Mpandelis (Goossens, 2019) is as follows:
According to the experimental data on spherical particle settlement, the parameters of the several different forms of settlement drag coefficient models are fitted. It is found that the five-parameter model (Formula (9)) proposed by Kelessidis (2004) can lead to the best goodness of fit, and its form is as follows:
where A, B, C, D, and E are correlation coefficients.
The first term on the right of Formula (9) represents the downward trend of the drag coefficient under laminar flow conditions, and the second term represents the downward trend of the drag coefficient gradually slowing down under turbulence conditions. The drag coefficient can be predicted by adding a complex turbulence term to the extended Stokes law. The above inference conforms to the basic law of physics; that is, the total drag force is the sum of laminar and turbulent components in any flow state (Rushd et al., 2019).
Through the fitting regression of settlement experimental data for 196 groups of spherical particles, the settlement drag coefficient relationship of spherical particles in a power-law fluid is obtained as follows:
By comparing Formula (10) with the representative Formulas (6–8) in the published literature, the mean error MRE, maximum mean error (max MRE), and root mean square logarithm error (RMSLE) were used to evaluate the prediction accuracy of the proposed relationship for the settlement drag coefficient of spherical particles in the power-law fluid. The detailed results of the comparison are shown in Table 2. The calculation methods for MRE and RMSLE are as follows (Dioguardi et al., 2018):
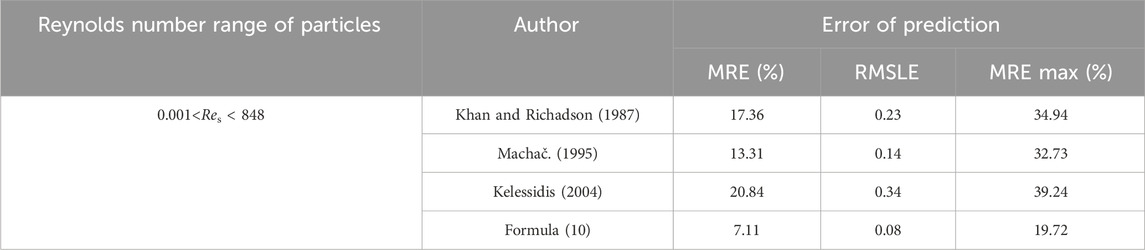
Table 2. Error statistics of the spherical particle settlement drag coefficient in power-law drilling fluid.
where N is the total number, CD,c is the predicted drag coefficient, and CD,m is the experimentally measured drag coefficient.
In this study, the settling velocity Vts of the particles is obtained by experiments, and the relationship between the settling drag coefficient CD and the Reynolds number Res of the particles is obtained by fitting. Based on the correlation formula CD–Res proposed, the settlement drag coefficient CD and settlement velocity Vt of particles in the fluid can be calculated by the iterative trial-and-error method. The iteration procedure is shown in Figure 3 (Shahi and Kuru, 2015).
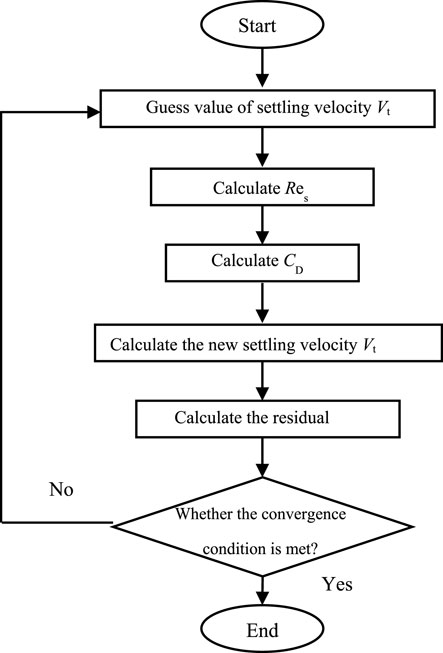
Figure 3. Flow chart of an iterative trial-and-error program.
Introduction to graphics in Figure 3:
a) The parameter distribution of roundness and equivalent diameter of shale cuttings in the 224 groups obtained in the experiment.
b) Changes in the CD–Res relationship of 196 groups of spherical particles obtained by the settling experiment.
c) The comparison between the predicted values of the model and the experimental values of the settlement drag coefficient of spherical particles.
d) Comparison of the predicted and experimental values of the settling velocity of spherical particles.
e) CD–Res relationship of 224 sets of shale cuttings data.
f) Comparison of prediction results of resistance coefficients CD and CD,sphexpf(c) measured by shale cuttings settling experiment.
g) Comparison between the experimental measured value and the predicted value of the model for the settling velocity of shale cuttings.
According to Formula (10) of the prediction model proposed for spherical particles’ drag coefficient, CD and settling velocity Vt of settling particles were calculated by the trial-and-error method, as shown in Figure 2C, D. It can be seen from Figure 2C; Table 2 that the predicted value of Formulas (6–8) is relatively close to the experimental value for power-law fluids, with an average relative error of approximately 17.17%. The average relative error (MRE) of the proposed model (Formula (10)) is 7.11%. The three quantitative evaluation parameters are reduced compared with other models, and the prediction accuracy of the experimental results is higher. Meanwhile, the average relative error (MRE) between the predicted settling velocity of spherical particles and the measured value is only 7.1%, as shown in Figure 2D. Therefore, the proposed model can predict the settling drag coefficient CD and settling velocity Vt of spherical particles in the power-law fluid.
3.3 Establishment and analysis of the shale debris settlement drag coefficient model
Based on the prediction model of spherical drag coefficient proposed above (Formula (10)), the relationship of sedimentation resistance coefficient CD applicable to shale cuttings is established by introducing particle circularity c. At any Reynolds number, the drag force on cuttings is greater than that of its equivalent sphere (Shahi and Kuru, 2015). This is because the irregularity of the cuttings surface will lead to increased drag force and a greater flow separation phenomenon, thus reducing the settling velocity compared with spherical particles (Sun et al., 2024). According to experimental observation (Figure 2E), under the same conditions, the ratio of cuttings’ drag coefficient CD to spherical particles’ drag coefficient CD,sph is slightly greater than 1. The ratio is larger because of the shape at high Reynolds numbers.
By analyzing the difference between the drag coefficient CD obtained by the shale cuttings experiment and the predicted value CD,sph of the settling drag coefficient of spherical particles under the same conditions, the roundness function f(c) is obtained as the function of the natural logarithm of CD/CD,sph. The relationship between particle shape factor c and CD/CD,sph is determined as follows:
In a special case like c = 1, the drag coefficient of shale cuttings is equal to that of the ball with the same parameter. When c is 1, f(c) = 0. In order to ensure that CD/CD,sph = 1 is satisfied when the particle is spherical, f(c) is ascertained by Formula (14) combined with 224 groups of experimental data.
where α, β, and ղ are empirical coefficients, which can be obtained by non-linear fitting.
The expression of the cuttings’ drag coefficient CD in the power-law fluid is as follows:
The relationship between the predicted value of the shale cuttings’ drag coefficient CD,sph expf(c), and the actually measured value of the drag coefficient CD calculated using Formula (15) is shown in Figure 2F. The MRE of the predicted drag coefficient is 7.68%.
According to the proposed model (Formula (15)), the settling velocity of shale cuttings in the power-law fluid was calculated and compared with the experimental measured values (Figure 2G). Through comparison, the average relative error of the predicted value of shale cuttings settling velocity Vt in the power-law fluid is 6.93%. Although there is a certain dispersion in the prediction results of the model, the data are distributed reasonably in a straight line, and the settling velocity of shale debris in the power-law fluid can be predicted accurately by this model.
4 Conclusion
(1) Through the regression analysis of the settlement experiment data, the prediction model of the settlement drag coefficient of spherical particles in the power-law fluid was established. On this basis, a shape factor (circularity c) was introduced to describe the two-dimensional geometric characteristics of the particles, and a model for predicting the drag coefficient of shale debris in the power-law fluid was established.
(2) The experimental results of settling were analyzed. Under the same particle Reynolds number, the drag coefficient of shale cuttings increases with the decrease in circularity and decreases with the increase in Reynolds number. However, under the condition of a high Reynolds number, the decreasing trend becomes slow.
(3) According to the debris drag coefficient prediction model obtained, the iterative method was used to calculate the settling velocity, and the average relative error was 6.93%. The predicted results of the model were highly consistent with the experimental results. The prediction model can provide theoretical guidance for borehole cleaning and hydraulic parameter optimization in the field practice of shale oil drilling projects in Daqing, Gulong.
Data availability statement
The original contributions presented in the study are included in the article/Supplementary material; further inquiries can be directed to the corresponding author.
Author contributions
QW: writing–original draft and writing–review and editing. JZ: formal analysis and writing–original draft. CB: conceptualization, methodology, and writing–original draft. XL: conceptualization, methodology, and writing–review and editing. GJ: funding acquisition, data curation, and writing–review and editing. JY: formal analysis and writing–original draft.
Funding
The author(s) declare that financial support was received for the research, authorship, and/or publication of this article. This work was supported by the Major Project of the Scientific Research and Technological Development Project of China National Petroleum Corporation Limited, titled “Key Technologies and Equipment Research for Drilling and Completion of 10,000 m Ultra Deep Oil and Gas Resources” (No. 2022ZG06); the Scientific Research and Technological Development Project of China National Petroleum Corporation, titled “Research on Scale Storage and Production Increase and Exploration and Development Technology of Marine Carbonate Rock Oil and Gas”; the Basic Research and Strategic Reserve Technology Research Fund Project of China National Petroleum Corporation’s affiliated institute, titled “Research on Interaction Response Mechanism of Formation Pressure Wellbore Environment and Adaptive Measurement Method While Drilling” (No. 2021DQ03-17); and the Scientific Research and Technological Development Project of China National Petroleum Corporation’s Engineering Technology Research Institute, titled “Key Technology Research on Complex Structure Multilevel New Wellbore Structure” (No. CPET202315). The funder was not involved in the study design, collection, analysis, interpretation of data, the writing of this article, or the decision to submit it for publication.
Conflict of interest
Authors QW, JZ, XL, GJ, and JY were employed by CNPC Engineering Technology R&D Company Limited and the National Engineering Research Center for Oil & Gas Drilling and Completion Technology. The author CB was employed by Daqing Oilfield Company Limited.
Publisher’s note
All claims expressed in this article are solely those of the authors and do not necessarily represent those of their affiliated organizations or those of the publisher, the editors, and the reviewers. Any product that may be evaluated in this article, or claim that may be made by its manufacturer, is not guaranteed or endorsed by the publisher.
References
Barati, R., Neyshabouri, S. A. A. S., and Ahmadi, G. (2014). Development of empirical models with high accuracy for estimation of drag coefficient of flow around a smooth sphere: an evolutionary approach. Powder Technol., 257.
Cheng, N.-S. (2008). Comparison of formulas for drag coefficient and settling velocity of spherical particles. Powder Technol. 189 (3), 395–398. doi:10.1016/j.powtec.2008.07.006
Dioguardi, F., and Mele, D. (2015). A new shape dependent drag correlation formula for non-spherical rough particles. Experiments and results. Powder Technol., 277.
Dioguardi, F., Mele, D., and Dellino, P. (2018). A new one-equation model of fluid drag for irregularly shaped particles valid over a wide range of Reynolds number. J. Geophys. Res. Solid Earth 123 (1), 144–156. doi:10.1002/2017jb014926
Duan, M. Q., Miska, S., Yu, M. J., Takach, N., Ahmed, R., and Zettner, C. (2008). Transport of small cuttings in extended reach drilling. SPE Drill. Complet. 23 (3), 258–265. doi:10.2118/104192-pa
Fang, G. (1995). An experimental study on free settlement of drilling cuttings in drilling fluid: drag coefficient and settling velocity. Exploration Engineering Geotechnical Drilling Engineering (5), 41–43.
Goossens, W. R. A. (2019). Review of the empirical correlations for the drag coefficient of rigid spheres. Powder Technol., 352.
Guo, X., Lin, J., and Nie, D. (2010). New formula for drag coefficient of cylindrical particles. Particuology 9 (2), 114–120. doi:10.1016/j.partic.2010.07.027
Kelessidis, V. C., and Mpandelis, G. (2004). Measurements and prediction of terminal velocity of solid spheres falling through stagnant pseudo plastic liquids. Powder Technol. 147 (1-3), 117–125. doi:10.1016/j.powtec.2004.09.034
Khan, A. R., and Richardson, J. F. (1987). THE RESISTANCE TO MOTION OF A SOLID SPHERE IN A FLUID. Chem. Eng. Commun. 62 (1-6), 135–150. doi:10.1080/00986448708912056
Larsen, T. I., Pilehvari, A. A., and Azar, J. J. (1997). Development of a new cuttings-transport model for high-angle wellbores including horizontal wells. SPE Drill. Complet. 12 (02), 129–135. doi:10.2118/25872-pa
Liu, Q., Lei, T. S., Sheng, Li G., et al. (2017). Sedimentation velocity prediction model of spherical particles in power-law fluid containing fiber. Petroleum Sci. Circular 2 (02), 298–308.
Machač, I., Ulbrichová, I., Elson, T., and Cheesman, D. (1995). Fall of spherical particles through non-Newtonian suspensions. Chem. Eng. Sci. 50 (20), 3323–3327. doi:10.1016/0009-2509(95)00168-5
Mengbo, Li, Liu, G., and Jun, Li (2014). Research on wellbore temperature field considering non-Newtonian fluid spiral flow. Pet. Drill. Technol. 42 (05), 74–79.
Moreira, B. A., Arouca, F. O., and Damasceno, J. J. R. (2017). Analysis of suspension sedimentation in fluids with rheological shear-thinning properties and thixotropic effects. Powder Technol. 308, 290–297.
Rushd, S., Hassan, I., Sultan, R. A., Kelessidis, V. C., Rahman, A., Hasan, H. S., et al. (2019). Terminal settling velocity of a single sphere in drilling fluid. Part. Sci. Technol. 37 (8), 943–952. doi:10.1080/02726351.2018.1472162
Shah, S. N., El Fadili, Y., and Chhabra, R. P. (2006). New model for single spherical particle settling velocity in power law (visco-inelastic) fluids. Int. J. Multiph. Flow 33 (1), 51–66. doi:10.1016/j.ijmultiphaseflow.2006.06.006
Shahi, S., and Kuru, E. (2015). An experimental investigation of settling velocity of natural sands in water using Particle Image Shadowgraph. Powder Technol., 281.
Sorgun, M. (2013). Simple correlations and analysis of cuttings transport with Newtonian and non-Newtonian fluids in horizontal and deviated wells. J. Energy Resour. Technol. 135 (3), 1–6. doi:10.1115/1.4023740
Sun, L., He, L., He, W., et al. (2021). Major scientific problems and research path of Daqing Gulong shale oil. Petroleum Explor. Dev. 48 (03), 453–463.
Sun, T., Li, C., Xu, Y., Xie, J., Chu, S., Jing, Y., et al. (2024). Measurement of wellbore leakage in high-pressure gas well based on the multiple physical signals and history data: method, technology, and application. Energy Sci. Eng. 12 (01), 4–21. doi:10.1002/ese3.1619
Wang, C., Yang, Z., and Yang, S. (2021). 1268 × 108t! Daqing shale oil exploration made a major breakthrough. Oil gas field ground Eng. 40 (09), 21.
Wang, H., and Liu, X. (1996). Comparison and optimization of drilling fluid rheological model. Drill process 1996 (01), 63–67.
Keywords: Gulong shale, horizontal well, shale cuttings settlement, drag coefficient, power-law fluid, hole cleaning
Citation: Wang Q, Zhang J, Bi C, Liu X, Ji G and Yu J (2024) Study on settling characteristics of rock cuttings from terrestrial high clay shale in power-law fluid. Front. Energy Res. 12:1370803. doi: 10.3389/fenrg.2024.1370803
Received: 15 January 2024; Accepted: 25 March 2024;
Published: 12 April 2024.
Edited by:
Yan Peng, China University of Petroleum, ChinaReviewed by:
Yanan Sheng, Drilling Engineering Technology Research Institute of Sinopec Zhongyuan Petroleum Engineering Co., Ltd., ChinaBo Zhang, China University of Petroleum (East China), China
Copyright © 2024 Wang, Zhang, Bi, Liu, Ji and Yu. This is an open-access article distributed under the terms of the Creative Commons Attribution License (CC BY). The use, distribution or reproduction in other forums is permitted, provided the original author(s) and the copyright owner(s) are credited and that the original publication in this journal is cited, in accordance with accepted academic practice. No use, distribution or reproduction is permitted which does not comply with these terms.
*Correspondence: Qing Wang, d3E0OTY3MDc5QDE2My5jb20=