 Hui Hwang Goh
 Zhen An
 Dongdong Zhang
 Wei Dai
 Tonni Agustiono Kurniawan
 Kai Chen Goh
95% of researchers rate our articles as excellent or good
Learn more about the work of our research integrity team to safeguard the quality of each article we publish.
Find out more
ORIGINAL RESEARCH article
Front. Energy Res. , 04 March 2024
Sec. Energy Storage
Volume 12 - 2024 | https://doi.org/10.3389/fenrg.2024.1367444
Lithium-ion batteries are extensively utilised in various industries and everyday life. Typically, these batteries are considered retired when their state of health (SOH) drops below 80%. These retired batteries, known as secondary batteries, can be repurposed for applications that demand lower battery performance. Precise forecasting of the lifespan of secondary batteries is crucial for determining suitable operational management approaches. Initially, we use the CACLE dataset for thorough investigation. Therefore, to account for the unpredictable and random character of the application circumstances, we employ the U-chord long curvature feature extraction approach to minimise errors resulting from rotation and noise. Additionally, we utilise the discharged power as a feature. This study employs two optimization algorithms, namely, particle swarm optimization (PSO) and sparrow optimization algorithm (SSA), in conjunction with least squares support vector machine (LSSVM) to compare the model against three conventional models, namely, Gaussian process regression (GPR), convolutional neural networks (CNN), and long short-term memory (LSTM). This work comprises two experiments: Experiment 1 utilises the battery’s charging and discharging history data to train the model for estimating the SOH of the remaining cycles of the same battery. Experiment 2, on the other hand, employs the complete discharging data of the battery to train the model for predicting the SOH of the remaining cycles of other batteries. The error evaluation metrics used are mean absolute error (MAE), mean absolute percentage error (MAPE), and root mean square error (RMSE). The results indicate that the average MAE for SSA-LSSVM, LSTM, CNN, PSO-LSSVM, and GPR in Experiment 1 and Experiment 2 are 1.11%, 1.82%, 2.02%, 2.04%, and 12.18% respectively. The best prediction results are obtained by SSA-LSSVM.
Energy access is a paramount concern outlined in the United Nations Sustainable Development Goals (SDGs) (Liang et al., 2022a). A global endeavour is to furnish countries with sustainable and economically viable energy solutions. In light of the potential consequences of energy scarcity, researchers have recently devoted more effort to enhancing the energy storage capabilities of batteries as a source of power (Xie et al., 2023; Xie et al., 2024). Continuous endeavours in sustainable energy storage provide a dependable and efficient method for the commercial sector to evaluate the condition of batteries in their second life. The optimization of battery life cycle management facilitates the incorporation of repurposed batteries into a more extensive energy storage infrastructure (Kurniawan et al., 2022a).
Lithium-ion batteries (LIBs) have experienced accelerated development as an energy source owing to their competitive advantages, including high energy density and extended power life (He et al., 2011; Zhang et al., 2020; Ran et al., 2022). LIBs have found widespread applicability in electric vehicles (EVs) in recent times. Given the substantial carbon dioxide (CO2) emissions that fuel vehicles produce while in motion, there is an increasing imperative to utilise LIBs in order to mitigate the carbon footprint of public transportation. On the contrary, LIBs degrade progressively over time following their initial use (Martinez-Laserna et al., 2018a). In specific application contexts, the battery is decommissioned when its health life reaches 80% of its maximum capacity. According to statistics, the market for degraded batteries was enormous. By 2030, the global capacity of retired batteries for electric vehicles will have increased to 200 GWh (Shahjalal et al., 2022).
Improper disposal of batteries, which often contain iron (Fe), cobalt (Co), manganese (Mn), nickel (Ni), and copper (Cu), can lead to substantial pollution of land and water. Failing to administer proper treatment before disposing of batteries can result in adverse environmental consequences for the metals contained inside them, hence presenting substantial hazards to both human wellbeing and the survival of species (Briffa et al., 2020). Various approaches are available for the proper disposal of fully utilised expended batteries to enhance resource recovery in the energy sector. The optimal method involves extracting valuable materials, such as heavy metals, from the batteries, recycling the batteries in specialised facilities, or repurposing second-life batteries with reduced performance requirements. On the other hand, the least favoured approach for getting rid of unused batteries is to discard them in open dumps as noninorganic garbage (Colarullo and Thakur, 2022).
Notwithstanding the endeavours of governments to advance circular economy implementations in the energy sector, the global recycling rate for batteries stands at less than 6% owing to the inadequate infrastructure for recycling (Bhar et al., 2023). Recycled batteries were therefore not economically viable in the absence of research and development (R&D) facilities. The waste recycling process was rendered challenging due to the diverse chemical composition and types of batteries, in addition to the inadequate apparatus. As a result, within the framework of circular economy, it is ecologically preferable to utilise batteries in situations that do not necessitate exceptional performance (Jo and Myung, 2019; Kurniawan et al., 2022b). Hence, in the context of the circular economy, reusing batteries is among the most optimal alternatives for safeguarding the environment against metal contamination and promoting resource recovery from unused waste (Liang et al., 2022b). This practice successfully prevents the disposal of depleted batteries into nearby landfills as inorganic waste subsequent to their capacities becoming full (Kurniawan et al., 2023).
The requirement for material recovery from downstream processing has led to a renewed emphasis in the field of energy storage research on the repurposing of second-life batteries, as the demand for sustainable energy solutions has increased in recent times. By encouraging waste conservation and eco-friendly lifestyles, China promotes environmental sustainability. A zero-waste strategy is implemented when resource recovery is encouraged in order to reduce waste generation through the utilisation of unused byproducts from other industries. As a result, environmental impacts are diminished and resource efficiency is increased (Batool et al., 2023).
Nevertheless, determining the precise condition of these batteries has evolved into a difficult task, further complicated by the unpredictability of discharges in practical operational situations and the uncertainty surrounding historical ageing data (Martinez-Laserna et al., 2018b). After their initial use, secondary batteries gradually lose their functionality. In the event of substantial degradation in their lifespan, the batteries must be promptly replaced with others. As a result, it is critical to precisely assess the condition of secondary batteries in order to increase their longevity and cost efficiency (Faraji-Niri et al., 2023).
To achieve this objective, strategies for predicting battery state of health (SOH) were classified into three distinct categories: model-based approaches, data-driven methods, and hybrid methods (Wang et al., 2024). Model-based approaches allow for the feasibility of predictions using a wide range of models. Li et al. (2016) introduced a streamlined electro-thermal chemistry model with reduced parameters, capable of simulating battery performance across various operational scenarios. Son et al. (2016) introduced a method for updating online models utilising the restricted Kalman filter approach, which proved to be highly effective. However, in reality, methods that predict the SOH based on models are limited by many technological barriers. These barriers include difficulties in extracting data and constructing models, which eventually impair the accuracy of the predictions.
Compared to model-based approaches, data-driven methods have been found to possess superior flexibility and accuracy in actual scenarios (Qian et al., 2023). This allows them to anticipate battery SOH without the need for a deep understanding of intricate physics. In order to achieve accurate model predictions, it is essential to have well-extracted features that have a significant link with battery health when using data-driven approaches (Li et al., 2024). Guo et al. (2019) introduced a feature extraction technique that relies on charging voltage, current, and temperature curves. They applied principal component analysis to eliminate unnecessary data and decrease computing complexity. In order to assess the SOH of satellite batteries, Yang et al. (2020) devised a technique that relies on measurable metrics from the battery management system, including voltage, current, time, and temperature. These characteristics serve as dependable and universally applicable indicators of the battery’s health. The efficacy of the suggested health indicators was validated across various discharge rates.
Machine learning models have utilised different data-driven methods to forecast the battery SOH (Barré et al., 2014). These methods include GPR (Richardson et al., 2017), weighted least squares support vector machine (WLS-SVM) (Xiong et al., 2023), LSTM (Wang et al., 2023), support vector machine (SVM), random forest (RF), and multiple linear regression (MLR). Hybrid approaches integrate optimization algorithms with data-driven methods or combine filtering methods with other models. A further study utilised machine learning (ML) methods and electrochemical impedance spectroscopy (EIS) testing to improve the accuracy of the SOH prediction process (Faraji-Niri et al., 2023). Nevertheless, if the battery SOH was inadequate, their approach could not be verified, and the range of its prediction interval fluctuated between 0.7 and 1.0. Moreover, further verification is necessary to determine the effectiveness of the aforementioned integrated models in calculating the lifespan of secondary batteries. Previous studies employed a blend of algorithm optimization and data-driven methods to decrease errors. Their contribution was the incorporation of data-driven methodologies and optimization techniques, leading to negligible inaccuracies. The longevity of LIBs can be forecasted using the whale optimization algorithm (WAO) and Gaussian process regression (Li et al., 2023). These methods utilise an improved bird swarm algorithm and least squares support vector machine (IBSA-LSSVM) model (Li et al., 2019). Hybrid approaches, in comparison to single data-driven methods, need more computer resources and possess a greater number of parameters. Nevertheless, this approach can effectively surpass the individual constraints of each method, resulting in enhanced predictive capabilities.
When the battery health life exceeded 80%, reasonable prediction results could be obtained using the two-pulse method (Coleman et al., 2008). Alternatively, its accuracy diminished when the SOH of the battery fell below 80%. As a result, there is an increasing imperative to enhance research efforts concerning secondary batteries in order to examine the predicament of batteries with a second life of less than 80%.
An additional technological limitation is that the assessment of battery health is frequently complicated by the unpredictability of their discharge patterns. In order to fill in the current research voids, this study tackles the issue of uncertain discharge conditions by proposing a comprehensive framework for feature extraction. The curvature parameter is a critical feature that provides reliable indicators of the health status of the battery. To accomplish this, discrete curvature analysis is utilised to distinguish subtle variations in discharge curves.
Moreover, this study aims to improve the accuracy of SOH predictions for second-life batteries. To accomplish this, it examines the functions of three publicly available datasets in the analysis of a subset of health lifespan batteries with a range of 0.2–0.8, which more closely resembles the practical operational conditions of second-life batteries. In addition, a novel method for estimating the SOH of second-life batteries under ambiguous discharge conditions is proposed in this study. In order to mitigate the unpredictability and uncontrollability of the real-world environment, this study employed the U-chord long curvature feature extraction technique, which utilised the uncertain discharge amount as an feature and reduced errors caused by rotation and noise. In order to improve the accuracy of the LSSVM-based batteries’ SOH prediction, this study introduces a novel approach that utilises discrete curvature feature extraction and the complexities of discharge profiles to leverage the potential of discharge profiles. This is achieved by combining optimization algorithms such as particle swarm optimization (PSO) and sparrow optimization algorithm (SSA) with the LSSVM, which is dependent on the precision of penalty factors and kernel parameters. The techniques delineated are anticipated to efficiently manage uncertainties linked to discharge scenarios of batteries, thereby enhancing the dependability of health status in practical applications. Furthermore, the results obtained from this research can be implemented in battery management systems (BMS) in order to enhance the health life management of secondary batteries, prolong their operational lifespan, and mitigate the ecological consequences associated with battery processing. Furthermore, it is expected that the integration of SSA-LSSVM, PSO-LSSVM models, and new energy systems will increase the proportion of renewable energy consumption in the energy sector while making battery health estimation techniques more dependable and economically viable.
The primary contributions of this article can be summarised as follows: (1) The U-chord long curvature technology is employed to determine the curvature of the discharge curve of secondary batteries. This allows for the division of the discharge curve into three portions and the identification of the discharge plateau region. (2) Four distinct eigenvalues, closely associated with battery SOH, are chosen, with particular emphasis on the discharge capacity as one of the eigenvalues. (3) Utilise optimization algorithms, such as particle swarm optimization and sparrow optimization algorithm, in conjunction with Least Squares Support Vector Machines, to accurately predict the SOH of a battery.
The subsequent content of this article will be presented. Section 2 presents the process of filtering the data set, while Section 3 examines the discharge curve using U-chord long curvature and extracts characteristic values. Section 4 primarily presents two novel algorithms that combine optimization techniques with existing optimization algorithms. Section 5 presents empirical data and provides comparisons of different methodologies. Ultimately, Section 6 presents the final findings and deductions.
In order to authenticate the suggested approach, an exhaustive mining operation was performed on three publicly accessible experimental datasets pertaining to battery ageing: the Center for Advanced Life Cycle Engineering (CALCE) dataset from the University of Maryland (Dos Reis et al., 2021), the National Aeronautics and Space Administration (NASA) dataset (Jafari and Byun, 2023), and the Oxford dataset from the Howey Research Group UK (Birkl, 2017). The subsequent section describes the experimental conditions for each dataset.
The CS2 dataset, consisting of CS2_35, CS2_36, CS2_37, and CS2_38, was chosen from the CACLE public data. The dataset was identified to contain trace amounts of Mn and had a chemical composition of LiCoO2 cathode, as indicated by the EDS analysis. Apply a steady current of 0.5 C until the voltage between the terminals reaches a stable value of 4.2 V. The charging process stopped when the current fell below 50 mA. During the process, a current of 1.1 A was used to deplete the battery until the terminal voltage reached the predefined cut off value of 2.7 V. The initial capacity of these four batteries was at least 1.1 Ah.
LiNi0.8Co0.15Al0.05O2 (NCA) cells (B0005, B0006, B0007, and B0018) were obtained by NASA from one of their databases. At 24°C, both charging and discharging took place at room temperature. A current of 1.5 A was employed to discharge the battery to 4.2 V during the charging process. In constant voltage (CV) mode, the charging procedure was discontinued when the charging current decreased to 20 mA or less. A constant current of 2 A was applied during discharge until the predetermined voltages of B0006 and B0018 were attained at 2.5 V, and B0005 and B0007 attained the predetermined voltages of 2.7 V and 2.2 V, respectively. The experiment was terminated when the battery achieved the end-of-life (EOL) criterion, which stipulated a reduction in rated capacity by 30%, from 2 to 1.6 Ah.
A selection of cells (Cell1-Cell8) was made from the Oxford dataset that featured an anode composed of graphite and a cathode composed of Li and LiNi-Co oxide. A hot cell underwent both charge and discharging processes at 40°C. At the same current level, the battery was charged to 4.2 V at 740 mA and discharged to 2.7 V.
The Equation 1 were applied to the data obtained from the three databases in order to ascertain the state of health (SOH):
where:
A SOH ranging from 1 to 0.8 distinguished primary batteries. In contrast, there were divergent viewpoints among experts regarding the secondary battery’s end of life (EOL) standard. Mussi et al. (2022), Liu et al. (2022) proposed decommissioning of the secondary battery at SOH 0.6, whereas others Braco et al. (2022) suggested retirement at SOH 0.2. Unsurprisingly, the secondary battery is ceased operation at the SOH is 0.2, a broad range.
This study is primarily concerned with estimating the SOH of a secondary battery. The SOH statistics for the battery ranged from 0.2 to 0.8. Figure 1 depicts the batteries consisting of the Oxford dataset and the NASA dataset, exhibiting SOH values ranging from 0.6 to 1.0. After meeting the necessary requirements, we have chosen the CACLE dataset as the subject of our studies. It is worth mentioning that the highest value of battery SOH in any of the three datasets was not equal to 1, as the rated capacity was only an approximation.
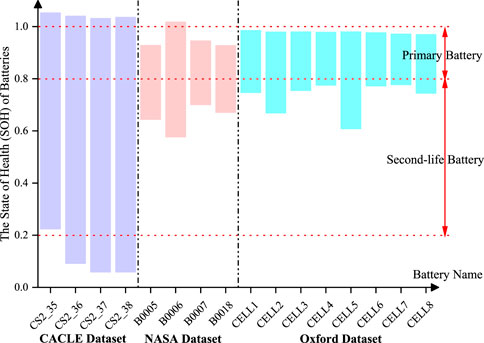
FIGURE 1. SOH intervals for three data sets.
The experimental data were obtained from the CS2_35-CS2_38 battery datasets maintained by the CACLE group. The datasets pertaining to the secondary battery section comprise data on the complete discharge cycle of each battery, including time, voltage, current, temperature, and capacity. In particular, the secondary batteries CS2_35, CS2_36, CS2_37, and CS2_38 have respective cycle periods of 330, 423, 419, and 476.
The procedure for obtaining the characteristics was outlined in Section 3. Guo and Zhong (2014) introduced the U-chord curvature technology, a discrete approach for calculating curvature that does not rely on a defined curve function and exhibits strong robustness. This section presents a model that is built on U-chord curvature and identifies four straightforward features that have a strong link with battery State of Health (SOH). The usefulness of these features is then validated using the Pearson correlation coefficient (Deng et al., 2021).
Since the features were obtained from the discharge curve, it was necessary to analyse the discharge curve of the battery. The greater SOH range of the CALCE No. CS2_36 battery (Figure 2) could be ascertained through an examination of the battery’s discharge curve. The discharge trajectories of this battery at SOH values of 0.25, 0.5, and 0.8, respectively, are illustrated in Figure 2. The CS2_36 battery’s discharging process was observed to be divided into three phases, with point A delineating the initial stage from stage two, and point B distinguishing the second stage from stage three.
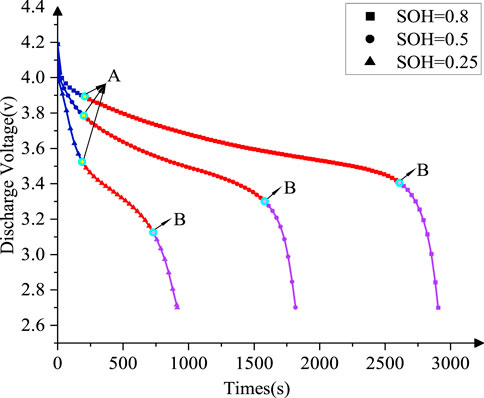
FIGURE 2. CALCE CS2_36 battery discharge curve.
Point A signifies the maximum U-chord curvature, while point B denotes the minimum U-chord curvature. Over the course of the first and third phases, the voltage dropped precipitously. However, as time progressed through the second stage, the voltage changes diminished. This interval was investigated as it was referred to as the voltage plateau region. The secondary battery’s discharge curve exhibited a more rapid transition and the duration of the voltage plateau zone decreased as the battery aged.
In order to identify the voltage plateau region of the discharge curve, the coordinates A and B that divide the discharge curve must be determined. The identification of the characteristic points of the curve was predicated on the curvature of the profile. Curvature is a parametric measure that characterises the localised nature of a curve; more specifically, it quantifies the localised shape of a given point on the curve. Curve C represents the rate of rotation of the arc length of the point in the tangential direction. A point’s curvature decreases in proportion to the degree of curvature of the curve.
As a result of the discrete nature of the discharge curve and the lack of explicit function expressions, computing the curvature of individual points on the curve presents a technical challenge. Hence, it was necessary to develop a method for calculating curvature that takes into consideration discrete properties and the lack of explicit function expressions. The differential curvature method was typically employed for the computation of discrete curvature. With the advancement of mathematics, the U-chord curvature method exhibited superior performance in terms of noise resistance and rotation compared to earlier methodologies.
The support neighbourhood is ascertained through the utilisation of the Euclidean distance and the U-chord curvature. By employing this methodology, the impact of rotation and disturbance on the outcomes derived from the curvature computation is reduced. Eq. 2 is collection of multiple discrete points, denoted by
where:
where:
The constraint is Eq. 4.
where:
The implicit refinement approach for numerical curves presented in Goh et al. (2022) is used to provide a solution to Eq. 3. A linear interpolation was utilized to refine the curves since it was computationally simple and yielded adequate numerical results, as compared to polynomial interpolation of higher order. Particularly, Eq. 5.
where:
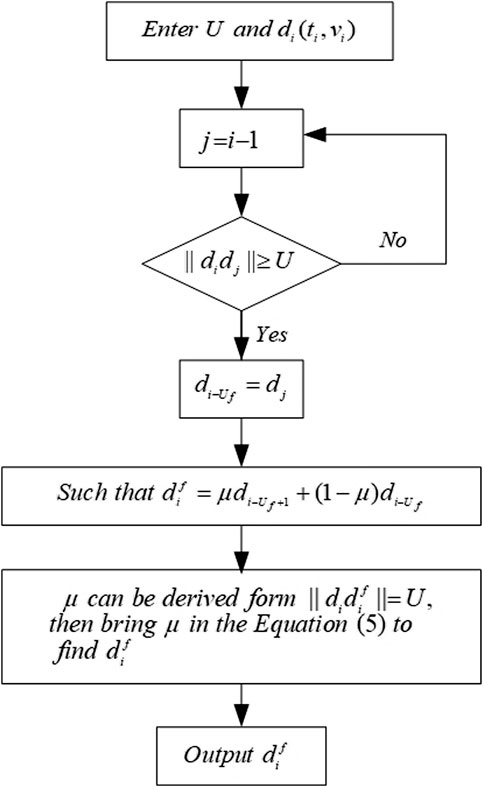
FIGURE 3. Steps for determining the support collar neighborhood.
After performing the steps in Figure 3,
To determine the U-chord length curvature, the discrete curvature is the cosine value associated with the angle between the front and rear arm vectors of the support field, as derived by Eq. 6.
where:
where:
The U-chord length curvature associated with each position on the discharge curve is illustrated in Figure 4. Between points A and B was the curvature that constituted the voltage plateau zone. Point B exhibited the least equivalent U-chord length curvature compared to point A.
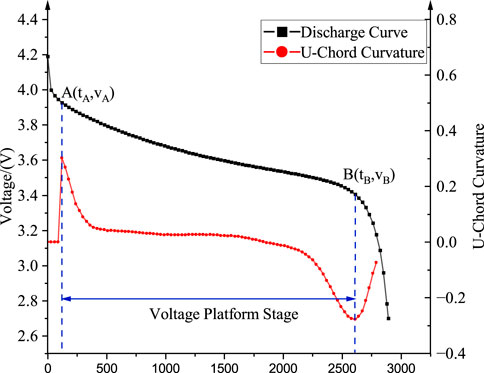
FIGURE 4. Discharge curves and corresponding U-chord length curvature curves.
As shown in Figure 2, the location of nodes A and B shifted proportionally with the number of battery cycles. In order to derive the features, the data from the two sites and the voltage plateau region between them were utilised. In this study, the plateau discharge capacity of the battery was utilised as an feature. SOH can be accurately predicted by identifying representative features and associating them with the SOH of a battery. The present article utilised four features denoted by Eqs 8–13.
1)
2)
3)
4)
where:
The correlation between the extracted features and the cell SOH is investigated in this section. Equation 14 uses the Pearson correlation coefficient which is commonly employed to quantify the extent of linear correlation between two variables.
where:
When there is correlation coefficient
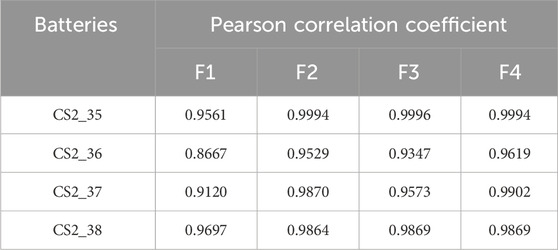
TABLE 1. CS2_35-CS2_38 cell SOH and Pearson coefficient of features.
In Section 4, the models were trained and evaluated using features that were correlated with the SOH of the battery. In previous studies pertaining to the prediction of battery health and life, effective techniques included Gaussian process regression, artificial neural networks, and extended short-term memory. In contrast to primary batteries, secondary batteries exhibit a shorter charging platform and more substantial changes that complicate conventional prognosis methods when it comes to predicting their health life.
By utilising the sum of squared errors as an empirical loss and converting the inequality constraints present in traditional SVM to equality constraints, LSSVM reduced the convex quadratic programming problem that SVM was originally designed to solve to a system of linear equations (Suykens et al., 1999). LSSVM is applicable for both regression curve fitting and classification. For predicting the health life of secondary batteries, its regression curve fitting function was utilised extensively. The fundamental principle is expounded upon as Eq. 15:
where:
By taking partial derivative of Eq. 16 and simplifying it to 0, Eq. 17 can be deduced.
The Eq. 18 is the matrix form of Eq. 17:
Eqs 19, 20 provide further explanation of the parameters in Eqs 18, 21 defines gamma, another key parameter of the LSSVM.
where:
When
By solving the system of Eq. 18 the LSSVM regression function in Eq. 22 can be obtained as follows:
The key parameters of LSSVM include kernel function parameter
The algorithm known as particle swarm optimization (PSO) was suggested in consideration of avian behaviour (Kennedy and Eberhart, 1995). During the search process, each particle recorded its previous optimal results and parameters while proceeding in its own specific trajectory. Concurrently, every particle contributed its own outcomes and parameters. The particle swarm was thus informed of the present optimal parameters. With the passage of time and in consideration of their own and the group’s experience, the particles modified their subsequent search path and eventually discovered the global optimal solution.
A metaheuristic algorithm, the sparrow search algorithm (SSA) is designed to emulate the predation and anti-predation strategies employed by sparrows (Xue and Shen, 2020). Sparrows were classified as either producers or observers. Producers have larger energy reserves, and the amount of energy reserves depends on individual fitness. Each sparrow has the potential to develop into a producer, but the total number of producers remains unchanged. Identifying regions abundant in food resources and defending against predation, wherein individuals vied for resources, fell under the purview of producers. The producer led the followers as the sparrows at the periphery swiftly relocated to a secure location upon detecting impending danger. Those with diminished energy reserves, meanwhile, sought sustenance elsewhere.
Both PSO and SSA exhibited remarkable optimization capabilities. This work employed two optimization algorithms to optimise the hyperparameters of the LSSVM. Figure 5 displays a flowchart illustrating the process of creating the model.
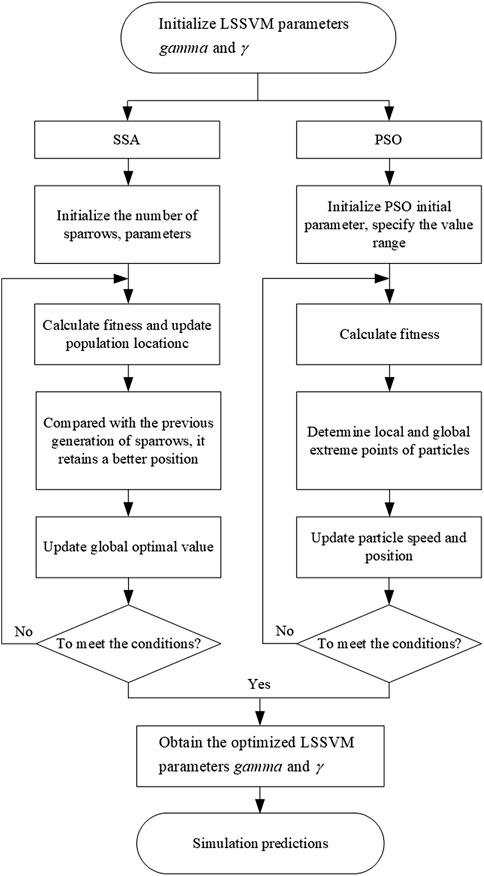
FIGURE 5. Principles of SSA-LSSVM and PSO-LSSVM prediction models.
The flowchart for the complete experiment is depicted in Figure 6. This study began by screening the battery SOH data between 0.2 and 0.8, then extracted the characteristic values of secondary batteries using U-chord curvature technology, and finally estimated the secondary battery’s health life using the following five models: GPR, CNN, LSTM, PSO-LSSVM, and SSA-LSSVM. Mean absolute error (MAE), root mean square error (RMSE), and absolute percentage error (MAPE) were subsequently employed as evaluation metrics to quantify the discrepancy between the anticipated and realised secondary battery health times. Eqs. 23–25 represented their respective calculation methodologies.
where:
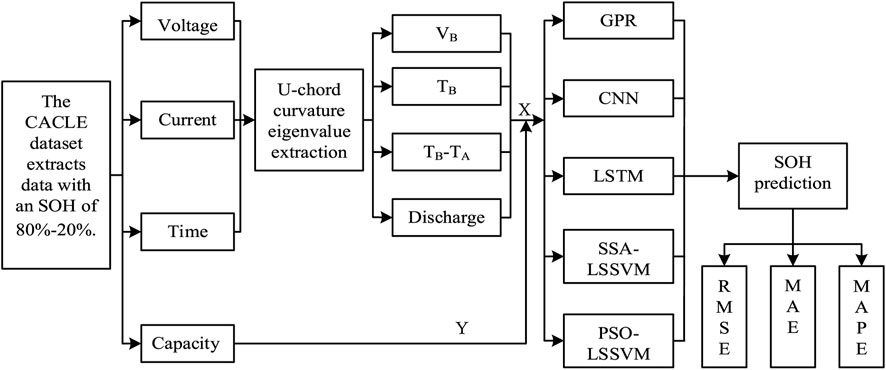
FIGURE 6. Flowchart of secondary battery health life estimation.
In order to assess the efficacy of the suggested approach, two experiments were conducted utilising three error indices MAE, MAPE, and RMSE for this evaluation. Several models in Experiment 1 exhibited significant errors. Nevertheless, with the expansion of the training data in Experiments 2.1 and 2.2, the prediction error exhibited a progressive decrease. This developed a methodology to enhance the precision of forecasting second-life batteries, particularly in situations involving discharge power uncertainties.
This section provides a detailed account of two experiments in which the precision and effectiveness of various machine algorithms and U-chord length curvature feature extraction techniques were contrasted and validated. A Li-battery discharge history cycle record was utilised to train the model in Experiment 1. Following that, the model that had undergone training was employed to predict the SOH of its own remaining cycles. Similar to the primary battery, this experiment validated the capability of the secondary battery to deduce its SOH for subsequent cycles despite the scarcity of data.
The remaining cycle expectancies of secondary batteries CS2_35-CS2_38 were predicted in Experiment 1 using their historical cycle records. In order to train the model, additional numbered secondary battery discharge recordings were utilised in Experiment 2. The model that had undergone training was subsequently applied to predict the battery’s SOH. The objective of this experiment was to evaluate the suitability of the model, augment the dataset, and ascertain whether it could overcome the difficult predictive characteristics of secondary batteries, which have restricted cycles and variability.
Experiment 2.1 and Experiment 2.2 constituted the two discrete components that comprised Experiment 2. Experiment 2.1 involved training the regression model with CS2_35-CS2_38 in order to generate predictions pertaining to the remaining three batteries’ health. To illustrate, the model was trained utilising CS2_35 in order to generate forecasts regarding the anticipated lifetimes of CS2_36, CS2_37, and CS2_38 batteries, respectively.
Experiment 2.2. involved training the model with three secondary batteries in order to generate predictions regarding the residual lifespan of the secondary batteries. In light of this rationale, the model underwent training utilising three secondary batteries, namely, CS2_35, CS2_36, and CS2_37, with the purpose of predicting the remaining useful life of CS2_38.
70% of the data from each secondary battery was initially designated as the training set in Experiment 1, with the remainder of the data being allocated as the test set. It is evident that the magnitude of the voltage plateau region of the secondary battery increased in tandem with the number of cycles performed. Notwithstanding this, an abrupt decline in length occurred, characterised by a swift progression of degradation. The behaviour of this conduct was in direct contrast to that of the primary battery. The work’s predictive capabilities were dramatically tested by the rapid rate of change and substantial degree of instability.
The positive prediction outcomes of GPR, CNN, LSTM, and SSA-LSSVM were comparable to the actual values, as shown in Figure 7A. The preponderance of the various prediction approaches, however, predicted subpar results, as shown in Figures 7B–D. Figure 7B did not display the GPR prediction method, however, because the GPR prediction results exceeded the axes’ range and were therefore irrelevant to the reference. Conversely, in comparison to alternative prediction methods, it was evident that the SSA-LSSVM prediction method exhibited a markedly superior performance.
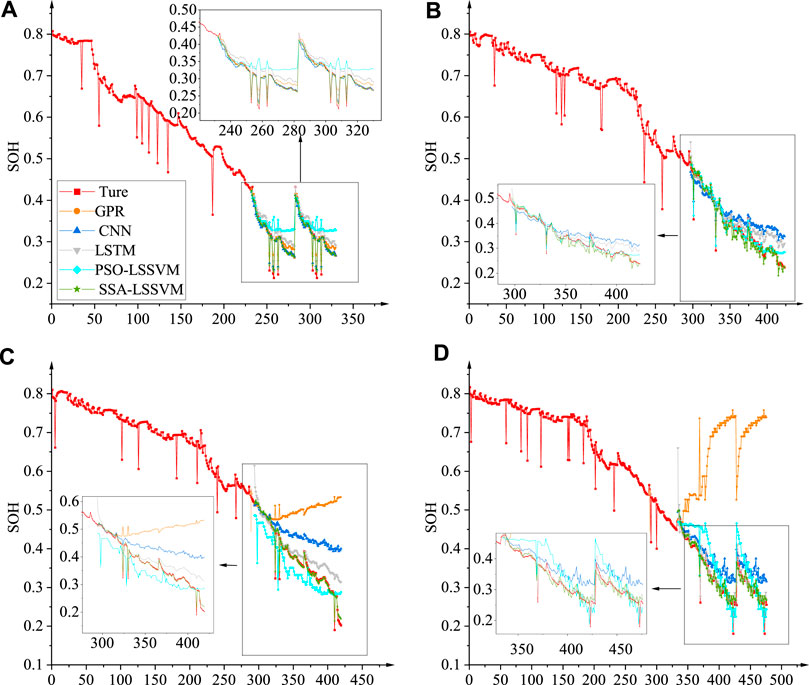
FIGURE 7. (A) Estimated results for CS2_35, (B) estimated results for CS2_36, (C) estimated results for CS2_37, (D) estimated results for CS2_38.
On the other hand, as illustrated in Figure 7D, the LSTM prediction method demonstrated an inadequate initial performance. Conversely, the SSA-LSSVM prediction approach approached the actual value with a more pronounced degree of convergence (Figure 7C). In addition to improved CS2_35 cell prediction outcomes, GPR performance was substantially diminished. Failure of GPR was observed in the remaining cell predictions. The significant variations in the voltage plateau region of the secondary battery’s discharge curve with increasing cycle count, in conjunction with the non-representative nature of the historical data, may account for the suboptimal results observed with the various prediction methods. Experiment 1’s results indicate that alternative algorithms, excluding SSA-LSSVM, do not perform optimally when applied to historical data in order to estimate the remaining service life of secondary batteries.
Figure 8 displays the error plots of Experiment 1, which employed self-historical data to predict its own healthy life expectancy. Figure 8 employs a logarithmic coordinate axis to accommodate the significant fluctuation in inaccuracy resulting from the use of various techniques. The logarithmic coordinate axis was more effective than the traditional coordinate axis in accurately representing errors of different magnitudes. Figure 8 demonstrates that SSA-LSSVM outperformed the other four prediction methods when the experimental dataset was limited in size. The hybrid approaches have a benefit when there is less data, as they require more appropriate hyperparameters in such cases. The sparrow optimization algorithm enhances its ability to discover the global optimal solution more efficiently by adapting its search strategy and search speed. The particle swarm optimization technique exhibits superior global search capabilities during the first phase, but it is susceptible to converging towards a local optimal solution.
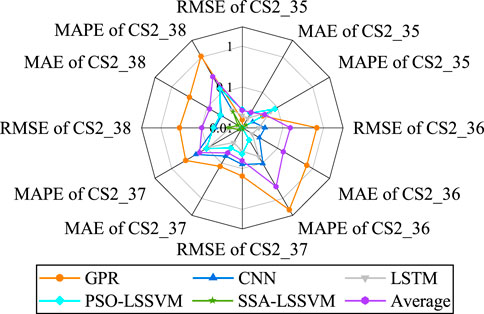
FIGURE 8. Radar plot of prediction error for Experiment 1.
The projected durations of the three secondary batteries are depicted in Figure 9. The predictions were generated by training the model using CS2_35, CS2_36, CS2_37, and CS2_38 as input data. Unlike the results shown in Figure 7, there was a substantial increase in the convergence between the real values and the predicted values produced by the different prediction algorithms. However, Experiment 2.1 demonstrated that the forecasting performance of the GPR approach was not dependable. Insufficient training samples are a significant factor contributing to this issue. Alternatively, several datasets may be appropriate for distinct types of kernel functions. Improper selection of hyperparameters can also lead to a decline in the performance of GPR.
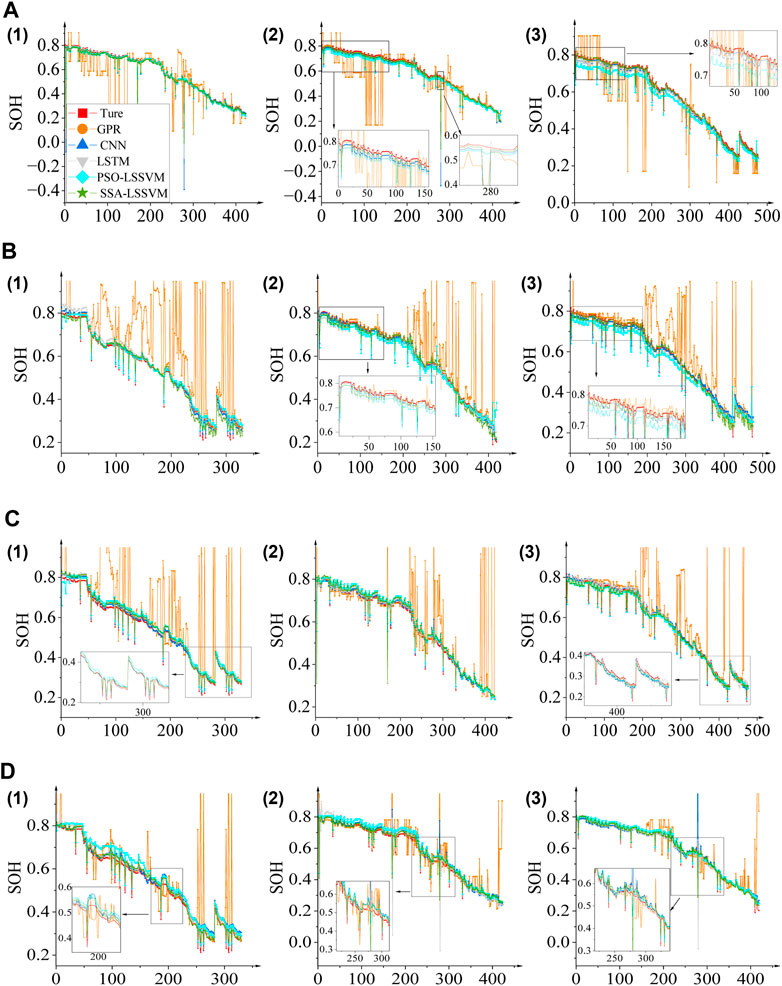
FIGURE 9. Estimated results for Experiment 2.1. (A) CS2_35 training model to predict other batteries’ SOH: (1) Estimated results for CS2_36, (2) estimated results for CS2_37, (3) estimated results for CS2_38. (B) CS2_36 training model to predict other batteries’ SOH: (1) Estimated results for CS2_35, (2) estimated results for CS2_37, (3) estimated results for CS2_38. (C) CS2_37 training model to predict other batteries’ SOH: (1) Estimated results for CS2_35, (2) Estimated results for CS2_36, (3) Estimated results for CS2_38. (D) CS2_38 training model to predict other batteries’ SOH: (1) Estimated results for CS2_35, (2) Estimated results for CS2_36, (3) Estimated results for CS2_37.
The forecast values of the different prediction methods were observed to be more closely aligned in Figure 9 (A, 1), (B, 1), (B, 2), (C), (D, 2), and (D, 3).
The PSO-LSSVM method exhibited the highest level of monitoring accuracy, as shown in Figure 9 (A, 2). In particular, the PSO-LSSVM method maintained its stability and demonstrated a strong correspondence with the actual values of the curve, while the GPR, LSTM, CNN, and SSA-LSSVM methods displayed substantial increases during the cyclic period around 280. The PSO-LSSVM method consistently produced a downward shift in the predicted value curve (Figure 9 (A, 3) and (B, 3) relative to the actual value of the curve. On the contrary, the predicted value curve obtained through the PSO-LSSVM method exhibited an upward shift in comparison to the actual value depicted in Figure 9 (D, 1). Based on the experimental results, it can be observed that the predicted value curves generated by the SSA-LSSVM, CNN, and LSTM methods in Experiment 2.1 exhibited the highest proximity to the actual values. While the PSO-LSSVM approach did demonstrate intermittent vertical or horizontal shifts, it did not undergo any abrupt transitions.
Furthermore, Figures 10A–D represented the error results for each training session, corresponding to Figures 9A–D accordingly. In Experiment 2.1, the GPR had the highest prediction error, surpassing the average value, as depicted in Figure 9. In contrast, the remaining approaches exhibited relatively reduced prediction errors.
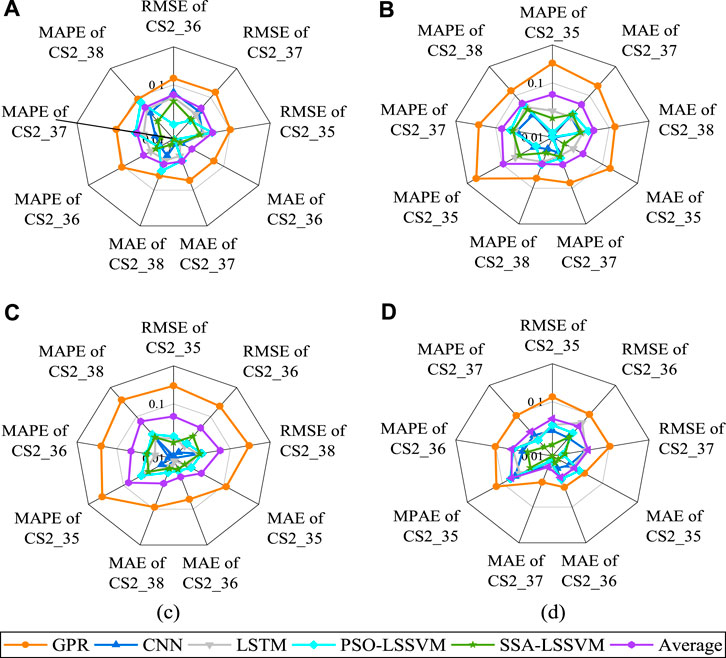
FIGURE 10. Radar plot of prediction error for Experiment 2.1: (A) CS2_35 train, predict others, (B) CS2_36 train, predict others, (C) CS2_37 train, predict others, (D) CS2_38 train, predict others.
Upon augmenting the training dataset with three supplementary secondary battery datasets, the model demonstrated the capability to forecast the healthy lifespan of the remaining secondary batteries. The experimental results are visually represented in Figure 11, whereas Figure 12 illustrates the prediction error.
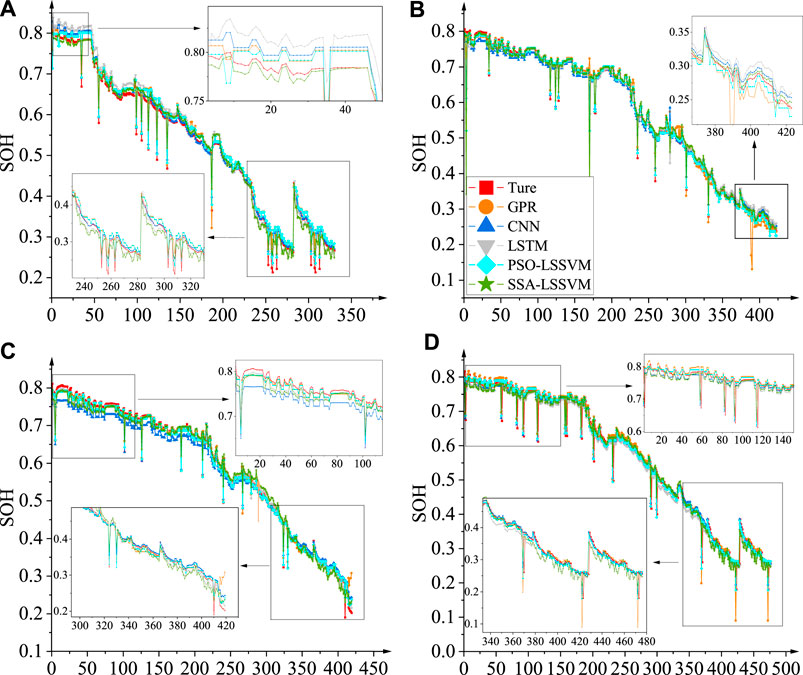
FIGURE 11. CS2_35-CS2_38 Training model for any three secondary batteries to predict remaining battery health life: (A) Estimated results for CS2_35, (B) Estimated results for CS2_36, (C) Estimated results for CS2_37, (D) Estimated results for CS2_38.
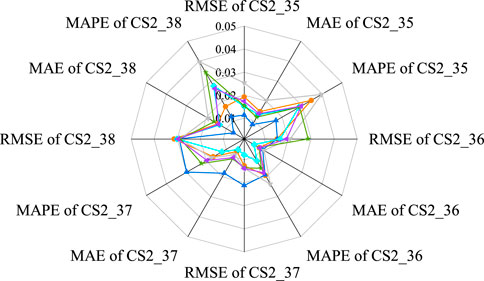
FIGURE 12. Radar plot of prediction error for Experiment 2.2.
The predictions of Experiment 2.2 are illustrated in Figure 11. Upon comparing Figure 7 with Figure 9, it was observed that the predicted values derived from various prediction methods approached the actual values in a progressive manner. Consequently, the implementation of the GPR method is no longer deemed ineffective and can be regarded as a dependable approach to prediction.
Figure 12 clearly shows that Experiment 2.2 revealed the LSTM approach to have the highest error in prediction. In contrast, the PSO-LSSVM and SSA-LSSVM techniques had the lowest prediction error. The primary cause of this phenomena can be attributed to the memory function of the LSTM. In Experiment 2.2, we trained the model using three secondary batteries, which potentially overburdened the LSTM’s memory function due to the varying decay and history of each battery. In addition, it is important to mention that the mean absolute error (MAE) for all evaluated techniques is consistently below 2.03%, with the exception of SSA-LSSVM and PSO-LSSVM, which have reduced their MAE errors to below 1.61%.
For each experiment, the error values are detailed in Table 2. More precisely, the error in forecasting the secondary battery (CS2_35) was assessed in Experiment 1 (EXP_1). According to the results, the MAE achieved with SSA-LSSVM was 1.24%, 2.16%, 2.86%, and 27.68% less than with LSTM, PSO-LSSVM, CNN, and GPR, respectively.
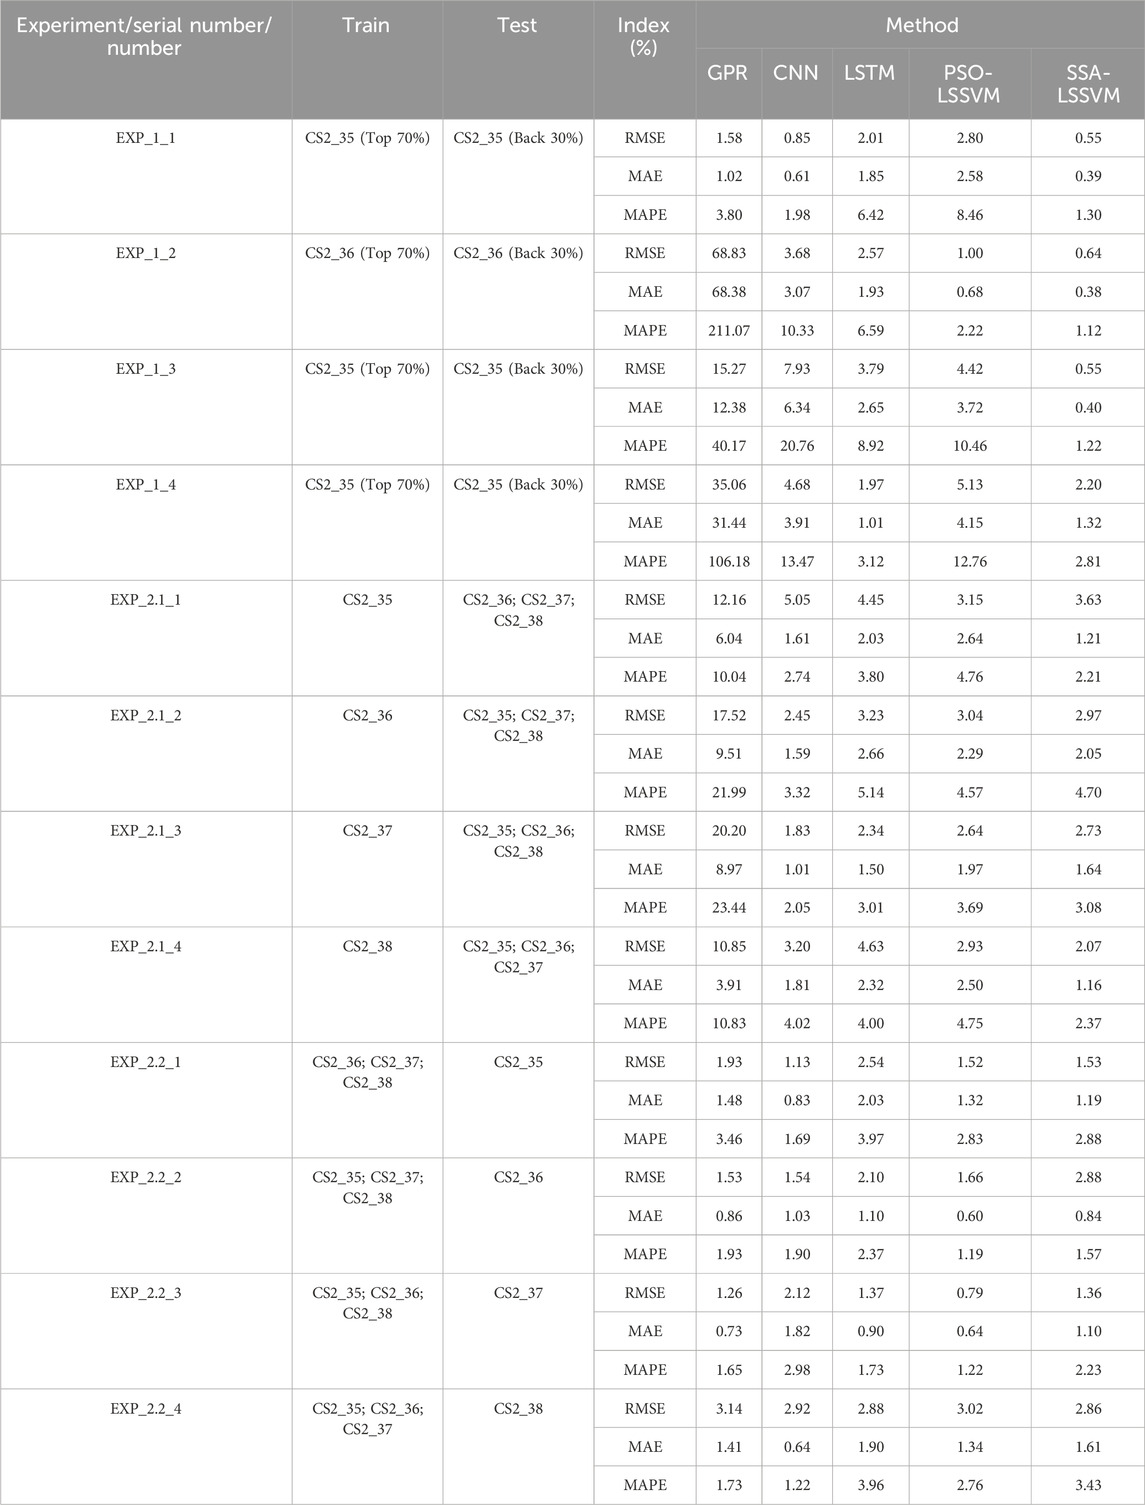
TABLE 2. Errors in the prediction results of various prediction methods for the U-chord long curvature model.
However, it is important to highlight that the MAE linked to the GPR prediction approach in Experiment 1, particularly in regards to the forecast of CS2_36 (EXP_1_2), was considerably elevated at 68.38%. The observed disparity in performance between the GPR’s exceptional predictive capabilities for primary batteries and its below average performance for secondary batteries implies that specific prediction techniques might not produce acceptable outcomes for the latter. The heightened prediction error that resulted from the accelerated decrease in voltage plateau and increased individualization of secondary batteries relative to primary batteries can be attributed to this.
Experiment 2.1 (EXP_2.1) employed five prediction approaches to estimate the remaining lifespan of three additional batteries. Assertions were produced using the CS2_35 training model. The computation of mean errors (EXP_2.1_1) revealed that the maximum MAE decreased to 9.51% with the implementation of several prediction algorithms. Conversely, the MAE obtained a value of 1.21%. Figure 12 exhibits the precise discrepancies between the predicted values and the actual values that were observed in Experiment 2.1.
Experiment 2.2 (EXP_2.2) consisted of training the model to predict the healthy life expectancy of CS2_35 (EXP_2.2_1) using data from CS2_36 to CS2_38. The minimal MAE remained at 0.83%, while the maximum MAE for the different prediction approaches reduced to 2.03%. The MAE in EXP_2.2_2 ranged from 1.1% to 0.6%. The MAE in EXP_2.2_3 ranged from 1.82% to 0.64%. The MAE in experiment EXP_2.2_4 reduced to a range of 1.90% to 0.64%.
In order to facilitate a thorough assessment of the effectiveness of these models in estimating the longevity of the secondary batteries, the mean errors generated by the five prediction methods throughout the experiment are displayed in Figure 13. From Experiment 1 to Experiment 2, as the volume of data increased, the predictive accuracy of GPR demonstrated a progressive enhancement. This implies that by increasing the quantity of experimental data, the proposed prediction model for secondary batteries could be improved in terms of effectiveness. Errors were reduced in Experiment 1 using the LSTM, PSO-LSSVM, and SSA-LSSVM prediction methodologies. Nevertheless, the SSA-LSSVM method exhibited the highest level of predictive efficacy in Experiment 2.1. In general, the predictive algorithms PSO-LSSVM and SSA-LSSVM produced smaller errors than alternative approaches. GPR is the most efficient in terms of computational load. Artificial neural networks, such as LSTM and CNN, exhibit sluggish performance, however hybrid technologies, including SSA-LSSVM and PSO-LSSVM, incorporate parameters such as optimization range, number of iterations, and optimization step length in the optimization method. Their computation time and workload varies from that of the optimization algorithm. Regarding parameter configuration.
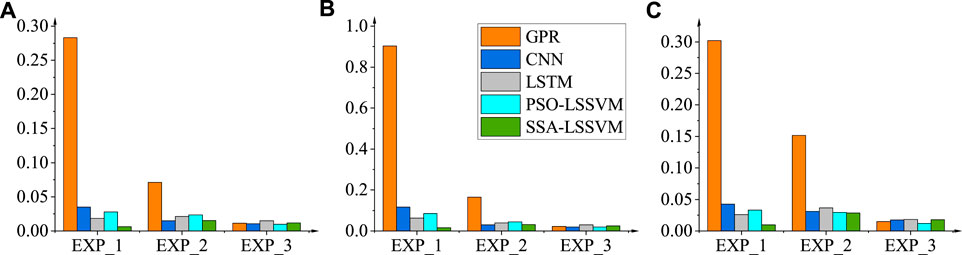
FIGURE 13. Mean values of predictive errors for the CACLE Group lithium battery dataset: (A) MAE, (B) MAPE, (C) RMSE.
This work has demonstrated that the predictive accuracy of secondary batteries is primarily determined by the quality of the modelling and the quantity of historical data. The superior performance of the established prediction model SSA-LSSVM was evidenced by Experiment 1, which employed a reduced dataset and yielded an average MAE of 0.62%. It was determined that this value exceeded the MAEs of LSTM, PSO-LSSVM, CNN, and GPR, which stood at 1.24%, 2.16%, 2.86%, and 27.68% correspondingly. Specific models displayed errors during periods when there was a scarcity of historical data regarding secondary batteries. This experiment, in contrast to Experiment 1, had an MAE of 2.1. The corresponding reductions for PSO-LSSVM, CNN, and GPR are 0.43%, 1.98%, and 21.2%. Experiment 2.2 revealed that the average MAE of the LSTM, PSO-LSSVM, SSA-LSSVM, and GPR methods decreased by the following percentages: 0.33%, 0.43%, 0.65%, 1.38%, and 5.98%, respectively, when compared to Experiment 2.1. When considering the prediction of the health life status of secondary batteries, SSA-LSSVM exhibited superior performance compared to the three conventional models (GPR, CNN, and LSTM).
This work has not only increased the application and longevity of secondary batteries, but it has also contributed to the field study by reducing environmental contamination, extending the life of secondary batteries, and alleviating energy shortages. Through the utilisation of discrete curvature feature extraction, this approach has furnished an all-encompassing comprehension of the discharge profiles of the batteries, thereby enhancing the precision with which their condition is evaluated. Moreover, this study has surpassed theoretical assertions by integrating empirical verification through the utilisation of a dataset consisting of second-life batteries that have undergone a variety of utilisation patterns. The incorporation of practical situations has bolstered the methodology’s resilience and relevancy. In general, the accessibility of novel energy systems facilitated by the low cost of secondary batteries can promote the adoption of clean energy sources and safeguard the environment. It is imperative to validate the suitability of both PSO-LSSVM and SSA-LSSVM across various battery types in order to advance future research.
The original contributions presented in the study are included in the article/Supplementary Materials, further inquiries can be directed to the corresponding authors.
HG: Funding acquisition, Investigation, Methodology, Supervision, Writing–review and editing. ZA: Data curation, Formal Analysis, Investigation, Resources, Software, Writing–original draft. DZ: Investigation, Visualization, Writing–review and editing. WD: Investigation, Visualization, Writing–review and editing. TK: Conceptualization, Formal Analysis, Validation, Writing–review and editing. KG: Investigation, Visualization, Writing–review and editing.
The author(s) declare financial support was received for the research, authorship, and/or publication of this article. The authors gratefully acknowledge the Guangxi University for the support of research grant No. A3020051008.
The authors declare that the research was conducted in the absence of any commercial or financial relationships that could be construed as a potential conflict of interest.
All claims expressed in this article are solely those of the authors and do not necessarily represent those of their affiliated organizations, or those of the publisher, the editors and the reviewers. Any product that may be evaluated in this article, or claim that may be made by its manufacturer, is not guaranteed or endorsed by the publisher.
Barré, A., Suard, F., Gérard, M., Montaru, M., and Riu, D. (2014). Statistical analysis for understanding and predicting battery degradations in real-life electric vehicle use. J. Power Sources 245, 846–856. doi:10.1016/j.jpowsour.2013.07.052
Batool, F., Kurniawan, T. A., Mohyuddin, A., Othman, M. H. D., Aziz, F., Al-Hazmi, H., et al. (2023). Environmental impacts of food waste management technologies: a critical review of life cycle assessment (LCA) studies. Trends Food Sci. Technol. 143, 104287. doi:10.1016/j.tifs.2023.104287
Bhar, M., Bhattacharjee, U., Yalamanchili, K., and Martha, S. K. (2023). Effective upcycling of waste separator and boosting the electrochemical performance of recycled graphite anode for lithium-ion batteries. J. Power Sources 580, 233403. doi:10.1016/j.jpowsour.2023.233403
Birkl, C. (2017). Oxford battery degradation dataset 1. https://ora.ox.ac.uk/objects/uuid:03ba4b01-cfed-46d3-9b1a-7d4a7bdf6fac.
Braco, E., San Martin, I., Sanchis, P., Ursúa, A., and Stroe, D. I. (2022). Health indicator selection for state of health estimation of second-life lithium-ion batteries under extended ageing. J. Energy Storage 55, 105366. doi:10.1016/j.est.2022.105366
Briffa, J., Sinagra, E., and Blundell, R. (2020). Heavy metal pollution in the environment and their toxicological effects on humans. Heliyon 6 (9), e04691. doi:10.1016/j.heliyon.2020.e04691
Colarullo, L., and Thakur, J. (2022). Second-life EV batteries for stationary storage applications in Local Energy Communities. Renew. Sustain. Energy Rev. 169, 112913. doi:10.1016/j.rser.2022.112913
Coleman, M., Hurley, W. G., and Lee, C. K. (2008). An improved battery characterization method using a two-pulse load test. IEEE Trans. energy Convers. 23 (2), 708–713. doi:10.1109/TEC.2007.914329
Deng, Z., Hu, X., Li, P., Lin, X., and Bian, X. (2021). Data-driven battery state of health estimation based on random partial charging data. IEEE Trans. Power Electron. 37 (5), 5021–5031. doi:10.1109/TPEL.2021.3134701
Dos Reis, G., Strange, C., Yadav, M., and Li, S. (2021). Lithium-ion battery data and where to find it. Energy AI 5, 100081. doi:10.1016/j.egyai.2021.100081
Faraji-Niri, M., Rashid, M., Sansom, J., Sheikh, M., Widanage, D., and Marco, J. (2023). Accelerated state of health estimation of second life lithium-ion batteries via electrochemical impedance spectroscopy tests and machine learning techniques. J. Energy Storage 58, 106295. doi:10.1016/j.est.2022.106295
Goh, H. H., Lan, Z., Zhang, D., Dai, W., Kurniawan, T. A., and Goh, K. C. (2022). Estimation of the state of health (SOH) of batteries using discrete curvature feature extraction. J. Energy Storage 50, 104646. doi:10.1016/j.est.2022.104646
Guo, J. J., and Zhong, B. J. (2014). U-chord curvature: a computational method of discrete curvature. Pattern Recognit. Artif. Intell. 27 (8), 683–691. doi:10.16451/j.cnki.issn1003-6059.2014.08.002
Guo, P., Cheng, Z., and Yang, L. (2019). A data-driven remaining capacity estimation approach for lithium-ion batteries based on charging health feature extraction. J. Power Sources 412, 442–450. doi:10.1016/j.jpowsour.2018.11.072
He, W., Williard, N., Osterman, M., and Pecht, M. (2011). Prognostics of lithium-ion batteries based on Dempster–Shafer theory and the Bayesian Monte Carlo method. J. Power Sources 196 (23), 10314–10321. doi:10.1016/j.jpowsour.2011.08.040
Jafari, S., and Byun, Y. C. (2023). Accurate remaining useful life estimation of lithium-ion batteries in electric vehicles based on a measurable feature-based approach with explainable AI. J. Supercomput. 80, 4707–4732. doi:10.1007/s11227-023-05648-8
Jo, C. H., and Myung, S. T. (2019). Efficient recycling of valuable resources from discarded lithium-ion batteries. J. Power Sources 426, 259–265. doi:10.1016/j.jpowsour.2019.04.048
Kennedy, J., and Eberhart, R. (1995). Particle swarm optimization. Proc. ICNN'95-international Conf. neural Netw. 4, 1942–1948. IEEE. doi:10.1109/ICNN.1995.488968
Kurniawan, T. A., Liang, X., Singh, D., Othman, M. H. D., Goh, H. H., Gikas, P., et al. (2022a). Harnessing landfill gas (LFG) for electricity: a strategy to mitigate greenhouse gas (GHG) emissions in Jakarta (Indonesia). J. Environ. Manag. 301, 113882. doi:10.1016/j.jenvman.2021.113882
Kurniawan, T. A., Maiurova, A., Kustikova, M., Bykovskaia, E., Othman, M. H. D., and Goh, H. H. (2022b). Accelerating sustainability transition in St. Petersburg (Russia) through digitalization-based circular economy in waste recycling industry: a strategy to promote carbon neutrality in era of Industry 4.0. J. Clean. Prod. 363, 132452. doi:10.1016/j.jclepro.2022.132452
Kurniawan, T. A., Othman, M. H. D., Liang, X., Goh, H. H., and Chew, K. W. (2023). From liquid waste to mineral fertilizer: recovery, recycle and reuse of high-value macro-nutrients from landfill leachate to contribute to circular economy, food security, and carbon neutrality. Process Saf. Environ. Prot. 170, 791–807. doi:10.1016/j.psep.2022.12.068
Li, F., Min, Y., Zhang, Y., Zhang, Y., Zuo, H., and Bai, F. (2024). State-of-health estimation method for fast-charging lithium-ion batteries based on stacking ensemble sparse Gaussian process regression. Reliab. Eng. Syst. Saf. 242, 109787. doi:10.1016/j.ress.2023.109787
Li, J., Wang, L., Lyu, C., Wang, H., and Liu, X. (2016). New method for parameter estimation of an electrochemical-thermal coupling model for LiCoO2 battery. J. Power Sources 307, 220–230. doi:10.1016/j.jpowsour.2015.12.058
Li, J., Ye, M., Wang, Y., Wang, Q., and Wei, M. (2023). A hybrid framework for predicting the remaining useful life of battery using Gaussian process regression. J. Energy Storage 66, 107513. doi:10.1016/j.est.2023.107513
Li, L. L., Liu, Z. F., Tseng, M. L., and Chiu, A. S. (2019). Enhancing the Lithium-ion battery life predictability using a hybrid method. Appl. Soft Comput. 74, 110–121. doi:10.1016/j.asoc.2018.10.014
Liang, X., Goh, H. H., Kurniawan, T. A., Zhang, D., Dai, W., Liu, H., et al. (2022b). Utilizing landfill gas (LFG) to electrify digital data centers in China for accelerating energy transition in Industry 4.0 era. J. Clean. Prod. 369, 133297. doi:10.1016/j.jclepro.2022.133297
Liang, X., Kurniawan, T. A., Goh, H. H., Zhang, D., Dai, W., Liu, H., et al. (2022a). Conversion of landfilled waste-to-electricity (WTE) for energy efficiency improvement in Shenzhen (China): a strategy to contribute to resource recovery of unused methane for generating renewable energy on-site. J. Clean. Prod. 369, 133078. doi:10.1016/j.jclepro.2022.133078
Liu, C., Wen, X., Zhong, J., Liu, W., Chen, J., Zhang, J., et al. (2022). Characterization of aging mechanisms and state of health for second-life 21700 ternary lithium-ion battery. J. Energy Storage 55, 105511. doi:10.1016/j.est.2022.105511
Martinez-Laserna, E., Gandiaga, I., Sarasketa-Zabala, E., Badeda, J., Stroe, D. I., Swierczynski, M., et al. (2018). Battery second life: hype, hope or reality? A critical review of the state of the art. Renew. Sustain. Energy Rev. 93, 701–718. doi:10.1016/j.rser.2018.04.035
Martinez-Laserna, E., Sarasketa-Zabala, E., Sarria, I. V., Stroe, D. I., Swierczynski, M., Warnecke, A., et al. (2018). Technical viability of battery second life: a study from the ageing perspective. IEEE Trans. Industry Appl. 54 (3), 2703–2713. doi:10.1109/TIA.2018.2801262
Mussi, M., Pellegrino, L., Restelli, M., and Trovo, F. (2022). An online state of health estimation method for lithium-ion batteries based on time partitioning and data-driven model identification. J. Energy Storage 55, 105467. doi:10.1016/j.est.2022.105467
Qian, C., Xu, B., Xia, Q., Ren, Y., Sun, B., and Wang, Z. (2023). SOH prediction for Lithium-Ion batteries by using historical state and future load information with an AM-seq2seq model. Appl. Energy 336, 120793. doi:10.1016/j.apenergy.2023.120793
Ran, A., Liang, Z., Chen, S., Cheng, M., Sun, C., Ma, F., et al. (2022). Fast clustering of retired lithium-ion batteries for secondary life with a two-step learning method. ACS Energy Lett. 7 (11), 3817–3825. doi:10.1021/acsenergylett.2c01898
Richardson, R. R., Osborne, M. A., and Howey, D. A. (2017). Gaussian process regression for forecasting battery state of health. J. Power Sources 357, 209–219. doi:10.1016/j.jpowsour.2017.05.004
Shahjalal, M., Roy, P. K., Shams, T., Fly, A., Chowdhury, J. I., Ahmed, M. R., et al. (2022). A review on second-life of Li-ion batteries: prospects, challenges, and issues. Energy 241, 122881. doi:10.1016/j.energy.2021.122881
Son, J., Zhou, S., Sankavaram, C., Du, X., and Zhang, Y. (2016). Remaining useful life prediction based on noisy condition monitoring signals using constrained Kalman filter. Reliab. Eng. Syst. Saf. 152, 38–50. doi:10.1016/j.ress.2016.02.006
Suykens, J. A., Lukas, L., Van Dooren, P., De Moor, B., and Vandewalle, J. (1999).Least squares support vector machine classifiers: a large scale algorithm, Eur. Conf. Circuit Theory Des., 99. Pennsylvania, PA, USA Citeseer: ECCTD, 839–842.
Wang, X., Hu, B., Su, X., Xu, L., and Zhu, D. (2024). State of health estimation for lithium-ion batteries using random forest and gated recurrent unit. J. Energy Storage 76, 109796. doi:10.1016/j.est.2023.109796
Wang, Y., Liu, C., Zhang, X., Deng, Y., Chen, L., Liu, H., et al. (August 2023). “Segmented prediction model of lithium-ion battery remaining useful life based on LSTM and SVR,” in Proceedings of the 2023 6th international conference on intelligent robotics and control engineering (IRCE) (IEEE), Jilin, China 177–182. doi:10.1109/IRCE59430.2023.10254780
Xie, H., Ahmad, T., Zhang, D., Goh, H. H., and Wu, T. (2024). Community-based virtual power plants’ technology and circular economy models in the energy sector: a Techno-economy study. Renew. Sustain. Energy Rev. 192, 114189. doi:10.1016/j.rser.2023.114189
Xie, H., Jiang, M., Zhang, D., Goh, H. H., Ahmad, T., Liu, H., et al. (2023). IntelliSense technology in the new power systems. Renew. Sustain. Energy Rev. 177, 113229. doi:10.1016/j.rser.2023.113229
Xiong, W., Xu, G., Li, Y., Zhang, F., Ye, P., and Li, B. (2023). Early prediction of lithium-ion battery cycle life based on voltage-capacity discharge curves. J. Energy Storage 62, 106790. doi:10.1016/j.est.2023.106790
Xue, J., and Shen, B. (2020). A novel swarm intelligence optimization approach: sparrow search algorithm. Syst. Sci. control Eng. 8 (1), 22–34. doi:10.1080/21642583.2019.1708830
Yang, J., Du, C., Liu, W., Wang, T., Yan, L., Gao, Y., et al. (2020). State-of-health estimation for satellite batteries based on the actual operating parameters–Health indicator extraction from the discharge curves and state estimation. J. Energy Storage 31, 101490. doi:10.1016/j.est.2020.101490
Keywords: secondary battery, state of health (SOH), combining algorithms, predictive battery, energy shortage
Citation: Goh HH, An Z, Zhang D, Dai W, Kurniawan TA and Goh KC (2024) A study on the application of discrete curvature feature extraction and optimization algorithms to battery health estimation. Front. Energy Res. 12:1367444. doi: 10.3389/fenrg.2024.1367444
Received: 08 January 2024; Accepted: 21 February 2024;
Published: 04 March 2024.
Edited by:
Sandip K. Saha, Indian Institute of Technology Bombay, IndiaReviewed by:
Zhongwei Deng, University of Electronic Science and Technology of China, ChinaCopyright © 2024 Goh, An, Zhang, Dai, Kurniawan and Goh. This is an open-access article distributed under the terms of the Creative Commons Attribution License (CC BY). The use, distribution or reproduction in other forums is permitted, provided the original author(s) and the copyright owner(s) are credited and that the original publication in this journal is cited, in accordance with accepted academic practice. No use, distribution or reproduction is permitted which does not comply with these terms.
*Correspondence: Hui Hwang Goh, aGhnb2hAZ3h1LmVkdS5jbg==; Tonni Agustiono Kurniawan, dG9ubmlAeG11LmVkdS5jbg==
Disclaimer: All claims expressed in this article are solely those of the authors and do not necessarily represent those of their affiliated organizations, or those of the publisher, the editors and the reviewers. Any product that may be evaluated in this article or claim that may be made by its manufacturer is not guaranteed or endorsed by the publisher.
Research integrity at Frontiers
Learn more about the work of our research integrity team to safeguard the quality of each article we publish.