
94% of researchers rate our articles as excellent or good
Learn more about the work of our research integrity team to safeguard the quality of each article we publish.
Find out more
ORIGINAL RESEARCH article
Front. Energy Res. , 05 April 2024
Sec. Sustainable Energy Systems
Volume 12 - 2024 | https://doi.org/10.3389/fenrg.2024.1365650
This article is part of the Research Topic Advancing Urban Sustainability: Integrating Renewable Energy for Accelerated Zero-Carbon Community Transitions View all 7 articles
 Hui Hwang Goh1*
 Wenxuan Suo1
 Xue Liang1
 Dongdong Zhang1
 Wei Dai1
 Tonni Agustiono Kurniawan2*
 Kai Chen Goh3
After the border lockdown, global traffic has returned, making green airports a government goal to reach carbon neutrality by 2050. Sustainable aviation fuel (SAF) use for commercial aircraft alone won't help achieve net-zero emissions (NEZ). An independent renewable energy supply system at airports is urgently needed to implement green airports worldwide. This study develops a renewable energy power supply system that integrates wind, photovoltaic (PV), and waste-to-energy (WTE) sources to investigate a new adaptive model predictive control (MPC) energy management strategy based on airport operational characteristics. Simulations of Copenhagen Airport’s energy programme confirmed this energy management strategy’s feasibility. Energy management scenarios for two typical summer and winter load days were simulated for case studies. Field data from Copenhagen was used for simulation analysis, and experimental modelling of the airport’s energy scheme proved the energy management program’s practicality. The simulations show that Copenhagen airport renewable energy generates half of its electricity in winter and 81.0% in summer. A total operating cost of USD 36,087.83/day in summer and USD 102,061.20/day in winter is needed to reduce carbon emissions by 41.19 Mt/day in summer and 43.96 Mt/day in winter. This approach should help deploy green airports worldwide and reach carbon neutrality by 2050.
As a result of the COVID-19 pandemic, the aviation industry endured a period of extreme difficulty for 3 years (2019-2022). However, with the recent influx of international travellers, global travel has demonstrated clear evidence of recovery in the post-COVID-19 era. The accelerated expansion of the aviation transportation sector has increased the demand for electricity at airports. Thus, air transport is the continuous source of increasing CO2 emissions. Aviation was responsible for nearly 800.0 Mt of CO2 emissions in 2022. These emissions have reverted to 80.0% of pre-COVID-19 levels and are projected to surpass the 2019 level by 2025 (IEA, 2022a).
Governments have mandated the use of sustainable aviation fuel (SAF) and increased their support for sustainable aviation fuel (SAF) production research and development in response to this situation. The United States, for instance, enacted the Inflation Reduction Act (IRA) in 2022 to subsidise fuel production via carbon tax credits and other mechanisms (IRA, 2023). A new proposal has been endorsed by the European Union (EU) to mandate that SAF comprise 70.0% of the overall fuel supply by 2050 (European Commission, 2023).
In a similar vein, the Civil Aviation Administration of China (CAAC) has unveiled its “14th Five-Year Plan” to promote the environmentally sustainable growth of civil aviation, with the objective of exceeding 20,000.0 Mt of SAF consumption by 2025 (CAAC, 2022). A 5.0% decline in oil demand is anticipated during the same time period, which is attributed to the aviation industry’s sluggish adoption of alternative fuels and constraints on existing infrastructure that impede the expansion of green airports.
Despite the increasing call for environmentally friendly airports to reduce CO2 emissions, the aviation industry’s ongoing CO2 emission development cannot be solely attributed to the conventional use of fossil fuels by aircraft. With the expansion and multifaceted nature of airports, they have surpassed the provision of air transportation services to establish independent commercial and lodging complexes, industrial zones, cargo areas, and intermodal public transportation nodes. Consequently, there has been a significant increase in the demand for energy supply and a corresponding expansion in their carbon footprint (Tang et al., 2022). Airport terminals, hotels, ground transportation vehicles, and other infrastructure thus necessitate a consistent and adequate electricity supply. Therefore, electrification of airports has become an unavoidable trend in the development of green airports in the future (Xiang et al., 2021).
Green airports can be effectively developed through the implementation of an independent renewable energy (RE) supply system, which reduces CO2 emissions and operational expenses. In pursuit of green airport initiatives, ATP, the investor in the Copenhagen airport, has augmented its overall energy investments from 9.1 billion USD in 2021 to 29.5 billion USD by 2030 (ATP, 2023). Despite this significant increase, CO2 emissions are likely to remain stable due to the recent influx of international tourists and business travellers to the Nordic region.
Despite the recent surge in international travel, developing country airports continue to be regions characterised by substantial energy consumption and substantial CO2 emissions due to their reliance on conventional fuels (Ortega et al., 2017). In order to mitigate electricity and heating consumption, the airport should consider upgrading its ventilation system and slashing the usage of its rudimentary ventilation system by half.
In order to reduce airports’ carbon footprints, airport power systems must increasingly utilise RE (Zhou et al., 2022). A feasibility study must be conducted on the programmes and an airport energy management system that integrates new energy sources including wind energy, PV, WTE incineration, battery energy storage system (BESS), and hydrogen energy storage system (HESS) is required. To facilitate the transition of forthcoming airports towards environmentally sustainable operations, it is imperative to strive for a NEZ scenario by 2050 through the maintenance of the airport’s power system stability through the utilisation of diverse power sources such as PV, WTE, BESS, and HESS.
An initial investigation was conducted by Sreenath et al. (2020), wherein they examined the energy supply infrastructure at Kuantan Airport in Pahang, Malaysia. Although the work was innovative, it failed to consider the storage management and energy supply routing in its promotion of the airport’s integrated energy system. In addition, the work failed to account for the use of RE to power an energy system comprised of wind, PV, and WTE.
This study aims to address the current research deficiencies by examining a novel adaptive energy management approach that utilises the operational attributes of airports. The system employs MPC as a management method to enhance the share of RE in the airport’s energy system. It also utilises real-time scheduling to ensure the airport’s power supply meets the daily operational requirements, while concurrently minimising operational expenses. Furthermore, the paper elucidates the engineering facets encompassing the programme’s design and implementation. For instance, the selection of equipment and system design in order to integrate renewable energy technologies. Control strategies and optimisation algorithms are implemented to enhance the dispatch process’s stability and effectiveness. In addition to an evaluation of the sustainability and practicability of the airport energy management programme.
In an effort to promote green airport development, this work also introduces an innovative strategy for developing a renewable energy power supply system for airports, utilising wind, PV, and WTE generation. The Copenhagen Airport was selected as a case study for this objective, and field data originating from the Copenhagen region in Denmark served as the benchmark. Through a theoretical simulation of the airport’s energy scheme, the viability of this new adaptive energy management strategy tailored to the airport’s characteristics was validated. This simulation served to promote the sustainability of the aviation industry while also validating the transition to green airports. In this regard, an analysis of the sustainability of green airports is also provided.
Multiple energy sources are anticipated to be capable of being integrated into this new airport power system, enabling the mutual substitution of diverse energy sources while generating a larger viable domain and a space with a high degree of economic flexibility. Furthermore, the MPC management strategy enables the distribution of diverse energy sources that provide daily energy to the airport’s microgrid system. It is expected that the implementation of this novel energy configuration will significantly contribute to the safe and effective functioning of airports across the globe, while also encouraging energy conservation, emission reduction at airports, and the mitigation of operational financial outlays.
In addition to being vital components of the worldwide air transportation network, airports are progressively emerging as centres of economic activity. Comparable in structure to medium-sized communities, airports comprise an assortment of structures (ICAO, 2019). Building structures are the tangible structures that facilitate airport operations and passengers. Practical, effective, secure, and aesthetically pleasing, they are designed as such. Figure 1 illustrates the overview of airport architecture. The following are detailed illustrations of airport construction structures:
1) Terminal building: All passenger services, including baggage claim, check-in and boarding gates, are housed in this airport facility’s central structure. It could consist of a singular edifice or an assemblage of interrelated edifices.
2) Control tower: The most towering structure at the airport is represented by the 360° glass enclosure situated on the highest level. It enables air traffic controllers to oversee and guide the movements of aircraft on the ground and in the air. Usually, it is located in close proximity to the runway and terminal building.
3) Hangars: These structures are characterised by their wide span and single-story design, and are generally utilised for the purposes of aircraft maintenance, repair, and storage. They can either exist independently or be integrated into the terminal structure.
4) Runways and taxiways: Runways are elongated surfaces specifically designed for the takeoff and landing of aeroplanes. Taxiways encompass several operational zones inside an airport, including airfield areas, terminals, aircraft parking spaces, and hangars. These runways are usually made of concrete or asphalt to withstand the immense weight of a large aircraft.
5) Parking lots: These constructions are utilised to streamline the parking of airport patrons’ cars, encompassing both temporary and extended durations. Most airports have a parking area that is connected to a terminal building.
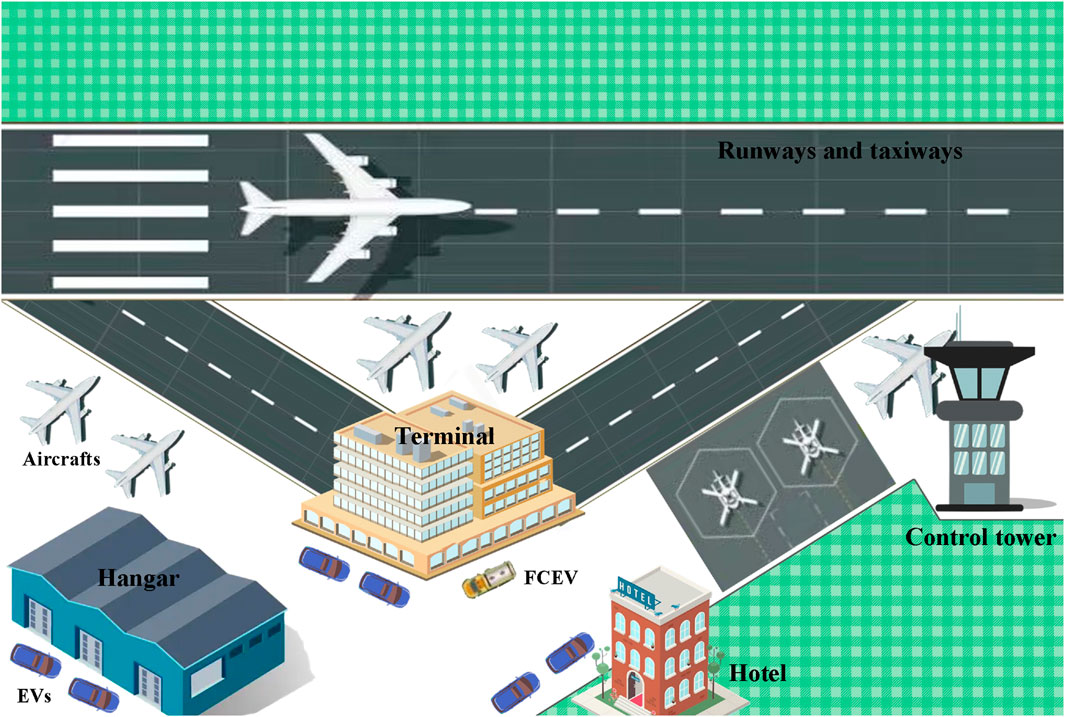
Figure 1. Overview of airport architecture.
Additional airport structures encompass cargo facilities, administrative offices, maintenance buildings, and emergency management facilities. The structures are essential for the functioning of an airport.
By drawing inspiration from the Copenhagen airport, the comprehensive airport vicinity encompasses a hotel, office buildings, air cargo terminals, duty-free shopping centres and a WTE facility (Santa et al., 2020). In contrast, the airport’s primary infrastructure consists of runways, taxiways, apron space and ground transportation interchange facilities (Seyanont, 2012; Baxter, 2018).
Energy is necessary for service provision and infrastructure maintenance. In order to guarantee a sufficient power supply and efficient operation, energy systems necessitate meticulous planning and administration concerning power and illumination provision. Due to this rationale, airport energy systems must adhere to rigorous standards of stability and continuity. Air conditioning and heating systems are also installed in hotels and airport terminals, among other large structures. A secure, cost-effective, and dependable electricity supply at airports is therefore essential. In general, the design and construction of airport building structures are of the utmost importance, as they must provide passengers with a comfortable and efficient journey while withstanding the constant movement of passengers, cargo, and aircraft. Figure 2 illustrates the total energy supply and demand at the airport.
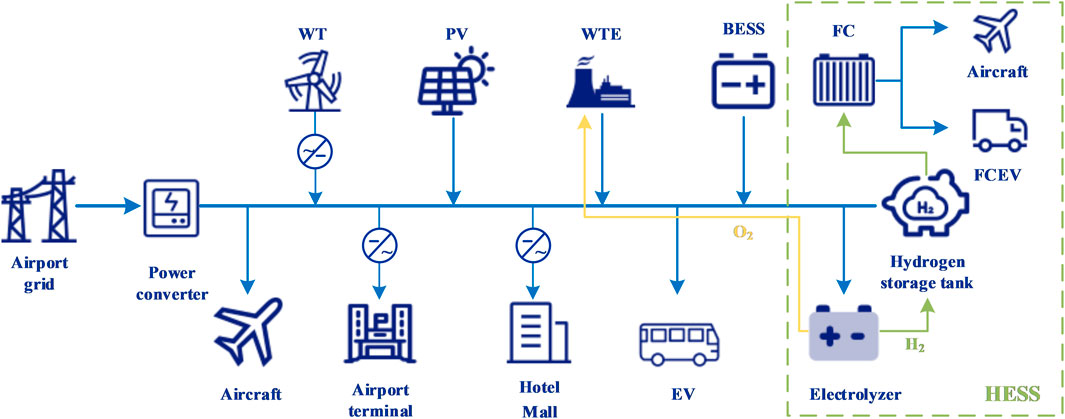
Figure 2. Airport energy supply requirements.
The MPC oversees the complete airport microgrid system in order to ensure unified and optimal scheduling. The main grid purchased power and renewable energy generation are unified and integrated with the aim of satisfying power balance and constraints. By optimising the distribution of energy storage, all power is supplied to a variety of facilities, including hotels, airport terminals, infrastructure, and hydrogen storage systems. The hydrogen produced during the electrolysis of water is utilised primarily to supply fuel cells. The oxygen that is produced concurrently is supplied directly to the waste-to-energy system in order to facilitate incineration and enhance the efficiency of power generation. The airport’s ground conveyance is electrified via the utilisation of hydrogen and electric vehicles. Furthermore, this paper incorporates a DC microgrid system while considering the engineering challenges associated with the integration of renewable energy technologies, charging electric vehicles, and the electrolysis of water to hydrogen. The proposed DC microgrid for airports features a structure that reduces the reliance on converters. Additionally, the DC power supply system guarantees improved power quality and mitigates challenges associated with reactive power (Justo et al., 2013).
Generally, airports are expansive, uninhabited regions. It remains unaffected by currents generated by natural obstructions in the vicinity or high-rise structures. As a result, this ecological setting is highly conducive to the construction of wind farms (Cuadra, 2019). Assuming compliance with the easement of the airport, the wind turbines (WT) have the capability to provide electrical power to the interior of the airport (Varriale, 2018). Approximately 50.0% of the total energy production in Denmark in 2021 was generated from wind (IEA, 2022b). As a result, the airport was constructed in a region with ample wind resources. By virtue of this benefit, wind energy has the capacity to furnish a specific quantity of electrical power to the airport. The power output model of the WT is mathematically represented by Eq. 1 (Goh, 2022):
where:
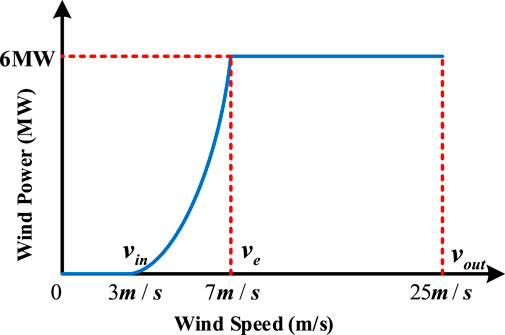
Figure 3. Diagram of fan power output.
The airport building structure is suitable for the installation of solar PV power generation equipment (ICAO, 2018). Due to its expansive and level topography, the airport offers ample land area and favourable lighting conditions for PV energy generation. Solar PV panels could have been strategically positioned before construction began, illuminating not only the open area of the airport (including the terminal building’s roof and both sides of the runway), but also the parking lot, in order to supply electricity to new energy vehicles. PV power has the advantage over wind power in that it eliminates the need for tangible barriers and safety risks that could impede the airport’s daily operations.
Under standard test conditions (STC, 1.0
where:
The airport’s growth and progress have led to its emergence as a focal point of regional and economic activity, albeit concurrently confronting environmental concerns and obstacles stemming from potential public health hazards (Kurniawan, 2022a). Given that airports produce an equivalent amount of waste as a small city, the implementation of a methodical waste segregation management system for airport waste becomes an essential sustainability indicator in the development of environmentally friendly airports (Batool, 2023). In response to the significant environmental consequences and substantial volume and complexity of airport waste, airports are compelled to implement waste reduction strategies such as WTE incineration. The energy from waste incineration model is mathematically represented by Eq. 3 (Liang, 2022a):
where:
Due to the intermittent generation and fluctuating grid currents of non-RE sources, energy storage devices are required to enhance the dependability and stability of the energy supply. Battery storage technology is implemented to retain surplus energy within the system. The model of the BESS is mathematically represented by Eq. 4:
where:
Conventionally, the electrical energy that persists in the storage unit is denoted by the state of charge (SOC). One can formulate by Eqs 5, 6 to describe the correlation between the value of SOC and the remaining power in the storage power supply:
where:
To accomplish the objective of a green airport, the incorporation of a hydrogen storage system into an airport’s energy system can increase the supply of low-carbon, sustainable energy. By considering the unique attributes of airports, the hydrogen storage system outlined in this research consists of a fuel cell powered by hydrogen, a cryogenic liquid hydrogen storage vessel, and a proton exchange membrane (PEM) electrolyzer (Kurniawan, 2022b).
Without emitting CO2, the PEM electrolyzer generates high-pressure hydrogen with a purity greater than 99.0% (Khan, 2022). The device exhibits a power generation efficiency of up to 60.0% and operates at a comparatively low temperature range of 50.0°C-80.0°C. In addition, it possesses a regulation capability of close to 100.0% and a millisecond-range response time to load changes, which makes it highly suitable for implementation in RE systems. The hydrogen generation from electrolytic baths can be mathematically represented by Eq. 7:
where:
Electricity can be produced by hydrogen FCs with an efficacy of up to 50.0%. Hydrogen fuel cells can be utilised in airports to supply energy support for aircraft and hydrogen-powered vehicles due to their non-polluting and noiseless characteristics. The model is mathematically represented by Eq. 8:
where:
As a medium for storing hydrogen energy in airport systems, cryogenic liquid hydrogen storage containers with a high purity of liquefied hydrogen and a maximum volumetric power density of 70 g/L are suitable. The model is mathematically represented by Eq. 9:
where:
To guarantee the dependability and steadiness of the airport’s microgrid system as a whole, it is imperative that the system is linked to the distribution network and the grid, in addition to incorporating energy storage devices. Consequently, an interplay between price and power exists between the microgrid at the airport and the complete mains network. The model is mathematically represented by Eq. 10:
where:
Mixed integer linear programming (MILP) can be utilised to optimise the entire airport microgrid system. The energy scheduling cycle for this requires 1 day of airport operations when an MPC scheduling strategy is implemented. The overarching scheduling strategy aims to accomplish economic optimisation of the airport’s microgrid system in real time with the objective of minimising total costs for 1 day of airport operations. This reduces CO2 emissions while increasing the proportion of RE in the airport’s energy system. The comprehensive flowchart of the MPC is illustrated in Figure 4.
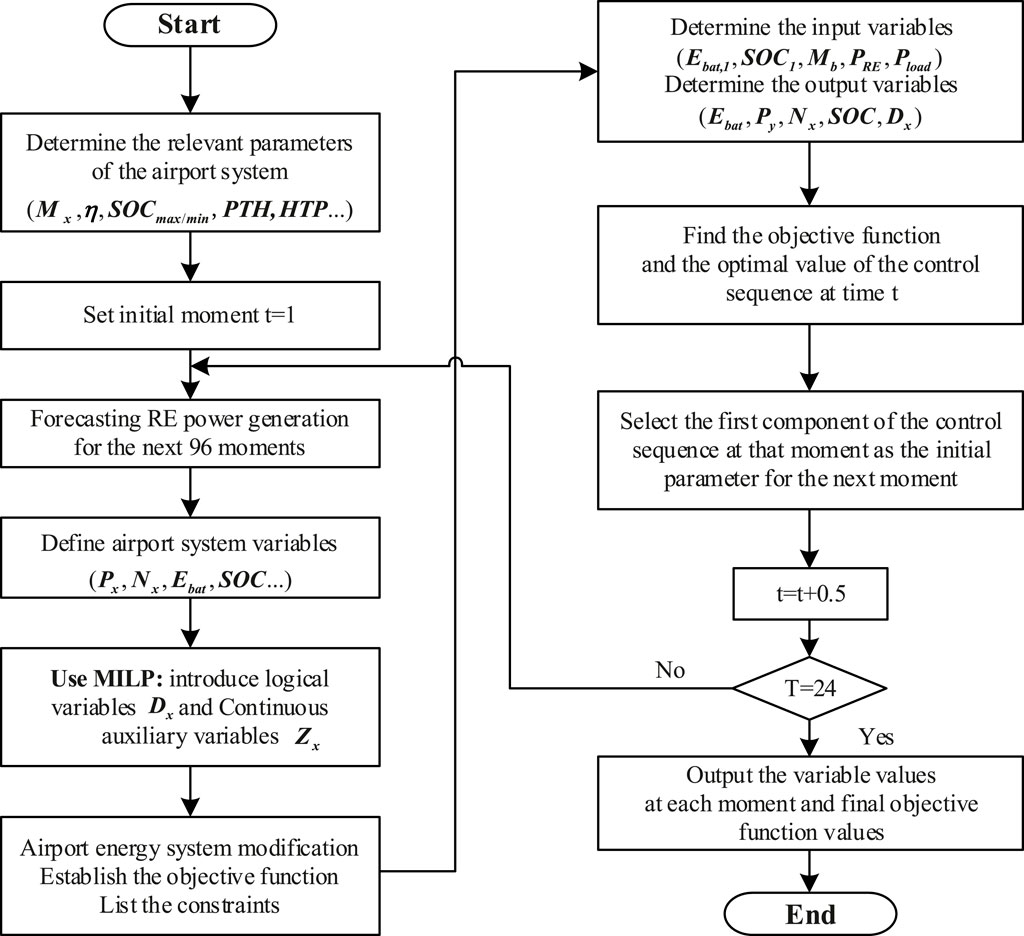
Figure 4. Model prediction control strategy flowchart for the airport.
In addition to continuous dynamic characteristics, a portion of the airport’s microgrid system also possesses discrete dynamic characteristics. Consequently, the comprehensive system modelling can be regarded as a hybrid mixed logic dynamic model (MLD). To mitigate the challenges associated with the segmentation functions in this model, logistic auxiliary variables and continuous auxiliary variables for segmented linearisation are implemented using a MILP approach.
1 Energy storage part: introducing the logical auxiliary variable
2 Hydrogen storage section: introducing the logical auxiliary variable as shown in Eq. 12:
3 Airport microgrid power interaction section: introducing the logical auxiliary variable as shown in Eqs 13, 14:
then Eq. 10 can be simplified into Eq. 15:
Eq. 16 represents the objective function governing the energy dispatch of the complete airport microgrid system. Its purpose is to reduce the overall operational expenses of a day by considering the cost of purchasing electricity (Eq. 15) and the maintenance cost of equipment operation (Eqs 17, 18). The expression for the objective function is as follows:
where:
Numerous forms of technical constraints exist within the energy system of an airport. For instance, the following are presented as output constraints for RE generation and upper and lower limit constraints for BESS and HESS:
1) Power balance constraints for system operation is mathematically represented by Eq. 19:
2) Upper and lower limit constraints on the operating power of generating equipment are mathematically represented by Eq. 20:
3) Airport microgrid and main grid power interaction constraints are mathematically represented by Eqs 21, 22:
4) Constraints related to BESS.
The charging and discharging process of the energy storage system can be mathematically represented by Eq. 23:
The SOC value of the energy storage system is related to the initial value of the pre-storage of the whole energy storage. The upper and lower limits of SOC constraints are mathematically represented by Eq. 24:
5) Constraints related to HESS.
Upper and lower power consumption limits for electrolytic cells are mathematically represented by Eq. 25:
FC discharge power upper and lower limits are mathematically represented by Eq. 26:
The process constraints for hydrogen production by electrolysis in an EZ and hydrogen consumption in a FC can be mathematically represented by Eq. 27:
The upper and lower SOH limits for hydrogen in the storage tank can be mathematically represented by Eq. 28:
MPC is a control technique that operates in a closed-loop system, exhibiting excellent tracking capabilities and robustness against disruptions. This process involves the utilisation of model prediction, continuous optimisation, and feedback correction. By implementing feedback correction, any divergence from the best dispatch outcome caused by random factors can be promptly and efficiently rectified. This resolves the issue of uncertainty that arises from the integration of substantial quantities of renewable energy supply into the microgrid system at the airport.
The present investigation employs MPC real-time continuous operation to rectify the schedule within a single day. The precise procedure is partitioned into the subsequent three segments:
Segment 1: A day of modelling the airport microgrid system’s input data.
1) Constructing power curves for refuse incineration, wind, and solar energy generation using weather and airport-related data.
2) Acquiring and constructing electricity rates and equipment upkeep expenses.
3) Assigning initial values to the SOC and SOH of the energy storage system and hydrogen storage system, respectively.
The airport microgrid system as a whole operates for a total of 24 h; during that time, 48 samples were collected. All data were sampled at 0.5-h intervals, and the predicted time domain consisted of N = 6 samples spaced 0.5 h in the reverse direction.
Segment 2: Following the establishment of the microgrid constraints for the airport, the non-linear components of the model (Eq. 10) must be linearised in segments utilising MILP methods (Section 3.2.1) in order to optimise the model’s scheduling as a whole. The necessary input and output variables for the system as a whole have been determined. The objective function of the solution was the total operating cost of the system, contingent on the fulfilment of all system constraints. In order to implement a rolling optimisation process for the system, the predictive time domain could be utilised to solve the input and output variables, while the optimal objective function value and output sequence at that instant could be addressed.
Segment 3: The updated values of the SOH of the hydrogen storage system and the SOC of the energy storage system at the present time were utilised as the initial values for the solution of the subsequent moment of the system’s operation, while the first component of the output sequence received its origin from the previous moment. By removing the impact of disturbances and uncertainties and guaranteeing the overall process’s stability and precision, the closed-loop control achieved through feedback correction was possible for the system. By terminating the cycle at t = 24, the scheduling process produced a scheduling curve that detailed the operational expenses of the airport’s microgrid system at every moment over the course of a single day.
The operational characteristics of airports are utilised to develop a novel adaptive MPC energy management strategy. In order to validate the stability and practicability of this energy scheme under a variety of load of demand conditions on a typical day (spring and autumn), the interactive operation of the airport microgrid system source-grid-load-storage was executed. An assessment of the operational costs incorporating climate and geographical factors specific to the region, as well as a climate analysis of an average day in Copenhagen (Denmark), were conducted to validate the viability of this energy management strategy.
Copenhagen, the largest metropolis in Northern Europe and the capital of Denmark, is situated in the eastern portion of the island of Zealand (Britannica, 2023). Connected by the Oresund Bridge (55°37′45.192″N, 12°38′47″E), the Copenhagen Airport, the largest international airport in Northern Europe, is situated on the island of Amager, 8 km south of the city centre of Copenhagen and 24 km west of the city centre of Malmo (Academic Accelerator, 2023). The 11.8 km2 airport serves as a significant transportation centre for the Nordic region. Figure 5 illustrates the specific geographic location of the Copenhagen airport.
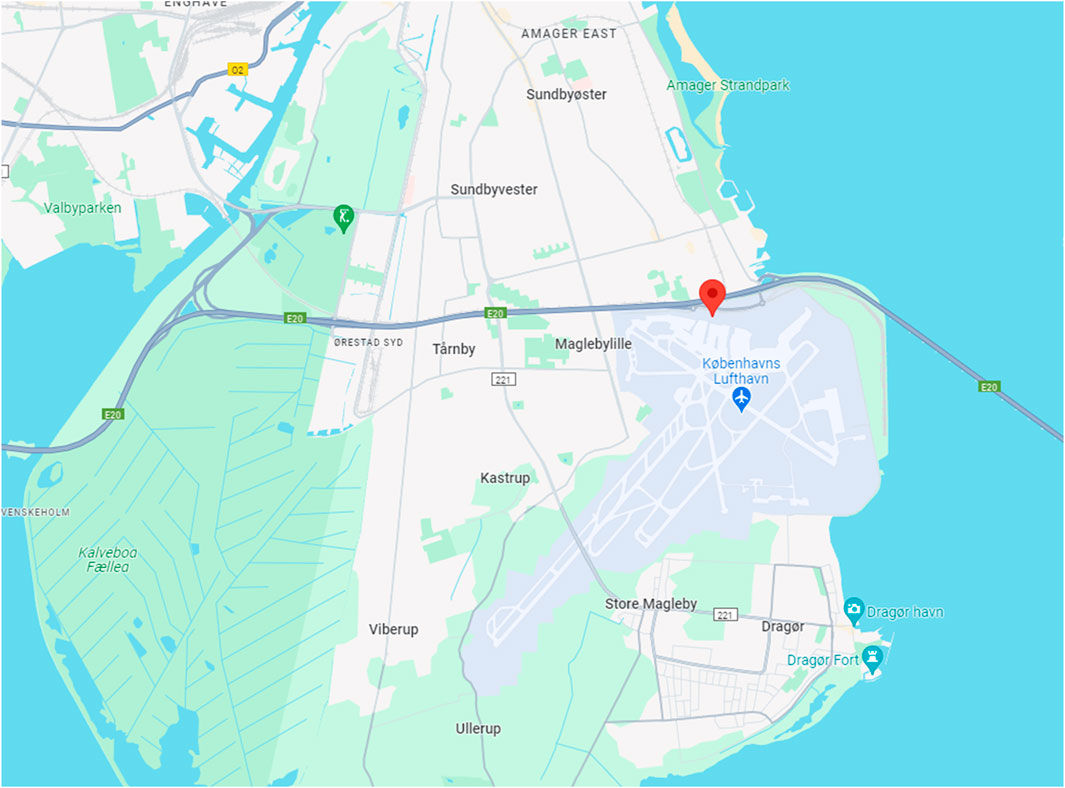
Figure 5. The location of the Copenhagen Airport (source: adapted from Google Maps).
A maritime climate characterised by moderate seasons characterises the Copenhagen Airport. Wintertime (December-February) averages fall between 0.0°C and 14.0°C, whereas summer (May-July) temperatures average between 14.0°C and 22.0°C. In contrast to the winter, wind velocities exhibit a marginal decrease in the summer, but otherwise persist at elevated levels throughout the year. In Table 1, the annual average climatic profile of Copenhagen is specified:
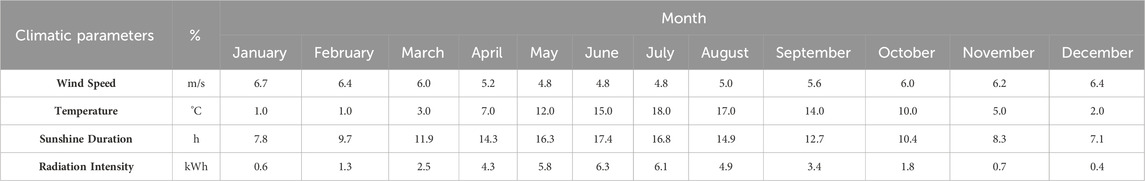
Table 1. Annual average climatic profile of Copenhagen (Denmark) in 2022 (source: adapted from Weatherspark in 2024).
As shown in Table 1, the summer season (May-July) exhibited the lowest wind speeds in the Copenhagen area, while the winter season (December-February) featured the maximum wind speeds. In June and December of 2022, the annual sunlight duration and light intensity attained their highest and lowest points, respectively. During the course of the year, the electricity, heating, and ventilation requirements of the airport environment varied considerably between the seasons of summer and winter. Wintertime energy consumption at Copenhagen Airport was nearly double that of summertime levels. To ascertain the viability of the energy management scheme outlined in this paper, a typical load day was selected for simulation experiments in the Copenhagen region on two separate occasions in June and December 2022. The purpose of these experiments was to compute the daily operational costs and the proportion of energy supply in various environments.
The climate profile for average load days during the summer and winter at Copenhagen Airport is illustrated in Figure 6. During the winter, the airport benefited from a greater abundance of wind resources compared to the summer, as evidenced by the daily average wind speed of 7.63 m/s. However, the duration of sunshine was a mere 7 hours, which was less than half of what it was during the summer. The energy supply structure of this energy scheme exhibited seasonal variations in response to the climate difference, commencing in the summer and concluding in the winter.
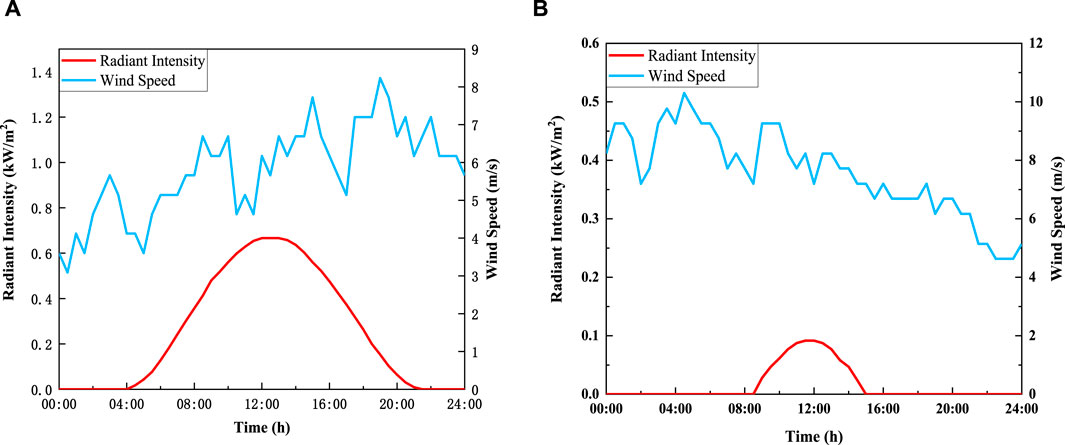
Figure 6. Load day climate profiles. (A) Summer load day climate profiles. (B) Winter load day climate profiles.
In reference to the base year 2022 (CPH, 2022a), Copenhagen Airport operates 317 routes to 161 destinations on behalf of 59 scheduled airlines. Following the abatement of the global COVID-19 pandemic, the airport currently maintains a workforce of 16,419 individuals, including 2,440 personnel, and handles an average of 60,666 passengers per day. As the economy recovers and the volume of travellers rises in the era following COVID-19, airport refuse also increases. In comparison to 2021 (CPH, 2022b), the waste volume at Copenhagen Airport experienced a 50.0% increase in 2022, reaching a total of 4,338.0 Mt. Among this waste, 1,428.0 Mt were classified as recyclable. Incineration of waste at Copenhagen Airport constitutes an estimated 70.0% of the overall waste generated at the airport (Baxter, 2018). According to the pertinent data, this indicates that the mean daily refuse volume in the Copenhagen region was around 11.8 Mt.
This study analysed the operational patterns of the airport on an average winter and summer day. The overall expenditure comprises the cost of grid interaction, the cost of maintenance for RE generating units, and the cost of generation and maintenance for BESS and HESS (Eq. 16). Table 2 details the operation and maintenance cost parameters of the aforementioned apparatus.

Table 2. Operational costs of airport energy equipment.
Figure 7 illustrates the real-time electricity prices in Copenhagen, with a 1-h interval between each price fluctuation (Nord Pool, 2023). The mean daily power procurement cost in the winter is approximately USD 0.48/kW, as shown in Figure 7. This is a significant increase from the summer price of USD 0.166/kW. New energy sources supply the electricity market in Europe. A scarcity of newly generated energy occurs during the winter season due to climatic factors, frequently resulting in volatile electricity rates.
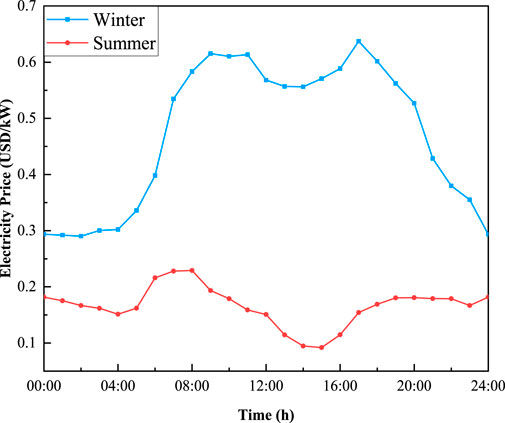
Figure 7. Electricity price for a typical day in summer and winter in Zealand, Denmark.
Furthermore, this study accounted for the seasonal variation in electricity rates in Denmark, presuming that

Table 3. Valuations of airport energy system-related parameters.
A typical load day’s scheduling strategy for an airport energy system contributes to the daily operation’s cost-effectiveness. An illustration of an optimal energy management scheme based on the economically optimal MPC policy can be found in Figure 8. Every 30 minutes, the balanced results of the airport’s energy scheduling divide the day into forty-eight moments. Positive values signify power generation, encompassing new energy output, grid-purchased power, power discharged from BESS, and FC discharge power. Conversely, negative values indicate airport power consumption, including power utilised by airport operations, power fuelled by BESS, and power consumed by EZ.

Figure 8. (A) Typical load day MPC dispatch for summer. (B). Typical load day MPC dispatch for winter.
The energy scheduling for the summer season at the Copenhagen airport is depicted in Figure 8A. As a result of the summer’s copious energy output, 81.0% of the daily total power generation was obtained by the airport itself. The primary power supply for the airport transpired during the night from 0–14 moments (as a result of inadequate wind and PV output) and in the afternoon from 26–33 moments (owing to the airport’s peak demand period and reduced tariff prices). When there is adequate wind energy between the moments of 44 and 48, the airport begins to commercialise its power. By being charged overnight from 5 to 17 moments (during periods of low electricity prices), the energy storage system functions as a power generator at the airport during peak passenger hours, thereby mitigating power losses (Figure 8B). Peak shaving and valley filling are critical functions of the BESS, which operate in a state of charge during periods of low energy (7–12 moments) and discharging during periods of high demand in order to decrease operational expenses.
The energy scheduling for the winter season at the Copenhagen airport is illustrated in Figure 8B. As a result of increased heating and electricity demands, the airport’s overall energy consumption doubled during the winter compared to the summer. In Denmark, where wind energy is abundant during the winter, PV energy is in severe limited supply. Due to this, alternative energy suppliers are required to provide power to the entire airport in order to satisfy its energy requirements.
The Copenhagen airport incurs an approximate daily operating expense of USD 36,087.83 during the summer season and USD 102,061.20 during the winter season. The operational expenses of the airport have been substantially diminished since the conclusion of the energy system, which has also enabled an effective reduction in total CO2 emissions. The effective implementation of the energy management strategy at Copenhagen Airport during the annual summer and winter seasons substantiates the practicality and suitability of this specific resolution.
The trajectory of the energy transition is contingent upon a multitude of interdependent variables. Uncertainties pertaining to the rate of technological advancement, fluctuations in costs, and changes in policies give rise to an extensive array of potential scenarios, specifically concerning the future of microgrid systems.
This section provides a detailed explanation of how the self-sufficient power supply capability of an airport’s microgrid system could be enhanced through optimisation of the airport’s geographical environment and energy utilisation. The proportion of RE generation in the airport’s system is depicted in Figure 9. Given that renewable energy sources produce 81.0% of the airport’s total electricity generation in the summer and 49.0% of the electricity generation in the winter, there is evident potential for their implementation at the airport.
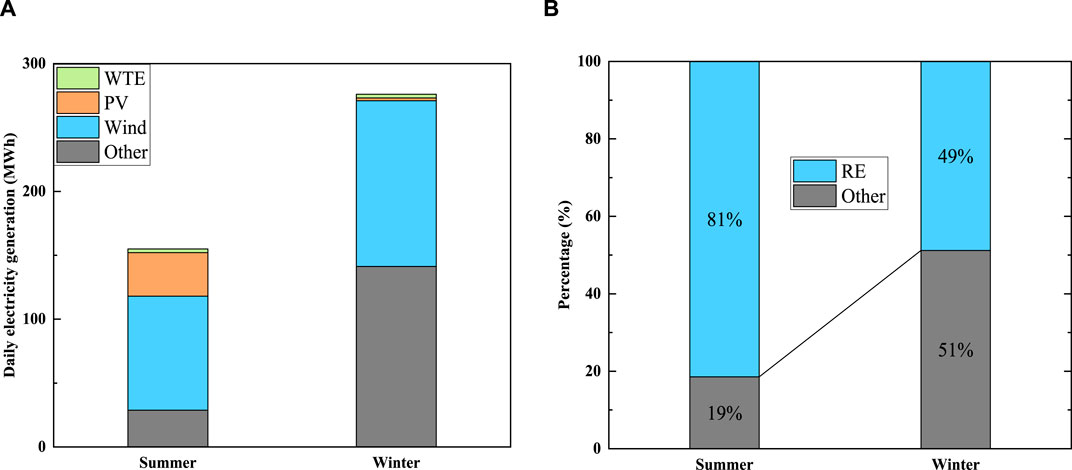
Figure 9. Total daily electricity generation. (A) Electricity generation of the airport. (B) Percentage of electricity generated from PR.
The operational cost reduction of airports utilising this power supply model has confirmed the viability of this energy management scheme in the northern European region, as demonstrated by the Copenhagen airport case study. The endeavour has advanced NZE by facilitating its transition to a green airport. The airport has achieved a daily CO2 emission reduction of 43.96 Mt in the winter and 41.19 Mt in the summer as a result of this strategy. While the programme is still in its conceptual phase, its successful implementation would expedite the electrification of airports, advance sustainability efforts, and alleviate the aviation industry’s substantial carbon footprint.
This work is in accordance with multiple Sustainable Development Goals (SDGs), specifically SDG#7 (affordable and clean energy) and SDG#13 (climate action), through its promotion of renewable energy usage in airport operations, support for innovations in energy management strategies, and encouragement of industry, innovation, and infrastructure-related SDG#9 initiatives, respectively. In addition, SDG#12 (responsible consumption and production) is supported by our emphasis on waste-to-energy technologies and sustainable energy practices (Kurniawan et al., 2024).
Although not entirely net-zero, the Copenhagen airport is advancing in that direction by utilising renewable energy at an all-time high. PV and wind turbines will collectively supply the airport with the majority of its energy by 2050. At this time, it is uncertain whether the supply chain can maintain speed with the airport’s energy transition. Land availability, material shortages, and production constraints all threaten to impede this momentum. These hazards manifest to different extents in each scenario that has been simulated by this work.
The MPC energy management strategy for airport microgrids proposed in this work provides a feasible solution for moving towards green airports. While advancing engineering research, there are practical engineering application prospects and implications, and there are potential social contributions that benefit the public.
1) Achieving the 2050 Carbon Neutrality Target: Airports are a significant source of carbon emissions and the transition to green airports is an inevitable trend, and this work aims to provide a viable solution for achieving carbon neutrality by 2050. This is in line with global efforts to combat climate change and reduce greenhouse gas emissions, while moving towards a net-zero emissions future for airports.
2) Power supply reliability: Adaptive energy management strategies can enhance the resilience and reliability of airport operations. By diversifying energy sources and employing real-time monitoring and control systems, airports can better withstand disruptions such as power outages or fluctuations in energy supply. This increased resilience ensures uninterrupted operations, improves the passenger experience, and enhances safety and security measures.
3) Sustainable energy strategy: Implementing this strategy would allow airports to respond positively to the wonderful initiatives of technological innovation and sustainability in the aviation industry. This study integrates waste, wind and solar energy, combined with dispatch optimisation of energy storage, to develop a comprehensive energy management strategy for airports. By harnessing a wide range of renewable energy sources and optimising their utilisation, it helps to drive the development of sustainable energy solutions for the aviation industry.
4) Optimal scheduling of resources: The adaptive nature of the proposed strategy ensures efficient utilisation of resources. By dynamically adjusting energy generation and consumption based on real-time data and airport traffic, we maximise the use of renewable energy sources while minimising reliance on conventional energy sources. This optimisation improves the overall sustainability and resilience of airport operations.
5) Financial benefits: In the long run, implementing our energy management strategy can result in significant cost savings for airports by reducing reliance on fossil fuels and lowering energy bills. This financial sustainability contributes to the overall economic viability of the airport while facilitating renewable energy investments. In addition, it stimulates economic growth by creating jobs in renewable energy infrastructure development and green technologies.
6) Public Health and Well-Being: By reducing carbon emissions and air pollution associated with airport operations, our work helps to improve public health and environmental quality. As a result, the community around the airport will benefit from cleaner air and a greener community environment. In addition, the airport can demonstrate its commitment to environmental stewardship and corporate social responsibility. This helps create a positive public image, attract environmentally conscious travellers and stakeholders, and strengthen partnerships with government agencies and industry leaders.
This study has shown the importance of energy supply routing and storage management in improving an airport’s integrated energy system. A simulation run reveals that the RE at Copenhagen airport accounts for 81.0% of the total electricity generation during the summer and 49.0% during the winter. In order to achieve this, a daily operating cost of USD 36,087.83 is needed during the summer and USD 102,061.20 is necessary during the winter to decrease carbon emissions by 41.19 Mt/days and 43.96 Mt/days during the summer and winter, respectively. This initiative is expected to not only make a significant contribution to the global implementation of environmentally-friendly airports in the long term, but also to achieving carbon neutrality by 2050. This study still has some limitations, and simulation experiments at other airports under different environmental conditions are required to verify the universality of this management scheme. In addition, due to the privacy of airports, the accuracy of the acquired data is different, which may lead to the deviation of the simulation results from the operation in real scenarios. This study is currently only in the simulation validation stage, and further field surveys, construction, measurement and validation should be conducted for the implementation of the actual project.
The original contributions presented in the study are included in the article/Supplementary material, further inquiries can be directed to the corresponding authors.
HG: Funding acquisition, Investigation, Methodology, Supervision, Writing–review and editing. WS: Data curation, Formal Analysis, Investigation, Resources, Software, Writing–original draft. XL: Investigation, Project administration, Visualization, Writing–review and editing. DZ: Investigation, Visualization, Writing–review and editing. WD: Investigation, Visualization, Writing–review and editing, Investigation. TK: Conceptualization, Formal Analysis, Validation, Writing–review and editing. KG: Investigation, Visualization, Writing–review and editing.
The author(s) declare that financial support was received for the research, authorship, and/or publication of this article. This research was funded by Guangxi University grant number A3020051008.
The authors declare that the research was conducted in the absence of any commercial or financial relationships that could be construed as a potential conflict of interest.
All claims expressed in this article are solely those of the authors and do not necessarily represent those of their affiliated organizations, or those of the publisher, the editors and the reviewers. Any product that may be evaluated in this article, or claim that may be made by its manufacturer, is not guaranteed or endorsed by the publisher.
Academic Accelerator (2023). Copenhagen airport. Available at: https://academic-accelerator.com/encyclopedia/copenhagen-airport (Accessed December 18, 2023).
ATP (2023). Sustainability ambitions. Available at: https://www.atp.dk/en/sustainability (Accessed December 18, 2023).
Batool, F., Kurniawan, T. A., Mohyuddin, A., Othman, M. H. D., Aziz, F., Al-Hazmi, H., et al. (2023). Environmental impacts of food waste management technologies: a critical review of life cycle assessment (LCA) studies. Trends Food Sci. Technol. 143, 104287. doi:10.1016/j.tifs.2023.104287
Baxter, G., Srisaeng, P., and Wild, G. (2018). An assessment of airport sustainability, part 2—energy management at Copenhagen Airport. Resources 7 (2), 32. doi:10.3390/resources7020032
Britannica (2023). Copenhagen national capital, Denmark. Available at: https://www.britannica.com/place/Copenhagen (Accessed December 18, 2023).
CAAC (2022). “14th Five-Year Plan” for the green development of civil aviation. Available at: https://www.gov.cn/zhengce/zhengceku/2022-01/28/5670938/files/c22e012963ce458782eb9cb7fea7e3e3.pdf (Accessed December 18, 2023).
CPH (2022a). CPH FACTS and FIGURES 2022. Available at: https://www.cph.dk/4980b4/globalassets/8.-om-cph/cph-infographics-keyfigures-2022-onepager.pdf (Accessed December 18, 2023).
CPH (2022b). Annual report 2022. Available at: https://www.cph.dk/4936e4/globalassets/8.-om-cph/6.-investor/arsrapporter/2022/2022_copenhagen_airports_as_group_annual_report_2022_uk.pdf (Accessed December 18, 2023).
Cuadra, L., Ocampo-Estrella, I., Alexandre, E., and Salcedo-Sanz, S. (2019). A study on the impact of easements in the deployment of wind farms near airport facilities. Renew. Energy 135, 566–588. doi:10.1016/j.renene.2018.12.038
European Commission (2023). European Green Deal: new law agreed to cut aviation emissions by promoting sustainable aviation fuels. Available at: https://ec.europa.eu/commission/presscorner/detail/en/ip_23_2389 (Accessed December 18, 2023).
Goh, H. H., Shi, S., Liang, X., Zhang, D., Dai, W., Liu, H., et al. (2022). Optimal energy scheduling of grid-connected microgrids with demand side response considering uncertainty. Appl. Energy 327, 120094. doi:10.1016/j.apenergy.2022.120094
ICAO (2018). Renewable energy for aviation: practical applications to achieve carbon reductions and cost savings. Available at: https://www.icao.int/environmental-protection/Documents/2_1_Renewable%20Energy%20for%20Aviation%20Practical%20Applications%20to%20Achieve%20Carbon%20Reductions%20and%20Cost%20Savings.pdf (Accessed December 18, 2023).
ICAO (2019). A Focus on the production of renewable energy at the Airport site. Available at: https://www.icao.int/environmental-protection/Documents/Energy%20at%20Airports.pdf (Accessed December 18, 2023).
IEA (2022a). Electricity information. Available at: https://www.iea.org/data-and-statistics/data-product/electricity-information (Accessed December 18, 2023).
IEA (2022b). Tracking aviation. Available at: https://www.iea.org/energy-system/transport/aviation#tracking (Accessed December 18, 2023).
IRA (2023). The USA inflation reduction Act (IRA). Available at: https://www.irs.gov/pub/irs-drop/n-23-06.pdf (Accessed December 18, 2023).
Justo, J. J., Mwasilu, F., Lee, J., and Jung, J. W. (2013). AC-microgrids versus DC-microgrids with distributed energy resources: a review. Renew. Sustain. energy Rev. 24, 387–405. doi:10.1016/j.rser.2013.03.067
Khan, T., Yu, M., and Waseem, M. (2022). Review on recent optimization strategies for hybrid renewable energy system with hydrogen technologies: state of the art, trends and future directions. Int. J. Hydrogen Energy 47 (60), 25155–25201. doi:10.1016/j.ijhydene.2022.05.263
Kurniawan, T. A., Liang, X., Goh, H. H., Othman, M. H. D., Anouzla, A., Al-Hazmi, H. E., et al. (2024). Leveraging food waste for electricity: a low-carbon approach in energy sector for mitigating climate change and achieving net zero emission in Hong Kong (China). J. Environ. Manag. 351, 119879. doi:10.1016/j.jenvman.2023.119879
Kurniawan, T. A., Liang, X., O’Callaghan, E., Goh, H., Othman, M. H. D., Avtar, R., et al. (2022a). Transformation of solid waste management in China: moving towards sustainability through digitalization-based circular economy. Sustainability 14 (4), 2374. doi:10.3390/su14042374
Kurniawan, T. A., Othman, M. H. D., Liang, X., Ayub, M., Goh, H. H., Kusworo, T. D., et al. (2022b). Microbial fuel cells (mfc): a potential game-changer in renewable energy development. Sustainability 14 (24), 16847. doi:10.3390/su142416847
Liang, X., Goh, H. H., Kurniawan, T. A., Zhang, D., Dai, W., Liu, H., et al. (2022a). Utilizing landfill gas (LFG) to electrify digital data centers in China for accelerating energy transition in Industry 4.0 era. J. Clean. Prod. 369, 133297. doi:10.1016/j.jclepro.2022.133297
Liang, X., Kurniawan, T. A., Goh, H. H., Zhang, D., Dai, W., Liu, H., et al. (2022b). Conversion of landfilled waste-to-electricity (WTE) for energy efficiency improvement in Shenzhen (China): a strategy to contribute to resource recovery of unused methane for generating renewable energy on-site. J. Clean. Prod. 369, 133078. doi:10.1016/j.jclepro.2022.133078
Ma, G. Z., Lin, Y. J., Zhang, Z. Y., Yin, B. X., Pang, N., and Miao, S. H. (2021). A robust economic dispatch method for an integrated energy system considering multiple uncertainties of source and load. Power Syst. Prot. Control 49 (20), 43–52. doi:10.19783/j.cnki.pspc.201614
Nord Pool (2023). Market-data in DK2 2022. Available at: https://www.nordpoolgroup.com/en/Market-data1/Dayahead/Area-Prices/DK/Hourly/?view=Table (Accessed December 18, 2023).
Ortega Alba, S., and Manana, M. (2017). Characterization and analysis of energy demand patterns in airports. Energies 10 (1), 119. doi:10.3390/en10010119
Santa, S. L. B., Ribeiro, J. M. P., Mazon, G., Schneider, J., Barcelos, R. L., and de Andrade, J. B. S. O. (2020). A Green Airport model: proposition based on social and environmental management systems. Sustain. Cities Soc. 59, 102160. doi:10.1016/j.scs.2020.102160
Seyanont, A. (2011). Passengers’ perspective toward airport service quality at Suvarnabhumi International Airport.
Sreenath, S., Sudhakar, K., Yusop, A. F., Solomin, E., and Kirpichnikova, I. M. (2020). Solar PV energy system in Malaysian airport: glare analysis, general design and performance assessment. Energy Rep. 6, 698–712. doi:10.1016/j.egyr.2020.03.015
Tang, Z., Liu, J., Shen, H., and Zeng, P. P. (2022). Heterogeneous energy storage system scheduling strategy for low carbon airport oriented microgrid. Energy Rep. 8, 307–314. doi:10.1016/j.egyr.2022.09.154
Varriale, C., De Marco, A., Daniele, E., Schmidt, J., and Stoevesandt, B. (2018). Flight load assessment for light aircraft landing trajectories in windy atmosphere and near wind farms. Aerospace 5 (2), 42. doi:10.3390/aerospace5020042
Xiang, Y., Cai, H., Liu, J., and Zhang, X. (2021). Techno-economic design of energy systems for airport electrification: a hydrogen-solar-storage integrated microgrid solution. Appl. energy 283, 116374. doi:10.1016/j.apenergy.2020.116374
Zhou, Y. (2022). Low-carbon transition in smart city with sustainable airport energy ecosystems and hydrogen-based renewable-grid-storage-flexibility. Energy Rev. 1, 100001. doi:10.1016/j.enrev.2022.100001
Keywords: climate change, decarbonization, greenhouse gas, net-zero emissions, waste management
Citation: Goh HH, Suo W, Liang X, Zhang D, Dai W, Kurniawan TA and Goh KC (2024) An adaptive energy management strategy for airports to achieve carbon neutrality by 2050 via waste, wind, and solar power. Front. Energy Res. 12:1365650. doi: 10.3389/fenrg.2024.1365650
Received: 04 January 2024; Accepted: 11 March 2024;
Published: 05 April 2024.
Edited by:
Pengfei Liu, RWTH Aachen University, GermanyReviewed by:
Godwin Norense Osarumwense Asemota, University of Rwanda, RwandaCopyright © 2024 Goh, Suo, Liang, Zhang, Dai, Kurniawan and Goh. This is an open-access article distributed under the terms of the Creative Commons Attribution License (CC BY). The use, distribution or reproduction in other forums is permitted, provided the original author(s) and the copyright owner(s) are credited and that the original publication in this journal is cited, in accordance with accepted academic practice. No use, distribution or reproduction is permitted which does not comply with these terms.
*Correspondence: Hui Hwang Goh, aGhnb2hAZ3h1LmVkdS5jbg==; Tonni Agustiono Kurniawan, dG9ubmlAeG11LmVkdS5jbg==
Disclaimer: All claims expressed in this article are solely those of the authors and do not necessarily represent those of their affiliated organizations, or those of the publisher, the editors and the reviewers. Any product that may be evaluated in this article or claim that may be made by its manufacturer is not guaranteed or endorsed by the publisher.
Research integrity at Frontiers
Learn more about the work of our research integrity team to safeguard the quality of each article we publish.