
95% of researchers rate our articles as excellent or good
Learn more about the work of our research integrity team to safeguard the quality of each article we publish.
Find out more
ORIGINAL RESEARCH article
Front. Energy Res. , 23 February 2024
Sec. Advanced Clean Fuel Technologies
Volume 12 - 2024 | https://doi.org/10.3389/fenrg.2024.1365649
This article is part of the Research Topic Production Technology for Deep Reservoirs View all 37 articles
 Zhenfeng Ding1Chenqi Ge2Zhewei Chen1
 Dongqi Ji1*Yingfeng Peng1Guangming Zhang1
 Yanan Hou3*Jingzhou Zhang4
Waterflood-induced fractures can enhance the production of deep tight oil reservoirs. However, if waterflood-induced fractures propagate fast, they connect injection wells to production wells earlier, inhibiting the production of tight oil reservoirs. In the present research, the fast propagation mechanism of waterflood-induced fractures was mainly investigated. The changes in sandstone mechanical properties by water were investigated by laboratory experiments, and the relationship of the geomechanical damage of sandstones with water saturation was quantified. Flow-geomechanics-coupled numerical simulations were performed to analyze the impacts of water flooding on stress distribution in a deeply deposited tight oil reservoir. Based on the fracture mechanics theory, the propagation length of the waterflood-induced fracture was calculated and the characteristics of waterflood-induced fracture propagation were analyzed. Experimental results revealed that water changed the mineral composition and microscopic structure of sandstones. This phenomenon decreased the Young’s modulus and tensile strength of sandstones and increased the Poisson’s ratio. The changing magnitude of these properties increased with the rise of water saturation, and the maximum changing magnitude reached 70%. The water saturation distribution became heterogeneous after waterflooding, causing a heterogeneous distribution of mechanical properties. The stress around the fracture tip and the fracture propagation length were significantly affected by these property changes. After the geomechanical damage, the fracture propagation pressure decreased by about 20%. Moreover, the initial fracture length enhanced the propagation length of the waterflood-induced fracture. These results suggest that the propagation of waterflood-induced fractures becomes more significant during waterflooding; thus, the injection pressure should be reduced to avoid fast fracture propagation.
Tight oil reservoirs are important unconventional reservoirs (Jia et al., 2008; Tong et al., 2014; Zou et al., 2015; Wang et al., 2017b; Chai et al., 2022a; Chai et al., 2022b). Owing to the low primary recovery rate of tight oil (5%–10%), advanced oil recovery methods are usually implemented to improve its recovery rate (Wang, 2007; Wang et al., 2017a; Tian et al., 2019; 2020; Zhang et al., 2020). Water injection has been proved efficient in tight oil reservoirs because it can supplement the formation energy and overcome the threshold pressure gradient (Fan et al., 2015).
It is reported that waterflooding can induce fractures in reservoirs (Hagoort et al., 1981; Suarez-Rivera et al., 2002; Baker et al., 2016). These waterflood-induced fractures (WIFs) propagate toward production wells during waterflooding, and this process is beneficial for tight oil reservoirs. However, WIFs can expand to production wells, causing sudden water influx and a decrease in recovery efficiency (Wang et al., 2018). Therefore, WIF propagation plays an important role during waterflooding in tight oil reservoirs. Tight oil reservoirs have low permeability; thus, the efficiency of waterflooding is low. The generation of WIFs can increase the flow capacity of injected water, and it is beneficial for tight oil reservoirs. In addition, the generation of WIFs is difficult to be avoided. In tight oil reservoirs, most wells undergo a hydraulic fracture process. Owing to their low production rate, production wells often turn into injection wells, and hydraulic fractures occur around these injection wells. During waterflooding, the pressure inside hydraulic fractures increases and exceeds the minimum principal stress of reservoirs after water injection, resulting in the generation of WIFs (Suri and Sharma, 2009; Baker et al., 2016). Waterflooding also generates temperature-induced stress, which makes the generation of WIFs easier (Suri and Sharma, 2009, 2010). The temperature of injected water is generally lower than that of tight oil reservoirs; thus, thermal stress is generated in reservoirs. This thermal stress decreases the in-situ stress, and the low temperature also reduces the fracture propagation energy; hence, WIFs can easily propagate when the injected water temperature is low. Natural fractures also affect WIF propagation. WIFs propagate along natural fractures when the difference between two horizontal stresses is low; otherwise, WIFs propagate along the direction of the maximum horizontal stress. Moreover, the heterogeneous distribution of Young’s modulus can also affect WIF propagation (Li et al., 2012). In this case, the stress distribution becomes complicated and affects WIF propagation (Li et al., 2012). The common criteria to predict fracture propagation are the tensile properties of reservoirs. If the tensile stress around a fracture tip is higher than the tensile strength, the fracture propagates. The other criteria to predict fracture propagation are the Mohr-Columb criterion, the Griffith criterion, and the stress intensity factor.
It is reported that water-rock interactions can greatly change rock properties (Young’s modulus and uniaxial compressive strength (UCS)). Water invasion can decrease Young’s modulus by ∼20%, decrease USC by ∼40%, and increase the Poisson’s ratio by ∼60% (Valès et al., 2004; Yuan et al., 2014; Meng et al., 2015; Wen et al., 2015). These changes in rock mechanical properties can be attributed to the reduction in fracture energy, the decrease in suction pressure, the swelling of materials (Wang et al., 2015), and the generation of microcracks upon wetting (Shi et al., 2012; Ling et al., 2016). It is shown that high content of montmorillonite and carbonate minerals contribute to the formation of dissolution pores and the loosening and detachment of mineral particles during hydration. The arrangement, bonding status, and development of microcracks of the original mineral particles in the sample have a significant impact on the formation of dissolution pores and the detachment of mineral particles after hydration (Sui et al., 2018). During long-term waterflooding, the distribution of water saturation in reservoirs becomes heterogeneous. In this case, water-rock interactions in different locations of a reservoir are different; thus, the heterogeneity of rock properties increases, affecting the stress distribution and fracture propagation in the reservoir.
However, in previous studies, the effects of water-rock interactions on in-situ stress and WIF propagation are not clarified. At present, the impact of water flooding on the mechanical properties and crack propagation of tight sandstone, as well as the underlying mechanisms, are unknown. Hence, in the present research, the effects of water-rock interactions on WIF were investigated. Experiments were conducted to investigate the impacts of water-rock interactions on the mechanical properties of rocks. Moreover, the damage magnitudes of Young’s modulus, Poisson’s ratio, and tensile strength were calculated. In addition, the stress change behavior in a tight oil reservoir during waterflooding was investigated by flow-geomechanics-coupled numerical simulations. Based on the theory of fracture mechanics, the stress intensity factor at the fracture tip was calculated to evaluate the propagation length of WIF. Finally, sensitivity studies were conducted to discuss the impacts of different factors on WIF.
To investigate the effects of hydration on the mechanical properties of tight sandstones, specimens were divided into three groups: 1) dry sample, 2) fully water-saturated, and 3) incomplete water-saturated. The tight sandstone samples used in this paper are all subsurface rocks, which were taken from tight sandstone gas reservoirs. These tight sandstone samples have an average porosity of 12% and an average permeability of 4.8mD. The mineral composition is introduced in the following sections of this paper. These tight sandstone samples do not contain oil.
The preparation steps of specimens at saturation states are presented below.
I. Fully water-saturated samples:
The dry specimens were weighed and soaked in a potassium sulfate solution until they became completely saturated (Figure 1A). The dried specimens were weighed and saturated in a drying vessel (Figure 1B).
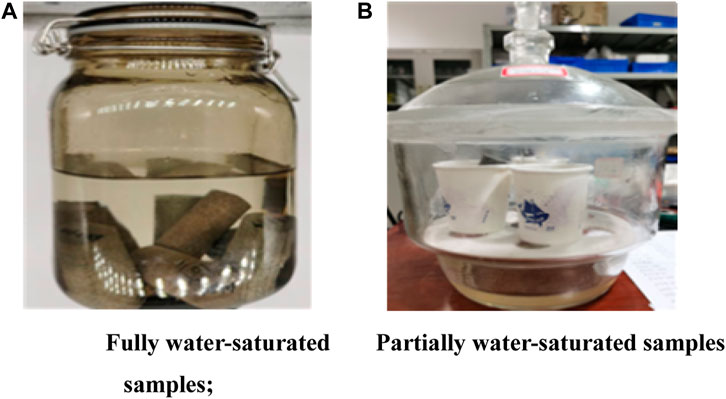
FIGURE 1. (A) Fully water-saturated samples; (B) Partially water-saturated samples.
To calculate the water saturation of the specimens, the water content of the specimens was divided by the water content of the fully saturated specimens. Noted that drilled cores or rock blocks were used in the specimens, and artificial fractures were not allowed during the preparation process.
The mechanical properties of rock are controlled by the mineral composition and microstructure of rock. The changes in rock mechanical properties are due to the changes in rock microstructure and mineral composition caused by hydration. In order to investigate the mechanism of the influence of hydration on rock mechanical properties, the microstructure and mineral composition of rocks under different saturation states were tested and analyzed. The samples with different saturation states were analyzed by triaxial compression tests, tensile strength tests, field-emission scanning electron microscopy (FESEM), and X-ray diffraction (XRD) analysis.
Triaxial compression tests were performed on an MTS-816 true triaxial compression test system. The sample diameter and height were 24.7 mm and 51.02 mm, respectively. The diameter error did not exceed 0.3 mm, and the maximum parallelism at both ends of each sample did not exceed 0.05 mm. Experimental specifications complied with the laboratory test standards recommended by the International Society for Rock Mechanics (ISRM). The mechanical parameters of rocks, such as compressive strength, Young’s modulus, Poisson’s ratio, were experimentally determined.
The Brazilian disk method recommended by the International Committee for Rock Mechanics Experiments was adopted to measure the tensile strength of rocks. It must be noted that Brazilian disc test is an indirect measure of tensile strength of a rock. The sample diameter and thickness were 24.6 mm and 11.6 mm, respectively. Tensile stress was calculated by Eq. (1).
where P means the peak load during Brazilian disc test, MPa; Dt represents the diameter of the rock sample, mm.
According to the method suggested by the ISRM, the Young’s modulus, Poisson’s ratio, and triaxial compression strength of the specimens were calculated based on their experimental stress-strain curves. The triaxial compression test results of different specimens are presented in Table 1.
TABLE 1. Triaxial compression test results.
With the increase of water saturation, the Young’s modulus decreases from average 20 GPa to 12.8 GPa by 35.9%. As show in Table 1, the greater the confining pressure, the smaller the reduction. When the confining pressure is 0 MPa and 40MPa, the reduction is 68.1% and 20.8%, respectively.
The tensile strengths of the samples were calculated by Eq. (1), and the corresponding results are presented in Table 2.
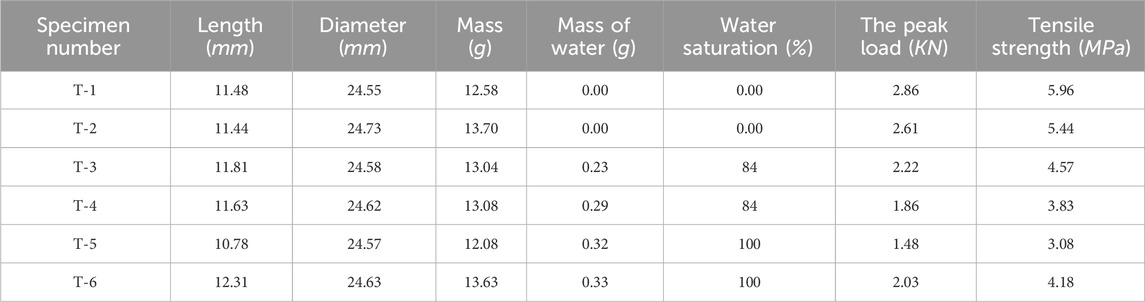
TABLE 2. Tensile test results of rocks.
It is evident that water saturation had an important effect on the tensile strength of rocks. With the increase of water saturation, the tensile strength of rocks decreased by 36.3% (from an average of 5.8 MPa–3.6 MPa).
Zhu and Wei (2011) proposed a damage variable for rocks to describe the damage of sandstones. Owing to the damage of sandstones, the change in the Young’s modulus of rocks was calculated by Eq. 2. The damage variable ɷ was calculated according to the mechanical variation of core parameters under different saturation degrees.
Where, S is the investigated mechanical parameter (Young’s modulus, tensile strength, cohesion), S0 is the initial mechanical parameter, and ɷ is the damage variable.
According to statistical calculations, the damage variables of different samples are listed in Tables 3–5.
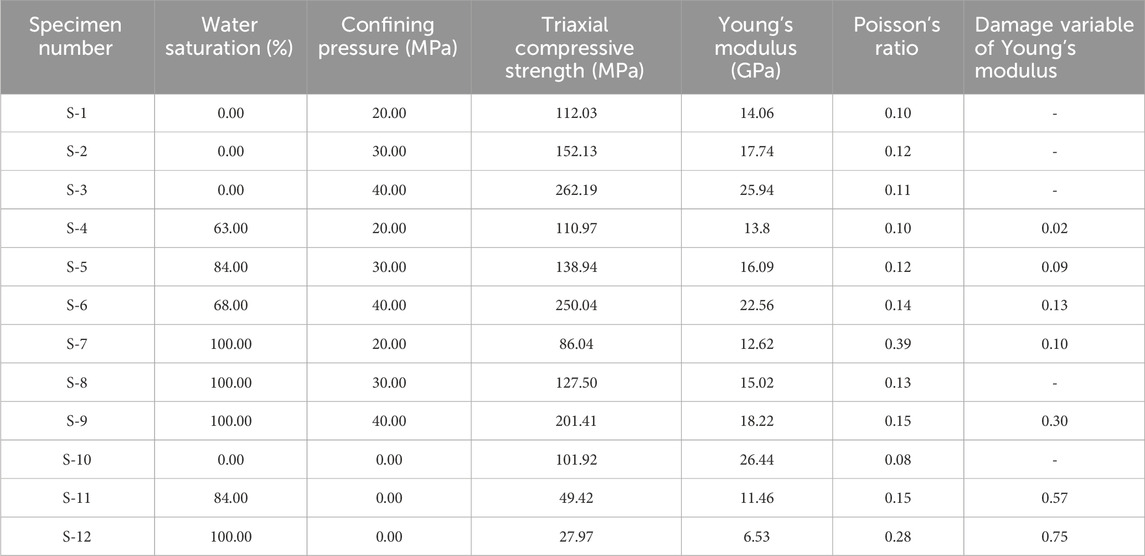
TABLE 3. Damage variables for the Young’s modulus of cores with different saturation degrees.
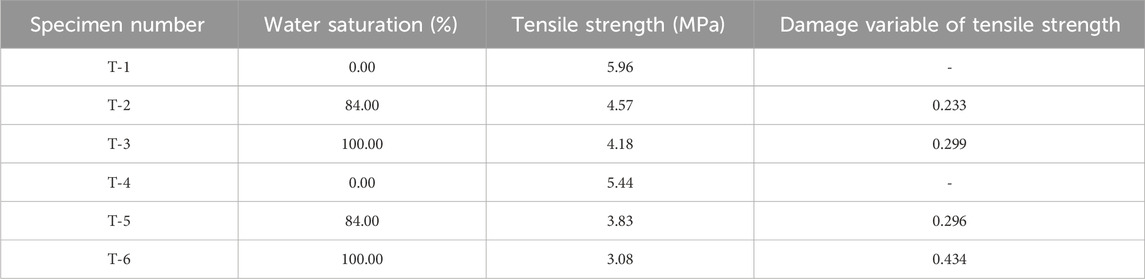
TABLE 4. Damage variables for the tensile strength of cores with different saturation degrees.
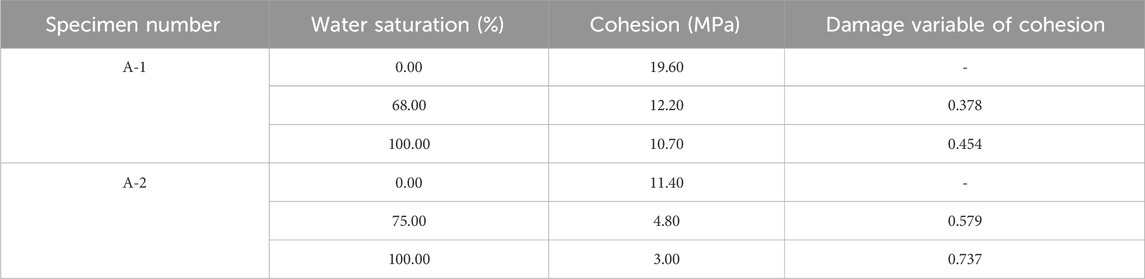
TABLE 5. Damage variables for the cohesion of cores with different saturation degrees.
To analyze the relationships between the damage variables of rock mechanical parameters and water saturation, the results shown in Tables 3–5 were fitted, and the corresponding fitting results are displayed in Figure 2.
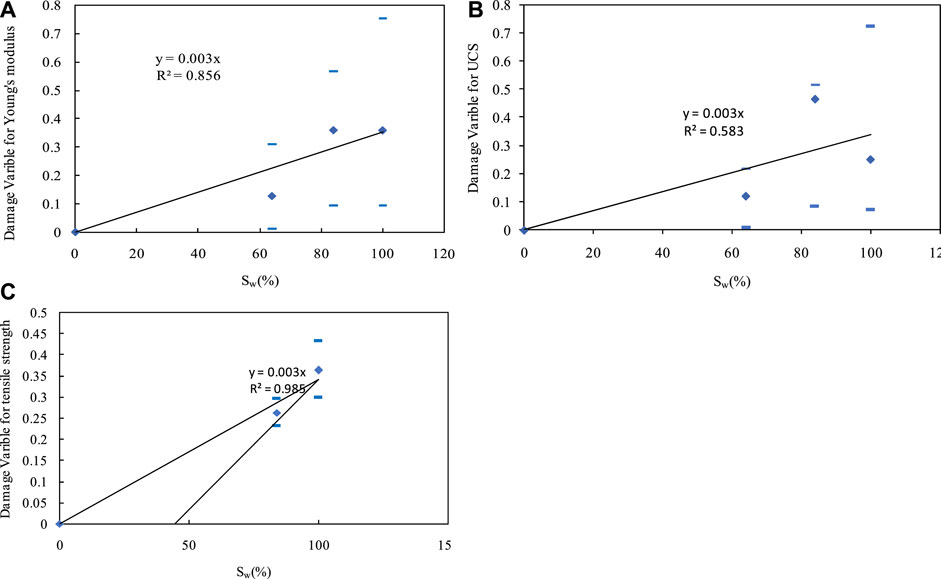
FIGURE 2. (A) Damage coefficient of Young’s modulus (black line represents the fitting equation, short blue lines represent the top and bottom limits of experimental data, blue points represent average values); (B) Damage coefficient of UCS (black line represents the fitting equation, short blue lines represent the top and bottom limits of experimental data, blue points represent average values). (C) Damage coefficient of tensile strength (black line represents the fitting equation, short blue lines represent the top and bottom limits of experimental data, blue points represent average values).
The fitting results obtained from Figure 3 can be expressed as
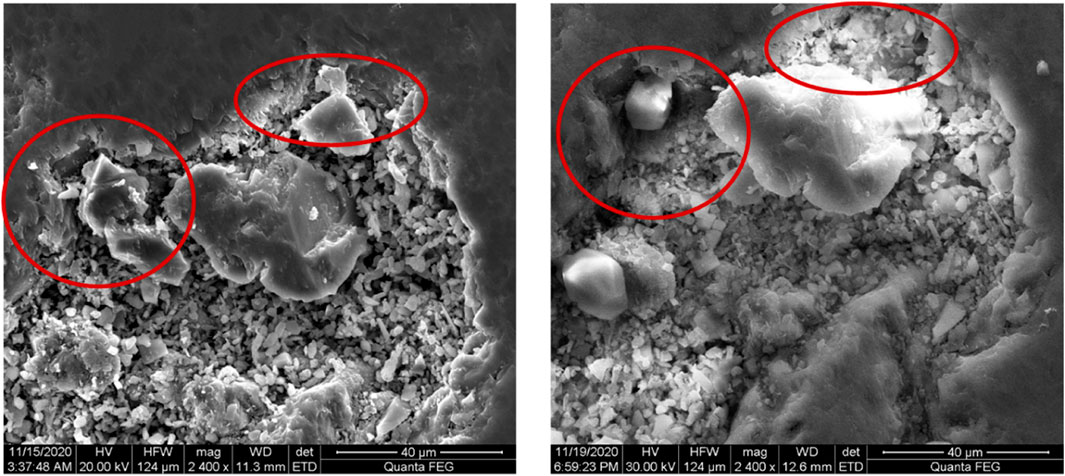
FIGURE 3. Microstructural changes in sample X-2 before (left) and after (right) water saturation (red circles highlight changes).
The fitting results obtained from Figure 5 can be expressed as
The fitting results obtained from Figure 6 can be expressed as
where E is Young’s modulus (GPa), Sc is the compressive strength (MPa), St is the tensile strength (MPa), Sw is the water saturation degree, subscript 0 represents the parameter of dry rocks, DE is the damage coefficient of Young’s modulus, Dc is the damage coefficient of compressive strength, and Dt is the damage coefficient of tensile strength.
The effects of water saturation on the macroscopic mechanical properties of tight sandstones are demonstrated in Sections 2.3.1 and 2.3.2. The changes in macroscopic mechanical properties resulted from the micro-structure changes in tight sandstones. In this section, microstructure changes induced by water saturation are depicted.
Figure 3 displays the SEM images of different samples and compares the microstructural changes in tight sandstones before and after water saturation. Some mineral particles in rocks fell off and migrated to rock surfaces. Clay particles expanded to induce microscopic cracks. These microscopic mechanisms changed the mechanical properties of saturated sandstone rocks.
The WIF propagation length was analyzed by the stress intensity factor around the fracture tip. To calculate the WIF propagation length, the stress around the fracture during water flooding should be known. This kind of stress could be calculated by flow-geomechanics-coupled simulations. The analysis steps of WIF propagation are depicted below.
(1) According to flow-geomechanics-coupled numerical simulation results, the in-situ stress on the reservoir after water injection was calculated.
(2) According to the fracture mechanics theory and numerical simulation results, the stress intensity factor at the crack tip was calculated.
(3) The difference between the stress intensity factor at the fracture tip and the fracture toughness was determined to calculate the WIF propagation length.
To analyze the stress during water flooding, a flow-geomechanics-coupled numerical simulation model was used (Wang and Peng, 2014; Lei et al., 2020). This model included two governing equations: i) flow equation of two-phase fluids through porous media and ii) rock deformation equation.
The main focus of this analysis was the calculation of the fracture strength factor at the fracture tip and the fracture propagation length. Therefore, the whole reservoir was assumed to be a single porous medium; thus, only matrix and hydraulic fractures existed in the reservoir (natural fracture was excluded). One hydraulic fracture is connected to the injection well, and the other fracture is connected to the production well. The continuity equations for water and oil in the reservoir are expressed by Eqs. (9) and (10), respectively, and the models for saturation, relative permeability, and capillary pressure are presented by Eqs. (11)–(15), respectively.
Continuity equation of the water phase:
Continuity equation of the oil phase:
Saturation equation:
Relative permeability model:
Capillary pressure equation:
where Pom is the pressure of the oil phase, Pwm is the pressure of the water phase, Som is the saturation of the oil phase, Swm is the saturation of the water phase, Sor is the residual saturation of the oil phase, Swr is the residual saturation of the water phase, km is the permeability of the matrix, μw is the viscosity of the water phase, μo is the viscosity of the oil phase, φm is the porosity of the matrix, qo is the source and sink of the oil phase, qw is the source and sink of the oil phase, λ could be obtained by fitting the experimental relative permeability values of oil and water, S* o is the normalized saturation, and Pe is the entry pressure (Liu et al., 2011; Wang and Peng, 2014).
As the tight reservoir was saturated with oil and water, the pore pressure depended on the pressure and saturation of water and oil. Based on poroelasticity and the analogy between thermal contraction and adsorption-induced strains (Zhang et al., 2008; Peng et al., 2014a,b), the motion equation of the tight reservoir could be expressed as
where G = E/2/(1 + ν) is the shear modulus (GPa), E is Young’s modulus (GPa), ν is Poisson’s ratio, K is the bulk modulus (GPa), εad is the stress after water absorption water, f is the volume force, u is the displacement, p is the pore pressure (MPa), α is Biot’s coefficient, Sw is the saturation of water, and So is the saturation of oil (Qu et al., 2019).
The impacts of geomechanical damage on stress were analyzed to track the changes in mechanical parameters (Young’s modulus, Poisson’s ratio, tensile strength, cohesion) after water saturation, and the corresponding model is expressed by Eq. (2).
The propagation process of WIF was mainly affected by the reservoir stress and the fluid pressure in the fracture. The in-situ stress on the fracture was symmetrically distributed along the water injection well (Figure 4). It was assumed that the fracture lengths before and after WIF propagation were 2H2 and 2H, respectively. The half-length of fracture propagation was h = H − H2.

FIGURE 4. Schematic diagram of stress distribution on the fracture wall.
According to the fracture mechanics theory, the stress intensity factor acting on the fracture wall at the crack tip could be expressed as
where H is the half-length of the fracture m), p(x) is the net pressure in the fracture (MPa), and KIA is the stress intensity factor at the crack tip (MPa•m0.5) (Qiangbo, 2017).
Owing to the stress concentration phenomenon at the fracture tip, stress distributions on the fracture wall and at the fracture tip could be simplified as
The initial WIF length was 2H2. To calculate the stress intensity factor at the fracture tip, the uniform fluid pressure in the fracture (Pf) and the effects of the ground stresses σa, σb1, and σb2 were considered. Therefore, the pressure acting on the fracture wall could be expressed as
Now, substituting Eq. (19) into Eq. (17),
Further, the integration of the above equation leads to
If the KIA value obtained from Eq. (21) is higher than the fracture toughness (KIC), WIF propagation will occur. It was assumed that the new WIF length was H. To calculate the pressure acting on the fracture wall (Eq. (22)), the impacts of σa, σb1, σb2, σc1, σc2 on WIF and the fluid pressure in the fracture (Pf) were considered.
Now, substituting Eq. (22) into Eq. (17),
The integration of the above equation leads to Eq. (24). It is noticeable that when H increases, KIA decreases continuously. When KIA decreases to KIC, the propagation of WIF stops. Therefore, when KIA is equal to KIC in Eq. (24), the updated WIF length H) is obtained.
Numerical simulations were conducted to calculate the KIA at the fracture tip during water flooding. To simplify the calculation, a two-dimensional geometric model of 350 m × 200 m size was developed to represent the reservoir. A total of 4,800 grids with a size of 3.5 m × 2.08 m was divided into 100 grids horizontally and 48 grids vertically. The basic parameters of the model are presented in Table 6. The ranges of the parameters were consistent with experimental results. Some parameters were not tested and obtained from previous reports. The model was composed of two wells: one is the injection well located at the left end of the model and the other one is the production well located at the right end of the model (Figure 5A). Both wells were connected to one hydraulic fracture located in the middle of the model. At time t = 0, the pressure at each point in the reservoir was 10 MPa and the initial oil saturation was 0.8. The left and right sides of the model represent constant pressure boundaries. The injection pressure on the injection well was 15.1 MPa, and the production pressure on the production well was 6.5 MPa. No flow boundaries were applied on the upper and lower sides of the model. Referring to the horizontal principal level of tight sandstone reservoir, the minimum and maximum horizontal principal stresses for rock deformation were 20 MPa and 45 MPa, respectively. Roller support boundary conditions were applied to the left and bottom of the model (Figure 5B).
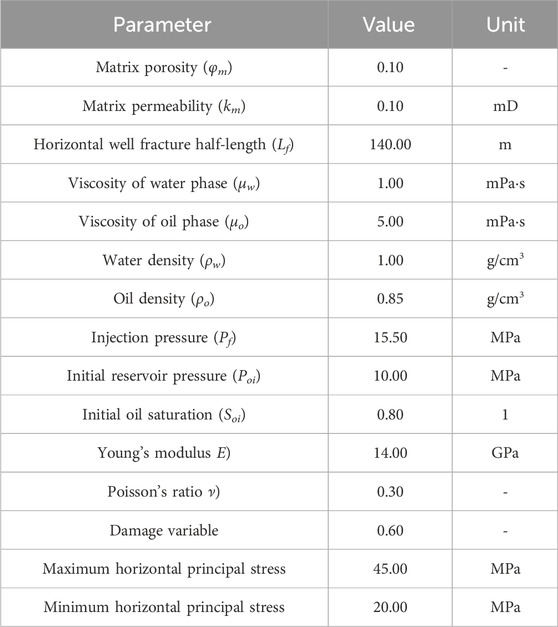
TABLE 6. Numerical simulation parameters.
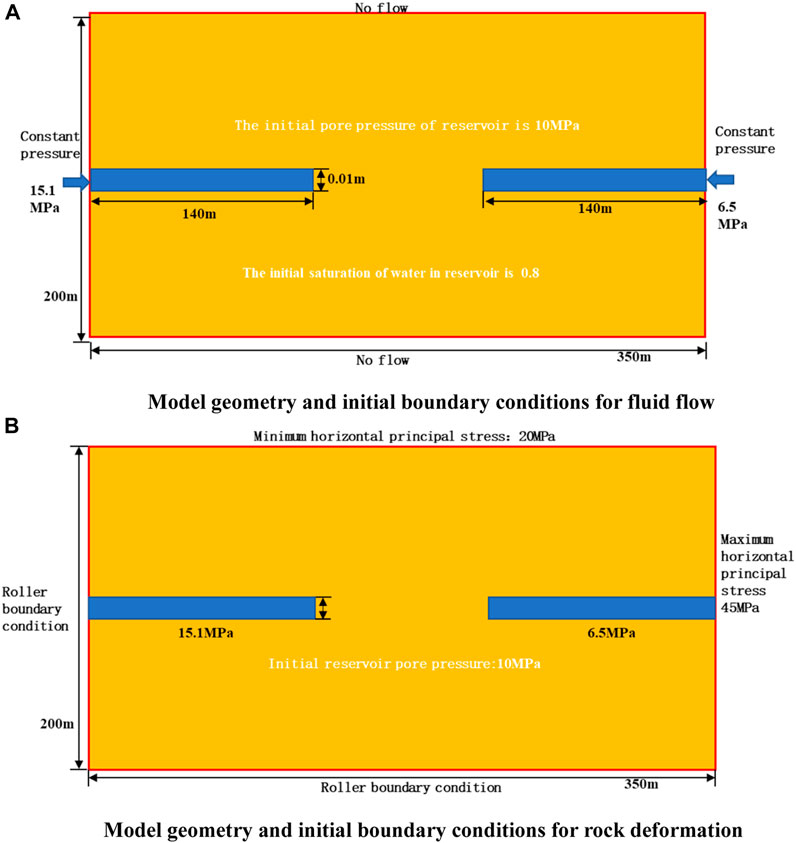
FIGURE 5. Model geometry and initial boundary conditions. (A) For fluid flow. (B) For rock deformation.
It is noticeable from Figure 6B that during waterflooding, the water saturation of the reservoir changed sharply, especially around the hydraulic fracture at the left side of the reservoir. The maximum water saturation reached 0.9, and the maximum change was 0.7. The difference in water saturation between areas around the hydraulic fracture and other areas in the reservoir was extremely large. After 240 days of water injection, the water saturation around the hydraulic fracture at the left side of the reservoir was 0.7–0.9, whereas the water saturation in other areas was around 0.2. Therefore, a heterogeneous distribution of water saturation occurred in the reservoir. According to experimental results, the mechanical properties of rocks changed with the increase of water saturation. Figure 6C reveals that the Young’s modulus of the reservoir changed significantly after 240 days of water injection. The Young’s modulus around the hydraulic fracture decreased from 14 GPa to 7 GPa; therefore, a heterogeneous distribution of Young’s modulus also occurred.
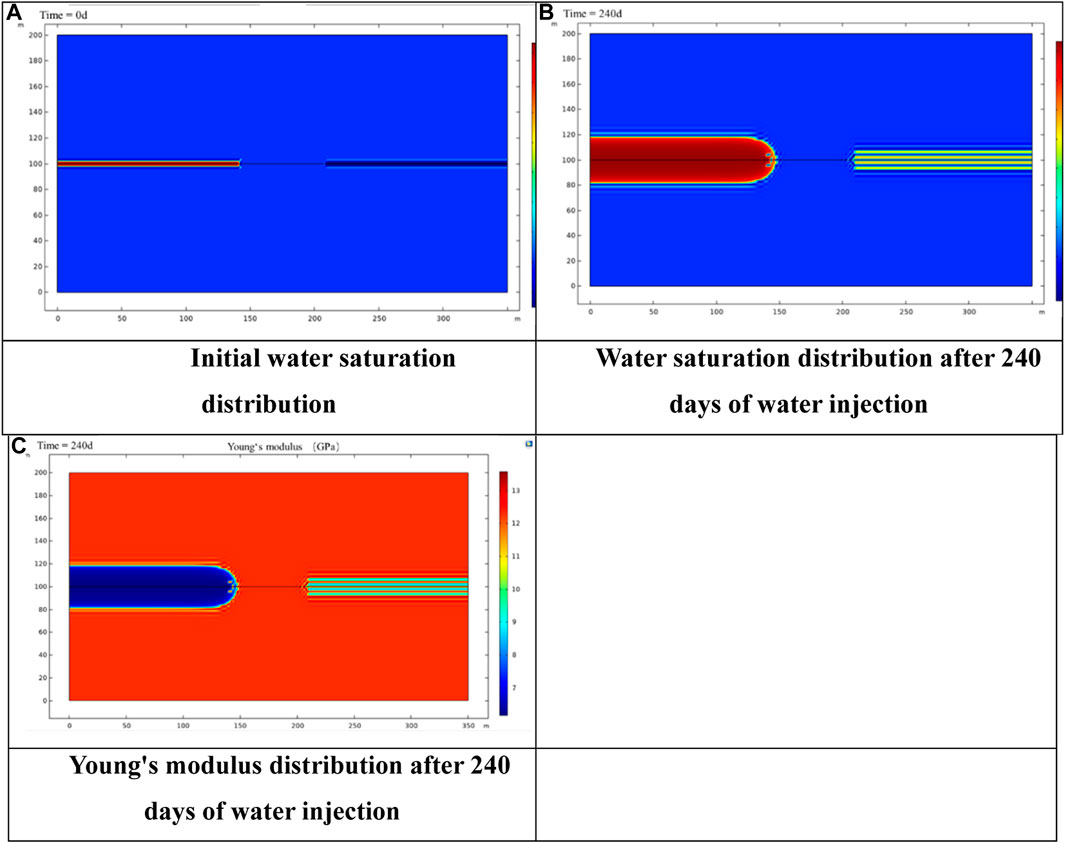
FIGURE 6. (A) Initial water saturation distribution. (B) Water saturation distribution after 240 days of water injection. (C) Young’s modulus distribution after 240 days of water injection.
The heterogeneous distribution of Young’s modulus played an important role in stress variation. Figure 7 displays the stress evolution in the y-direction (vertical to the hydraulic fracture) around the hydraulic fracture. In most areas around the fracture (less than 130 m in Figure 7, length of WIF = 140 m), stress values were almost equal to the minimum horizontal stress of 20 MPa. Owing to WIF, stress concentration occurred at the fracture tip (near 140 m in Figure 7) and turned into tensile stress in some areas. After 150 m, the stress started to increase. After 240 days of water injection, stress values in the areas less than 130 m or greater than 170 m changed slightly; however, stress values in the areas between 130 m and 150 m changed sharply. In most areas around the fracture tip, the stress became tensile (minus stress value in Figure 7), causing WIF propagation.
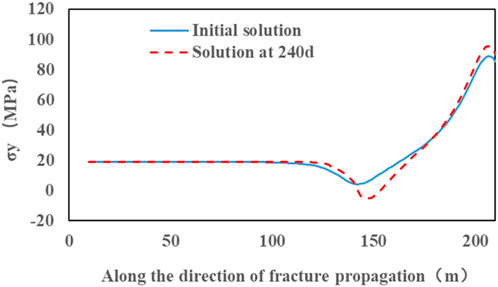
FIGURE 7. Distribution curve of σy along the fracture direction.
According to Eq. (22), stress distributions on the fracture surface and in front of the fracture tip at 0 days and 240 days of water injection were calculated.
The σy distribution at 0 days is of water injection could be expressed as
The σy distribution after 240 days of water injection could be described as
Now, substituting Eqs. (25) and (26) into Eq. (21), it could be inferred that the KIA values at the fracture tip after 0 days and 240 days of water injection were −3.18693.1869 MPa m0.5 and 25.86919 MPa m0.5, respectively. According to the experiment, the KIC of the sandstone sample was 0.4249 MPa m0.5; therefore, WIF could not propagate at 0 days of water injection. Now, substituting Eq. (26) into Eq. 24 and assuming KIA = KIC, the fracture length H was calculated as 159.49 m. The initial fracture half-length was 140 m; hence, the half-length of WIF propagation was 19.49 m.
The mechanical parameters of rocks, such as Young’s modulus and Poisson’s ratio, varied with water saturation. Therefore, eight groups of damage variables were set to illustrate the effects of damage variables on WIF propagation. Parameters relating to stress distributions on the fracture surface and at the fracture front under different damage variables are presented in Tables 7, 8, and the corresponding results are displayed in Figure 8 and 9. When the injection pressure and the fracture length were constant, KIA increased quadratically with the damage variable. When the damage variable of Young’s modulus was less than 0.5, KIA was less than KIC; thus, WIF could not propagate. When the damage variable was greater than 0.5, the WIF propagation length increased exponentially with the damage variable. Therefore, the damage variable reduced the difficulty of fracture propagation and increased the WIF propagation length, implying that in the later stage of waterflooding, the damage variable increased, WIF easily propagated, and the WIF propagation length was larger than that in the early stage of waterflooding, leading to the formation of a sudden water influx.
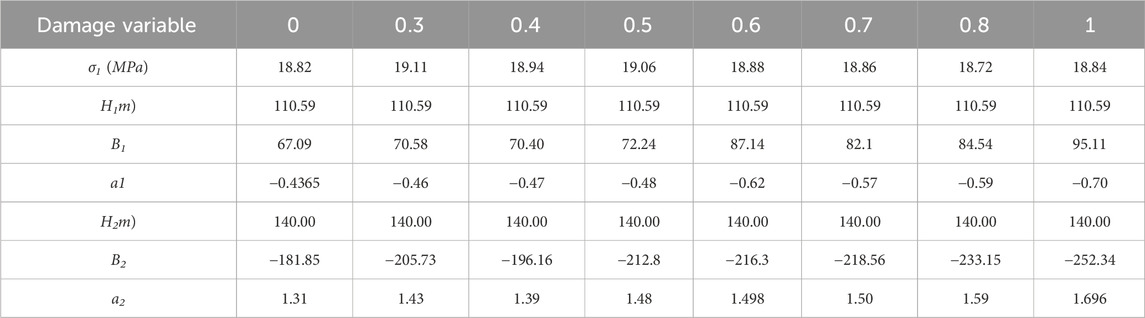
TABLE 7. Stress distribution parameters for the fracture surface under different damage variables.
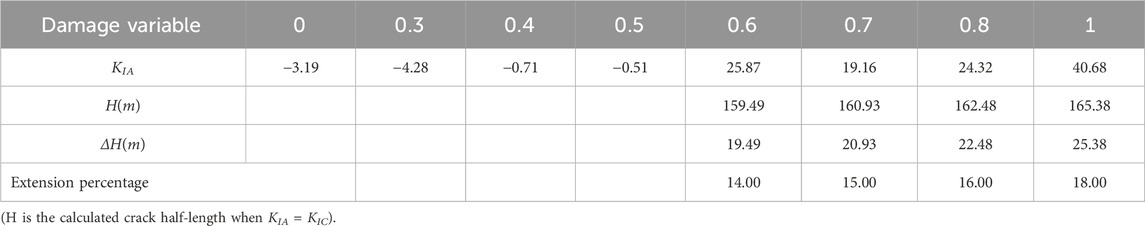
TABLE 8. Calculation results for different damage variables.
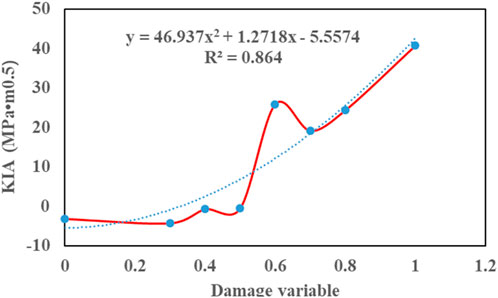
FIGURE 8. Variation of KIA at the fracture tip under different damage variables.
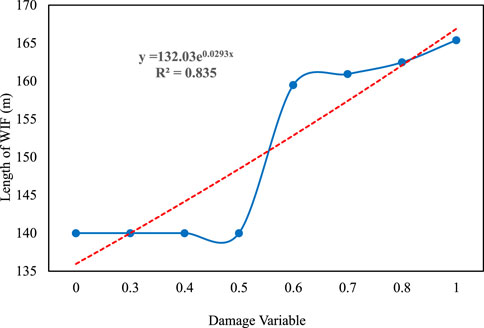
FIGURE 9. Percentages of crack propagation under different damage variables.
Generally, fracture propagation is controlled by the injection pressure. To investigate the influences of injection pressure on fracture propagation, water injection pressures were set to 14 MPa, 15 MPa, 15.5 MPa, 16 MPa, 17 MPa, and 19 MPa.
The variations of KIA at the fracture tip and the half propagation length of WIF are displayed in Figure 10, respectively. All these results were obtained from the same damage variable. A linear relationship was detected between KIA and the injection pressure. Moreover, the half propagation length of WIF also varied linearly with the injection pressure. When the damage variable of Young’s modulus was close to 1 and the injection pressure was 14 MPa, WIF propagated. When the damage variable was taken into account, the critical pressure for WIF propagation was reduced. However, in practical applications, the injection pressure is set as a constant value; thus, sudden WIF propagation and sudden water influx occur.
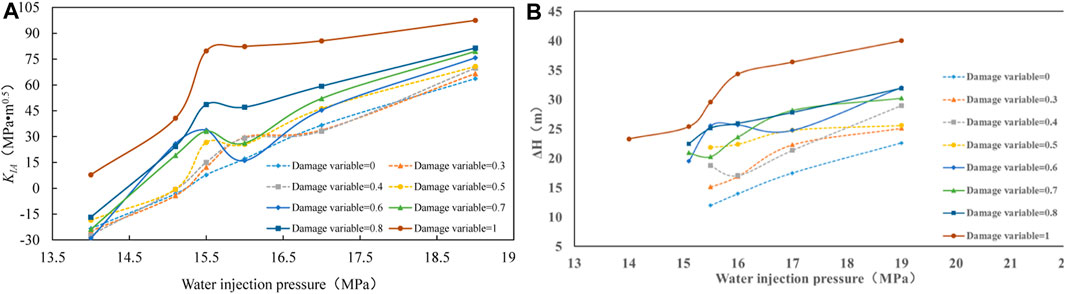
FIGURE 10. (A) Stress intensity factor at the crack tip (KIA) under different injection pressures. (B) Fracture half-lengths under different injection pressures.
Generally, the injection pressure is set close to the minimum horizontal stress. Therefore, in this analysis, the water injection pressure (Pf) was set as 19 MPa. The initial WIF lengths for different cases were 30 m, 60 m, 90 m, 120 m, and 140 m. The KIA values and half propagation lengths of WIF for different cases were calculated. The damage variable was set as 0.6.
Figure 11 and 12 indicate that the KIA and propagation length of WIF increased exponentially with the initial WIF length, implying that WIF could propagate when the initial WIF length was long enough. According to the fitting function in Figure 12, when the initial WIF length was greater than 114 m, the power index was larger than 1; thus, the propagation length of WIF was almost 40 m, indicating that WIF propagation became significant in the later stage of waterflooding. To avoid sudden water influx, the injection pressure should be reduced in the later stage of waterflooding.
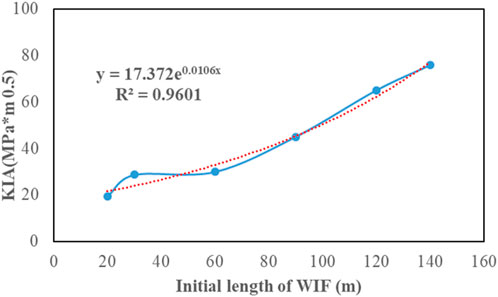
FIGURE 11. Variation of KIA at the fracture tip under different water injection fracture lengths.
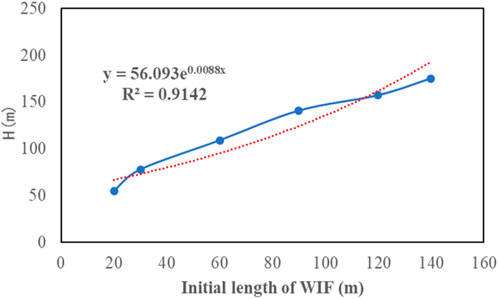
FIGURE 12. Fracture propagation lengths for the damage variable of 0.6.
The impacts of water saturation on sandstone properties, such as Young’s modulus and Poisson’s ratio, were investigated by laboratory experiments. Flow-geomechanics-coupled numerical simulations were performed to analyze the impacts of water flooding on stress distribution in a tight oil reservoir. Based on the fracture mechanics theory, the propagation length of the waterflood-induced fracture was calculated and the characteristics of waterflood-induced fracture propagation were analyzed. The main observations of this experiment are depicted below.
(1) The interaction between water and sandstones significantly affected the mechanical properties of sandstones. With the increase of water saturation, the Young’s modulus, tensile strength, and cohesion of sandstones decreased; however, the Poisson’s ratio increased. The alternation magnitude of Young’s modulus was the highest and reached 70%. These changes in mechanical properties resulted from the alternation of the microscopic structure of rocks. Therefore, the geomechanical damage of sandstones depended on their mechanical characteristics.
(2) The heterogeneity of mechanical properties was enhanced by waterflooding. After waterflooding, water saturation around the fracture increased sharply; however, water saturation in other areas increased slightly; thus, the water saturation distribution became more heterogeneous. The alternation magnitudes of mechanical properties (mechanical damage) depended on water saturation. Therefore, after waterflooding, the distributions of mechanical properties also became heterogeneous.
(3) The geomechanical damage induced by water enhanced the propagation of the waterflood-induced fracture. Numerical simulations revealed that when the geomechanical damage occurred, the stress around the fracture tip decreased greatly; thus, the stress intensity factor also increased, making fracture propagation easier. The critical damage factor that could significantly decrease the fracture propagation pressure was 0.5. The propagation length increased as the damage factor or the initial WIF length increased; hence, WIF propagation became more significant in the late stage of waterflooding. In this stage, the initial WIF length was large and the water saturation-induced geomechanical damage of rocks was high. Therefore, the injection pressure should be kept low during waterflooding to avoid fast fracture propagation.
The original contributions presented in the study are included in the article/Supplementary Material, further inquiries can be directed to the corresponding authors.
ZD: Writing–original draft, Formal Analysis. ZC: Writing–review and editing. CG: Investigation, Software, Writing–original draft. DJ: Conceptualization, Writing–review and editing. YP: Data curation, Software, Writing–review and editing. GZ: Formal Analysis, Methodology, Writing–review and editing. YH: Project administration, Supervision, Writing–review and editing. JZ: Resources, Validation, Writing–review and editing.
The author(s) declare financial support was received for the research, authorship, and/or publication of this article. This work is supported by the National Natural Science Foundations of China (No. U22B2075 and No. 52204053) and the China Postdoctoral Science Foundation (No. 2023M743922).
Author CG was employed by Piesat Information Technology Co Ltd. Author YH was employed by CNOOC Research Institute Ltd. Author JZ was employed by Daqing Oilfield Company.
The remaining authors declare that the research was conducted in the absence of any commercial or financial relationships that could be construed as a potential conflict of interest.
All claims expressed in this article are solely those of the authors and do not necessarily represent those of their affiliated organizations, or those of the publisher, the editors and the reviewers. Any product that may be evaluated in this article, or claim that may be made by its manufacturer, is not guaranteed or endorsed by the publisher.
Baker, R., Dieva, R., Jobling, R., and Lok, C. (2016). “The myths of waterfloods, EOR floods and how to optimize real injection schemes,” in SPE Improved Oil Recovery Conference, Tulsa, Oklahoma, USA, April, 2016.
Chai, M., Nourozieh, H., Chen, Z., and Yang, M. (2022a). A semi-compositional approach to model asphaltene precipitation and deposition in solvent-based bitumen recovery processes. Appl. Energy 328, 120197. doi:10.1016/j.apenergy.2022.120197
Chai, M., Yang, M., and Chen, Z. (2022b). Systematical study on dimethyl ether as a renewable solvent for warm VAPEX and its significant implications for the heavy oil industry. Fuel 312, 122911. doi:10.1016/j.fuel.2021.122911
Fan, T., Song, X., Wu, S., Li, Q., Wang, B., Li, X., et al. (2015). A mathematical model and numerical simulation of waterflood induced dynamic fractures of low permeability reservoirs. Pet. Explor. Dev. 42, 541–547. doi:10.1016/s1876-3804(15)30047-1
Wang, D., Li, Z., Zhao, J., He, Y., and Hao, F. (2007). Advance water-flooding theory for low-permeability reservoirs and its application. Acta Pet. Sin. 28 (6), 78–81. doi:10.3321/j.issn:0253-2697.2007.06.01.2007.2697.2007.06.015
Hagoort, J. (1981). Waterflood-induced hydraulic fracturing. Civ. Eng. Geosciences repository.tudelft.nl/assets/uuid:93b1fede-e03e-48d7-99c9
Jia, C., Zhao, Z., Du, J., Zhao, W. z., Zou, C. n., and Hu, S. y. (2008). PetroChina key exploration domains: geological cognition, core technology, exploration effect and exploration direction. Pet. Explor. Dev. 35, 385–396. doi:10.1016/s1876-3804(08)60087-7
Li, M., Guo, P. B., Stoll, D., Liu, S., and Li, L. (2012). Heterogeneous rock modeling method and characteristics of multistage hydraulic fracturing based on the phf-lsm method. J. Nat. Gas Sci. Eng. 83, 103518. doi:10.1016/j.jngse.2020.103518
Ling, S., Wu, X., Sun, C., Liao, X., Ren, Y., and Li, X. (2016). Experimental study of chemical damage and mechanical deterioration of black shale due to water-rock chemical action. J. Exp. Mech. 31 (4), 511–524. doi:10.7520/1001-4888-15-241
Liu, J., Wang, J., Chen, Z., Wang, S., Elsworth, D., and Jiang, Y. (2011). Impact of transition from local swelling to macro swelling on the evolution of coal permeability. Int. J. Coal Geol. 88, 31–40. doi:10.1016/j.coal.2011.07.008
Meng, M., Ge, H., Ji, W., Wang, X., and Chen, L. (2015). Investigation on the variation of shale permeability with spontaneous imbibition time: sandstones and volcanic rocks as comparative study. J. Nat. Gas Sci. Eng. 27, 1546–1554. doi:10.1016/j.jngse.2015.10.019
Qiangbo, Mi (2017). Mechanism and technology of fracture height control in low stress reservvoir of carbonate rocks. Chengdu, China: Cheng Du University of Technology.
Qu, H., Peng, Y., Pan, Z., Chen, Z., Zhou, F., and Zhang, K. (2019). A fully coupled simulation model for water spontaneous imbibition into brittle shale. J. Nat. Gas. Sci. Eng. 66, 293–305. doi:10.1016/j.jngse.2019.03.028
Shi, B., Xia, B., Lin, Y., and Xu, J. (2012). CT imaging and mechanicm analysis of crack development by hydration in hard-brittle shale formations. Acta pet. sin. 33 (1), 137–142. doi:10.7623/syxb201201020
Suarez-Rivera, R., Stenebr Ten, J., Gadde, P. B., and Sharma, M. M. (2002). An experimental investigation of fracture propagation during water injection. Int. Symposium Exhib. Form. Damage Control. doi:10.2118/73740-MS
Sui, W., Tian, Y., and Yao, C. (2018). Investigation of microscopic pore structure variations of shale due to hydration effects through SEM fixed-point observation experiments. Petroleum Explor. Dev. 45 (5), 955–962. doi:10.1016/s1876-3804(18)30099-5
Suri, A., and Sharma, M. (2007). “A model for water injection into frac-packed wells,” in SPE Annual Technical Conference and Exihibition Anahelm, California, USA, November, 2007.
Tian, Y., Uzun, O., Shen, Y., Lei, Z., and Wu, Y. S. (2020). “Feasibility study of gas injection in low permeability reservoirs of changqing oilfield,” in SPE Improved Oil Recovery Conference, Online Virtual, August, 2020.
Tian, Y., Xiong, Y., Wang, L., Lei, Z., Wu, Y. S., Yin, X., et al. (2019). A compositional model for gas injection ior/eor in tight oil reservoirs under coupled nanopore confinement and geomechanics effects. J. Nat. Gas Sci. Eng. 71, 102973. doi:10.1016/j.jngse.2019.102973
Ting, W. (2015). Research on waterflooding development mode of low permeability tight reservoir. Chengdu, China: Southwest Petroleum University.
Tong, X., Guo, J., and Wang, Z. (2014). The progress of geological and technology for unconventional oil and gas. Earth Sci. Front. 21.
Valès, F., Minh, D. N., Gharbi, H., and Rejeb, A. (2004). Experimental study of the influence of the degree of saturation on physical and mechanical properties in Tournemire shale (France). Appl. Clay Sci. 26 (1), 197–207. doi:10.1016/j.clay.2003.12.032
Wang, J. G., and Peng, Y. (2014). Numerical modeling for the combined effects of two-phase flow, deformation, gas diffusion and CO2 sorption on caprock sealing efficiency. J. Geochem. Explor. 144, 154–167. doi:10.1016/j.gexplo.2013.12.011
Wang, L., Tian, Y., Yu, X., Wang, C., Yao, B., Wang, S., et al. (2017a). Advances in improved/enhanced oil recovery technologies for tight and shale reservoirs. Fuel 210, 425–445. doi:10.1016/j.fuel.2017.08.095
Wang, X., Dang, H., and Gao, T. (2018). Method of moderate water injection and its application in ultra-low permeability oil reservoirs of Yanchang Oilfield, NW China. Pet. Explor. Dev. 45, 1094–1102. doi:10.1016/s1876-3804(18)30112-5
Wang, Y., Song, X., Tian, C., Shi, C., Li, J., Hui, G., et al. (2015). Dynamic fractures are an emerging new development geological attribute in water-flooding development of ultra-low permeability reservoirs. Shiyou Kantan Yu Kaifa/Petroleum Explor. Dev. 42, 247–253. doi:10.1016/s1876-3804(15)30012-4
Wang, Y. L., Zhuang, Z., Liu, Z. L., and Yang, H. L. (2017b). Finite element analysis of transversely isotropic rock with mechanical-chemical-damage coupling. Gongcheng Lixue/Engineering Mech. 34, 102–109. doi:10.6052/j.issn.1000-4750.2016.04.0287
Wen, H., Chen, M., Jin, Y., Zhang, Y., Ge, W., Du, J., et al. (2015). Water activity characteristics of deep brittle shale from Southwest China. Appl. Clay Sci. 108, 165–172. doi:10.1016/j.clay.2015.02.015
Yuan, W., Li, X., Pan, Z., Connell, L. D., Li, S., and He, J. (2014). Experimental investigation of interactions between water and a lower Silurian Chinese shale. Energy and Fuels 28 (8), 4925–4933. doi:10.1021/ef500915k
Zhang, C., Tian, Y., Shen, Y., Yao, B., and Wu, Y. (2020). Simulation study of water cut surge after CO2 injection in tight oil reservoirs. J. Petroleum Sci. Eng. 193, 107349. doi:10.1016/j.petrol.2020.107349
Zhu, W. C., and Wei, C. H. (2011). Numerical simulation on mining-induced water inrushes related to geologic structures using a damage-based hydromechanical model. Environ. Earth Sci. 62, 43–54. doi:10.1007/s12665-010-0494-6
Zhuang, X., Wang, W., Su, Y., Yan, B., Li, Y., Li, L., et al. (2023). Multi-objective optimization of reservoir development strategy with hybrid artificial intelligence method. Expert Syst. Appl. 241, 122707. doi:10.1016/j.eswa.2023.122707
Keywords: sudden water influx, deep tight oil reservoir, waterflood-induced fracture, geomechanical damage, stress intensity factor
Citation: Ding Z, Ge C, Chen Z, Ji D, Peng Y, Zhang G, Hou Y and Zhang J (2024) Impacts of geomechanical damage on waterflood-induced fracture propagation in deeply deposited tight oil reservoirs. Front. Energy Res. 12:1365649. doi: 10.3389/fenrg.2024.1365649
Received: 04 January 2024; Accepted: 25 January 2024;
Published: 23 February 2024.
Edited by:
Feng Dong, China University of Geosciences, ChinaReviewed by:
Maojie Chai, University of Calgary, CanadaCopyright © 2024 Ding, Ge, Chen, Ji, Peng, Zhang, Hou and Zhang. This is an open-access article distributed under the terms of the Creative Commons Attribution License (CC BY). The use, distribution or reproduction in other forums is permitted, provided the original author(s) and the copyright owner(s) are credited and that the original publication in this journal is cited, in accordance with accepted academic practice. No use, distribution or reproduction is permitted which does not comply with these terms.
*Correspondence: Dongqi Ji, ZG9uZ3FpLmppQHBldHJvY2hpbmEuY29tLmNu; Yanan Hou, aG91eW4yQGNub29jLmNvbS5jbg==
Disclaimer: All claims expressed in this article are solely those of the authors and do not necessarily represent those of their affiliated organizations, or those of the publisher, the editors and the reviewers. Any product that may be evaluated in this article or claim that may be made by its manufacturer is not guaranteed or endorsed by the publisher.
Research integrity at Frontiers
Learn more about the work of our research integrity team to safeguard the quality of each article we publish.