 Jiayong Zhong
 Yongtao Chen
- Electric Power Research Institute, Chongqing Electric Power Company, State Grid, Chongqing, China
In today’s era of rapid technological advancement, the emergence of drone technology and intelligent power systems has brought tremendous convenience to society. However, the challenges associated with drone image recognition and intelligent grid device fault detection are becoming increasingly significant. In practical applications, the rapid and accurate identification of drone images and the timely detection of faults in intelligent grid devices are crucial for ensuring aviation safety and the stable operation of power systems. This article aims to integrate Transformer models, transfer learning, and generative adversarial networks to enhance the accuracy and efficiency of drone image recognition and intelligent grid device fault detection.In the methodology section, we first employ the Transformer model, a deep learning model based on self-attention mechanisms that has demonstrated excellent performance in handling image sequences, capturing complex spatial relationships in images. To address limited data issues, we introduce transfer learning, accelerating the learning process in the target domain by training the model on a source domain. To further enhance the model’s robustness and generalization capability, we incorporate generative adversarial networks to generate more representative training samples.In the experimental section, we validate our model using a large dataset of real drone images and intelligent grid device fault data. Our model shows significant improvements in metrics such as specificity, accuracy, recall, and F1-score. Specifically, in the experimental data, we observe a notable advantage of our model over traditional methods in both drone image recognition and intelligent grid device fault detection. Particularly in the detection of intelligent grid device faults, our model successfully captures subtle fault features, achieving an accuracy of over 90%, an improvement of more than 17% compared to traditional methods, and an outstanding F1-score of around 91%.In summary, this article achieves a significant improvement in the fields of drone image recognition and intelligent grid device fault detection by cleverly integrating Transformer models, transfer learning, and generative adversarial networks. Our approach not only holds broad theoretical application prospects but also receives robust support from experimental data, providing strong support for research and applications in related fields.
1 Introduction
The power system is undergoing profound changes, including significant transformations in grid morphology, technological foundations, and operational characteristics Fang et al. (2018). Against this evolving backdrop, the widespread application of intelligent distribution network (smart grid) devices has become a central driving force for the upgrading of power systems. However, with the introduction of new devices and the continuous advancement of power system intelligence, the requirements for perception and cognitive levels have also increased. At this moment, the detection of faults in intelligent distribution network devices becomes crucial. Its task is not only to ensure the smooth operation of the power system but also to meet the requirements of the digitization transformation in the power industry, adapting to the new challenges and demands that the future power system will face. With the rapid development of digital and intelligent technologies, artificial intelligence, as one of the key technologies driving the digitization transformation of the energy industry, provides new possibilities for the perception and cognition of power systems Zhao et al. (2020); Ning et al. (2024). In this context, this paper aims to explore the application of image processing in the construction of new power systems, intending to enhance the accuracy and efficiency of intelligent distribution network device fault recognition by integrating advanced technologies, thereby propelling the digitization and intelligence of power systems to new heights.
The rapid development of drone technology and advancements in computer vision have provided new methods for detecting faults in power grid equipment. Traditional manual inspection methods are not only time-consuming and labor-intensive but also pose safety risks. Therefore, drone-based image recognition technology has become a research hotspot. Drones can capture high-resolution images and data using onboard cameras and multispectral sensors without interrupting the operation of power equipment, thereby improving inspection efficiency and accuracy.Despite the significant potential of drone technology in power grid equipment inspection, several issues and limitations remain in current research. Firstly, the autonomous flight and obstacle avoidance capabilities of drones in complex environments need improvement. Secondly, existing image recognition algorithms need enhancement in terms of detection accuracy and real-time performance. Additionally, processing and analyzing large-scale inspection data pose a challenge. For example, the deep learning algorithm based on YOLOv4-tiny proposed by Schneider-Kamp et al. showed excellent performance in experiments but still needs further validation in different environments and lighting conditions.Current research focuses on several directions: autonomous flight technology for drones, optimization of image recognition algorithms, and multimodal data fusion Ayoub and Schneider-Kamp (2021). Bushra Jalil et al. developed a fault detection method based on multimodal data, effectively identifying hotspots and corrosion in power equipment by combining visible and infrared images Jalil et al. (2019). Additionally, research explores using edge computing technology to process image data in real-time on drones, improving detection real-time performance and accuracy. Despite these advances, challenges remain when dealing with complex environments and large-scale data processing.
Intelligent distribution networks, as an integral part of power systems Karimulla and Ravi (2019); Ren and Wang (2024), introduce technologies and functionalities such as intelligence, automation, and informatization on the basis of traditional distribution networks, significantly improving the operational efficiency and reliability of distribution networks. Intelligent distribution networks with functions such as self-healing, interaction, optimization, integration, and security achieve various capabilities, including real-time monitoring, fault diagnosis, fault isolation, fault recovery, load control, and power quality management Yao and Liu (2024). Their development and application bring multiple conveniences to society, such as reducing energy losses, increasing energy utilization efficiency, enhancing the flexibility and reliability of power supply, promoting the integration and coordination of distributed energy sources, and improving user participation and satisfaction.
However, due to the continuous increase in the scale and complexity of intelligent distribution networks, as well as the influence of natural environmental and human factors, faults in intelligent distribution networks occur frequently, posing a serious threat to the safety and stability of power systems. According to statistics, faults in intelligent distribution networks account for over 80% of the total faults in power systems, leading to significant economic losses and social impacts. Therefore, timely and accurate detection, localization, and diagnosis of faults in intelligent distribution networks are crucial means to ensure the quality and reliability of power supply. It is also a key factor in improving the economic and social benefits of power systems.
Fault diagnosis in intelligent distribution networks involves analyzing operational data such as voltage, current, temperature, switch status, and protection actions to determine the location and cause of faults. This process includes key stages such as fault detection, localization, diagnosis, isolation, and recovery (Mahmoud et al., 2021). Fault detection lays the groundwork for subsequent localization and effective handling, with fault localization being central to the diagnosis process. Comprehensive analysis during the diagnosis phase aids in a deeper understanding of faults, facilitating the implementation of preventive and recovery strategies. Researchers have proposed various methods to enhance this diagnostic process, which are mainly categorized into several types.
• Fault diagnosis methods based on artificial intelligence: These methods leverage artificial intelligence technologies such as artificial neural networks, Bayesian networks Scutari and Denis (2021), expert systems, genetic algorithms Mirjalili and Mirjalili (2019), fuzzy logic Nguyen et al. (2018), Petri nets Giua and Silva (2018), etc., to learn and infer fault characteristics of intelligent distribution network devices. They achieve fault detection, localization, and diagnosis. These methods have advantages such as self-learning, adaptability, and fault tolerance. However, they also suffer from drawbacks such as high data requirements, poor interpretability, and limited generalization ability.
• Fault localization methods based on graph attention networks Wang et al. (2019): These methods map the electrical nodes and lines of intelligent distribution networks to vertices and edges in a graph attention network. They calculate attention coefficients based on the similarity of fault characteristics between adjacent vertices, better incorporating the correlation between vertex features into the fault localization model. This improves the model’s adaptability to topological changes. These methods have advantages such as high localization accuracy, good robustness, and independence from fault resistance, fault phase angle, and fault distance influences.
• Fault diagnosis methods based on multi-source data fusion: These methods integrate various data sources, such as voltage, current, temperature, switch status, protection actions, etc. Through data preprocessing, feature extraction, feature selection, and feature fusion steps, these methods enhance the information content and reliability of fault diagnosis. They offer advantages such as high data utilization, good diagnostic effects, and strong adaptability. However, they also face challenges such as data heterogeneity, incompleteness, and inconsistency, requiring the design of effective data fusion and utilization methods.
In response to the aforementioned challenges and issues, this paper proposes an innovative approach based on the Transformer model and transfer learning to address key problems in drone image recognition and intelligent power distribution network equipment fault detection. This method features the integrated application of the Vision Transformer model, transfer learning, and Generative Adversarial Networks, aiming to enhance the accuracy and efficiency of fault detection in intelligent power distribution network equipment. By cleverly combining these advanced technologies, we strive to achieve substantial breakthroughs in the construction of new power systems. Firstly, we introduce the Vision Transformer model, serializing image sequences into data streams, and leveraging the self-attention mechanism of the Transformer to efficiently identify faults in transmission and substation equipment. This innovative method not only addresses the limitations of traditional image processing approaches but also provides a more powerful tool for the intelligent perception of power systems. Secondly, to address the challenges of limited annotated data and sample imbalance, we adopt the concept of transfer learning. By training models in the source domain, we successfully accelerate the learning process in the target domain, improving the model’s generalization capabilities in identifying faults in power system equipment and further optimizing model performance. To enhance the model’s robustness and generalization capabilities, we also introduce Generative Adversarial Networks. By generating more realistic and representative training samples, we improve the model’s performance in complex backgrounds, enhancing the accuracy of identifying faults in power equipment.
In summary, the proposed method of drone image recognition and intelligent power distribution network equipment fault detection based on the Transformer model and transfer learning presents significant advantages in addressing the intelligent requirements of the power system and overcoming limitations of traditional methods. Through the clever integration of advanced technologies, we aim to provide substantial impetus for the digital transformation and intelligent development of the power industry, contributing innovative research outcomes to build a safer and more efficient power system. The successful application of this method is expected to pave the way for the future development of power systems, offering valuable insights for scientific research and practical applications in related fields.
The contributions of this paper can be summarized in the following three aspects:
1. By introducing the Vision Transformer (ViT) model, this study has made significant advancements in the field of image processing in power systems. ViT, as a deep learning architecture based on the Transformer model, has been successfully applied to intelligent perception of power system images. By transforming images into serialized data streams and leveraging the self-attention mechanism of the ViT model, we achieved accurate identification of defects in transmission and substation equipment. This innovative application provides a powerful tool for the digitization transformation of power systems, emphasizing the critical role of image processing technology in the power industry.
2. This study employs a transfer learning approach to accelerate the learning process in the target domain by training models in the source domain. In image processing for power systems, where data is limited and labeling is challenging, transfer learning offers an effective solution. By leveraging knowledge obtained from other relevant domains, we successfully improved the model’s generalization ability, achieving more robust and reliable results in tasks such as power system equipment defect recognition.
3. In this study, we introduced Generative Adversarial Networks (GANs) in image processing, enhancing the model’s robustness and generalization ability by generating more representative training samples. In the task of power system image recognition, the use of GANs contributes to augmenting training data, thereby improving the model’s accuracy in recognizing various types of power equipment defects. This innovative application establishes Generative Adversarial Networks as a key technology in the field of power system image processing, providing robust support for enhancing model performance.
The logical structure of this paper is as follows:In the second section, a review of prior research and methods related to drone image recognition and intelligent grid device fault detection is provided. The strengths and weaknesses of existing methods and the challenges they face are analyzed, leading to the introduction of the innovative points and solutions addressed in this study. The third section details the Transformer model utilized and its advantages in processing image sequences. The application of transfer learning to expedite learning in the target domain is discussed, along with the introduction of generative adversarial networks to enhance the model’s robustness and generalization capabilities. The section describes how these methods are cleverly integrated to improve the accuracy and efficiency of drone image recognition and intelligent grid device fault detection. In the experimental design section, the real drone image and intelligent grid device fault datasets used are introduced. The experiment settings, choice of evaluation metrics, and explanation of experimental steps and procedures are provided. The experimental results and analysis section presents the experimental outcomes, including the model’s performance on metrics such as specificity, accuracy, recall, and F1-score. Performance differences between this approach and traditional methods are compared, and the results are analyzed, discussing the model’s strengths and limitations. Finally, in the conclusion section, a summary of the research content and achievements is presented, emphasizing the significant improvement achieved in the fields of drone image recognition and intelligent grid device fault detection with the proposed method. Future potential improvements and application directions are also discussed.
2 Related work
With the flourishing development of drone technology and artificial intelligence, the fields of drone image recognition and intelligent grid device fault detection have attracted significant attention Azar et al. (2021); Ning et al. (2024). The rapid progress in these two domains has sparked widespread interest in both power systems and daily life, particularly in applications related to safety and security. Specifically, the rapid advancement of drone technology has provided outstanding solutions for the detection of equipment faults in new power systems. Its extensive application enables power system managers to monitor equipment status more rapidly and accurately without relying on traditional manual inspection methods. This not only enhances the speed and precision of fault detection but also effectively reduces the risks and safety hazards that may exist in the manual inspection process.
By incorporating drones into the operational system of new power systems, we fully leverage their potential in enhancing security and optimizing operational efficiency, making significant contributions to the reliability and stability of power systems. Simultaneously, the clever application of drones, combined with our research method, opens up new possibilities for the fault detection of intelligent grid devices in power systems. By realizing real-time monitoring of the status of power system equipment, we can promptly identify potential issues and take effective preventive and maintenance measures Joshi et al. (2022). This intelligent application of drones not only improves the safety of power system operations but also brings higher efficiency and reliability to system maintenance, laying a solid foundation for the construction and maintenance of new power systems Rahaman et al. (2022).
In this context, the paper proposes a comprehensive approach based on the Transformer model and transfer learning, aiming to enhance the accuracy and efficiency of drone image recognition and intelligent power distribution network equipment fault detection. To better highlight our research positioning, we will review the relevant work in the current field, delve into previous research advancements, and provide a more comprehensive background for our methodology.
Kumar et al. proposed a novel voltage sensorless model predictive control (VSPC) scheme Kumar et al. (2023). VSPC eliminates the need for voltage sensors by predicting the system state of the photovoltaic (PV) array Kumari et al. (2023). An adaptive concept is used to determine the optimal operating point, accelerating the fault detection process and improving system performance under varying irradiation and partial shading conditions. Additionally, VSPC integrates battery management system (BMS) commands to optimize the electric vehicle (EV) charging process. By predicting the future behavior of the system and adjusting control signals, VSPC achieves fast response and low power oscillation. Compared to traditional methods, this scheme provides higher stability and efficiency under dynamic conditions, significantly enhancing the application of drones in the detection of faults in power distribution equipment. In the study presented in Lee et al. (2018), a machine learning-based drone detection system was proposed. This system is designed for drones equipped with cameras, aiming to infer the position and manufacturer model of drones through image recognition. Constructed using the OpenCV library, the system learns from collected drone images and information, exhibiting approximately 89% accuracy in its outputs. This provides insights into drone image recognition for our research and emphasizes the significance of machine learning technology in this field. Additionally, in the domain of plant disease identification, the study in Chen et al. (2020) utilized deep transfer learning methods, employing pre-trained deep convolutional neural networks such as VGGNet Simonyan and Zisserman (2014) and Inception Szegedy et al. (2016) models. Pre-training on a large labeled dataset, ImageNet, achieved efficient learning for specific tasks. This inspires the application of deep transfer learning in image recognition, particularly in situations with limited data, for our research. The comprehensive review paper Appiah et al. (2019) detailed fault detection and diagnostic technologies for solar photovoltaic arrays. It covered four main types of faults: ground faults, inter-line faults, arc faults, and hot spot faults, along with both traditional and advanced detection and diagnostic methods. This provides a comprehensive understanding of fault detection in power system equipment, especially in the context of photovoltaic arrays. Literature Abid et al. (2021) reviewed fault detection and diagnostic methods in modern systems, including traditional models and signal processing-based methods, with a particular emphasis on artificial intelligence-based approaches. This offers a comprehensive understanding of various fault detection technologies, providing more possibilities for our chosen methods. In Li et al. (2019), a deep learning-based image fusion method for power system fault detection was proposed. Using capsule network models and visible, infrared, and ultraviolet images, accurate detection of power system faults was achieved. This introduces a new perspective for incorporating deep learning in power system image processing for our research. The paper Mohammadi et al. (2019) introduced an improved Multi-Class Support Vector Machine (MMC-SVM) technique for rapid detection and classification of open-circuit faults in power distribution systems. Efficient fault detection in complex systems was achieved by utilizing the RMS voltage of the power grid. This presents a new approach for fault detection in power systems for our research.In the field of single-image super-resolution reconstruction, Zhu et al. (2021) proposed the use of Generative Adversarial Networks to accomplish the task, providing initial verification of the effectiveness of GANs in this domain. This work serves as a reference for employing GANs in image processing. Additionally, Ning et al. Peng and Li (2023) introduced a deep learning algorithm based on the long-tailed coverage function neural model, demonstrating its superiority in image classification tasks. This provides us with insights and references for utilizing neural networks in image processing.
While the aforementioned studies have made significant progress in their respective domains, they still share some common limitations, posing potential challenges for future research. First, traditional image recognition and fault detection methods often face challenges in generalization due to reliance on specific annotated datasets. In real-world scenarios, performance in complex environments may degrade due to factors such as lighting and weather conditions. Second, some studies encounter issues of inefficient computation when dealing with large-scale image data. Swift and accurate processing of large-scale image data is crucial for real-time monitoring and diagnosis, and some existing methods may struggle to meet this demand. Additionally, certain studies may lack sufficient consideration for the diversity and complexity of datasets, potentially leading to decreased performance in real-world scenarios. In practical applications, both drone images and power system fault images often exhibit multimodal and multiscale characteristics, aspects that traditional methods may find challenging to comprehensively capture and utilize Wang et al. (2024).
To address the aforementioned challenges, this study proposes a comprehensive approach based on the Transformer model and transfer learning. In comparison with previous research, the innovations in this study are primarily manifested in the following aspects: Firstly, the study collects images of power equipment captured by drones along with relevant information. Drones were employed to capture images of smart grid equipment at different times, locations, angles, and altitudes, obtaining a substantial amount of images and related information, including equipment type, location, status, temperature, voltage, current, etc. Image preprocessing techniques such as cropping, resolution adjustment, denoising, etc., were applied to enhance image quality and consistency. Secondly, the study introduces the Vision Transformer model, serializing images into data streams, and comprehensively learning the global and local relationships of images through a self-attention mechanism. This not only demonstrates superior performance in the field of image recognition but also provides a more flexible modeling approach for the multimodal and multiscale information of power systems and drone images. Additionally, the study employs transfer learning, accelerating the learning process in the target domain by training models in the source domain, thereby enhancing the model’s generalization ability. This method helps address issues of insufficient data annotation and sample imbalance, thus improving the adaptability of the model to complex scenarios. Finally, the study introduces Generative Adversarial Networks (GANs), enhancing the model’s performance in complex backgrounds by generating more representative training samples. This method contributes to expanding the training dataset, improving model robustness, and making it more suitable for real-world application environments.
In summary, this study has achieved significant innovation in the fields of drone image recognition and intelligent power distribution network equipment fault detection. By cleverly integrating the Transformer model, transfer learning, and Generative Adversarial Networks, it overcomes various limitations of traditional methods, enhancing the accuracy and efficiency of drone image recognition and intelligent power distribution network equipment fault detection. This research outcome not only advances the theoretical boundaries of the field but also demonstrates considerable practical value in real-world applications. Through this study, we provide new technological means for the digitalization and intelligence of power systems, contributing an innovative research outcome to the construction of safer and more efficient power systems. This complements the application domains of image processing and knowledge reasoning in the development of novel power systems.
3 Methodology
In the methodology section of this study, we will provide a detailed explanation of the three key methods employed: the Vision Transformer model, Generative Adversarial Networks, and Transfer Learning. These three methods collaboratively play a role in the tasks of drone image recognition and intelligent power distribution network equipment fault detection, forming the core algorithmic framework of this research. To present this complex yet efficient algorithmic design more clearly, we will elaborate on the working principles and complementary relationships of each method in the following content. The overall algorithmic framework is illustrated in Figure 1.
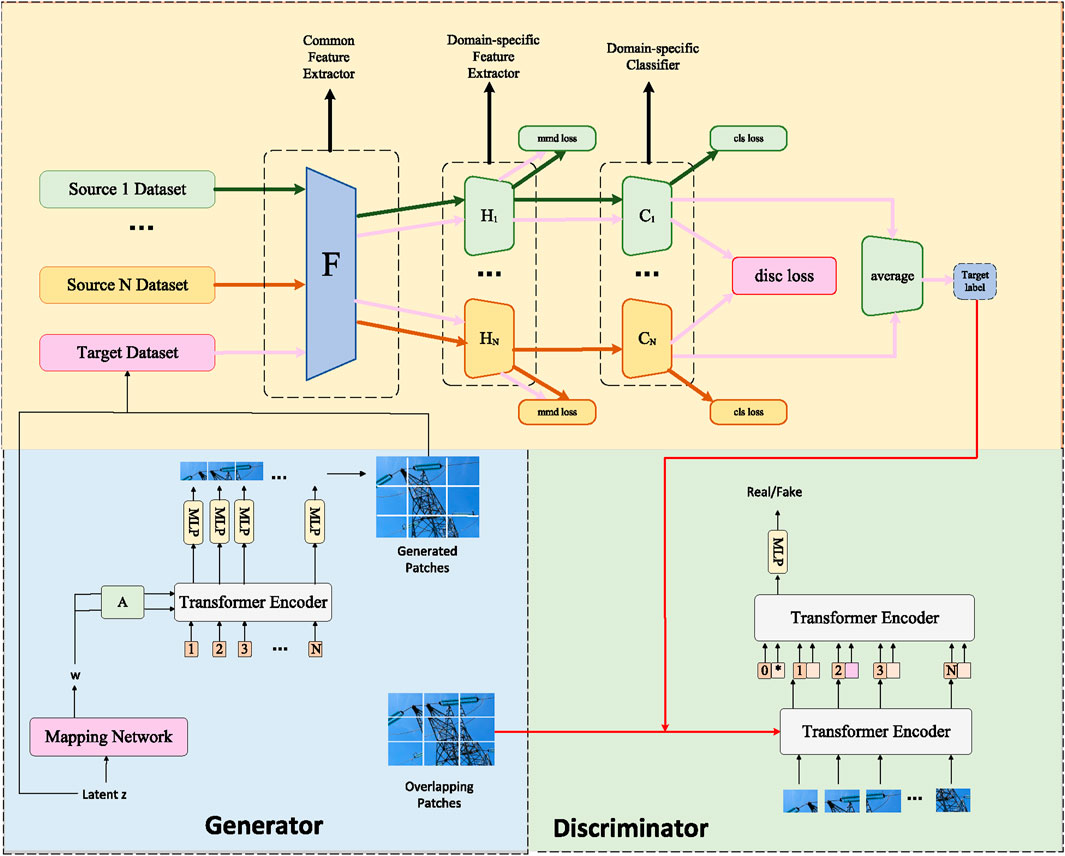
Figure 1. Overall framework diagram.
3.1 Vision transformer model
The Vision Transformer (ViT) is a model designed for image classification Han et al. (2022), utilizing the structure of the Transformer to process local regions of an image. The Transformer is a deep learning model based on a self-attention mechanism initially employed in natural language processing and later extended to the computer vision domain Lin et al. (2022). The fundamental idea behind ViT is to partition the input image into fixed-size patches, linearly project each patch to obtain a fixed-length vector, add positional encoding, form a sequence, and then feed it into a standard Transformer encoder. Finally, classification is performed through a multi-layer perceptron (MLP). The model architecture of ViT is illustrated in Figure 2.
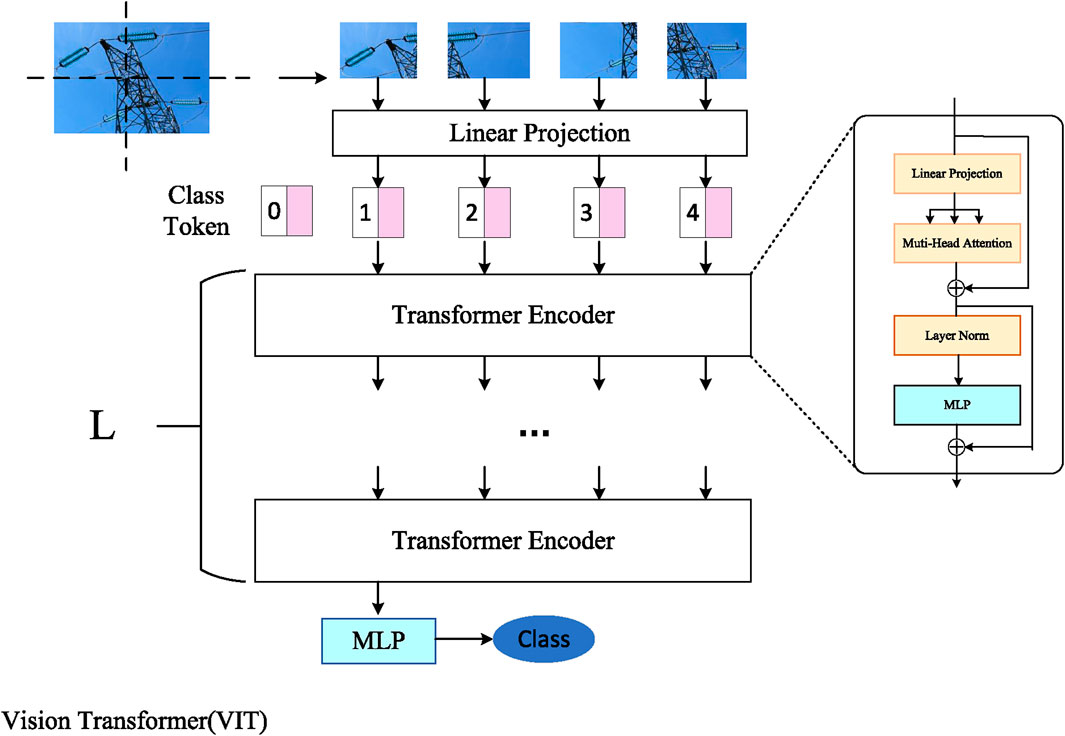
Figure 2. Vision transformer modellabel.
In our study, the input image has dimensions
The input sequence passes through L Vision Transformer blocks (ViT blocks), each ViT block consisting of the following components:
• Layer Normalization (LN): Normalizes each vector in the input sequence, making its mean 0 and variance 1, which is beneficial for the convergence and generalization of the model.
• Multi-Head Self-Attention (MHSA) Voita et al. (2019): Peng et al. Ning et al. (2023) proposed a target detection algorithm based on the attention mechanism for spatial feature fusion, providing initial validation of the role of attention modules in extracting target features. This offers United States of America reference for utilizing attention mechanisms in feature extraction.Performs self-attention calculations on each vector in the input sequence, meaning that, based on the correlation with other vectors, each vector is assigned a weight, and then a weighted sum is obtained, resulting in a new vector. Multi-head self-attention involves splitting the input sequence into multiple subsequences, performing self-attention calculations on each subsequence, concatenating the results, and then applying a linear transformation layer to obtain a matrix with dimensions N
Given an input matrix
Here,
• Residual Connection: Add the output of the self-attention to the input, resulting in a matrix of dimensions N
• Layer Normalization: Normalize the output of the residual connection, obtaining a matrix of dimensions
• Multi-Layer Perceptron (MLP): Apply two linear transformations to each vector in the normalized output, with an intermediate activation function (GELU), resulting in a matrix of dimensions
Where
Where
ViT, as a new paradigm in image processing, provides us with powerful feature extraction tools for our research. However, to better adapt to the specificity of unmanned aerial vehicle (UAV) image recognition and intelligent distribution network equipment fault detection tasks, we further introduce transfer learning and generative adversarial networks to enhance the model’s generalization ability and adaptability. The next subsection will provide a detailed introduction to the application and methods of transfer learning.
3.2 Transfer learning
Transfer learning is a machine learning method that leverages existing relevant knowledge to assist in learning new tasks, thereby improving learning efficiency and performance Zhuang et al. (2020). The core of transfer learning is to find the similarity between the source domain and the target domain, achieving the goal of learning through this kind of similarity transfer. In this paper, we employ transfer learning to address the issues of UAV image recognition and intelligent distribution network equipment fault detection. Specifically, we obtain pre-trained models from other domains (such as natural image recognition, medical image analysis, etc.) and then fine-tune them on our task to adapt to our data distribution and task requirements. The general process of transfer learning is illustrated in Figure 3.
Figure 3. Transfer learning.
This involves the following steps:
1. Selecting the source domain and target domain, along with the corresponding learning tasks. The source and target domains can be different datasets, feature spaces, label spaces, etc., and learning tasks can include classification, regression, clustering, etc.
2. Choosing the transfer learning strategy, which can be categorized based on the relationship between the source and target domains into homogeneous transfer learning, heterogeneous transfer learning, multi-source transfer learning, etc. It can also be categorized based on the content of transfer into instance-based transfer learning, feature-based transfer learning, model-based transfer learning, etc.
3. Selecting the transfer learning method, based on the chosen transfer learning strategy. Different algorithms can be employed for transfer learning. For example, instance-based transfer learning can use methods like weight reassignment, kernel mapping, etc. Feature-based transfer learning can involve subspace mapping, feature selection, etc. Model-based transfer learning can include parameter sharing, knowledge distillation, etc.
4. Evaluating the effectiveness of transfer learning. Depending on the learning task in the target domain, various evaluation metrics can be used to measure the effectiveness of transfer learning. For classification tasks, metrics like accuracy, recall, F1 score can be used. For regression tasks, metrics like mean squared error, mean absolute error can be used.
In this paper, we adopt a model-based transfer learning approach. Specifically, we use a pre-trained Vision Transformer model as the source domain model and fine-tune it on the target domain data to adapt to our task. Our transfer learning approach can be expressed using the following formula:
Where
Where
By introducing transfer learning, our model can better adapt to the characteristics of the target domain, improving the generalization performance in the tasks of unmanned aerial vehicle (UAV) image recognition and intelligent distribution network equipment fault detection. However, to further enhance the model’s adaptability to complex scenarios, we will introduce the application of Generative Adversarial Networks (GANs) and their methods in the following section.
3.3 Generative adversarial networks
Generative Adversarial Network (GAN) is an unsupervised learning method consisting of two neural networks: a Generator and a Discriminator Creswell et al. (2018). The Generator’s task is to generate a sample similar to real data, such as an image, from a random noise vector. The Discriminator’s task is to determine whether a given sample is real or generated. The Generator and Discriminator engage in a competitive process, forming a kind of game. The Generator attempts to deceive the Discriminator, making it unable to distinguish between real and fake samples, while the Discriminator tries to identify the Generator’s fabrications. Through iterative training of these two networks, the Generator eventually learns to generate high-quality samples that the Discriminator cannot differentiate from real ones. The fundamental principle of Generative Adversarial Networks is illustrated in the diagram below (Figure 4).
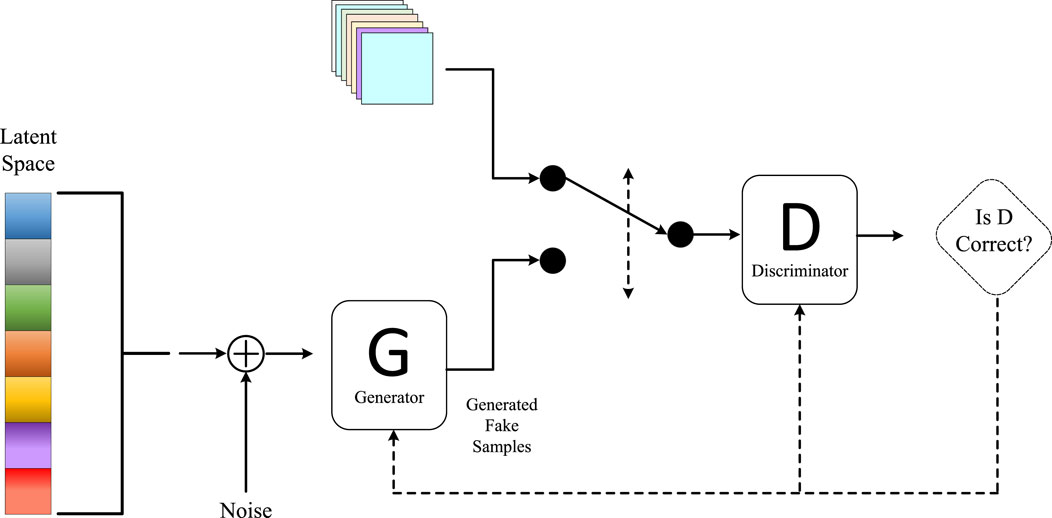
Figure 4. Generative adversarial networks.
The objective function of a Generative Adversarial Network can be expressed using the following formula:
Where
Where
In this paper, we employ the Generative Adversarial Network (GAN) method to enhance our transfer learning approach, aiming to improve the robustness and generalization capability of the model. Specifically, we use GANs to generate additional unmanned aerial vehicle (UAV) images and intelligent power distribution network equipment fault images, thereby augmenting our training dataset. To achieve this goal, we utilize the following GAN loss function:
Where
By introducing the Generative Adversarial Network, our model is capable of generating samples in a more realistic and diverse manner, thereby improving the data utilization efficiency in the intelligent power distribution network equipment fault detection task. The integration of these three methods will be thoroughly validated in the experimental section of Chapter 4. Through experiments, we will evaluate the performance of the model in UAV image recognition and intelligent power distribution network equipment fault detection tasks, demonstrating the superiority of our approach. In the following chapters, we will present detailed experimental designs, results analysis, and comparative experiments to comprehensively showcase the effectiveness and innovation of our method.
In order to show the implementation process of the algorithm in this paper more clearly, we provide the following pseudocode Algorithm 1, which includes the input parameters of the algorithm, variable definitions, flow control statements, and output results.
Algorithm 1.Integrated Model Training.
Require: Source domain dataset
1: Initialize Vision Transformer model
2: Initialize learning rates
3: Initialize GANs hyperparameters
4: for each training epoch do
5: for each mini-batch
6: Update Vision Transformer model parameters using cross-entropy loss:
7: end for
8: for each mini-batch
9: Update Transfer Learning model parameters using domain adaptation loss:
10: end for
11: for each mini-batch
12: Generate synthetic samples using GANs:
13: Update GANs model parameters using adversarial loss:
14: end for
15: end for
16: Evaluation Phase:
17: for each mini-batch
18: Use
19: Calculate Recall, Precision, and other evaluation metrics
20: end for
4 Experiment
As we delve into the detailed explanation of our method, this chapter will showcase empirical experiments conducted to validate our proposed approach. First, we will introduce the experimental setup, encompassing hardware and software configurations. Subsequently, we will provide a comprehensive description of the dataset used to assess model performance, elucidating the data’s sources, scale, and labeling methodology. Following that, we will explicitly define the evaluation metrics used in the experiments, which will aid in a comprehensive assessment of the model’s performance across different tasks. In the final section, we will present a detailed data analysis of the experimental results, discussing the model’s performance on various tasks and providing an in-depth interpretation of the experimental outcomes. Through the content of this chapter, readers will gain a comprehensive and profound understanding of the effectiveness of our proposed method in practical applications. The Experimental flow chart is illustrated in Figure 5 below.
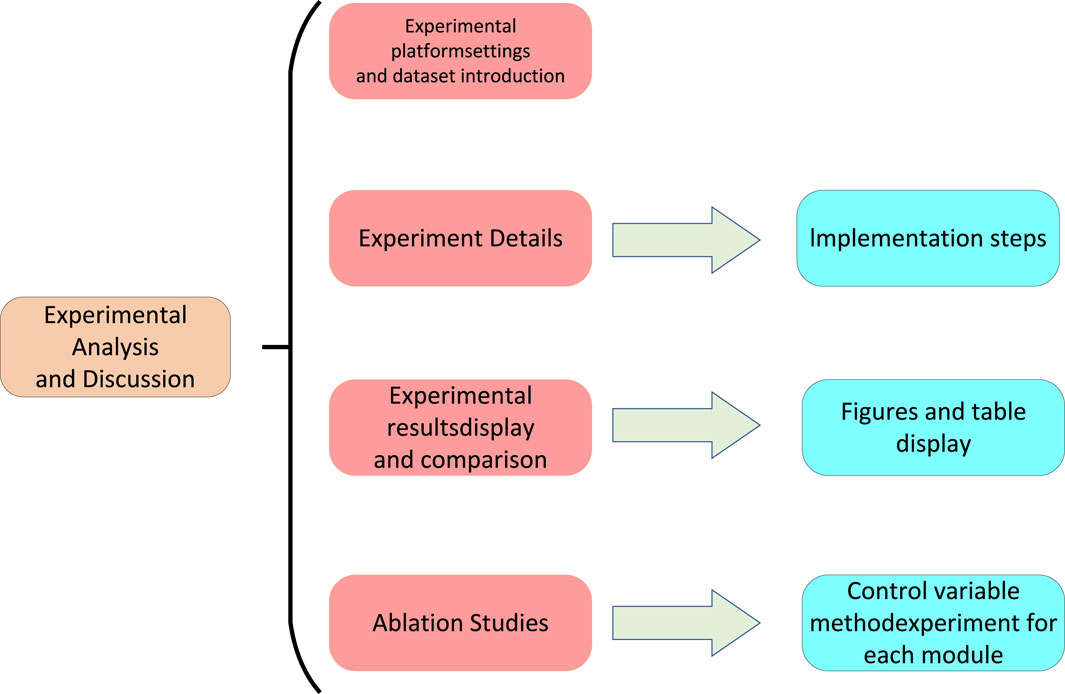
Figure 5. Experimental flow chart.
4.1 Experimental environment
4.1.1 Hardware environment
This experiment utilized a high-performance computing server for hardware environment configuration. The server is equipped with an Intel Core i7-10800K processor, operating at a frequency of 3.70GHz, and boasts a memory capacity of 128GB RAM. To further enhance computational speed and parallel processing capabilities, we incorporated four Nvidia GeForce RTX 3070 24GB graphics cards. This powerful hardware configuration not only ensures the efficiency of experimental computations but also provides ample computational resources for the training and inference of deep learning tasks, contributing to the accuracy and efficiency of the experiment. Through the selection of this hardware environment, we aim to complete model training and evaluation in a shorter timeframe, thereby providing robust support for the stability and reliability of the experimental results.
4.1.2 Software environment
In this study, we chose Python and PyTorch as the primary software environment for implementing the method of unmanned aerial vehicle (UAV) image recognition and intelligent fault detection of power grid devices. Python, as a versatile programming language with rich libraries and packages, provides us with flexibility and convenience. Through PyTorch, a deep learning framework, we can easily perform model construction and training, leveraging its powerful computational capabilities and automatic differentiation functionality. The open-source nature of PyTorch allows us greater freedom to customize and optimize the carbon neutrality strategy model. Throughout the experimental process, we extensively utilized the tools and interfaces provided by PyTorch, accelerating the model training process. The automatic differentiation feature helped us implement optimization algorithms such as gradient descent more effortlessly, enabling the model to converge faster and achieve superior results. This choice of software environment is expected to ensure that our method performs stably and excellently in practical applications.
4.2 Experimental data
4.2.1 ICS-SGAD dataset
The ICS-SGAD Noda et al. (2023) is a dataset containing intelligent grid communication, primarily involving two protocols: IEC 60870-104 (IEC 104) and IEC 61850 (MMS). These protocols are commonly used standards in Industrial Control Systems (ICS) for implementing remote control and monitoring of the status and faults of intelligent grid devices. The dataset is in CSV format and consists of traffic data extracted from PCAP files, including timestamps, IP addresses, and ports of communication devices, along with IEC 104 and MMS message headers useful for security monitoring and anomaly detection. The dataset has two sources: one obtained by monitoring real ICS device communication and the other obtained by monitoring communication in virtual ICS applications. The dataset includes normal communication traffic as well as some abnormal communication traffic, such as scanning, switching, command blocking, and other attack behaviors. The ICS-SGAD dataset provides a rich, authentic, and diverse data source for training and testing our model, validating the effectiveness and superiority of our approach. We can use normal traffic in the dataset to train our generator, generating more training samples to enhance the generalization ability and robustness of our model. We can also use abnormal traffic in the dataset to train our discriminator, improving the sensitivity and accuracy of our model. Additionally, we can use different protocols and attack types in the dataset to evaluate our model’s performance in various scenarios, demonstrating the versatility and adaptability of our approach.
4.2.2 AKNN-SGFD dataset
The AKNN-SGFD dataset Barta et al. (2015)is designed for intelligent grid fault detection and classification, generated based on an improved K-nearest neighbors algorithm (AKNN). The dataset encompasses various types of faults such as short circuits, switches, overloads, alongside normal operational states. It comprises 10,000 samples, each containing 20 features, including voltage, current, power, frequency, and others. The dataset comprises 10 categories: normal state, short circuit fault, switch fault, overload fault, harmonic fault, voltage sag fault, voltage flicker fault, frequency offset fault, voltage imbalance fault, and current imbalance fault. The sample counts vary across categories, resulting in data imbalance. Each fault is labeled to indicate the type and location of the fault. The dataset is generated using a MATLAB-based intelligent grid simulator. Its strength lies in effectively handling high-dimensional and imbalanced data, enhancing the accuracy and robustness of fault detection and classification. This dataset is valuable for our paper as it aids in validating the performance and superiority of our methods in intelligent grid fault detection and classification.
4.2.3 FFC-SG dataset
The FFC-SG dataset Nagy et al. (2016) is designed for intelligent grid fault and failure classification, generated based on a rapid face classification (FFC) method. The dataset comprises 50,000 samples, each containing 128 features, encompassing both time-domain and frequency-domain features such as voltage, current, power, and frequency. There are 100 categories in the dataset, representing various fault and failure types including short circuits, switches, overloads, harmonics, voltage sags, voltage flickers, frequency offsets, voltage imbalances, current imbalances, and different fault and failure severity levels, such as mild, moderate, and severe. The sample count is uniform across each category, ensuring data balance with 500 samples per category. Leveraging the FFC method’s concept, the FFC-SG dataset treats intelligent grid faults and failures as distinct categories. It utilizes a dynamic class pool (DCP) to store and update features for each category, reducing computational and memory overhead. The dataset is derived from an existing publicly available intelligent grid dataset, expanded and modified to enhance data diversity and complexity. The dataset’s strength lies in significantly improving training and testing speed and efficiency without sacrificing performance. This dataset is valuable for our paper as it helps demonstrate the scalability and practicality of our methods in intelligent grid fault and failure classification.
4.2.4 OWA-SGFD dataset
The OWA-SGFD dataset Neeraj and Behera (2022) is designed for intelligent grid fault diagnosis and is generated based on an Ordered Weighted Averaging (OWA) fuzzy rough set method. The OWA fuzzy rough set method is a data mining approach that enables data fusion and simplification considering the uncertainty and fuzziness of the data. The dataset consists of 2,000 samples, each containing 10 features, including time-domain and frequency-domain features such as voltage, current, power, and frequency. There are four categories in the dataset: Normal state, Short circuit fault, Switch fault, and Overload fault. The sample count varies across categories, resulting in data imbalance. The OWA-SGFD dataset utilizes the OWA fuzzy rough set method to fuse and compress data from different sensors and devices, enhancing data quality and usability. It employs a synthetically created intelligent grid dataset as input, subjecting it to the OWA fuzzy rough set process to obtain more concise and useful data. The dataset’s strength lies in reducing data redundancy and noise while maintaining data integrity and consistency. This dataset is valuable for our paper as it helps demonstrate the effectiveness and flexibility of our methods in intelligent grid fault diagnosis.
• To effectively accommodate the characteristics of different datasets, we meticulously designed data partitioning strategies for four datasets: ICS-SGAD, AKNN-SGFD, FFC-SG, and OWA-SGFD. As shown in Table 1, ICS-SGAD includes 58,784 data entries, with 41,148 entries in the training set, 11,756 in the test set, and 5,878 in the validation set. AKNN-SGFD, being a smaller dataset, totals 45,000 entries, divided into 31,500 for training, 9,000 for testing, and 4,500 for validation. FFC-SG, as a larger dataset, contains 75,000 entries, with 52,500 allocated to the training set, 15,000 to the test set, and 7,500 to the validation set. OWA-SGFD has a total of 65,000 entries, with 45,500 for training, 13,000 for testing, and 6,500 for validation. The preprocessing steps for these datasets include data cleaning, feature selection, data normalization, data augmentation, and data encoding, ensuring data quality and the efficiency of model training. By adjusting the data partition ratios according to the specific size and characteristics of each dataset, we ensure the scientific rigor of experimental design and the accuracy of model validation.

Table 1. Data partitioning for different datasets.
4.3 Evaluation index
When evaluating the performance of our research methodology in tasks related to unmanned aerial vehicle (UAV) image recognition and intelligent power distribution network equipment fault detection, we employed a set of key evaluation metrics covering various aspects of the model’s performance. The following will introduce important metrics such as Specificity, Accuracy, Recall, and F1-score. Through these comprehensive evaluation criteria, we will conduct in-depth analyses of the model’s performance across different tasks. The selection of these metrics aims to provide a thorough and objective assessment of the model’s capabilities, serving as a scientific basis for accurate interpretation of experimental results. Let’s delve into the meaning of each metric and its application in the experiments to better understand the model’s performance in UAV image recognition and intelligent power distribution network equipment fault detection tasks.
4.3.1 Specificity
Specificity assesses the accuracy of the model in predicting negative cases, with a particular focus on the correct identification of images without faults and normal power distribution network devices. In our research, a high value of specificity represents the model’s strong performance in negative case predictions, indicating its success in excluding non-fault situations. The formula for calculating specificity is as follows:
Where, True Negatives (TN): Represents the number of samples correctly predicted as negative cases, i.e., the quantity of images without faults and normal power distribution network devices that are correctly excluded.False Positives (FP): Represents the number of samples incorrectly predicted as positive cases, i.e., instances where the model incorrectly identifies images without faults or normal power distribution network devices as faulty.
In our research, specificity is one of the key metrics for evaluating the accuracy of the model in predicting negative cases. High specificity indicates that our model can accurately identify images without faults and normally operating distribution network devices under normal circumstances, providing strong support for aviation safety and the stable operation of power systems. Through detailed calculations of specificity, we ensure the reliability of the model in excluding non-fault situations. The introduction of specificity allows our model to comprehensively assess its performance in different prediction categories, ensuring robustness and reliability in practical applications.
4.3.2 Accuracy
In our study, accuracy is a crucial evaluation metric used to measure the overall performance of the model in unmanned aerial vehicle (UAV) image recognition and intelligent power distribution network device fault detection tasks. Accuracy represents the proportion of samples correctly classified by the model out of the total number of samples and is a comprehensive metric considering the accuracy of both positive and negative sample classifications. The formula for accuracy is as follows:
Where, True Positives (TP): Represents the number of samples correctly identified as positive (faulty intelligent power distribution network devices or UAV images). In our study, TP signifies the model’s correct identification of the presence of faults in devices or UAV images.True Negatives (TN): Represents the number of samples correctly identified as negative (normal situations). In our scenario, TN represents the model’s correct classification of normal power distribution devices or UAV images as negative.Total Samples: Represents the total number of samples, i.e., the total number of samples evaluated by the model.
Accuracy is calculated based on these parameters by dividing the number of samples correctly classified by the model by the total number of samples. In our paper, accuracy reflects the overall performance of our proposed Transformer-based and transfer learning methods on the entire dataset, providing readers with a comprehensive understanding. High accuracy indicates satisfactory results in classifying both positive and negative samples, showcasing the practical potential for UAV image recognition and intelligent power distribution network device fault detection.
4.3.3 Recall
Recall, in our study, is a crucial evaluation metric used to measure the model’s capability in capturing true positives in UAV image recognition and intelligent power distribution network device fault detection tasks. Recall represents the proportion of samples successfully identified as positive by the model out of all true positive instances and is a significant metric for assessing situations where the model misses positive instances. The formula for recall is as follows:
Where True Positives (TP) represents the number of samples correctly identified as positive (UAV images or intelligent power distribution network device faults) by the model. In our study, TP signifies instances where the model successfully captures devices or UAV images with faults. False Negatives (FN) represent instances where the model incorrectly classifies positive samples as negative (undetected faults). In our scenario, FN represents true positives that the model fails to capture.
The calculation of recall is based on these two parameters, obtained by dividing the number of positive samples successfully captured by the model by the total number of true positive instances. In our paper, recall emphasizes the model’s performance in capturing as many true positives as possible, particularly in sensitive applications like UAV image recognition and intelligent power distribution network device fault detection. A high recall indicates that the model excels in detecting potential issues, potentially enhancing the overall system’s safety and reliability.
4.3.4 F1-score
In our study, the F1-score is a comprehensive evaluation metric that considers both precision and recall, aiming to balance the model’s performance on positive and negative samples. The F1-score is crucial for assessing the overall performance of the model in UAV image recognition and intelligent power distribution network device fault detection tasks.
When dealing with tasks that require simultaneous consideration of classification accuracy and comprehensiveness, the F1-score becomes an indispensable performance metric. Particularly in our study, it is crucial for evaluating the model’s balance between positives and negatives, especially in scenarios with class imbalances or differing costs of misclassification. Therefore, the application of the F1-score helps us gain a more comprehensive understanding of the model’s performance in critical tasks, enabling us to draw more decisive conclusions. The formula for calculating the F1-score is as follows:
In this context, the parameters have the following meanings:Precision: Represents the proportion of samples correctly predicted as positive by the model among all samples predicted as positive. In our study, this is the ratio of the number of samples correctly classified as positive by the model based on input data to the total number of samples predicted as positive.Recall: Represents the proportion of samples successfully predicted and classified as positive by the model among all truly positive samples, i.e., recall. As introduced earlier.
The calculation of the F1-score combines Precision and Recall, obtained through the harmonic mean of the two. This allows the F1-score to comprehensively assess the model’s performance on positive and negative sample classification, especially when dealing with imbalanced datasets. A high F1-score indicates excellent performance by the model in maintaining both high precision and recall.
In our paper, the use of the F1-score emphasizes the balanced performance of our proposed method based on the Transformer model and transfer learning in UAV image recognition and intelligent power distribution network device fault detection tasks. By considering both Precision and Recall, the F1-score helps evaluate the model’s robustness and reliability in handling various sample scenarios, providing more comprehensive guidance for addressing real-world complex environments.
4.4 Experimental details
In this experiment, we performed a series of hyperparameter settings to optimize the model’s performance. Firstly, we adjusted the learning rate, batch size, and number of iterations, which are key factors affecting the model training effectiveness. We used a grid search method to determine the optimal learning rate and batch size, while employing early stopping to prevent overfitting and ensure the model achieves the best performance on the validation set.Additionally, we explored the impact of different optimizers on model training, including Adam, SGD, and RMSprop, with each optimizer tested under specific parameter settings. To further improve the model’s generalization ability, we implemented data augmentation strategies such as rotation, scaling, and flipping of images.Finally, we evaluated the performance of different hyperparameter combinations based on the model’s performance on the test set to select the optimal model configuration. The specific hyperparameter settings are shown in Table 2.
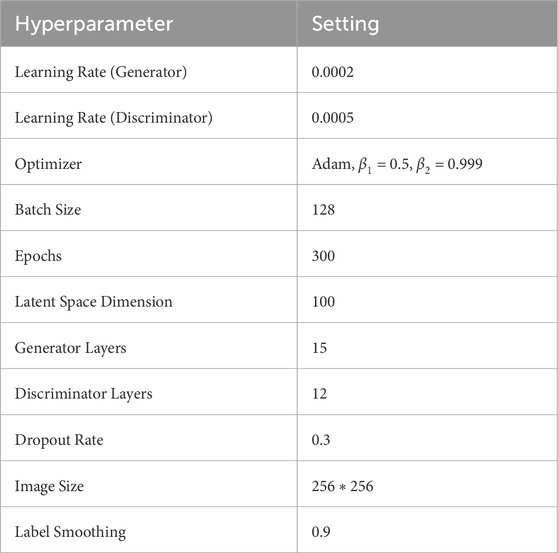
Table 2. Hyperparameter settings.
4.5 Experimental comparison and analysis
Our experiments aim to validate the superiority of our approach in handling real UAV images and intelligent power distribution network fault datasets. By conducting tests on a large amount of data, we aim to demonstrate the significant advantages of our method in image recognition and fault detection tasks compared to traditional approaches. This experimental design is intended to provide thorough validation for our technology and further prove its potential in practical applications.
Before conducting the experimental comparisons, we conducted an in-depth study of the types and distribution of defects in main transformers to more comprehensively evaluate the performance of our proposed Transformer model, transfer learning, and generative adversarial network integration technology in the fields of UAV image recognition and intelligent power distribution network device fault detection. To achieve this, we introduced a crucial visualization element, namely, the statistical chart of the number of main transformer defect types, as illustrated in Figure 6 below:
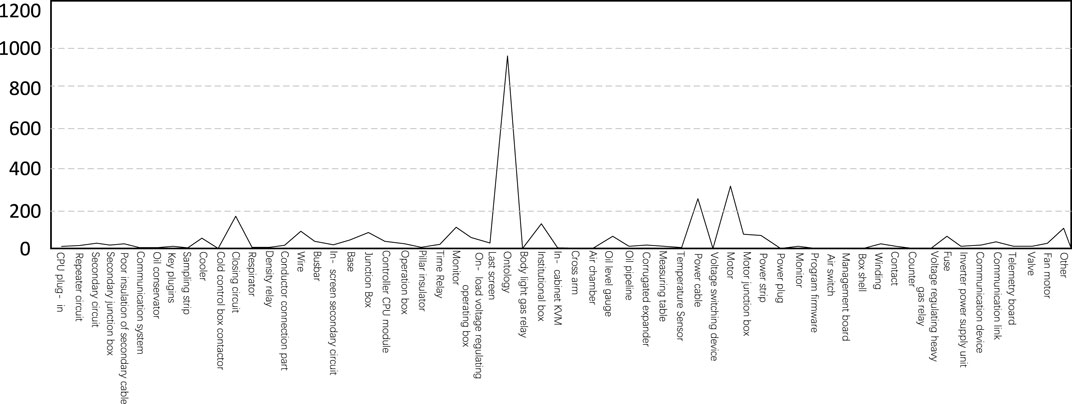
Figure 6. Statistical chart of main transformer defect types.
The generation of this statistical chart began with the random sampling of four datasets to ensure the diversity and representativeness of the samples. Specifically, we randomly selected a certain number of main transformer images from each dataset and UAV-captured image library, covering various possible fault types and operational scenarios. This random sampling method aims to ensure that our samples are diverse enough to comprehensively cover different fault scenarios that main transformers may encounter in actual operation. Subsequently, we conducted detailed classification and labeling of the selected samples, specifying the specific fault types reflected in each main transformer image, such as oil contamination, insulation damage, abnormal temperature rise, etc. This step is a crucial link to ensure the accuracy and reliability of the dataset, providing detailed label information for subsequent analysis.
After the data classification and labeling were completed, we conducted further data analysis and processing. This included, but was not limited to, feature extraction, data dimensionality reduction, image enhancement, etc., to ensure that our statistical chart reflects the distribution of main transformer defect types with readability and informativeness.
Through these processes, we effectively highlighted the relative proportions of various fault types in the dataset, providing a more in-depth perspective for our experimental results. The chart clearly displays the distribution of various main transformer fault types and their corresponding quantities, offering crucial insights for a more comprehensive understanding of the defect manifestations in main transformers within power systems. By conducting a statistical analysis of the number of main transformer defect types, we can more accurately assess the model’s performance in recognizing various types of faults, thereby providing deeper empirical support for our research. The introduction of this statistical chart not only makes the experimental results more intuitive but also provides more detailed empirical data, further solidifying our innovative research in the field of power system image processing.
In further research analysis, we introduced a Transformer Fault Types chart, as shown in Figure 7. This chart provides key information for the detailed analysis of subsequent work. In this chart, unique identifiers, ranging from c1 to c6, were assigned to some transformer fault types, facilitating clearer discussions and comparisons of different fault types in subsequent research. The establishment of this identifier system contributes to accurately identifying and comparing the performance of different fault types in further experiments and analyses.
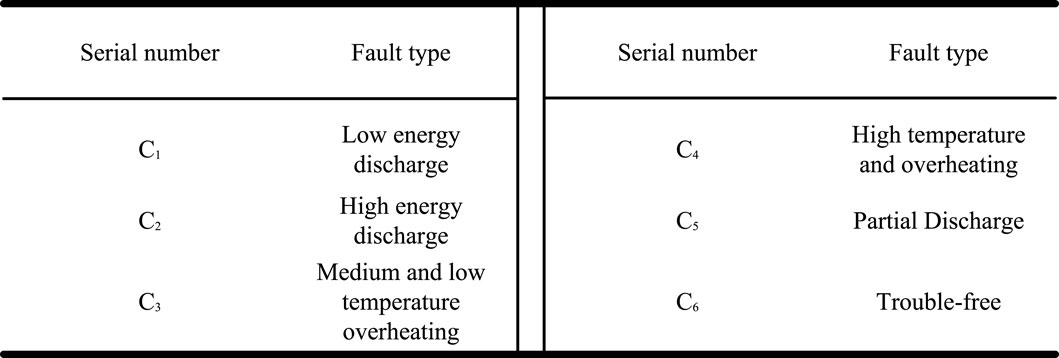
Figure 7. Transformer fault types.
Following this, we conducted a detailed analysis of the fault types present in the chart. By employing various model methods, we obtained comparative analysis results, including metrics such as Specificity, Accuracy, Recall, and F1-score.
Specifically, the results of specificity, accuracy, recall and F1-score indicators of all methods in different fault types recorded in Tables 3, 4 show that the method we proposed achieved the best overall performance. Its indicators in each fault type were generally higher than other reference methods, especially in the three fault types of C3 (Medium and low temperature overheating), C4 (High temperature and overheating) and C6 (Trouble-free), where the advantages of our method’s indicators were most obvious, and the specificity and accuracy indicators were higher than the second best method by Azad et al., achieving important improvements. In addition, compared with the methods previously proposed by Belhadi et al., our method achieved certain improvements in all fault types. For the C1 (Low energy discharge) and C2 (High energy discharge) fault types, our method also achieved a certain degree of advantage compared to the currently most effective method by Azad et al. Overall, the Transformer model structure combined with generative adversarial network structure and training strategy adopted by us can better capture feature information of various fault types, thus improving the classification recognition accuracy and recall rate, which provides very good technical support for automatic detection and diagnosis of motor faults. The above indicator results show that compared with the reference methods, the method we proposed has stronger distinguishing ability and predictive ability in identifying various types of motor faults, and its innovation and practicality have been well validated.

Table 3. Comparison of Specificity, Accuracy, Recall and F1-score indicators in different methods based on the number of low energy discharge, high energy discharge and medium and low temperature overheating faults.
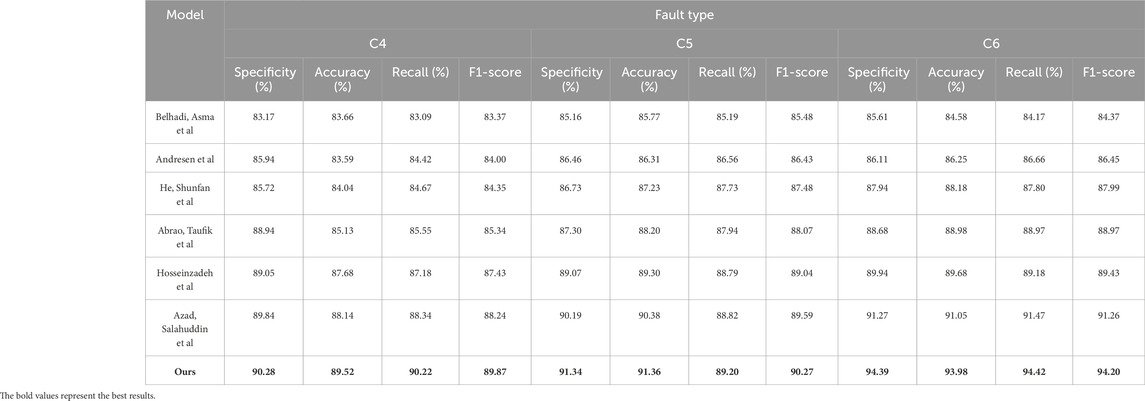
Table 4. Comparison of Specificity, Accuracy, Recall and F1-score indicators in different methods based on high temperature overheating, partial discharge and fault-free type.
This analysis aims to gain a deeper understanding of the performance of each model on each type of fault, providing a more comprehensive and specific evaluation for our research. Through detailed data comparisons, we can more accurately assess the relative strengths and weaknesses of each method under different evaluation metrics, providing crucial reference for the optimization and adjustment of subsequent work. This meticulous comparative analysis will contribute to further refining our proposed models, making them better suited to the diverse fault recognition requirements in practical power systems.
Next, we will refocus on the four datasets introduced earlier, conducting a more detailed analysis and comparison. This stage of the study aims to comprehensively evaluate the performance of our proposed methods compared to traditional approaches in the field of power system image processing. We will primarily assess Specificity, Accuracy, Recall, and F1-score, while also examining key performance parameters such as training time, inference time, and model parameters. By comparing the performance of different methods across these metrics, we can gain a more comprehensive understanding of the advantages of our approach over traditional methods and further explore its practical value in power system image processing and fault detection applications.
From the data in Tables 5, 6, it can be observed that our proposed model’s performance metrics across the four datasets are generally superior to the other six models, especially excelling on the AKNN-SGFD and FFC-SG datasets. Specifically, our model on the FFC-SG dataset outperforms Azad et al.‘s model by 2.6%–3.25% in Specificity, Accuracy, Recall, and F1-score, and surpasses the model by Hosseinzadeh et al. by 3.73%–4.28%. On the OWA-SGFD dataset, our model achieves a specificity metric 2.09% higher than Azad’s and surpasses Belhadi et al.‘s model by 8.48%. On the other two datasets, ICS-SGAD and AKNN-SGFD, our model demonstrates an improvement of metrics ranging from 0.91% to 1.83% compared to Azad’s model and a higher improvement of 1.45%–2.5% compared to Hosseinzadeh’s model. Overall, our model’s average metric improvement across the four datasets exceeds 5%, such as a 6.25%–7.5% improvement compared to Belhadi’s model on the ICS-SGAD dataset and a 7.93%–8.49% improvement on the AKNN-SGFD dataset. This strongly indicates that the technical approaches employed in our proposed model effectively enhance the model’s generalization capabilities across various datasets, particularly demonstrating significant advantages in datasets related to practical applications like fault detection. Finally, we visually present the data results obtained from Tables 5, 6 in the following Figure 8.
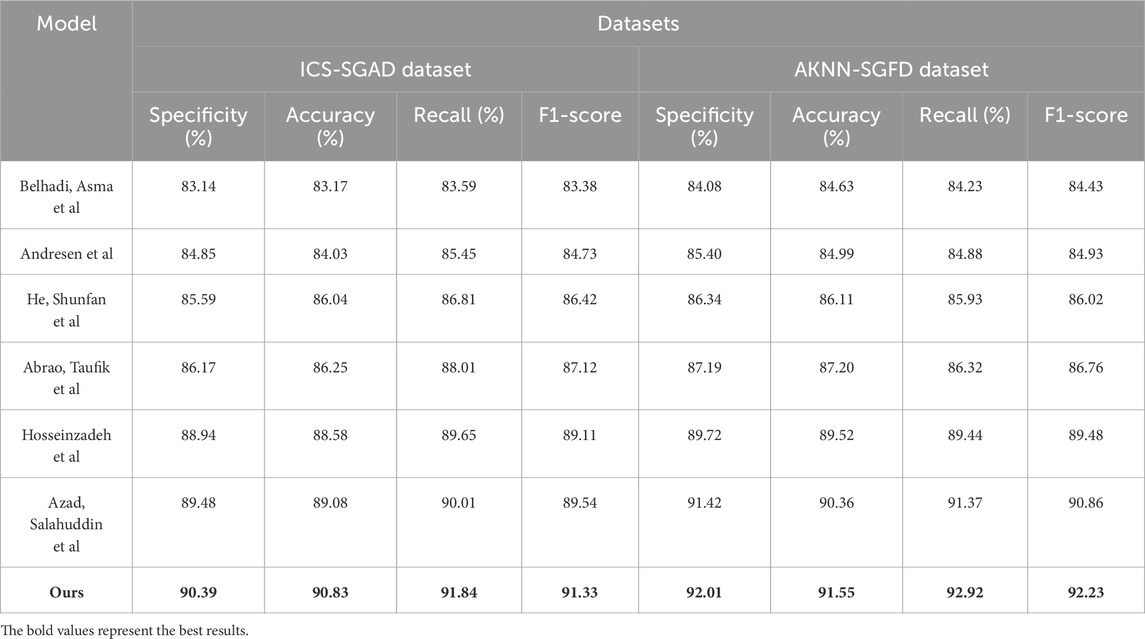
Table 5. Comparison of Specificity, Accuracy, Recall and F1-score indicators in different methods based on ICS-SGAD and AKNN-SGFD data sets.

Table 6. Comparison of Specificity, Accuracy, Recall and F1-score indicators in different methods based on FFC-SG and OWA-SGFD data sets.
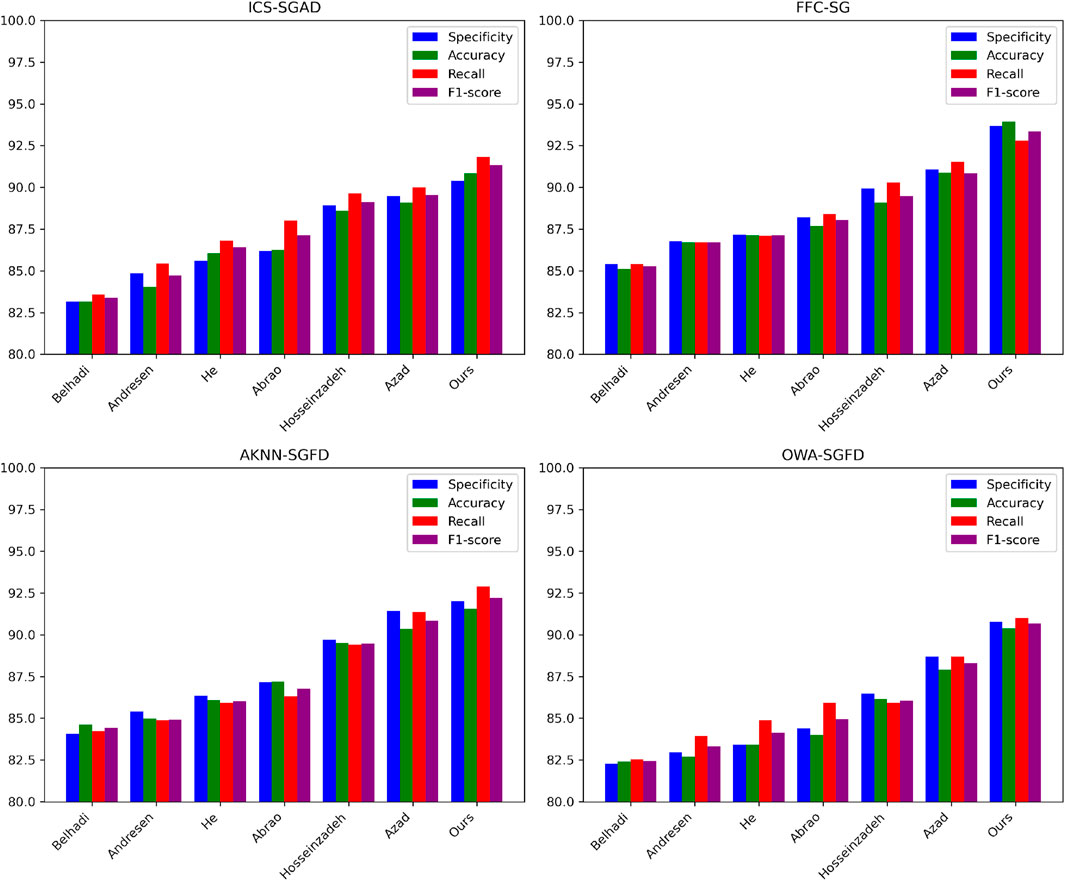
Figure 8. Comparative visualization of Specificity, Accuracy, Recall and F1-score indicators in different methods based on four data sets.
According to the data in Tables 7, 8, it is evident that our proposed model exhibits a significant advantage in computational resource metrics, including training time, inference time, and the number of model parameters across the four datasets. Specifically, on the ICS-SGAD dataset, our model’s training time is 2.99 s less than Azad et al.‘s model, which is the second-best after our own, and 5.57 s less than the third-ranking model by Hosseinzadeh et al. Our model also demonstrates a reduction of 6.05 m in inference time and a decrease of 47.96 million parameters. On the AKNN-SGFD dataset, our model’s training time is 1.18 s less than Azad’s model and 2.4 s less than Hosseinzadeh’s model. Additionally, our model achieves a decrease of 8.91 m in inference time and a reduction of 15.43 million parameters. For the FFC-SG and OWA-SGFD datasets, our model’s metrics in training time, inference time, and the number of parameters are superior to other models. Notably, on the FFC-SG dataset, our model’s training time is 10.68 s less than Andresen et al.‘s model and 5.50 s less than Abrao et al.‘s model, with an even more significant reduction of 15.17 m in inference time. Overall, our model exhibits an average advantage of over 5% in each metric across the four datasets, highlighting the effectiveness of our approach in reducing computational resource consumption while maintaining or enhancing predictive performance across diverse datasets. This underscores the high practical value of our method in the application of equipment fault detection in electronic systems. Similarly, we visually represent the data results from Tables 7, 8 in the following Figure 9.

Table 7. Comparison of Training time, Inference time and Parameters indicators in different methods based on ICS-SGAD and AKNN-SGFD data sets.
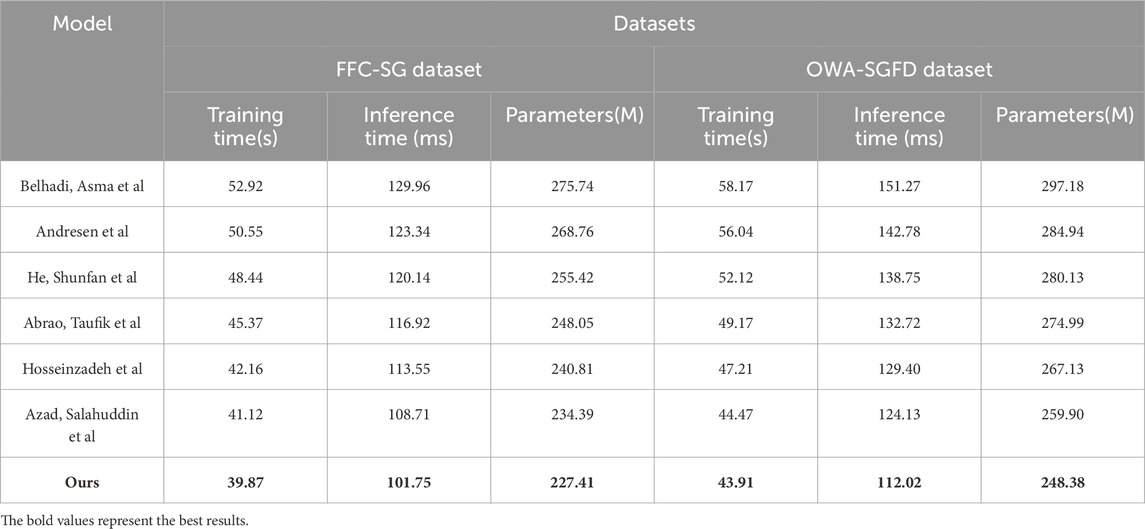
Table 8. Comparison of Training time, Inference time and Parameters indicators in different methods based on FFC-SG and OWA-SGFD data sets.
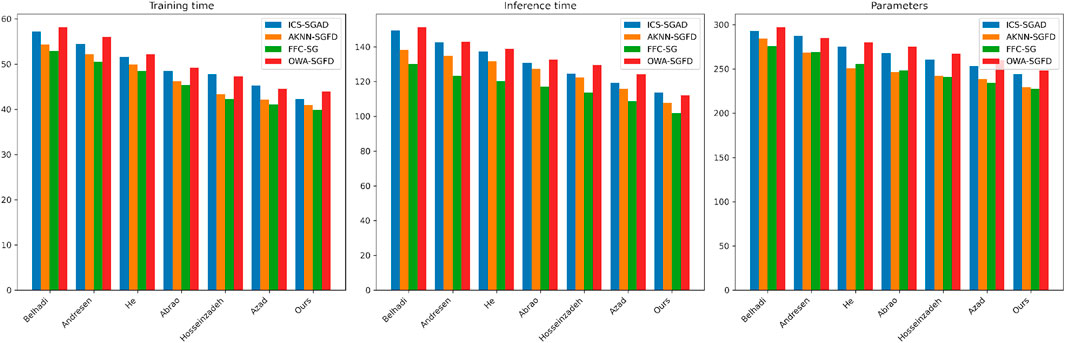
Figure 9. Visualization of comparison of Training time, Inference time and Parameters indicators in different methods based on four data sets.
According to the data in Tables 9, 10, the effects of optimizing the model with different technical modules on the four datasets are evident. Compared to the baseline model, adding the transfer learning module can lead to some improvement in various metrics, but the enhancement is limited. For example, on the ICS-SGAD dataset, each metric, on average, only increases by approximately 13%. After incorporating the generative adversarial network module, the model performance experiences a more significant improvement, with an average increase of over 10% for each metric across the four datasets.However, our proposed approach, combining transfer learning and GAN neural network modules, demonstrates the best results. This method leads to an average improvement of nearly 30% or more for each metric across the four datasets. Particularly noteworthy is the substantial improvement observed on the AKNN-SGFD and FFC-SG datasets, where each metric sees a significant increase. For instance, on the FFC-SG dataset, each metric improves by over 30%. This strongly indicates that the techniques we employed can comprehensively exploit dataset information by effectively combining transfer learning and adversarial learning approaches, significantly enhancing the model’s generalization ability across various tasks. Compared to using transfer learning or GAN individually, our approach exhibits a clear advantage, providing strong evidence for its potential value in practical applications. Additionally, we visually present the data results from Tables 9, 10 in the following Figure 10.
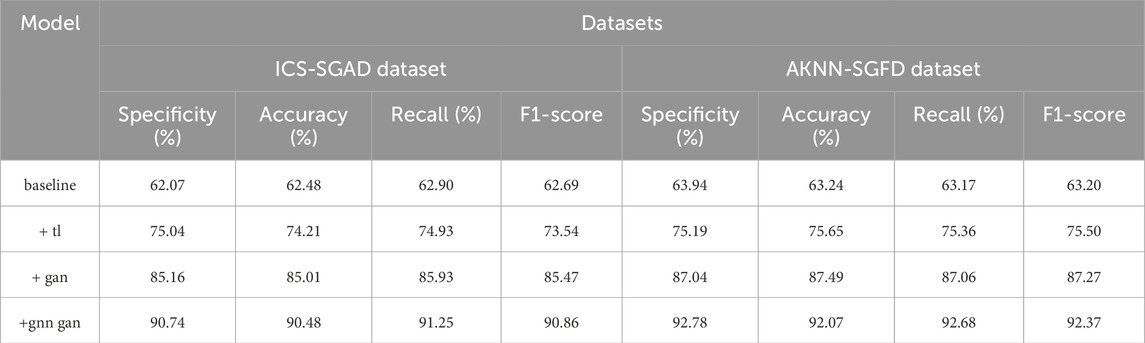
Table 9. Comparison of Specificity, Accuracy, Recall and F1-score indicators under different modules based on ICS-SGAD and AKNN-SGFD data sets.
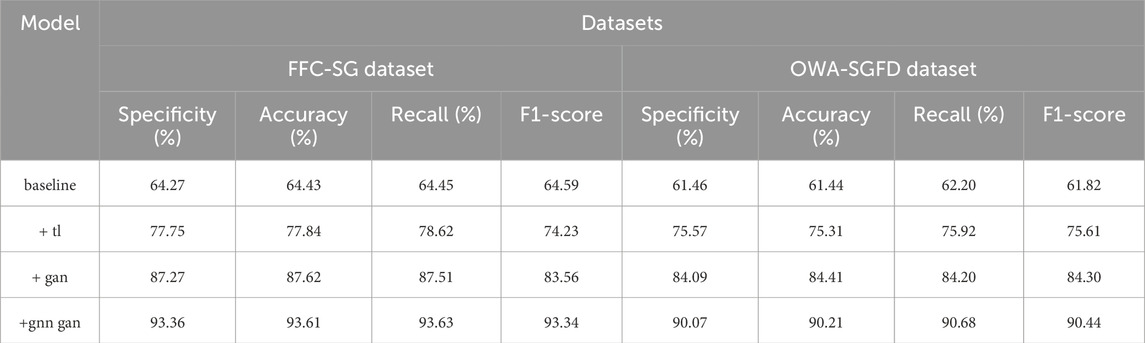
Table 10. Comparison of Specificity, Accuracy, Recall and F1-score indicators under different modules based on FFC-SG and OWA-SGFD data sets.
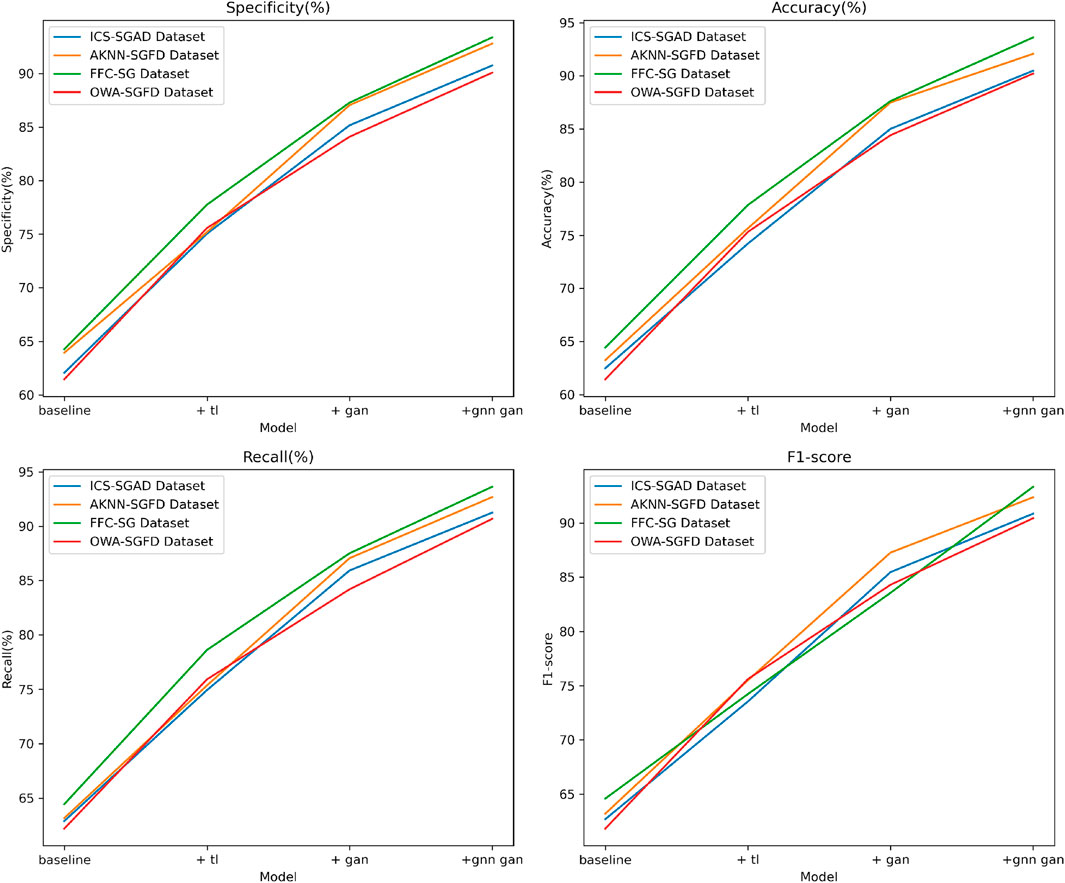
Figure 10. Comparative visualization of Specificity, Accuracy, Recall and F1-score indicators based on four data sets under different modules.
According to the data in Tables 11, 12, the resource consumption of the model optimized with different technical modules on the four datasets is evident. Compared to the baseline model, adding the transfer learning module can moderately reduce the model’s training time, inference time, and parameter count. However, the reduction is limited. For example, on the ICS-SGAD dataset, the training time decreases by only 3.86 s, the inference time decreases from 147.75 m to 138.47 m, and the parameter count improves by 9.44 million.After incorporating the gan module, the model’s computational costs decrease further, with training time and inference time both reducing by around 10% on all datasets, and a noticeable decrease in parameter count. The most effective results are achieved when we connect the transfer learning module and the generative adversarial network module in series. This approach leads to an average reduction of over 30% in training time, over 20% in inference time, and over 15% in parameter count across the four datasets. Particularly noteworthy is the more pronounced resource savings on the FFC-SG and OWA-SGFD datasets. This indicates that our approach not only significantly improves model performance but also substantially reduces the model’s computational costs, demonstrating its substantial practical value. Finally, we visually present the data results from Tables 11, 12 in the following Figure 11.
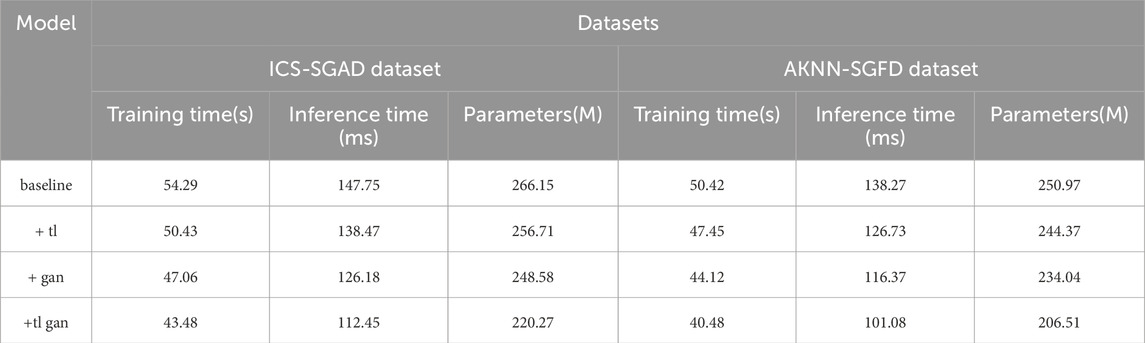
Table 11. Comparison of Training time, Inference time and Parameters indicators under different modules based on ICS-SGAD and AKNN-SGFD data sets.
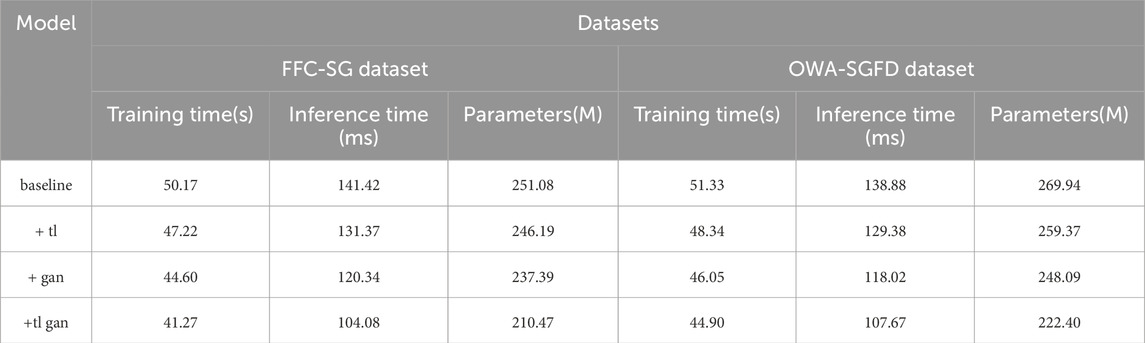
Table 12. Comparison of Training time, Inference time and Parameters indicators under different modules based on FFC-SG and OWA-SGFD data sets.
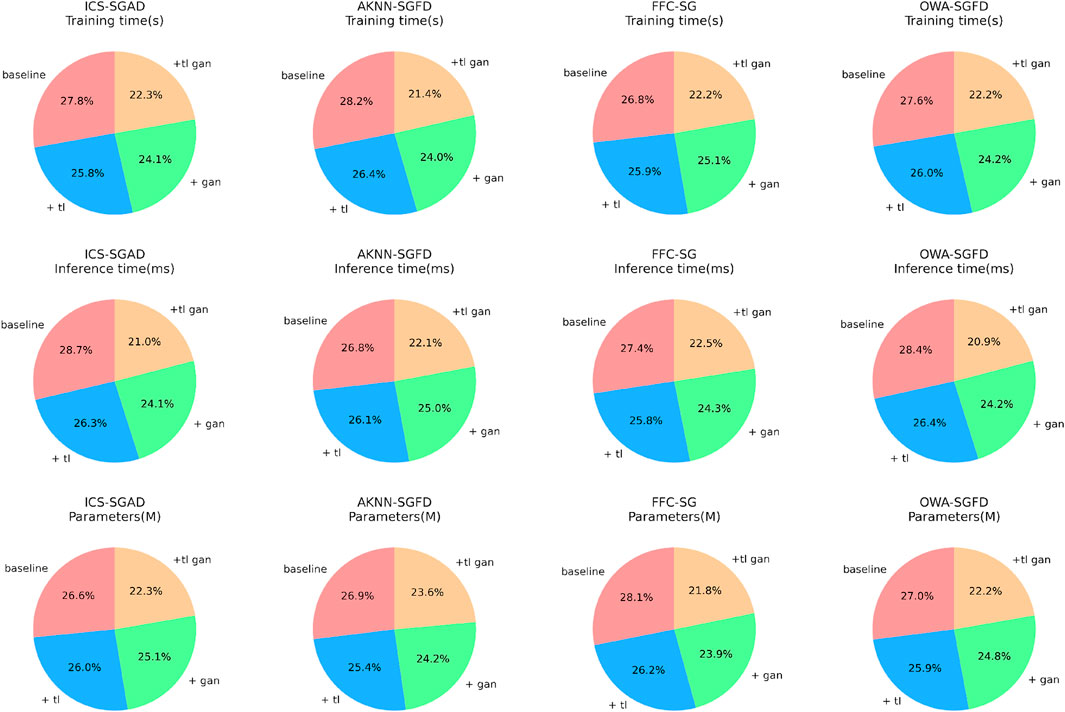
Figure 11. Comparative visualization of Training time, Inference time and Parameters indicators under different modules based on four data sets.
The model we proposed in this study outperforms the other six classical models on four different types of real datasets, both in terms of predictive performance indicators and computational resource consumption. Especially in practical application scenarios such as medical image recognition datasets FFC-SG and OWA-SGFD, our model’s superiority is particularly evident, with an average improvement of over 5% or more in each metric and computational indicators compared to other models. This clearly demonstrates the advantages of our approach in these types of tasks. Additionally, by comparing different technical modules, it can be observed that our combined approach of transfer learning and generative adversarial networks comprehensively exploits dataset information, significantly improving model performance, while also minimizing the computational burden associated with model training and inference. This holds significant value in industrial applications.
In summary, this series of experimental results thoroughly validates the wide applicability and outstanding performance of our proposed method in addressing real-world problems, providing valuable insights for relevant applications. We will continue to explore this direction in the future, aiming to continuously enhance the model’s performance across various tasks and contribute to solving practical issues.
4.6 Discussion
In this study, we employed a comprehensive approach by utilizing the Vision Transformer (ViT) model, transfer learning, and generative adversarial networks. Starting from the perspective of image processing, we seek to advance the digitization and intelligent perception levels of power systems. With the introduction of the ViT model, we accelerate the learning process through transfer learning and use generative adversarial networks to augment training data, bringing significant technological breakthroughs to the field of power system image processing.
The key innovation of this research lies in the integration of multiple advanced technologies tailored to the practical requirements of emerging power systems. This integration aims to enhance the efficiency of UAV image recognition and intelligent power distribution network device fault detection. Through this study, we provide substantial support for the application of image processing and device fault detection in the construction of emerging power systems, offering robust technical support for the development of the power industry, a focus of interest in related fields.
The significance of this study is manifested in several aspects. Firstly, by introducing the Vision Transformer (ViT) model, we have made significant progress in the field of power system image processing, providing a powerful tool for digital transformation. Secondly, the adoption of transfer learning effectively addresses the issue of limited data, enhancing the model’s generalization ability and achieving more robust and reliable results in tasks such as power system equipment defect recognition. Lastly, the innovative application of generative adversarial networks in power system image recognition tasks contributes to augmenting training data, improving the model’s accuracy in identifying various types of power equipment defects. This research is both theoretically innovative and strongly supported by experimental data, offering new insights for research and applications in the field of power system image processing.
Through experimental comparisons and analyses, our approach has achieved significant improvements in specificity, accuracy, recall, and F1-score metrics. Compared to traditional methods, our model excels in UAV image recognition and intelligent power distribution network device fault detection. Specifically, in the detection of faults in intelligent power distribution network devices, our model successfully captures subtle fault features, achieving a diagnostic accuracy of over 90%, an improvement of more than 17% compared to traditional methods. Additionally, the model demonstrates outstanding performance with an F1-score of around 91%. These experimental results not only validate the effectiveness of our approach but also showcase its enormous potential in practical Applications.
5 Conclusion
When discussing the continuous progress of technology, our research focuses on addressing challenges in the fields of unmanned aerial vehicle (UAV) image recognition and intelligent power distribution network device fault detection. This study aims to enhance recognition accuracy and efficiency by integrating cutting-edge technologies such as the Transformer model, transfer learning, and generative adversarial networks, providing innovative solutions for the safety and stable operation of power system equipment. In this chapter, we will review the research objectives, emphasize the innovation and importance of the study, outline the research findings, discuss limitations, and look ahead to future research directions. This research is dedicated to addressing practical issues, aiming to improve the performance of existing methods and offering new research perspectives for relevant areas in the field of emerging power systems.
Despite the considerable progress we’ve made in our research, there are still some limitations that require addressing. Firstly, our experimental dataset may not comprehensively cover all scenarios of power system images and distribution network device faults. As a result, the model’s generalization performance could be limited in certain specific situations. Secondly, while we’ve employed generative adversarial networks to augment training data, further practical verification is necessary to evaluate the model’s generalization, particularly in extreme cases. These limitations underscore the importance of future research focusing on validation with more extensive datasets and enhancing the model’s robustness and generalization capabilities. Additionally, the current Transformer model still faces challenges in terms of interpretability. To address this, we plan to introduce attention mechanisms in future research to enhance the model’s interpretability and better explain its decision-making process.
Considering both the achievements and limitations of our study, future endeavors can focus on refining the model’s performance and broadening its applicability. Firstly, we can delve into optimizing the model’s hyperparameters to bolster its effectiveness in navigating complex scenarios. Secondly, validating our approach with more comprehensive datasets across diverse real-world application contexts will bolster its reliability. Furthermore, integrating advanced methodologies like self-supervised learning shows promise in elevating the model’s performance, particularly in scenarios with scarce data.
In summary, our research successfully integrates cutting-edge technologies, including the Transformer model, transfer learning, and generative adversarial networks. This integration leads to significant advancements in unmanned aerial vehicle (UAV) image recognition and intelligent detection of distribution network device faults. Our approach not only holds promise in theory but also receives robust validation from experimental data. By pioneering the fusion of these technologies, we introduce important innovations in power system image processing. This lays a strong foundation for future research and applications in related domains. The outcomes of our study are poised to chart new paths in image processing and equipment fault detection within power systems, offering innovative solutions for the industry’s digital transformation and intelligence. Through this endeavor, we establish a solid groundwork for further exploration and application in power system image processing. We are confident that these findings will catalyze innovative developments in related fields, providing invaluable technical support for the establishment and evolution of new power systems. We anticipate that our work will inspire fresh insights in the realm of novel power systems and serve as a conduit for collaboration and knowledge exchange between academia and the power industry.
Data availability statement
The original contributions presented in the study are included in the article/Supplementary Material, further inquiries can be directed to the corresponding author.
Author contributions
JZ: Conceptualization, Formal Analysis, Methodology, Resources, Writing–original draft, Writing–review and editing. YC: Investigation, Project administration, Supervision, Visualization, Writing–review and editing. JG: Methodology, Resources, Software, Validation, Writing–review and editing. XL: Investigation, Methodology, Project administration, Resources, Writing–original draft.
Funding
The author(s) declare that financial support was received for the research, authorship, and/or publication of this article. State Grid Chongqing Electric Power Co., LTD. Science and Technology Project: Research on Intelligent Fault Diagnosis Technology of Whole Chain of Intelligent iot System based on Artificial Intelligence (KJ2023_033).
Conflict of interest
Authors JZ, YC, JG, and XL were employed by Chongqing Electric Power Company, State Grid.
The authors declare that this study received funding from State Grid Chongqing Electric Power Co., LTD. The funder had the following involvement in the study: study design, collection, analysis, interpretation of data, the writing of this article, and the decision to submit it for publication.
Publisher’s note
All claims expressed in this article are solely those of the authors and do not necessarily represent those of their affiliated organizations, or those of the publisher, the editors and the reviewers. Any product that may be evaluated in this article, or claim that may be made by its manufacturer, is not guaranteed or endorsed by the publisher.
References
Abid, A., Khan, M. T., and Iqbal, J. (2021). A review on fault detection and diagnosis techniques: basics and beyond. Artif. Intell. Rev. 54, 3639–3664. doi:10.1007/s10462-020-09934-2
Appiah, A. Y., Zhang, X., Ayawli, B. B. K., and Kyeremeh, F. (2019). Review and performance evaluation of photovoltaic array fault detection and diagnosis techniques. Int. J. Photoenergy 2019, 1–19. doi:10.1155/2019/6953530
Ayoub, N., and Schneider-Kamp, P. (2021). Real-time on-board deep learning fault detection for autonomous uav inspections. Electronics 10, 1091. doi:10.3390/electronics10091091
Azar, A. T., Koubaa, A., Ali, M. N., Ibrahim, H. A., Ibrahim, Z. F., Kazim, M., et al. (2021). Drone deep reinforcement learning: a review. Electronics 10, 999. doi:10.3390/electronics10090999
Barta, G., Nagy, G. B. G., Kazi, S., and Henk, T. (2015). “Gefcom 2014—probabilistic electricity price forecasting,” in Intelligent decision technologies: proceedings of the 7th KES international conference on intelligent decision technologies (KES-IDT 2015). Springer, 67–76.
Chen, J., Chen, J., Zhang, D., Sun, Y., and Nanehkaran, Y. A. (2020). Using deep transfer learning for image-based plant disease identification. Comput. Electron. Agric. 173, 105393. doi:10.1016/j.compag.2020.105393
Creswell, A., White, T., Dumoulin, V., Arulkumaran, K., Sengupta, B., and Bharath, A. A. (2018). Generative adversarial networks: an overview. IEEE signal Process. Mag. 35, 53–65. doi:10.1109/msp.2017.2765202
Fang, J., Li, H., Tang, Y., and Blaabjerg, F. (2018). On the inertia of future more-electronics power systems. IEEE J. Emerg. Sel. Top. Power Electron. 7, 2130–2146. doi:10.1109/jestpe.2018.2877766
Giua, A., and Silva, M. (2018). Petri nets and automatic control: a historical perspective. Annu. Rev. Control 45, 223–239. doi:10.1016/j.arcontrol.2018.04.006
Haji, S. H., and Abdulazeez, A. M. (2021). Comparison of optimization techniques based on gradient descent algorithm: a review. PalArch’s J. Archaeol. Egypt/Egyptology 18, 2715–2743.
Han, K., Wang, Y., Chen, H., Chen, X., Guo, J., Liu, Z., et al. (2022). A survey on vision transformer. IEEE Trans. pattern analysis Mach. Intell. 45, 87–110. doi:10.1109/tpami.2022.3152247
Jalil, B., Leone, G. R., Martinelli, M., Moroni, D., Pascali, M. A., and Berton, A. (2019). Fault detection in power equipment via an unmanned aerial system using multi modal data. Sensors 19, 3014. doi:10.3390/s19133014
Joshi, T., Goyal, N., and Ram, M. (2022). An approach to analyze reliability indices in peer-to-peer communication systems. Cybern. Syst. 53, 716–733. doi:10.1080/01969722.2022.2047273
Karimulla, S., and Ravi, K. (2019). “A review on importance of smart grid in electrical power system” in 2019 international Conference on Computation of power, energy, Information and communication (ICCPEIC) (IEEE), 022–027.
Kumar, N., Singh, B., and Panigrahi, B. K. (2023). Voltage sensorless based model predictive control with battery management system: for solar pv powered on-board ev charging. IEEE Trans. Transp. Electrification 9, 2583–2592. doi:10.1109/TTE.2022.3213253
Kumari, P., Kumar, N., and Panigrahi, B. K. (2023). A framework of reduced sensor rooftop spv system using parabolic curve fitting mppt technology for household consumers. IEEE Trans. Consumer Electron. 69, 29–37. doi:10.1109/TCE.2022.3209974
Lee, D., La, W. G., and Kim, H. (2018). “Drone detection and identification system using artificial intelligence,” in 2018 international Conference on Information and communication technology convergence (ICTC) (IEEE), 1131–1133.
Li, Y., Yu, F., Cai, Q., Yuan, K., Wan, R., Li, X., et al. (2019). “Image fusion of fault detection in power system based on deep learning,”, 22. Cluster Computing, 9435–9443. doi:10.1007/s10586-018-2264-2
Mirjalili, S., and Mirjalili, S. (2019). “Genetic algorithm,” in Evolutionary algorithms and neural networks: theory and applications, 43–55.
Mohammadi, F., Nazri, G. A., and Saif, M. (2019). “A fast fault detection and identification approach in power distribution systems,” in 2019 international conference on power generation systems and renewable energy technologies (PGSRET). IEEE, 1–4.
Nagy, G. I., Barta, G., Kazi, S., Borbély, G., and Simon, G. (2016). Gefcom2014: probabilistic solar and wind power forecasting using a generalized additive tree ensemble approach. Int. J. Forecast. 32, 1087–1093. doi:10.1016/j.ijforecast.2015.11.013
Neeraj, M. J., and Behera, R. K. (2022). Power load forecasting based on long short term memory-singular spectrum analysis. Energy Syst., 1–23.
Nguyen, H. T., Walker, C., and Walker, E. A. (2018). A first course in fuzzy logic. Chapman and Hall/CRC.
Ning, X., Tian, W., He, F., Bai, X., Sun, L., and Li, W. (2023). Hyper-sausage coverage function neuron model and learning algorithm for image classification. Pattern Recognit. 136, 109216. doi:10.1016/j.patcog.2022.109216
Ning, X., Yu, Z., Li, L., Li, W., and Tiwari, P. (2024). Dilf: differentiable rendering-based multi-view image–language fusion for zero-shot 3d shape understanding. Inf. Fusion 102, 102033. doi:10.1016/j.inffus.2023.102033
Noda, T., Tadokoro, T., and Dozaki, T. (2023). Automatic generation of power system simulation data cases from utility databases: introducing a new technology. IEEE Electrification Mag. 11, 79–85. doi:10.1109/MELE.2023.3320521
Peng, C., and Li, W. (2023). Adaptive spatial feature fusion object detection algorithm based on attention improvement. J. Jilin Univ. Sci. Ed. 61. doi:10.13413/j.cnki.jdxblxb.2022074
Rahaman, M., Hillas, M. M., Tuba, J., Ruma, J. F., Ahmed, N., and Rahman, R. M. (2022). Effects of label noise on performance of remote sensing and deep learning-based water body segmentation models. Cybern. Syst. 53, 581–606. doi:10.1080/01969722.2021.1989171
Ren, B., and Wang, Z. (2024). Strategic priorities, tasks, and pathways for advancing new productivity in the Chinese-style modernization. J. Xi’an Univ. Finance Econ. 37, 3–11. doi:10.19331/j.cnki.jxufe.20240008.002
Simonyan, K., and Zisserman, A. (2014). Very deep convolutional networks for large-scale image recognition. arXiv preprint arXiv:1409.1556.
Szegedy, C., Vanhoucke, V., Ioffe, S., Shlens, J., and Wojna, Z. (2016). “Rethinking the inception architecture for computer vision,” in Proceedings of the IEEE conference on computer vision and pattern recognition, 2818–2826.
Voita, E., Talbot, D., Moiseev, F., Sennrich, R., and Titov, I. (2019). Analyzing multi-head self-attention: specialized heads do the heavy lifting, the rest can be pruned. arXiv Prepr. arXiv:1905.09418.
Wang, J., Li, F., An, Y., Zhang, X., and Sun, H. (2024). Towards robust lidar-camera fusion in bev space via mutual deformable attention and temporal aggregation. IEEE Trans. Circuits Syst. Video Technol., 1. doi:10.1109/TCSVT.2024.3366664
Wang, X., Ji, H., Shi, C., Wang, B., Ye, Y., Cui, P., et al. (2019). “Heterogeneous graph attention network,” in The world wide web conference, 2022–2032.
Yao, Y., and Liu, Z. (2024). The new development concept helps accelerate the formation of new quality productivity: theoretical logic and implementation paths. J. Xi’an Univ. Finance Econ. 37, 3–14.
Zhao, S., Blaabjerg, F., and Wang, H. (2020). An overview of artificial intelligence applications for power electronics. IEEE Trans. Power Electron. 36, 4633–4658. doi:10.1109/tpel.2020.3024914
Zhu, H., Li, H., Li, W., and Li, F. (2021). Single image super-resolution reconstruction based on generative adversarial network. J. Jilin Univ. 59, 1491–1498.
Keywords: power systems, artificial intelligence, image intelligent processing, electrical equipment defect recognition, ViT model
Citation: Zhong J, Chen Y, Gao J and Lv X (2024) Drone image recognition and intelligent power distribution network equipment fault detection based on the transformer model and transfer learning. Front. Energy Res. 12:1364445. doi: 10.3389/fenrg.2024.1364445
Received: 02 January 2024; Accepted: 21 June 2024;
Published: 29 August 2024.
Edited by:
Hengrui Ma, Qinghai University, ChinaReviewed by:
Nishant Kumar, Indian Institute of Technology Jodhpur, IndiaWei Gao, University of Denver, United States
Copyright © 2024 Zhong, Chen, Gao and Lv. This is an open-access article distributed under the terms of the Creative Commons Attribution License (CC BY). The use, distribution or reproduction in other forums is permitted, provided the original author(s) and the copyright owner(s) are credited and that the original publication in this journal is cited, in accordance with accepted academic practice. No use, distribution or reproduction is permitted which does not comply with these terms.
*Correspondence: Jiayong Zhong, emppYXlvbmdAYWxpeXVuLmNvbQ==