 Chunmei Zhang1*
 Jiang Jiang
- 1Zhongshan Power Supply Company of Guangdong Power Grid Co., Ltd., Zhongshan, Guangdong, China
- 2Guangdong Power Grid Co., Ltd., Guangzhou, Guangdong, China
- 3Southern Power Grid Digital Grid Research Institute Co., Ltd., Guangzhou, Guangdong, China
The day-ahead dispatching of power system depends on the predicted renewable energy output and load power, which brings great challenges to the real-time power balance. This paper focuses on voltage sensitive loads (VSLs) that are widely distributed in space, thus exploring the real-time dispatching potential for VSLs. Firstly, based on the P-V relationship of VSLs clusters, a ZIP model is adopted to establish VSLs’ power controllable model. Meanwhile, considering the potential voltage instability risk during the process of voltage regulation, a linear relationship between voltage safety margin (VSM) index and node power variation was derived. Then, a two-stage linear dispatching model for controllable VSLs clusters was established to meet the needs of online application. In detail, the first stage mainly focuses on evaluating the scheduling potential of VSLs clusters and the second stage determines the optimal real-time response strategy for VSLs clusters. Finally, the effectiveness and feasibility of the proposed method are verified through an improved IEEE-30 node system.
1 Introduction
At present, the green transformation and low-carbon economic dispatching of the power system are the focus of the power industry (Wen et al., 2024). Urban power grids are accelerating the investment and construction process of renewable energy, and the proportion of renewable energy generation represented by wind and photovoltaic is gradually increasing (Herath and Venayagamoorthy, 2021). However, wind power output has significant fluctuations, uncertainties, and anti-peak characteristics, which pose great difficulties for the consumption of wind power. Under this background, exploring the dispatching potential of the load side, guiding the load side to participate in demand response (DR) through incentive measures can not only avoid large-scale economic investment by power grid companies, reduce peak shaving costs, but also provide flexible peak shaving resources to meet different time scale needs (Wang et al., 2018; Schneider et al., 2022). Users can also benefit from it, assisting in the consumption of renewable energy while reducing their own production electricity costs, achieving a win-win situation.
Compared to industrial loads, the adjustable load capacity in residential and commercial areas is smaller, and the effect of individual residential and commercial load participating in DR is not good. Most of them use load aggregators or agents as bridges, and after aggregation, they participate in power grid scheduling as a unified interest entity, represented by electric vehicles (EVs) and temperature control loads (TCLs). Currently, research on scheduling methods for this type of load is relatively mature. In order to reduce the negative impact of disorderly charging and discharging of large-scale EVs on the power grid, reference (Ren et al., 2022) designed a hierarchical scheduling framework, which achieves cluster control of EVs and TCLs through aggregators. Based on load scheduling instructions issued by the system side, point-to-point transactions are carried out; in reference (Rassaei et al., 2015), researchers analyzed the impact of users’ electricity consumption behavior on the charging demand of EVs and established a bidding strategy suitable for the day-ahead electricity market. Distributed algorithms were used to solve the problem, achieving the goal of minimizing the electricity demand; in reference (Zeng et al., 2022), a multi-stage regulation model of the EVs was established. Through three-stage rolling optimization, the conservatism of the day-ahead regulation stage was reduced, and the power distribution scheme of the EVs’ batteries was given to improve economic returns. In reference (Li et al., 2022), in order to reduce the adverse effects caused by the deviation between the expected and actual response rate of EVs, the acceptance of scheduling risks by load aggregators is divided into optimistic and pessimistic types. A robust optimization model is used to minimize the operating costs of aggregators. Reference (Kong et al., 2023) proposed a peak shaving potential evaluation model of virtual power plant based on price elasticity mechanism and consumer psychology, which fully considers market incentives and risk avoidance factors, accurately characterizes the user characteristics. Reference (Zhang et al., 2018) designed a real-time intelligent charging algorithm for EVs that integrates building energy management systems and charging equipment controllers for scheduling. Considering the rapid development of communication technology and the increase in the number of base station construction, in reference (Yong et al., 2021), the difficulties, prospects, and key technologies of 5G base stations participating in DR were analyzed. Through the collaborative scheduling of communication network and power grid, the idle energy storage equipment in the base stations was fully utilized, effectively reducing the operating costs of communication operators and the energy storage investment costs on the power grid side.
In addition, there is a large number of building loads widely distributed in residential and commercial areas. Guiding the load in the building to participate in DR can effectively alleviate the situation of electricity shortage and promote energy conservation. In reference (Faddel et al., 2022), researchers designed a coordinated scheduling scheme for multiple buildings and the power grid, provided a convex optimization model describing the heating, ventilation, and air conditioning systems of buildings, and used the alternating direction multiplier method to interact with the minimum amount of data that satisfies iterative convergence, avoiding potential risks of privacy leakage. Reference (Wei et al., 2021) proposes a data-driven adaptive dynamic programming method to solve the optimal control scheme for air conditioning inside buildings. A three-layer neural network is used to predict environmental temperature, lighting conditions, and load demand. In reference (Shi et al., 2022), a complete system DR platform was developed for building load, and system deployment and bidirectional adaptation devices were designed and developed. Reference (Tang et al., 2023) comprehensively considers the DR of building load, the thermal comfort needs of users, and the thermal stability constraints of oil immersed transformers. Within the allowable maximum load rate range, distribution network optimization scheduling is carried out to maximize the potential of load side scheduling while considering the safety of the distribution network.
Overall, there are two main ways for residents/commercial areas to participate in peak shaving of the power system: 1) Adjusting their own electricity consumption behavior under the guidance of electricity prices. This participation method requires that electricity prices can accurately reflect the dynamic characteristics of renewable energy output and the supply-demand relationship between sources and loads, in order to accurately guide load side peak shaving and valley filling (Dai et al., 2022). When the electricity price is unreasonable, it may even further widen the peak-valley difference. Therefore, many scholars have conducted research on electricity price updates and peak-valley time division. For example, to improve the consumption capacity of photovoltaic power in the distribution network, reference (Wang et al., 2023) established a TOU electricity price optimization model that takes into account photovoltaic output characteristics and DR. References (Chen et al., 2023; Yu et al., 2023) guide the orderly use of electricity in the distribution network by dynamically updating the real-time node marginal electricity prices, ensuring the balance of interests among market participants. 2) Voluntarily participate in the peak-shaving auxiliary service market through rules such as contract agreements, bidding auctions, etc. For example, in reference (Wen et al., 2023), the electricity sales company adopts an insurance mechanism and signs a DR contract with the load side to transfer the risks caused by electricity fluctuations and uncertainty. In reference (Li et al., 2021), incentive contracts were signed between the power grid and movable loads, which can still provide practical and feasible optimal incentive schemes in scenarios of information asymmetry. Reference (Ge, 2022) proposed an adjustable resource auction method and designed a corresponding information communication framework for load side participation in services.
However, the day-ahead dispatching of power system depends on the predicted renewable energy output and load power. The uncertainty of renewable energy output and load power poses a huge challenge to the real-time power balance of power system. Unlike common adjustment loads such as EVs, TCLs, and building loads, there are also some loads in the distribution network that have fast response speed. The power consumption of these loads is closely related to the voltage of the connecting nodes, which is named as voltage sensitive loads (VSLs). This type of load is insensitive to electricity prices and has small capacity and poor adaptability, which has often been ignored in previous studies (Jin et al., 2018). Common VSLs include small electrical appliances, lighting, and public service loads that are necessary for many household users (Lezama et al., 2020). In addition, the power of the distribution network is often closely related to the voltage of root node and can also be seen as a typical type of VSLs. The participation of VSLs can achieve the goal of voltage reduction and energy conservation. Currently, power companies such as Southern California Edison (Williams, 1995), Northeast Utilities (Lauria, 1987), Bonneville Power Administration (De Steese, 1987), BC Hydro (Dwyer et al., 1995), Northwest Energy Efficiency Alliance (Short and Mee, 2012), and Hydro Quebec achieve power control of VSLs by regulating node voltage, thus effectively alleviating power supply pressure and getting good economic results. For example, a detailed simulation study was given by the Department of Energy in 2010 shows a reduction in annual energy of 3.04% through VSLs participating in scheduling (Short and Mee, 2012; Diaz et al., 2013). Hence, this paper selects voltage sensitive loads (VSLs) to explore the potential for real-time scheduling. The way for VSLs participate in scheduling is simple, without the need for additional installation of control equipment and signing incentive agreements, which can be seen as a direct control strategy. By utilizing existing reactive power devices in the system, continuous voltage regulation can be achieved through AVC control framework, ultimately achieving power control of VSLs. It should be noted that node voltage is allowed to vary within a certain range (such as in China, voltage can vary within −10%–+7%), leaving room for the control of voltage sensitive loads and not affecting the user’s experience, which is also a prerequisite for conducting real-time VSLs’ scheduling (Tang et al., 2018). Unfortunately, there are still some challenges in the current implementation of VSL scheduling. Firstly, in terms of scheduling methods, the most widely used voltage regulation method is to install on load tap changer (OLTC) at the load connection point, and change the node voltage by adjusting the OLTC (Lv et al., 2018; Li et al., 2019). However, OLTC belongs to mechanical devices, frequent adjustment of OLTC can damage its working life, and OLTC can only adjust voltage non-continuously, resulting in poor flexibility. In addition, due to the integration of renewable energy, the voltage safety margin of the power grid is reduced. Meanwhile, adjusting the voltage for VSL power control will further increase the operational risk of the system (Wu et al., 2022; Zheng et al., 2022).
To solve the above problems, this paper designs a real-time scheduling strategy considering VSLs, and achieves continuous control of access point voltage by adjusting the generators and reactive power output equipment in the network. The innovation points of this paper can be summarized as follows:
(1) A two-stage evaluation-dispatch model of the VSLs’ regulation considering voltage stability constraints is established. This paper fully considers the risk of voltage instability during the VSLs’ regulation process. By introducing voltage safety margin (VSM) indicators, safety and reliability of system operation can be guaranteed during the regulation process.
(2) This paper utilizes the institutional advantages of transmission and distribution coordination in China, and uses the reactive power equipment existing in the system to achieve continuous control of load node voltage, avoiding additional investment and mechanical damage to OLTC.
The framework of this paper is arranged as follows: Section 2 firstly analyzes the electricity consumption characteristics of VSLs, and then designs VSM indicators to ensure the system voltage safety during VSLs’ scheduling process; in Section 3, a two-stage method for evaluating the adjustable margin of VSLs is provided, and real-time control is carried out within the allowable power regulation range. Meanwhile, considering that mathematical model includes non-convex and nonlinear AC power flow constraints and coupling constraints, sensitivity analysis method is used to linearize the expansion at the current operating point to meet the requirements of real-time online computing. Then, in Section 4, the improved IEEE-30 node testing system is used for verification. Finally, Section 5 concludes the whole paper.
2 Electricity consumption characteristics analysis of VSLs
2.1 Mathematical model of VSLs
In recent years, with the application and popularization of automatic voltage control technology, system operators can achieve voltage control of distribution network feeder nodes by adjusting the reactive power output of generator units in the transmission network. Due to the continuous regulation of reactive power, the shortcoming of OLTC, i.e., discontinuous voltage regulation, is overcome, and the mechanical equipment damage caused by multiple OLTC switching is also avoided. At this point, the VSLs in the main network can be seen as a ZIP load and connected to the transmission network through OLTC.
In previous studies on voltage reduction, energy conservation, and load side frequency response (Wang and Wang, 2014), the ZIP model has been widely used to characterize the relationship between voltage changes and power adjustment in VSLs. This paper mainly considers the real-time steady-state scheduling problem, and the load structure can be considered to remain unchanged in the short term. Therefore, the ZIP model is used to characterize the electricity consumption characteristics of VSLs, which can meet the accuracy requirements of actual scheduling. Its mathematical expression is shown in Eqs 1, 2:
Here,
2.2 Calculation method of voltage safety margin (VSM) index
Although continuous control of node voltage can be effectively achieved by controlling the generator units and reactive power regulation equipment in the transmission network, unreasonable voltage control may affect the safe operation of the system. Meanwhile, the integration of renewable energy such as wind power further reduces the margin for safe operation. Therefore, voltage safety related constraints must be considered in the real-time scheduling process of VSLs. This section designs the voltage safety margin (VSM) index and derives the sensitivity relationship between node power changes and VSM index. The specific mathematical derivation process is as follows:
Firstly, based on the node admittance matrix relationship, establish the system voltage current network equation, as shown in Eq. 3:
Here,
Let
It can be observed in Eq. 5 that the VSM index needs to calculate the modulus of the complex number
According to the complex modulus calculation rule, Eq. 5 can be transformed into the form shown in Eq. 7:
When the system control variables change, the small change △VSM at the current operating point can be calculated according to Eq. 8:
The real and imaginary parts of
The partial derivative accumulation of state variables, namely, voltage and phase angle, can be obtained as Eq. 10:
Substituting Eq. 10 into Eqs 8, 11 can be obtained:
Eq. 11 describes the sensitivity relationship between node voltage and phase angle changes and VSM index changes, where K represents the determinant and matrix elements can be obtained according to Eq. 11. Here, Eq. 11 is written in the compact form shown in Eq. 12:
In order to intuitively characterize the impact of node power changes on VSM index, the power flow equation is first introduced here, as shown in Eq. 13:
The sensitivity relationship between node power variation and VSM index can be obtained by combining Eqs 12, 13, as shown in Eq. 14:
3 A real-time economic dispatch model for power system based on sensitivity analysis method
When incorporating VSLs into the economic dispatch, as VSLs achieve load power regulation through var-voltage optimization, its economic dispatch includes active power adjustment and reactive power optimization. In summary, the generalized mathematical model for real-time economic dispatch considering VSLs can be written in the form of Eq. 15:
Here, v and p respectively represent variables related to reactive and active power; H(v), G(p), and F (p,v) represent the objective function terms for reactive power control, active power scheduling, and their coupling part, respectively;
3.1 VSLs’ adjustable margin evaluation method
As mentioned earlier, the regulation of VSLs is mainly achieved through voltage control. During steady-state operation, the adjustable range of voltage at each node is generally allowed to be between 0.95p.u. and 1.05p.u., with the limitation of VSM index, it will further lead to a reduction in the adjustable range of voltage. Therefore, it is necessary to first evaluate the adjustable range of voltage at each node under the current operating point. Corresponding mathematical model for VSLs’ adjustable margin evaluation is shown in Eqs 16–23:
The objective function (16) and related constraints (17)–(23) construct a VSLs’ adjustable range evaluation model. The meaning of objective function (16) is to obtain the lower and upper boundary of the adjustable power of VSLs at the current operating point, in order to ensure the maximum power adjustable range of VSLs; (17) represents the power flow constraint. In (17),
3.2 A real-time control model for VSLs
By combining the real-time adjustable range evaluation model of VSLs in Section 3.1, the upper and lower power limits of for VSLs can be obtained. For VSLs’ regulation, its essence is to use adjustable VSL resources as flexible backup and supplementary resources for units within the system. Here, the discussion is divided into two scenarios:
Scenario 1: when the actual output of wind power is lower than the short-term forecast value, the power demand on the load side is larger than the sum of the planned output of the units and wind power. If VSLs do not participate in economic dispatch, in order to maintain real-time power balance, it is necessary to increase the output of units in the system or carry out load shedding operations, which increases the operating cost of the system and reduces user satisfaction with electricity consumption. When VSLs participate in scheduling, by reducing the voltage value of VSLs access nodes, the power consumption of VSLs is reduced and real-time power balance is achieved, which is both economical and environmentally friendly.
Scenario 2: When the actual output of wind power is higher than the short-term forecast value, the sum of the planned output of units and wind power is larger than the power demand on the load side. At this time, the conventional operation is to reduce the output of units in the system to maintain real-time power balance. In this case, if VSLs participate in scheduling, power control can be achieved by increasing the voltage of the VSLs’ access node. However, there are two drawbacks: Firstly, for the user side, VSLs’ regulation is a passive scheduling method. When VSLs’ power is increased, it will increase the user’s electricity consumption and cost, which is unreasonable; secondly, for the power supply side, increasing VSLs’ power to achieve renewable energy consumption has poor economic and environmental benefits. However, in some extreme scenarios, such as when the system communication fails and the output of the generators cannot be adjusted, it can also be coordinated by increasing the VSLs’ power for scheduling. However, the probability of these extreme scenarios occurring is very low. In order to maintain generality, in this paper, the focus is on examining and analyzing the VSLs’ scheduling effect under scenario 1.
Based on the adjustable range of VSLs obtained in the previous section, a real-time economic dispatch model can be constructed, as shown in Eqs 24–31:
The objective function (24) represents the minimization of operating costs, consisting of three parts. The first term represents the operation cost of generator units, which can be calculated based on the quadratic function of the generation cost. The second and third terms represent the cost of load shedding penalty, where
By combining the current power imbalance deficit and wind power consumption demand of the system, solving models Eqs 24–31 can obtain the optimal VSL control value under the current operating point. To gain a better understanding, a detailed flow chart of optimal economic dispatching strategy considering VSLs is shown in Figure 1.

FIGURE 1. Flow chart of optimal economic dispatching strategy considering VSLs.
4 Case study
In Section 4.1, the detailed information of the test system is given and the scheduling potential of VSLs and the impact of VSM index are quantitatively analyzed in Section 4.2. Finally, in Section 4.3, two common operating scenarios with different power shortages are given to verify the real-time scheduling value of VSLs.
4.1 The introduction of testing system
This paper uses an improved IEEE-30 node system for case verification. The testing system topology is shown in Figure 2, and some load nodes are regarded as controllable VSLs (i.e., red triangles in the figure). The power consumption of each VSL is controlled by adjusting the voltage amplitude. The base-state active reactive power of each VSL access node is shown in Table 1. The proposed real-time evaluation scheduling model is written using MATLAB 2016b nested YALMIP and solved using the CPLEX 12.10.0. The desktop computer installed with the software is configured with an Intel TM i5-10400 CPU and a processor of 2.90 GHz.
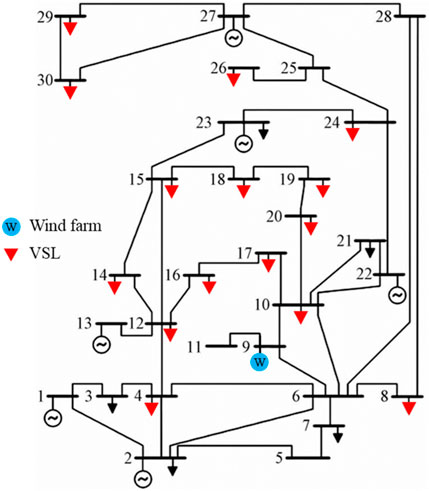
FIGURE 2. Topology of the modified IEEE-30 test system.
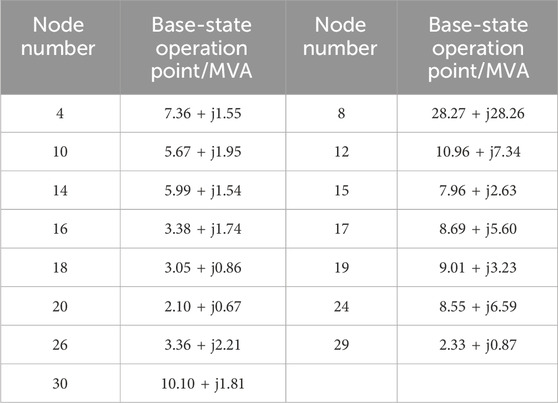
TABLE 1. Base-state operation active-reactive power of VSL access node.
4.2 Adjustable margin analysis of VSLs
This section focuses on analyzing the scheduling potential of VSLs and the impact of VSM index on the regulation range of VSLs. Firstly, Figures 3, 4 respectively show the VSLs’ power and corresponding access point voltage in the base-state operation scenario 1, maximizing VSLs’ adjustable power scenario 2, and minimizing VSLs’ adjustable power scenario 3.
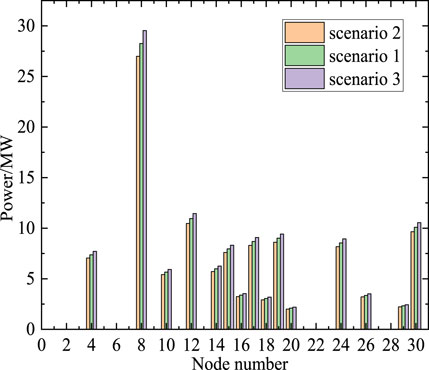
FIGURE 3. Power of VSLs in three different scenarios.
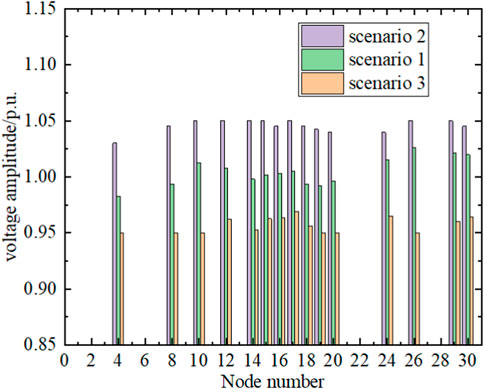
FIGURE 4. Voltage amplitude of each VSL node in three scenarios.
Observing Figures 3, 4, combined with Eq. 1, it can be concluded that the adjustable range of VSLs mainly depends on two factors: firstly, the power of each VSL fluctuates upper and below the base-state operating point, and for VSLs with larger base-state operating power, their adjustable range is often larger; secondly, some nodes have a higher risk of voltage instability, so their voltage adjustable range is smaller, and the controllable power range of VSL is smaller. In order to provide a more intuitive analysis of the scheduling potential of VSL, Table 2 shows the VSLs’ power regulation ranges for three different scenarios when the value of VSMmax is 0.15. During maximum upper power operation, the total power of VSL increases by 5.31 MW compared to base-state operation, with a power variation of 4.55%. When operating at maximum lower power operation, the total power of VSLs decreases by 5.20 MW compared to ground state operation, with a power variation of 4.45%. Overall, through voltage control, while ensuring system safety, the newly added regulation range of VSLs accounts for 9% of the total power of base-state operating load, which has great scheduling potential and value. In addition, with the help of reactive power control equipment, node voltage can be adjusted on a second level time scale. The current real-time scheduling time scale in China is 5–15 min, therefore VSLs have a fast response speed and can meet the needs of real-time applications without involving privacy protection issues.
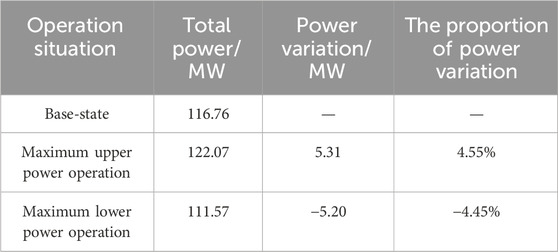
TABLE 2. VSL power regulation range under three different scenarios when VSMmax = 0.15.
Previously, scheduling strategies for VSLs often ignored the impact of the regulation process on voltage safety (Lauria, 1987; Wang and Wang, 2014). In order to quantitatively analyze the impact of VSM index on the VSLs’ power regulation range, Table 3 provides the maximum upper power regulation amount and maximum lower power regulation amount of VSLs under different VSM index.
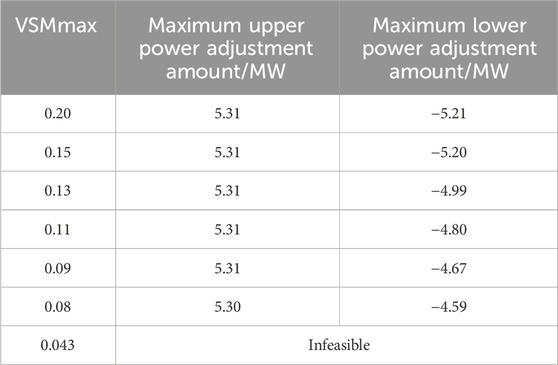
TABLE 3. VSL power regulation range under different voltage safety margin factors.
Under different values of VSM index, the maximum power of VSLs remains basically unchanged, but the maximum power decreases as the value of VSM index decreases. In order to facilitate the explanation of the reasons for this phenomenon, Figure 5 provides a schematic diagram of the voltage feasible region under different constraints. The voltage feasible range of each load node is determined jointly by constraints (20) and (22). The voltage feasible range in the blue area of Figure 5 is determined by constraint (20). When the VSM index is not set in the system or the setting value is large, the voltage feasible range determined by voltage safety constraint (22) is in the right area (i.e., green line in the figure). At this time, constraint (22) is ineffective constraint, and the maximum reduction power of VSLs remains unchanged; as the VSM index gradually decreases, both constraints (22) and (20) are effective constraints. The voltage feasible range determined by constraint (22) is
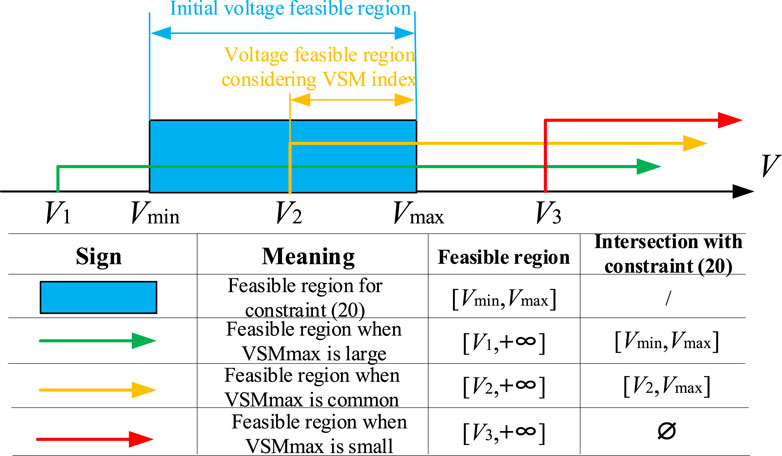
FIGURE 5. Schematic diagram of voltage feasible region under different constraints.
4.3 Real-time scheduling benefit analysis of VSLs
In order to provide a more intuitive explanation of the real-time scheduling effect of VSLs, two common operating scenarios with different power shortages have been set up here. The specific information is as follows:
Case 1: Due to the daily prediction error of wind power output and load power, the demand for load side power consumption is 10 MW larger than the sum of the planned output of units and the actual wind power; Case 2: Due to the daily prediction error of wind power output and load power, the demand for load side power consumption is 4 MW greater than the sum of the planned output of units and the actual wind power; In the above two operating scenarios, the power adjustment of VSLs and the output of generator units within the system are shown in Figures 6, 7, respectively. In Case-1, the power shortfall on the power and load sides is 10 MW. Based on Table 2, it can be seen that the maximum reduction power of VSLs under the current operating point is 5.20 MW. This indicates that even when all VSLs’ power is adjusted to the minimum value, it is still unable to fill the current power shortfall, and there is a power shortfall of 4.80 MW. Therefore, it is necessary to adjust the units’ output in the system to maintain real-time power balance. As shown in Figure 6B, the output of units when VSLs participate in regulation is significantly lower than that when VSLs do not participate in dispatch. This is because after VSLs participate in dispatch, the real-time power shortfall of the system decreases, and the generator units only need to slightly increase its output to maintain real-time power balance. From the perspective of economic investment, when VSLs do not participate in scheduling, the operating cost under the current point is 579.75 $. However, when VSLs participate in scheduling, the operating cost of the system decreases to 555.83 $, which means that the power supply pressure is reduced through VSL regulation, while reducing the cost by 23.92 $, and avoiding frequent adjustments to the planned output of units. Due to the low base-state operating point of the VSLs, the corresponding adjustable power of VSLs is also small. In heavy load scenarios, the economic benefits brought by VSL regulation will be more considerable. In Case 2, the current power shortfall is only 4 MW, and VSLs’ own power adjustment capacity is sufficient to cover the current power shortfall. Therefore, as shown in Figure 7B, there is no need to increase the output of the generator units, which not only ensures the safe operation of the power system but also reduces operation costs and greenhouse gas emissions. In fact, VSLs’ flexibility resources can be seen as virtual generators, serving as backup flexible resources for traditional generator units: increasing VSLs’ own electricity consumption is equivalent to reducing the output of units in the system. The evaluation and real-time control process of VSLs is essentially a voltage reduction and energy-saving project that takes into account system voltage safety.
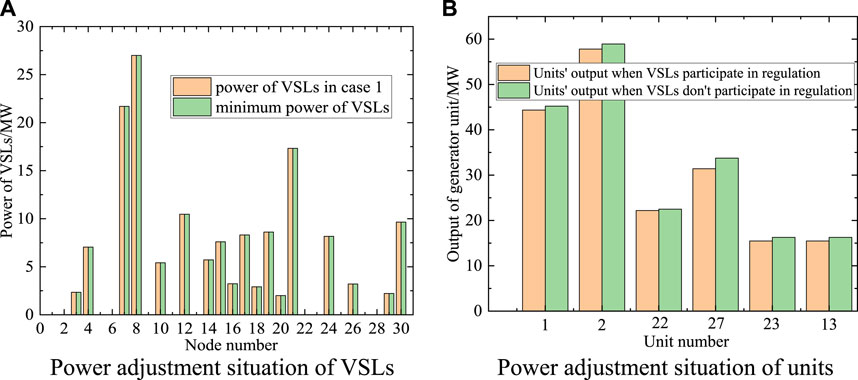
FIGURE 6. VSLs power adjustment and generator units output under Case-1.
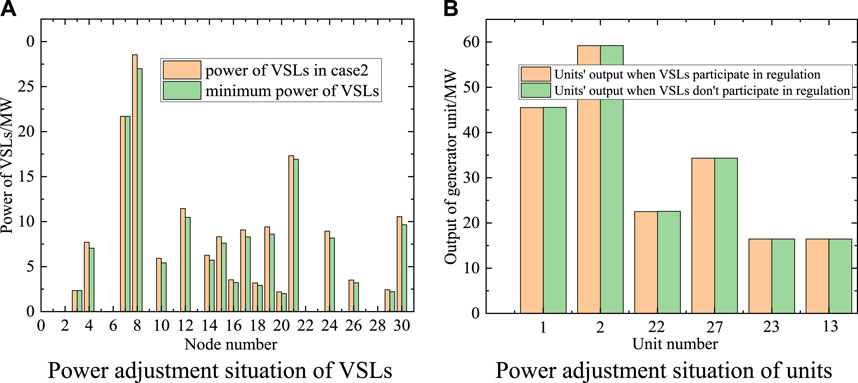
FIGURE 7. VSLs power adjustment and generator unit outputs under Case-2.
5 Conclusion
Considering the real-time power imbalance caused by fluctuations in renewable energy output and prediction errors, this paper proposes a real-time economic scheduling strategy for VSLs. Firstly, considering the power-voltage coupling relationship of VSLs, the ZIP model is used to characterize its electricity consumption characteristics. Meanwhile, the integration of renewable energy and voltage control will further reduce the level of voltage safety. In order to ensure voltage safety during the regulation process, VSM index are designed and included in the VSLs’ evaluation scheduling model. Then, considering the non-convex and nonlinear characteristics of the model, a sensitivity analysis method is used to linearize at the current operating point, thus transforming the initial complex nonlinear programming problem into a linear programming problem to meet the needs of real-time online computing. Finally, the scheduling potential of VSLs is verified and analyzed through an improved IEEE-30 node system. Analysis shows that:
(1) VSL has great scheduling potential. Under the premise of ensuring system voltage safety, the power regulation range of VSLs accounts for about 9% of the total power in the base-state operating scenario;
(2) The selection of VSM index will have an impact on the control range of VSLs: under different VSM values, the maximum upper regulation power remains basically unchanged, but the maximum lower regulation power decreases as the value of VSM index decreases. For power system dispatchers, VSN index should be reasonably selected to avoid overly conservative decisions leading to unsolvable optimization problems;
(3) VSLs’ flexibility resources can be seen as backup flexibility resources for traditional units. By reducing VSLs’ own electricity consumption, it fills the power shortfall in the real-time scheduling stage and reduces the added output of generator units.
Data availability statement
The original contributions presented in the study are included in the article/Supplementary material, further inquiries can be directed to the corresponding author.
Author contributions
CZ: Data curation, Methodology, Project administration, Writing–original draft, Writing–review and editing. JJ: Formal Analysis, Methodology, Writing–original draft, Writing–review and editing. CC: Data curation, Methodology, Writing–original draft, Writing–review and editing. HY: Conceptualization, Methodology, Resources, Software, Writing–original draft, Writing–review and editing. DY: Conceptualization, Formal Analysis, Software, Writing–original draft, Writing–review and editing. ZL: Formal Analysis, Methodology, Resources, Writing–original draft, Writing–review and editing.
Funding
The author(s) declare financial support was received for the research, authorship, and/or publication of this article. This research was funded by Southern Power Grid Co., Ltd. Technology Project “Research and application of cloud edge collaboration and interoperability technology in new power systems,” No. 032000KK52220010.
Conflict of interest
Authors CZ, CC, and HY were employed by Zhongshan Power Supply Company of Guangdong Power Grid Co., Ltd. Author JJ was employed by Guangdong Power Grid Co., Ltd. Authors DY and ZL were employed by Southern Power Grid Digital Grid Research Institute Co., Ltd.
Publisher’s note
All claims expressed in this article are solely those of the authors and do not necessarily represent those of their affiliated organizations, or those of the publisher, the editors and the reviewers. Any product that may be evaluated in this article, or claim that may be made by its manufacturer, is not guaranteed or endorsed by the publisher.
References
Chen, X., Zhang, Y., Huang, Z., and Xie, S. (2023). Double layer robust economic dispatch of distribution networks and multi microgrids considering node marginal electricity prices. Power Autom. Equip. 43 (11), 51–58. doi:10.16081/j.epae.202301004
Dai, X., Chen, H., Xiao, D., and He, Q. (2022). A review of the application and research of industrial demand response technology in the electricity market environment. Power Grid Technol. 46 (11), 4169–4186. doi:10.13335/j.1000-3673.pst.2022.1328
De Steese, J. (1987). Assessment of conservation voltage reduction applicable in the BPA service region. United States: Bonneville Power Administration.
Diaz, A., Sandraz, J., Macwan, R., de Leon, F., Czarkowski, D., Comack, C., et al. (2013). Field-validated load model for the analysis of CVR in distribution secondary networks: energy conservation. IEEE Trans. Power Deliv. 28 (4), 2428–2436. doi:10.1109/tpwrd.2013.2271095
Dwyer, A., Nielsen, R. E., Stangl, J., and Markushevich, N. S. (1995). Load to voltage dependency tests at BC hydro. IEEE Trans. Power Syst. 10, 709–715. doi:10.1109/59.387907
Faddel, S., Sun, Q., and Tian, G. (2022). Modeling and coordination of commercial buildings in distribution systems. IEEE Trans. Industry Appl. 58 (2), 1654–1663. doi:10.1109/tia.2022.3145768
Ge, X. (2022). Research on auction strategy for load side flexibility adjustment resources. China: Shandong University.
Herath, P., and Venayagamoorthy, G. K. (2021). Scalable residential demand response management. IEEE Access 9, 159133–159145. doi:10.1109/access.2021.3119270
Jin, H. Y., Li, Z. S., Sun, H. B., Guo, Q., and Wang, B. (2018). A two-stage reactive power optimization in transmission network incorporating reserves from voltage-dependent loads. Energy 157, 752–763. doi:10.1016/j.energy.2018.05.112
Kessel, P., and Glavitsch, H. (1986). Estimating the voltage stability of a power system. IEEE Trans. Power Deliv. 1 (3), 346–354. doi:10.1109/tpwrd.1986.4308013
Kong, X., Wang, Z., Liu, C., Zhang, D., and Gao, H. (2023). Refined peak shaving potential assessment and differentiated decision-making method for user load in virtual power plants. Appl. Energy 334, 120609–120618. doi:10.1016/j.apenergy.2022.120609
Lauria, D. (1987). Conservation voltage reduction (CVR) at Northeast utilities. IEEE Trans. Power Del. 2, 1186–1191. doi:10.1109/tpwrd.1987.4308241
Lezama, F., Soares, J., Canizes, B., and Vale, Z. (2020). Flexibility management model of home appliances to support DSO requests in smart grids. Sustain. Cities Soc. 55, 102048. doi:10.1016/j.scs.2020.102048
Li, D., Zhang, K., Yao, Y., and Lin, S. (2022). A daily demand response scheduling strategy for electric vehicle aggregators based on information gap decision theory. Power Syst. Prot. Control 50 (24), 101–111. doi:10.19783/j.cnki.pspc.220181
Li, G., Liu, G., Hou, L., Jin, L., and Yang, Y. (2019). A quantitative evaluation method for the impact of multiple OLTC coordinated actions on voltage stability. Power Autom. Equip. 39 (07), 154–160. doi:10.16081/j.issn.1006-6047.2019.07.023
Li, W., Han, R., Sun, C., Fu, P., Zhang, J., and Wang, C. (2021). The optimal incentive contract and incentive strategy for shiftable load participation in demand response based on electricity consumption preferences. Chin. J. Electr. Eng. 41 (S1), 185–193. doi:10.13334/j.0258-8013.pcsee.202593
Lv, S., Ye, L., Li, J., Yang, J., Zheng, C., and Chen, Z. (2018). A medium to long-term voltage stability evaluation index that takes into account the dynamic regulation effect of on load tap changer transformers. J. Electr. Power Sci. Technol. 33 (03), 86–92.
Rassaei, F., Soh, W., and Chua, K. (2015). Demand response for residential electric vehicles with random usage patterns in smart grids. IEEE Trans. Sustain. Energy 6 (4), 1367–1376. doi:10.1109/tste.2015.2438037
Ren, X., Zhang, Z., Xu, L., W, S., Liu, Z., and Xu, F. (2022). Layered energy system optimization scheduling considering the demand response of electric vehicles and temperature control loads. Electr. Power Constr. 43 (9), 77–86.
Schneider, I., Roozbehani, M., and Dahleh, M. (2022). An online learning framework for targeting demand response customers. IEEE Trans. Smart Grid 13 (1), 293–301. doi:10.1109/tsg.2021.3121686
Shi, J., Zhang, Z., Yang, Y., Liu, J., Jiang, Z., and Shan, X. (2022). Design and empirical analysis of building load demand response system scheme. Power Demand Side Manag. 24 (3), 60–65.
Short, T. A., and Mee, R. W. (2012). “Voltage reduction field trials on distributions circuits,” in Proc. 2012 IEEE PES Transmission and Distribution Conf. Expo, Orlando, Florida, USA, 7 - 10 May 2012, 1–6.
Tang, W., Zhang, Y., and Qian, T. (2023). Integrated building cluster distribution network optimization control considering distribution network reconstruction and building cluster active demand response. Chin. J. Electr. Eng. 43 (08), 2966–2979.
Tang, X., Hasan, K., Milanovic, J., Bailey, K., and Stott, S. J. (2018). Estimation and validation of characteristic load profile through smart grid trials in a medium voltage distribution network. IEEE Trans. Power Syst. 33 (2), 1848–1859. doi:10.1109/tpwrs.2017.2740563
Wang, S., Bi, S., and Zhang, Y.-J. A. (2018). Demand response management for profit maximizing energy loads in real-time electricity market. IEEE Trans. Power Syst. 33 (6), 6387–6396. doi:10.1109/tpwrs.2018.2827401
Wang, S., Wang, H., Zhao, Q., Liu, Q., Guo, L., and Zhang, S. (2023). Time of use electricity price optimization method for improving the photovoltaic acceptance capacity of distribution networks. Power Syst. Autom. 47 (10), 38–46.
Wang, Z., and Wang, J. (2014). Review on implementation and assessment of conservation voltage reduction. IEEE Trans. Power Syst. 29 (3), 1306–1315. doi:10.1109/tpwrs.2013.2288518
Wei, Q., Liao, Z., Song, R., Zhang, P., Wang, Z., and Xiao, J. (2021). Self-learning optimal control for ice-storage air conditioning systems via data-based adaptive dynamic programming. IEEE Trans. Industrial Electron. 68 (4), 3599–3608. doi:10.1109/tie.2020.2978699
Wen, L., Zhou, K., Feng, W., and Yang, S. (2024). Demand side management in smart grid: a dynamic-price-based demand response model. IEEE Trans. Eng. Manag. 71, 1439–1451. doi:10.1109/tem.2022.3158390
Wen, Q., Wei, Z., Zhang, Y., Liang, Z., and He, W. (2023). Optimizing operations of electricity selling companies considering insurance mechanisms and user demand response. Electr. Power Constr. 44 (1), 47–54.
Williams, B. (1995). Distribution capacitor automation provides integrated control of customer voltage levels and distribution reactive power flow. Proc. IEEE Power Ind. Comput. Appl. Conf. 1995, 215–220.
Wu, Y., Luo, Y., Lei, C., Huang, Y., Liang, Y., Zhou, S., et al. (2022). Static voltage stability evaluation of power systems containing wind farms based on improved PEM and L index. China Electr. Power 55 (09), 192–203.
Yong, P., Zhang, N., Ci, S., and Kang, C. (2021). 5G communication base station participation in demand response: key technologies and prospects. Chin. J. Electr. Eng. 41 (16), 5540–5552. doi:10.13334/j.0258-8013.pcsee.210183
Yu, B., Weng, L., Lian, D., Wang, S., Huang, Y., and Yao, H. (2023). A coordinated operation strategy for distributed resource parks that takes into account price guidance mechanisms. Electr. Power Constr. 44 (2), 145–154.
Zeng, X., Yang, P., Liu, L., Yang, K., and Tan, J. (2022). Optimization and control strategies for electric vehicle charging and swapping stations in the electricity spot market environment. Power Autom. Equip. 42 (10), 38–45. doi:10.16081/j.epae.202208018
Zhang, G., Tan, S., and Wang, G. (2018). Real-time smart charging of electric vehicles for demand charge reduction at non-residential sites. IEEE Trans. Smart Grid 9 (5), 4027–4037. doi:10.1109/tsg.2016.2647620
Keywords: voltage sensitive loads (VSLs), ZIP model, voltage safety margin, two-stage linear dispatching model, real-time power balance
Citation: Zhang C, Jiang J, Cai C, Yu H, Yang D and Li Z (2024) Optimal economic dispatching strategy for power systems considering distributed controllable load clusters. Front. Energy Res. 12:1364395. doi: 10.3389/fenrg.2024.1364395
Received: 02 January 2024; Accepted: 29 January 2024;
Published: 15 February 2024.
Edited by:
Yuanxing Xia, Hohai University, ChinaReviewed by:
Yongli Ji, Nanjing Institute of Technology (NJIT), ChinaYixing Ding, Nanjing Tech University, China
Copyright © 2024 Zhang, Jiang, Cai, Yu, Yang and Li. This is an open-access article distributed under the terms of the Creative Commons Attribution License (CC BY). The use, distribution or reproduction in other forums is permitted, provided the original author(s) and the copyright owner(s) are credited and that the original publication in this journal is cited, in accordance with accepted academic practice. No use, distribution or reproduction is permitted which does not comply with these terms.
*Correspondence: Chunmei Zhang, MjkxNDE1OTJAcXEuY29t