 Sai Sasidhar Punyam Rajendran*
 Alemayehu Gebremedhin
- Department of Manufacturing and Civil Engineering, Norwegian University of Science and Technology, Gjøvik, Norway
Multi-energy microgrids (MEM) are a new class of power grids focusing on the distributed form of generation and integrating different energy sectors. The primary idea of MEM is to increase renewable energy share in the final energy demand while maintaining the energy balance at all times. However, integrating renewable technology into the grid has some technical limitations that must be analyzed before being deployed in the real world. This study examines the impact of increasing renewable penetration and portfolio design on a multi-energy microgrid energy system from a technical standpoint. As the accuracy of the system analysis is primarily a factor of modeling accuracy, an artificial neural network-based model is trained and deployed to develop forecasts for solar power generation. The forecasting model is integrated with the EnergyPLAN simulation tool to analyze the multi-energy microgrid system regarding renewable share in primary energy consumption and import/export of energy from the primary grid. The Norwegian energy system is considered a case study, as the energy generation and consumption patterns are interesting from both renewable energy and demand contexts for a cold country. One interesting conclusion is that the portfolio and capacities of coupling components such as combined heat and power plants negatively impact renewable integration, while heat pumps positively impact renewable integration by increasing renewable energy utilization. Additionally, the photovoltaic system size has a high degree of correlation to imports and exports compared to wind generation systems.
1 Introduction
Climate change has forced us to reconsider the conventional means of meeting the energy demand, using fossil fuels, and stimulated research to develop clean and sustainable energy systems (Sorrell, 2015). Generation of electrical energy from renewable sources has been an attractive option as they have minimal emissions and are available indefinitely. Recent advancements, such as reduced manufacturing costs, improved design, new battery technologies, better control strategies, and incentives provided by the government, have promoted the installation of renewable systems. However, some economic and technological challenges exist when integrating renewable systems into the grid, such as high investment costs, intermittent generation, the need for batteries to provide temporal support, and dependence on the climate and geographical location (Ahmed et al., 2020). All these factors have made the grid integration of renewable energy systems a challenge and an exciting research area.
The current electric distribution grids cannot handle renewable integration as they are primarily designed for centralized power generation (Lopes et al., 2007). Consider the generation profile of photovoltaic (PV) systems, which reach peak power production close to noon. If most households are equipped with PV systems and the excess electrical generation is fed to the grid, this will lead to grid instability. These issues have led to a concept called the weak grid, which is the inability of the grid to handle the forced injection of excess renewable generation (Alam et al., 2020). Instead of injecting the power into the grid, there is also an option to discard the excess generation, known as renewable curtailment, which is not an energy-efficient solution.
Much research has been dedicated to efficiently accommodating excess renewable generation, reducing renewable curtailment, and improving the overall energy efficiency. One optimal strategy is to diversify the generation portfolio with some non-renewable systems, such as diesel generators and micro-turbines, and auxiliary components, such as energy storage systems. Microgrids are a class of distribution grids that can efficiently coordinate renewable energy systems by designing energy management strategies to improve reliability, resilience, security, and efficiency (Hussain et al., 2019).
The concept of microgrids was further extended to multi-energy microgrids (MEMs) integrating multiple energy sectors such as electrical, transportation, heating, and cooling sectors, reducing emissions and energy wastage (Perry et al., 2008; Bartolini et al., 2020). Coupling components such as combined heat and power (CHP), heat pumps, and electric boilers couple electrical and heating sectors, while electric vehicles and charging stations couple electrical and transportation sectors (Calise et al., 2021). Heat pumps and electric boilers efficiently convert the excess renewable generation and store it in heat storage systems, which are 50 times cheaper than battery storage systems (Aydin et al., 2015). Vehicle-to-grid and vehicle-to-building technologies enable electric vehicles to act as mobile energy carriers and support the grid in times of need. All these factors show that integrating multiple energy sectors increases the synergy of the system and improves the energy efficiency by reducing wastage.
Even though MEMs are an effective solution to developing sustainable and clean energy systems, designing such systems is challenging because of the underlying coupling characteristics and the complex interaction between components with diverse operating characteristics (Zhou et al., 2021). The installation cost of MEM is high; therefore, there is a need to evaluate the energy system in terms of the technical and economic feasibility. Hence, in the planning phase of MEMs, a feasibility analysis is critical in evaluating the cost and assessing the risk based on the existing infrastructure, available renewable generation, energy demand, and consumption patterns (Martínez Ceseña et al., 2018).
1.1 Literature study
An energy system can be analyzed in different aspects such as technical, economic, environmental, social, reliability, sustainability, and resilience. Vidal-Amaro et al. (2015) studied the Mexican energy system and designed the portfolio to reduce the dependence on fossil fuels. In contrast, the energy system of Pecs was analyzed in Kiss (2015) from the sustainability, energy security, and affordability perspectives. Sandvall et al. (2015) focused on utilizing the excess heat to reduce the generation of biomass-based CHP and the net CO2 emissions. Eales et al. (2018) focused on the technical assessment of the solar-based microgrid in a developing country, Malawi. One intriguing observation is that the expected energy usage is five times higher than the designed energy limit. Hence, the forecast of energy usage in developing countries is highly uncertain and should be considered when designing the supply in the early stage. An interesting case study developed in Ahmad and Alam (2017) proved that operating the PV and storage systems in grid-connected modes is the most optimal choice from economic and environmental perspectives.
Abdilahi et al. (2014) analyzed a Somaliland urban area to reduce the energy cost and increase renewable penetration. One significant finding is that increasing the renewable penetration by 58% decreased energy costs by 30% and net present cost by 25% compared to the diesel-based microgrid. Singh et al. (2016) focused on developing a feasibility study to design a cost-effective microgrid energy system and determined the optimal capacities of the PV, wind, battery, and biomass energy systems to meet the load for a rural area. The energy system was also simulated for a critical case, such as the loss of an energy source, and the system performance was still satisfactory. In contrast, Orhan et al. (2014) performed feasibility studies for islands in Australia from both economic and environmental perspectives. Sahoo et al. (2015) focused on analyzing a solar-based microgrid for an educational institution to reduce fuel costs and emissions and increase renewable usage by 50%.
A life cycle assessment study was developed in Li et al. (2016) for an industrial microgrid in China. The study analyzed the impact of increasing renewable penetration on reliability, emissions, and improved energy efficiency by utilizing the local waste heat. There was a significant reduction in energy usage by 57% and emissions by 66% compared to the existing system, only if there are no restrictions in the land area where renewables are deployed. According to the study by Parag and Ainspan (2019), the net benefits to the Israeli economy by moving from conventional power generation to microgrids are approximately 13 million dollars. Adefarati and Bansal (2019) analyzed the role of green technologies, such as renewables, and assessed in terms of life cycle cost and emissions and reliability indices.
Most of the studies focused on the energy system’s performance in terms of economics and emissions. However, increasing the renewable capacity causes some technical issues because of its intermittence, and the required measures have to be taken in the design stage to ensure performance is maintained. Hence, this study analyzes the MEM to improve the system performance regarding sustainability, grid stability, and energy utilization.
One essential requirement in performing the analysis is the development of mathematical models that can help analyze the energy system and its performance in the real world. However, no such mathematical models can represent the real-world scenario 100%. Notably, modeling renewable energy systems is challenging because the generation depends on many factors such as weather, cloud coverage, wind speed, geographical location, and design (Ahmed and Khalid, 2019). Much research has been dedicated to developing forecasting models to predict renewable generation and design the energy system’s size, dispatch strategies, and market operation.
Different modeling techniques have been used to develop mathematical models that can be used for solar power forecasting, such as physical, statistical, spatial correlation, probabilistic, and intelligent models (Ahmed and Khalid, 2019). Physical forecasting models are better for short-term predictions and use physical parameters instead of historical data and complex meteorological models. Studies (Dolara et al., 2015; Mayer and Gróf, 2021) extensively review the physical forecasting models used in energy system analysis. In contrast, statistical models use mathematical models that use historical data to detect a pattern or relationship in the data using time series models such as curve fitting, moving average (Pascual et al., 2015), and auto-regressive models (Louzazni et al., 2020). A combination of auto-regressive and moving averages, called ARMA, has proved to give a better trade-off in performance (Huang et al., 2012). However, when the forecasting horizon of these models is large, the model performance decreases (Ahmed and Khalid, 2019). Another commonly used forecasting model is probabilistic-based modeling. The solar power generation is represented using a normal distribution function, and the parameters are estimated using the historical data (Waqar et al., 2019).
Even though the above models have successfully predicted solar generation within acceptable forecasting accuracy, when the renewable penetration is high in an energy system, much better forecasting models are needed to capture the complex relationships between multiple factors. This is where intelligent forecasting models such as machine and deep learning excel. Deep learning models have been phenomenal compared to machine learning algorithms as they can handle massive quantities of data, model non-linearity, and capture complex patterns. As they extract the features automatically, their performance is relatively high (Dargan et al., 2020). Moreover, with recent advancements in smart metering technology, the data availability has increased, which improves the modeling accuracy.
Wazirali et al. (2023) have provided a detailed review of the application of intelligent modeling techniques for energy and load forecasting. Rodríguez et al. (2018) developed an artificial neural network (ANN)-based solar power prediction model for microgrid control. Netsanet et al. (2016) used the ANN modeling technique to develop a PV power forecasting model. Additionally, the prediction accuracy was improved by correlation analysis, sensitivity analysis, and Garson’s algorithm to find the optimal parameters of the ANN. Moreira et al. (2021) focused on developing a PV forecasting model for the energy management of microgrids using the ANN ensemble and applied mixture design of experiment (MDE) technique to find the best networks for the ensemble. The fuzzy logic-based model was developed for pre-processing the dataset and improving the prediction accuracy of the ANN model in Sivaneasan et al. (2017). A long short-term memory network, a specialized variant of the class recurrent neural network, was employed to construct the PV forecasting model, as detailed in Qing and Niu (2018). Further advancements were made by researchers in Wen et al. (2019), who expanded this approach for load forecasting and formulated an optimal strategy for microgrid load dispatch.
A detailed review of the modeling techniques and tools for multi-energy systems is provided by Klemm and Vennemann (2021). Among the 13 identified tools, only EnergyPLAN and oemof are notable for their capacity to consider various assessment criteria, including economic, emissions, energy efficiency, and social aspects. Software tools such as HOMER (Abdilahi et al., 2014; Orhan et al., 2014; Kumar et al., 2019), energyPRO (Kiss, 2015), and DER-CAM (Stadler et al., 2014; Jung and Villaran, 2017; Mashayekh et al., 2017) were applied to develop cost-efficient energy systems. EnergyPLAN was the tool of choice for two case studies in Østergaard (2012); Østergaard (2013). The former case study validated the role of compression heat pumps in efficient wind power integration, while the latter analyzed the role of different energy storage systems. Prina et al. (2019) integrated a multi-objective evolutionary algorithm and EnergyPLAN for the long-term planning of the Italian energy system. A solar energy-based MEM planning model for Iran was developed using EnergyPLAN in Noorollahi et al. (2021). Herc et al. (2022) integrated EnergyPLAN and python-based optimization software EPLANopt to design the energy system.
However, most studies have given little importance to renewable forecasting accuracy when analyzing the energy system. Hence, this study mainly focuses on developing an accurate ANN-based forecast model and integrating it into a simulation tool to study the MEM. Section 2 briefly discusses the methodology designed in the study. Section 3 discusses the modeling of ANN-based solar power forecasting and the EnergyPLAN simulation tool to evaluate the MEM energy system. Section 4 discusses the forecasting model performance and developed scenarios to assess the MEM from a technical standpoint. Section 5 concludes with some critical insights from this study.
2 Methodology
Analyzing the energy system before installing it can help understand its performance and plan some energy strategies and policies to improve sustainability of the energy system. Remarkably, the impact of a higher share of renewable energy systems in terms of grid stability, reduction in emissions, and cost-effectiveness has to be studied thoroughly. Figure 1 shows the different steps involved in developing a solar power forecasting model and analyzing the MEM system using the EnergyPLAN simulation tool.

FIGURE 1. Steps in developing the solar power forecasting model and integrating it with the EnergyPLAN simulation tool.
2.1 Artificial neural network
ANNs belong to the class of deep learning with an architecture that, to some degree, mimics the neurons in the human brain. A general architecture of ANNs contains neurons arranged in layers connected by weights. The data are input to the model, and in the training phase, the weights of the connections are updated based on the optimization algorithm, such as the stochastic gradient, to minimize the training loss. Figure 2 shows an example of a simple feed-forward ANN with a single hidden layer, and the output of a node j in layer i is given by Eq. 1 (Wen et al., 2019):
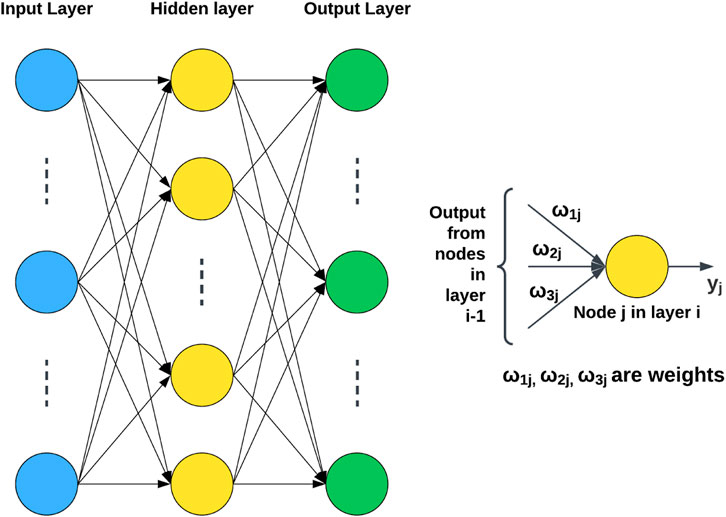
FIGURE 2. Simple feed-forward network with one input, hidden, and output layer.
where f is the activation function and ωkj is the weight connecting the nodes j and k in layers i and i − 1. yk is the output from node k in layer i − 1, θj is the bias of node j, and n is the total number of nodes in layer i − 1. After calculating all the outputs, the error is calculated by Eq. 2 (Wen et al., 2019):
yp is the predicted or forecasted value, and ya is the actual value. The weight parameters are updated when processing all the samples in the training dataset using Eq. 3 (Wen et al., 2019), where γ is the learning rate.
The training phase is divided into three phases: the feed-forward phase, where the data are passed through all the layers and computations are performed using the weights. The output layer gives the final prediction based on learning the patterns from the data. The weights are adjusted using the back-propagation training algorithm based on the error between predicted and actual data. One key advantage of the ANN is the ability to capture the non-linear patterns in the data because, after the calculation from a single neuron, it is also passed through an activation function before feeding it to the next neuron.
2.2 EnergyPLAN simulation tool
A wide range of computer software applications has been deployed to model and analyze the energy system, and they fall under either the optimization or simulation category. Optimization methodologies that utilize an endogenous framework are considerably more intricate than simulation models that adopt an exogenous perspective.
EnergyPLAN is a freeware software program developed by a research group at Aalborg University. These are primarily used for modeling smart energy systems with multiple energy sectors and identify pathways to increase renewable energy share (RES), as shown in Figure 3. It is a deterministic and analytical simulation tool that helps analyze the energy system performance for high renewable penetration. The primary advantage of EnergyPLAN is that it provides multiple assessment criteria such as economy, energy efficiency, social, and emissions. In contrast, other software tools like HOMER, DER-CAM, and energyPRO only provide the option to analyze the system from a financial standpoint (Klemm and Vennemann, 2021). Moreover, according to Bouw et al. (2021), EnergyPLAN distinguishes itself from the other analysis tools by providing remarkable detail and consideration to modeling each sector, such as electricity, heating, cooling, industry, and transportation. This approach helps capture complex interdependencies, understand the synergy between multiple energy sectors, and develop energy strategies to reduce energy wastage.
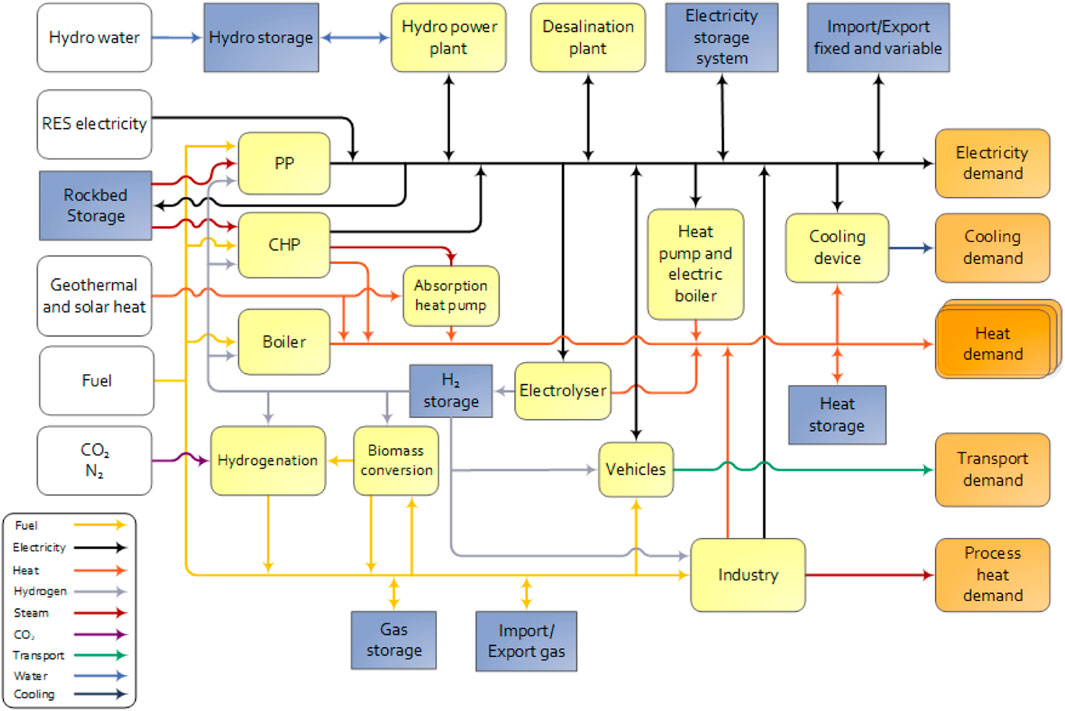
FIGURE 3. Technologies and energy flow on which EnergyPLAN is developed (Lund et al., 2021).
The EnergyPLAN simulation tool has a simple user interface and provides detailed models for energy components such as PV power, onshore and offshore wind power, CHP plants, wave power, hydro, heat pumps, concentrated solar power, tidal power, bio-based, and power-to-X technologies. The model simulates for 1 year with a 1-h resolution, and the user has to select the capacity and hourly distribution profiles for the components to analyze the system. Additionally, the user can also consider adding nuclear, geothermal, and waste incineration plants to the portfolio and assess the system. Energy demands such as electrical, heating, transportation, and industrial demands can be modeled, making the analysis more diverse.
EnergyPLAN allows the user to select between technical and economic optimization strategies to study the system performance for the designed portfolio. The units are dispatched based on the marginal cost and market profits in an economic optimization strategy. However, in the technical optimization strategy, the units are dispatched based on the pre-defined endogenous priority, giving preference to RES and minimizing the use of CHPs and boilers. The output of the EnergyPLAN simulation tool is the annual production, fuel consumption, import/export of electricity, total investment and operation costs, and carbon dioxide emissions aggregated over a year.
A detailed review and the application of EnergyPLAN across various geographical locations and research objectives are provided in Østergaard et al. (2022). An advanced analysis of the EnergyPLAN software tool is provided in Lund et al. (2021) that explains the algorithms and computational structure. The main advantage of EnergyPLAN is less computation time for the simulation and the pre-defined energy system models. For a feasibility study, the main objective is to study the existing system response to new policies, such as increased RES, adoption of new technologies, demand response, and management strategies. In this context, EnergyPLAN is selected as the tool for analyzing a MEM from a technical standpoint.
3 Model
3.1 Forecasting model
The dataset is the main requirement for developing an ANN-based forecasting model, and the model accuracy is a factor in the quality and quantity of the data. Solar power forecasting primarily comes under the supervised learning class, in which the dataset contains information such as weather elements that influence the generation and the corresponding generation value. The solar power generation data are collected from the solar panels installed on a campus building at NTNU, Gjøvik. The panels used are SunPower X20-327-COM1, comprising a total of 280 modules mounted on the flat roof at an inclination of 10° with the azimuth angles of 50° and −130°. The total PV area is 456.6 sq. m, with a peak power production of 91.56 kW. The corresponding weather data for this location are collected from the website2, which has 20 weather elements.
Basic analysis plots on the solar power generation data are shown in Figure 4, giving a basic understanding of the trend of the generation profile. Figures 4A, B give the generation profile for three random days in the month of April and the whole year. The figures indicate that solar power is susceptible to the time of the day, with generation reaching a peak at noon when there is abundant solar radiation and the season with the daily average being high in the summer. The correlation Figure 4C gives a basic understanding of the weather elements that impact solar power generation the most. It is clear that solar radiation, UV index, and temperature positively impact PV generation, while humidity and snow depth negatively affect PV generation.
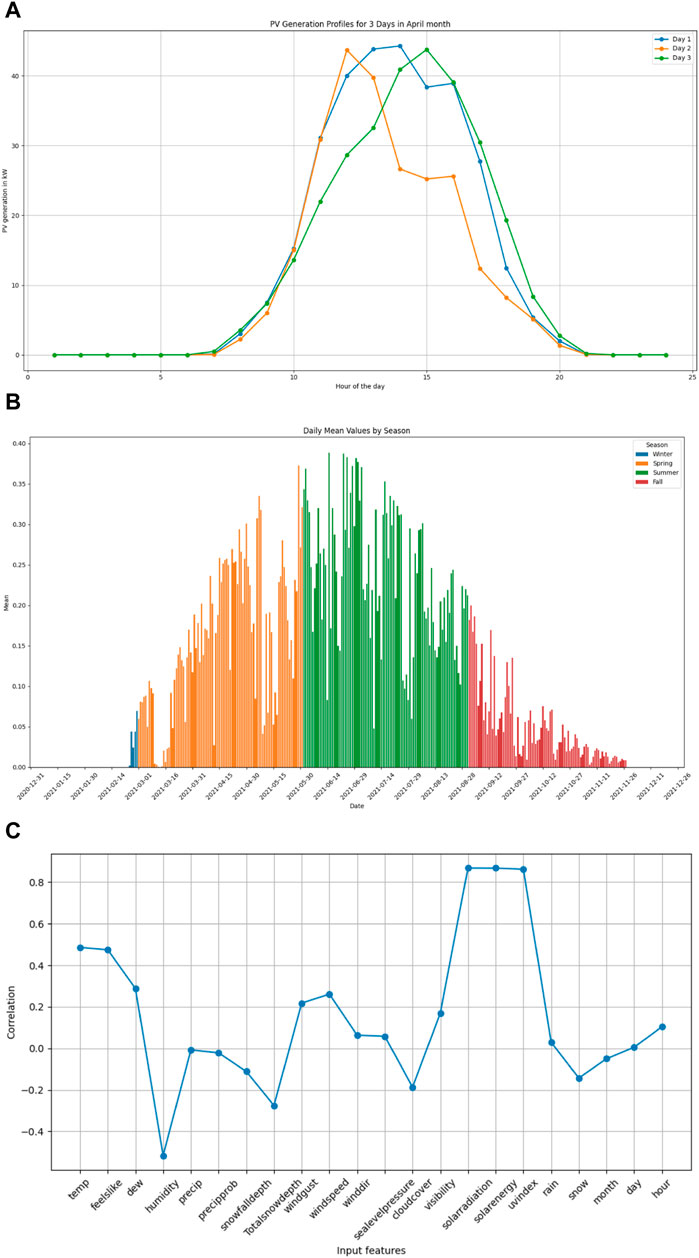
FIGURE 4. Basic plots on the PV power generation dataset. (A) Solar power generation profile for a period of 3 days in the month of April. (B) Solar power generation, averaged over the day, for a whole year classified based on the seasons. (C) Correlation plot between input features and solar power generation.
3.1.1 Model architecture
An ANN has one input and output layer, and the number of hidden layers controls the capacity and complexity of the model to handle data. After experimenting with different numbers of hidden layers, Figure 5 shows the ANN model with three hidden layers used in this study. Each node in the input layer represents an input feature, and there are a total of 26 input features that are used to train the model. Since the model is trained on solar power generation data collected over a year, there are 8,670 samples. Of these samples, 75% is used for training and the remaining for validation.
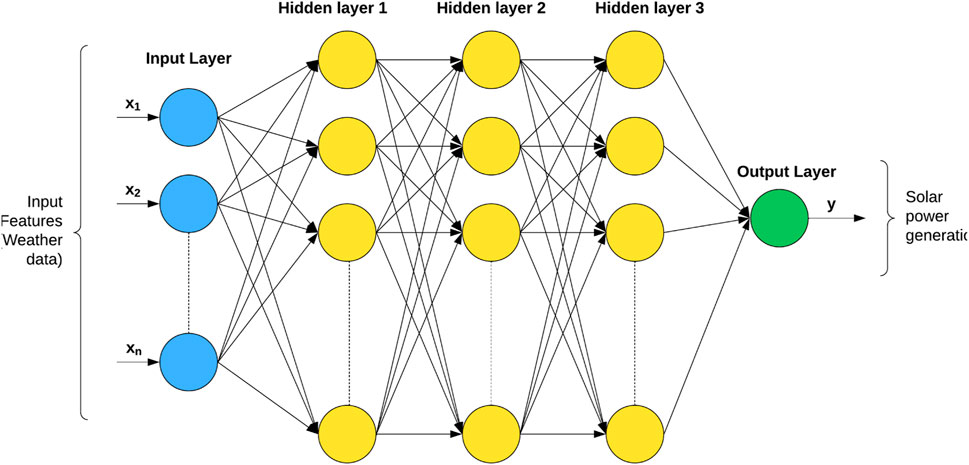
FIGURE 5. Schematic representation of the artificial neural network with three hidden layers.
3.1.2 Model regulations
In the training phase of the ANN-based forecasting model, the following regulations are adopted to improve the model performance. Since the input features have different units and scales, to avoid bias to certain input features and improve convergence, normalization is done to convert training data into scalar by using Eq. 4, where xi is the original value, and min and max are the minimum and maximum values of the corresponding variable, respectively.
Overfitting is a common issue in the model training phase and is more profound if the data have much noise. Hence, a dropout layer is added to improve the model performance on the unseen data. ANNs can automatically extract the features since solar power is specifically dependent on the season. An additional categorical column is added, determining whether the season is winter, summer, spring, or autumn, on which one hot encoding is done before inputting it to the model.
Adam optimizer is used to update the model weights as it performs better in convergence for larger datasets. Since the activation function is the parameter that can capture the non-linearity, the ReLu activation function is suitable for regression class problems and is used for the hidden layers. However, the sigmoid activation function is used for the output layer.
Model tuning is required to select which model has the best performance. Many factors affect the model performance, such as the number of hidden layers, learning rate, optimizer, number of neurons, and activation function. To perform a hyperparameter search, visualize, and document the training metrics, a Python library called wandb3 provides a sweep feature to assess the model performance for different combinations of hyperparameters. The search space used for hyperparameter tuning is shown in Table 1.

TABLE 1. Search space of hyperparameters.
3.1.3 Model evaluation
The developed machine learning model is regression-based. The most common metrics used for the model evaluation are mean absolute error (MAE), mean-squared error (MSE), root-mean-squared error (RMSE), and R-squared score. MAE, RMSE, and R-squared score are calculated based on Equations 5–8, where yi,
The lower the MAE and RMSE values, the better the model performance. R-squared score, or the coefficient of determination, is a much better metric to assess the fit of a regression model that quantifies how much variance in the target variable can be explained by the input variables. The value ranges from 0 to 1, and the closest score to 1 suggests the model has a better fit, meaning that the model can capture the underlying relation between the input features and the target variable.
3.2 EnergyPLAN model
In the last phase, the deep learning model developed in the above section is used to develop predictions and create a distribution file, which serves as the input to the EnergyPLAN simulation tool. The first input is the aggregated demand for a year and the corresponding distribution file. There is also an option to provide additional electrical demand, electric heating and cooling demand, flexible demand, and fixed import/export. The heating demand in EnergyPLAN can be classified as district heating and individual heating, consisting of micro-CHPs, boilers, solar thermal heating, heat pumps, and electric heating. Additional energy demand sectors such as cooling, industry, transport, and desalination can also be designed.
The user can select the renewable energy source, capacity, stabilization share, corresponding distribution file, and correction factor in the supply section. The capacities of CHP plants, boilers, compression heat pumps, and solar thermal inputs are designed for the thermal energy system. Electric and thermal storage systems can also be included in the portfolio to support the system in terms of need. The user can also select the type of fuel inputs to the generation systems. The investment and operational costs for all the energy components, fuel, and electricity market prices are updated in the model.
EnergyPLAN conducts technical energy system analysis in four stages, as shown in Figure 6. Initially, it calculates annual and hourly electricity production based on distribution files and capacities provided as the input. In the second stage, computations that do not involve electricity balancing, such as heat demand, non-flexible electricity demand, and heat provided by the industry, are done. In the third stage, a series of steps are carried out to give a solution to minimize fuel consumption. In the first step, the heat production from the renewable systems and waste heat from industry is given priority. Subsequently, electricity demand is adjusted based on flexible demand specified as an input to match the supply given certain constraints. If balancing the electrical supply and demand is selected as the operation strategy for the CHP, calculations in step 1 are replaced by an approach in which heat pumps are deployed at CHP plants to minimize the electricity export.
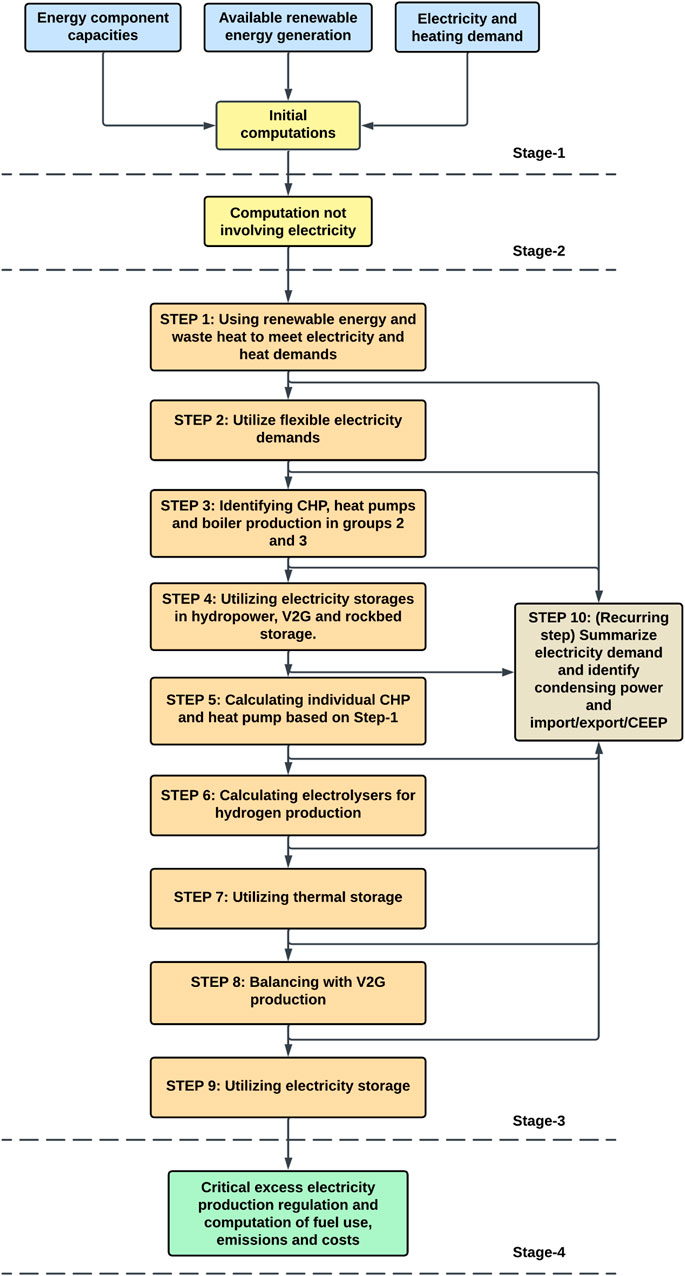
FIGURE 6. Flowchart of the EnergyPLAN technical simulation strategy (Lund et al., 2021).
Hydropower is optimized in step 4 to reduce the critical excess electricity production (CEEP) and exportable excess electricity production (EEEP). The operation of the electrolyzer and thermal storage system is optimized in steps 6 and 7 to reduce the CEEP and EEEP and improve the system’s flexibility. The vehicle-to-grid characteristic of electric vehicles is utilized in step 8 to balance the supply and demand further. Electricity storage is modeled as hydro storage, and the primary operating strategy is to avoid CEEP. In the final step, strategies to reduce the critical excess electricity production involve adjusting the renewable generation, CHP operations, implementing electric heating, CO2 hydrogenation, and giving priority based on user specification. In the final stage, EnergyPLAN computes all the energy system costs (operating costs and fuel costs), emissions, exports, and imports.
The output can be copied to a clipboard, displayed on a screen, or printed, and EnergyPLAN also offers the option to visualize the results graphically. There is also an option to run serial calculations for a single input for a different range of input values and select the output parameter to be tracked. Furthermore, the toolbox developed in Cabrera et al. (2020) is used to run multiple energy system scenarios with varying capacities of renewable energy systems and for different portfolios.
4 Results and discussions
4.1 Norwegian energy system
Exploring energy system design for cold climates offers valuable insights from both generation and demand perspectives. This paper focuses on Norway as a case study due to the distinct characteristics of PV generation in such regions. Notably, PV generation in Norway exhibits negligible output during certain winter days due to short daylight hours, limited solar irradiance, and snow accumulation on panels. Conversely, the energy demand in Norway during the winter months is high, predominantly due to the reliance on electric heating to satisfy the increased heating requirements.
Based on the report by Det Norske Veritas (DNV4), Norway has electrified almost 48% of its final energy consumption, and most of the power generation is from renewable hydropower, 92%. However, when considering only the residential sector, 53% of the energy is used for space heating and 20% for water heating. However, according to Statnett5, there will be an increase in the electric demand by 24 TWh by the year 2027. Following this, there is an additional investment of 60–100 billion NOK to increase electricity generation and upscale the electricity grid. Hence, adopting MEMs is beneficial as they can operate in a stand-alone mode, avoid additional investments in the transmission lines, and better handle the integration of renewables and prosumers.
The dataset designed in Berg and Löschenbrand (2022) is downloaded and analyzed for the Norwegian energy system. The readings from smart meters installed in Trøndeleg, Norway, are collected. The load dataset readings are at a 1-h resolution between 1 January 2015, 00:00 a.m. and 31 December 2015, 23:00 p.m. For security purposes, the readings are shown as a ratio to maximum load. Despite the dataset originating from 2015, our primary interest lies in the load profile which allows for its applicability. The wholesale electricity prices from Nord Pool are also provided in the energy dataset. The load profile, solar power generation profile, and electricity prices are converted into distribution files and used as input for the simulation.
4.2 Solar power forecasting
The ANN-based forecasting model developed in Section 3.1 is trained on PV generation data obtained from a university campus in NTNU, Gjøvik. The dataset consists of PV power output for 1 January 2020–31 December 2020, of which 75% is used to train the model and the remaining for testing. The model is tuned for different combinations of hyperparameters, and the model with the best performance in terms of R-squared score is selected. Figure 7 shows the selected model performance regarding the mean-squared error for the training and validation datasets. The R-squared score for the model on the test dataset is approximately 0.873, which shows that the ANN model has a good fit. The values of MAE, MSE, and RMSE are 0.0302, 0.0048, and 0.069, respectively. Figure 8 shows a comparison plot on the forecasted values and actual data.
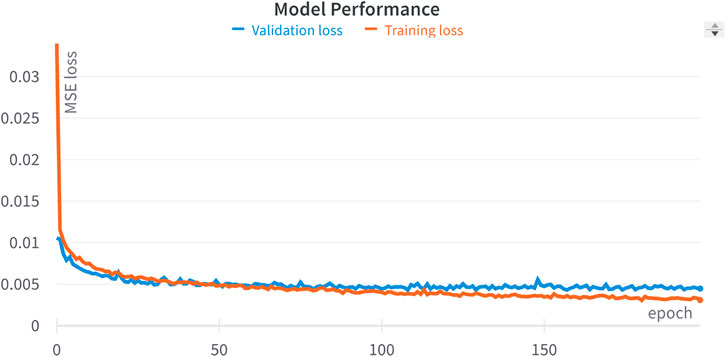
FIGURE 7. Analysis of model performance measured by mean-squared error (MSE) loss across epochs.
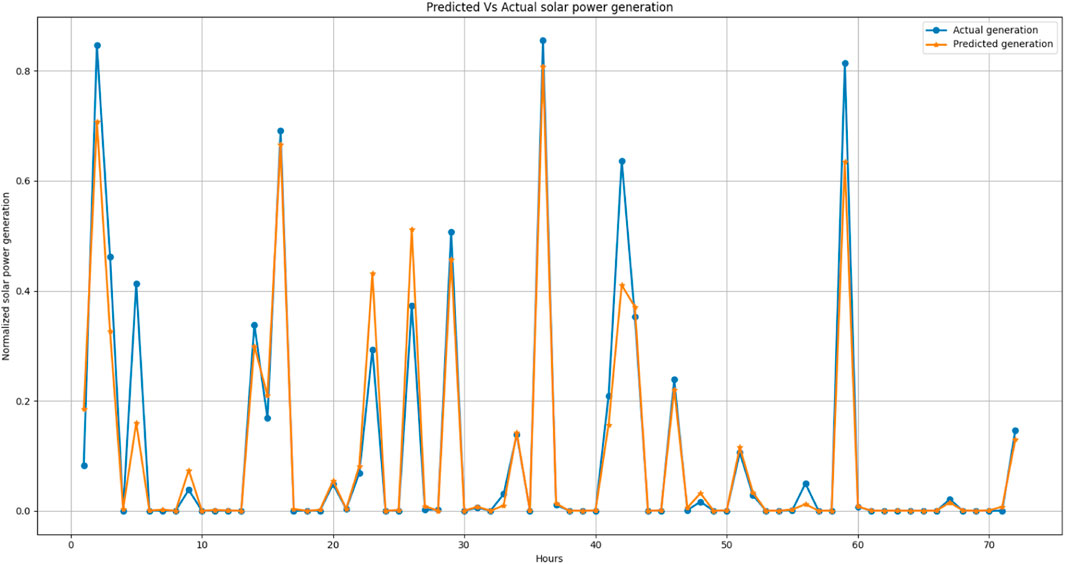
FIGURE 8. Comparison between the actual and forecasted power generation from the ANN model.
4.3 EnergyPLAN simulation
The main focus in this paper is to examine how the system performs when increasing the PV and wind capacities. Furthermore, it explores the potential benefits of integrating coupling components like CHP plants and heat pumps into the energy mix.
The total energy demand for a Norwegian household is established at 19.6 MWh/year6. Assuming the MEM services 50 residences, the aggregated electrical and heating consumption is estimated at 0.45 GWh/year and 0.57 GWh/year, respectively. This study develops four distinct scenarios with different portfolios, as shown in Table 2. In scenario A, the central district heating network is the only source for meeting heating needs. In contrast, scenarios B and C operate independently of the central district network, with CHP, HP, and auxiliary boilers meeting the heating demand. The scenarios are first modeled in the EnergyPLAN simulation tool and saved as a template. The MATLAB toolbox simulates the energy system for varying capacities of energy components, as shown in Table 3.

TABLE 2. Portfolio for developed scenarios.

TABLE 3. Capacities of energy components used in the study.
The output from the EnergyPLAN simulation tool, after developing the scenarios and running the simulation, includes annual costs, carbon emissions, import, export, fuel consumption, and renewable share. RES, import, and export are considered metrics to assess the performance of the MEM system for different scenarios. The outputs from the simulation are recorded and imported into Python to analyze the system results graphically and conclude.
4.3.1 Renewable energy share
RES can be considered from two different aspects: primary energy consumption and electricity production. As we consider the energy system as a whole, RES in primary energy consumption is considered in this analysis as it gives a clear idea of how renewable and clean generation meets the total energy demand (electrical and heating). The variation in the RES for scenarios A, B, and C is shown in Figure 9.
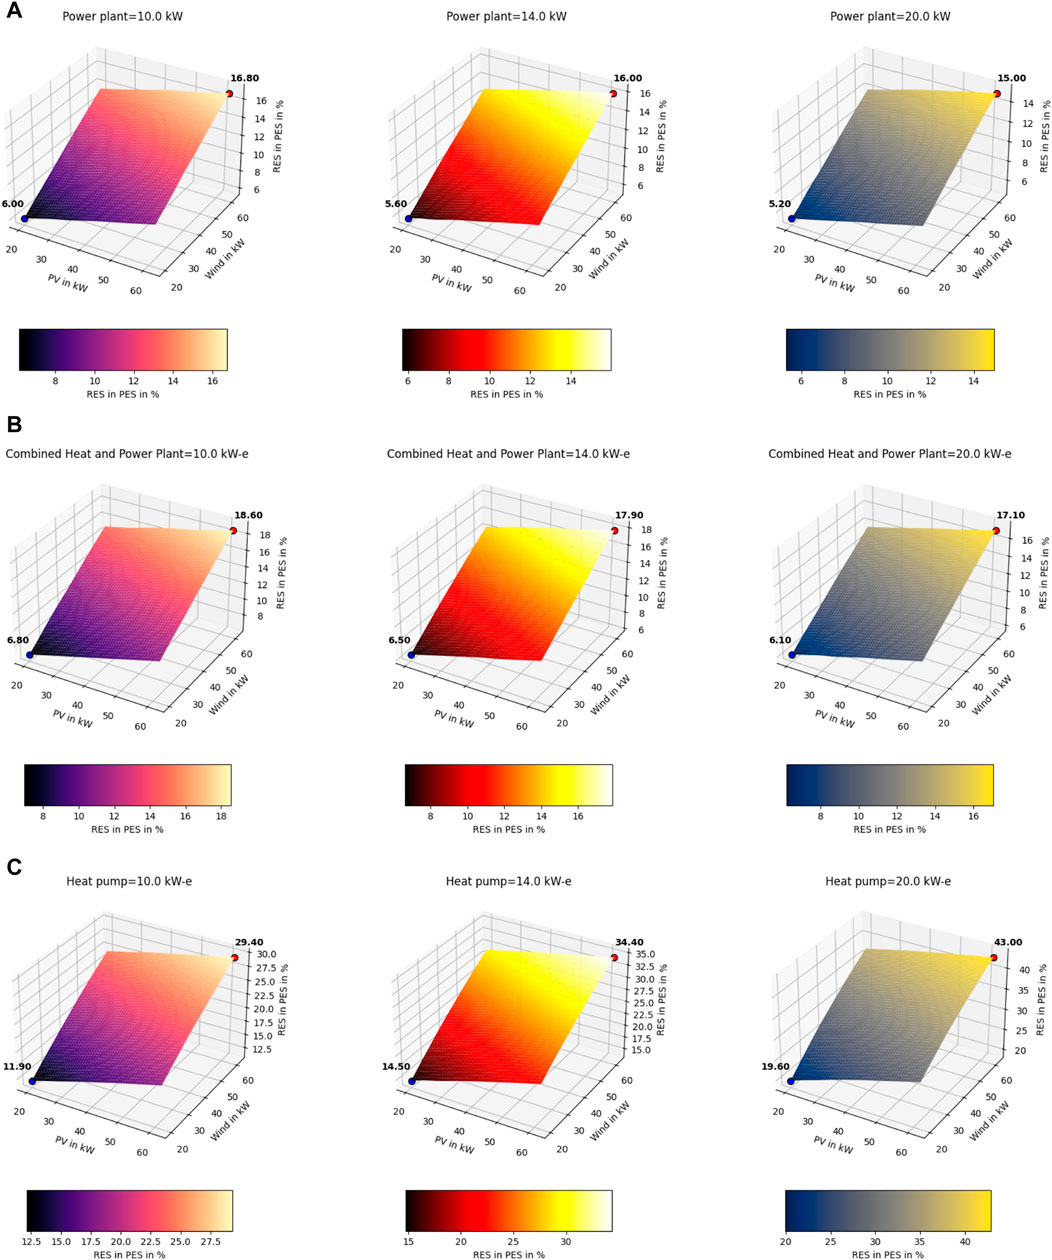
FIGURE 9. Assessment of renewable energy share in primary energy supply for scenarios (A), (B), and (C).
In scenario A, as depicted in Figure 9A, the RES decreases as the power plant capacity increases. A similar pattern is evident in scenario B, as illustrated in Figure 9B, which recorded the highest RES at 18.6% when CHP capacity is at the least. Conversely, scenario C, as demonstrated in Figure 9C, shows an upward trend in RES as heat pump capacity increases, achieving the highest renewable share among the scenarios at 43%.
An increase in power plant capacity, from 10 to 20 kW, led to a 10.71% reduction in the RES. Consequently, the increase in the CHP capacity decreases the RES by 8.06%. This suggests that increasing the CHP capacity has an inverse impact on the adoption of renewable energy. The reason is that since CHP systems are the primary heat source, power generation is relatively high due to the proportional relationship between electricity and heat generation in a CHP system.
When the heat pump capacity is increased from 10 to 20 kW-e, the increase in the RES is approximately 47%. This shows that heat pumps positively impact renewable energy utilization and reduce energy wastage. In addition, one key takeaway is that the increase in the RES is significantly higher with an increase in wind capacity compared to PV capacity.
4.3.2 Import
In the case of energy systems with high renewable penetration, one common issue is the need for import from the primary grid due to renewable technology’s uncontrollable, non-dispatchable, and intermittent nature. Particularly, since the PV generation is almost zero in the winter season, the high PV installations will have negligible power generation and require imports from the primary grid. This is particularly an issue when designing self-sufficient and sustainable energy systems. Hence, the energy import when the renewable share is increased must be studied in detail in the design stage to make optimal decisions on capacity. Figure 10 shows the energy imported from the primary grid for the developed scenarios.
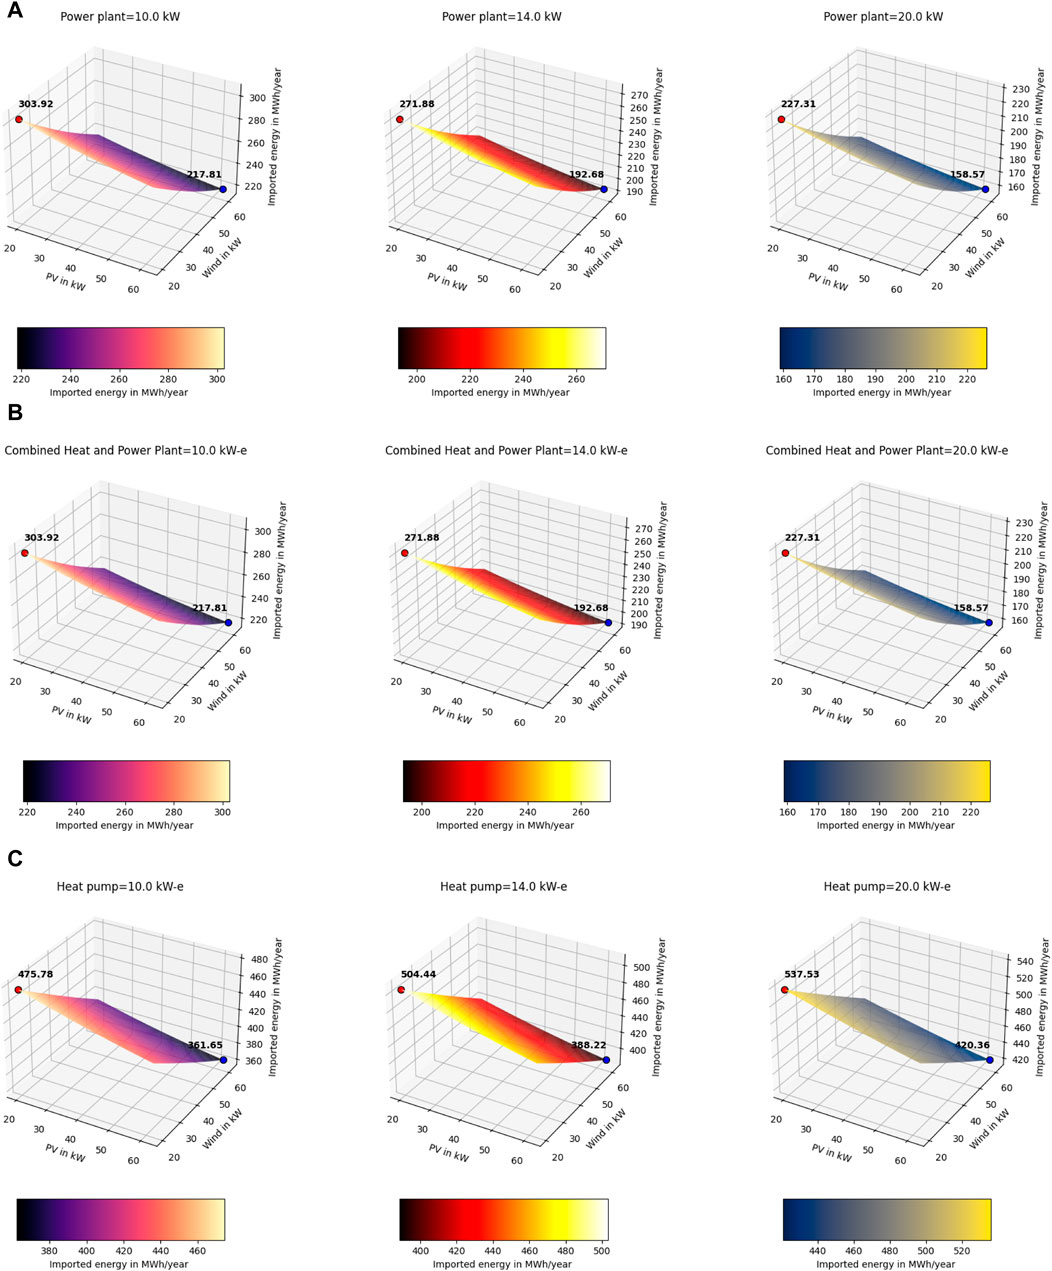
FIGURE 10. Assessment of imported energy from the main grid for scenarios (A), (B), and (C).
For scenarios A and B, as shown in Figures 10A, B, one observation is that the increase in the power plant and CHP capacity decreases the import from the primary grid. Interestingly, the energy import trend is the same, irrespective of having either power plant or CHP in the portfolio. For both scenarios, when the PV and wind capacity are increased from 20 to 62 kW, the decrease in the import is approximately 30%.
Conversely, as the heat pump capacity is increased in scenario C, as shown in Figure 10C, there is an increase in the import, with the highest import of all scenarios. The decrease in the imported energy when moving from high to low renewable penetration is approximately 24%. The primary reason for this phenomenon is that in scenario C, the heat demand is predominantly addressed by heat pumps and boilers, leading to an increased electrical demand compared to other scenarios where heat is supplied by a central district heating network or CHP systems.
4.3.3 Export
One of the primary advantages of having a grid-connected MEM is that the microgrid can provide grid stability at times of need. However, when excess electricity is exported to the primary grid, it will lead to grid instability and congestion as the primary grid is not designed to handle it. This issue is more profound in PV systems as the maximum generation is achieved at a particular time, leading to an issue of curtailment. Hence, when increasing the PV capacity, the impact on the export has to be analyzed, and measures have to be taken to ensure that the excess energy generation can be utilized locally instead of feeding it to the grid. This will reduce energy waste and improve renewable energy utilization. The variation in the energy exported for different scenarios is shown in Figure 11.
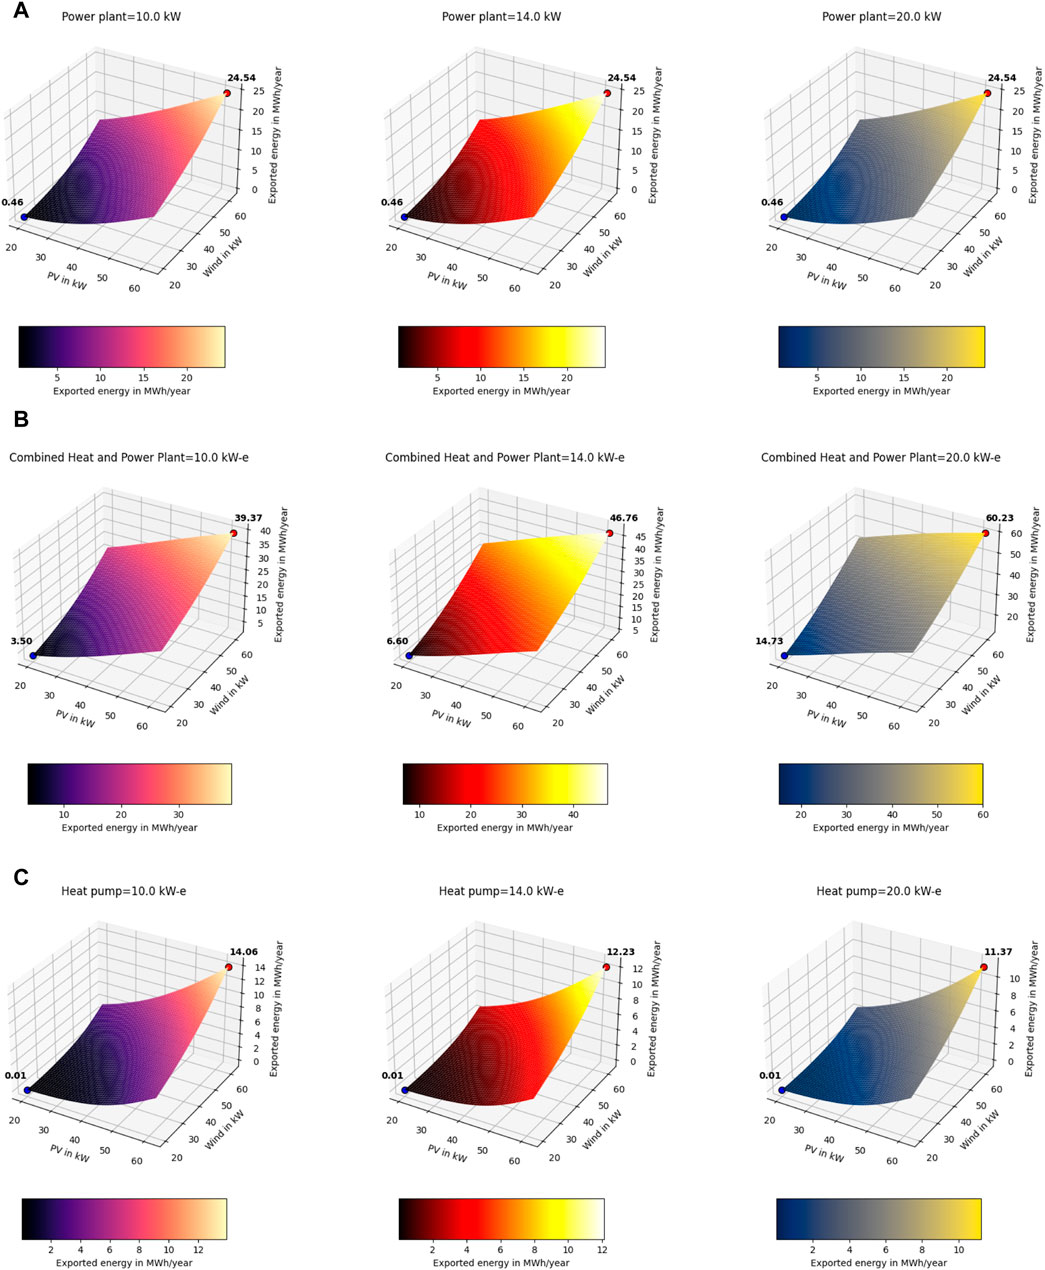
FIGURE 11. Assessment of exported energy to the main grid for scenarios (A), (B), and (C).
Since renewable energy is uncontrollable, all the exported energy is the excess renewable generation that cannot be utilized locally. In scenario A, as shown in Figure 11A, the increase in exports to the primary grid is solely due to the increased renewable capacity independent of power plant capacity. Interestingly, the increase in the CHP capacity in scenario B, as depicted in Figure 11B, has increased the export. This finding supports the observation presented in Section 4.3.1, which suggests that CHP systems negatively influence the adoption and efficiency of renewable energy sources.
Scenario B has the highest export of 60.23 MWh/year, while scenario C, as shown in Figure 11C, has the lowest export of 11.37 MWh/year. This shows that heat pumps can better handle higher capacities of renewable systems by using the curtailed power to meet heat demands.
4.3.4 Portfolio design
Table 4 shows the influence of varying the MEM portfolio configuration on the system dynamics. Consider scenario C, even though the renewable share is high and exported energy is less than the other scenarios. There is still a need to import the energy from the primary grid, which decreases the self-sufficiency of the MEM. In contrast, scenarios A and B have the least imports compared to other scenarios but have a high export share to the primary grid, which could lead to grid instability. Hence, a careful analysis should be carried out to understand the interaction between multiple factors and improve the system’s performance. To achieve the trade-off between the parameters, CHP and heat pumps are added to the portfolio in scenario D.
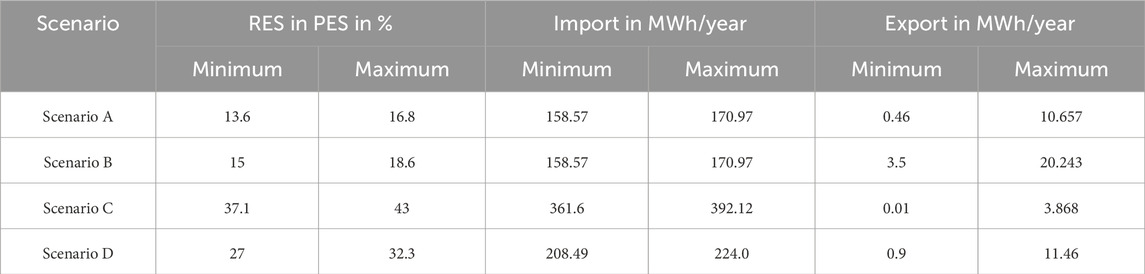
TABLE 4. Comparative analysis of performance metrics for the developed scenarios.
Figure 12 compares the performance of the MEM for different scenarios. As shown in Figure 12A, scenario D is better than scenarios A and B, in terms of RES, but falls short compared to scenario C by 24.88%. However, Figure 12B clearly shows that scenario C needs an import of 392.12 MWh/year, which is 75% higher than scenario D. Furthermore, energy export has an intriguing pattern, as shown in Figure 12C, where export for scenario D is significantly less than scenario B. Moreover, the export is higher than scenario C and higher than scenario A by only 7.5%. Scenario D shows that adding CHP and HP improves the system performance; however, further analysis is required to decide the optimal capacities of the CHP and HP to achieve the best performance from the system.
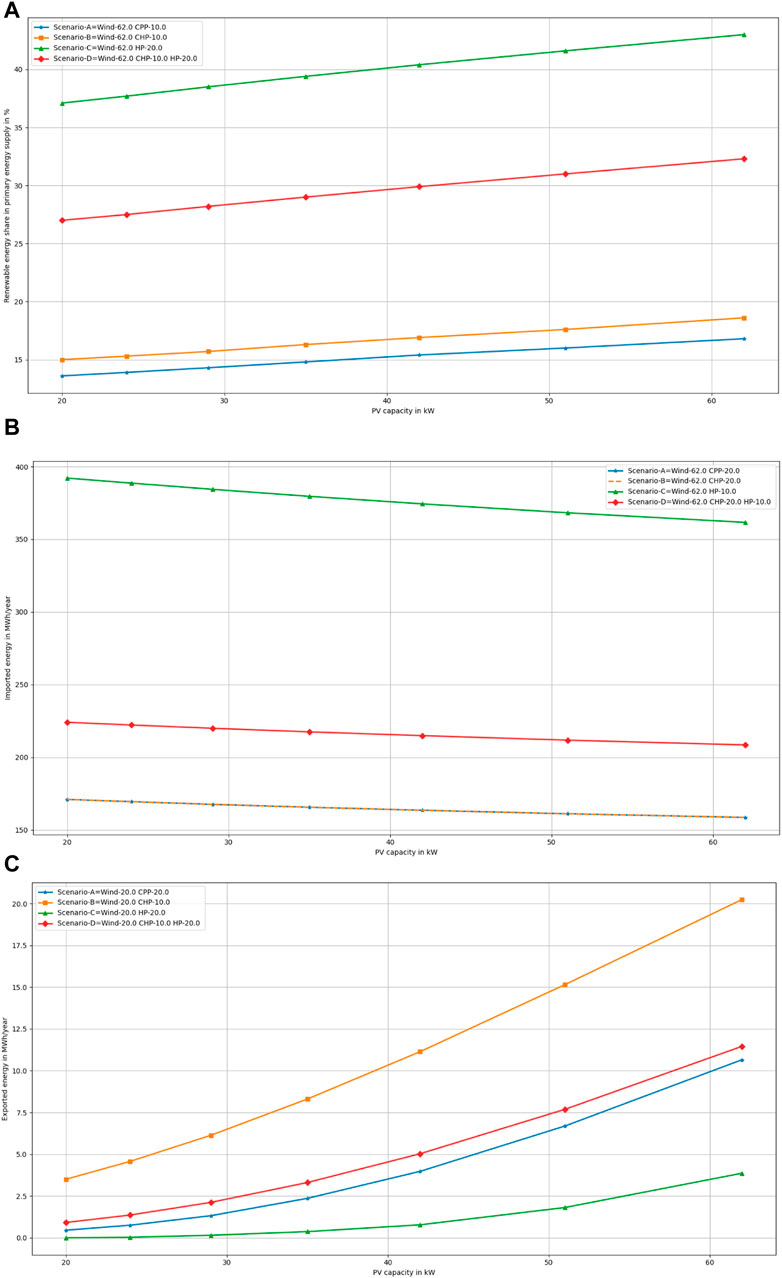
FIGURE 12. Comparison of analysis metrics for scenarios (A), (B), (C), and (D).
4.4 Sensitivity analysis
The primary goal of this research is to perform a feasibility study to design the portfolio and analyze the impact on the MEM performance in the context of energy security and sustainability when subjected to renewable energy fluctuations, especially in the case of high renewable energy penetration. In the case of energy security, exported energy can be considered as a factor as excess export can lead to grid instability and the lack of efficient measures to use the energy locally. In contrast, focusing on the imported energy criteria helps improve the sustainability and self-sufficiency of the energy system.
In this study, one of the primary contributions is the development of an accurate solar power forecasting model to improve the precision of the analysis in order to avoid overestimation or underestimation of solar generation and make informed decisions on portfolio design and optimal sizes. Understanding the benefit of an accurate model for analysis can be achieved by developing an equation-based solar power forecasting model from the study in Berg and Löschenbrand (2022). The forecasted generation is loaded into scenario D to analyze the energy system as discussed in Table 2 and energy component capacities given in Table 3.
The performance metrics for the ANN-based and equation-based forecasts are filtered for the maximum capacity of wind and heat pump and the minimum capacity of CHP and are plotted as shown in Figure 13. Figure 13A shows that the equation-based model overestimates the renewable generation share and also underestimates the imported and exported energy from the primary grid, as shown in Figures 13B, C. The primary reason could be that the equation-based model only considers the temperature and solar radiation and does not include external factors, such as snow or cloud coverage, which are key features when training the ANN-based model. One key observation is that as the PV capacity increases, the difference also increases, showing that the model accuracy has a significant impact when dealing with energy systems with higher renewable penetration.

FIGURE 13. Comparison of performance metrics for the ANN-based forecasting model and equation-based model. (A) Comparison of RES in PES. (B) Comparison of imported energy. (C) Comparison of exported energy.
In a particular case, maximum capacities for the renewable components are considered for scenario D to understand the impact of renewable generation variability on microgrid performance. For this scenario, the import and export profiles are extracted from the EnergyPLAN optimization and plotted against the renewable generation, as shown in Figure 14. Initial analysis shows that the PV generation significantly influences the export trend with a correlation of 0.655, as shown in Figure 14A. On the contrary, a negative correlation was observed between the PV generation and the import of approximately 0.476, as shown in Figure 14B. In comparison, wind generation has less impact than PV generation, with a 0.225 correlation for the export (Figure 14C), and −0.274 correlation for the import, as shown in Figure 14D.

FIGURE 14. Comparative analysis of renewable energy generation and electricity trade. (A) PV generation vs. electricity export. (B) PV generation vs. electricity import. (C) Wind generation vs. electricity export. (D) Wind generation vs. electricity import.
A feasibility study is a critical planning stage, where the main objective of the microgrid system engineer is to assess the system for given parameters such as available renewable generation, energy demand, consumption patterns, and other social factors. In both studies (Bai et al., 2019; Shahbazbegian et al., 2023), a technical and economic analysis was carried out for a MEM, but little emphasis was given to modeling the solar generation forecasting. A similar issue was also seen in Kovačević Markov and Rajaković (2019), where a feasibility study was developed for a MEM. However, Graça Gomes et al. (2021) developed an equation-based model to forecast solar generation, which was used to develop an optimization model to decide the optimal size of the microgrid energy components. Kamal et al. (2022) also used an equation-based solar forecast model to study the economic feasibility of a microgrid. A similar forecast model was used to design a resilient microgrid in Masrur et al. (2022).
Most studies use a simple equation-based model for the energy system analysis; however, solar power generation is highly susceptible to seasonal variations directly impacting economic and technical viability. During winters, there are some days and months when there is almost zero solar generation; hence, during this period, investments in PV systems are not economically viable with an increased import, as shown in Figure 14B. In contrast, during the summer, solar generation is almost in excess and energy demand is lower because of the low heating demand. Due to this, excess generation is fed back to the grid, evident from Figure 14A. Hence, when deciding the optimal capacity of the PV systems, accurate modeling techniques can help improve the precision of the analysis and make informed decisions when designing the portfolio.
5 Conclusion
This study discusses the analysis of the MEM system with the objective of increasing the renewable share in meeting both the electrical and heating loads. The discussion was extended to developing accurate mathematical models for precise energy system analysis. An ANN-based model was developed to forecast the solar power generation. The deployed model could predict solar power generation with an accuracy of 87%. The model was further integrated into the EnergyPLAN tool to model and simulate different energy scenarios. The Norwegian energy system was used as a case study, and scenarios were developed to understand the impact of increasing renewable penetration and the role of coupling components such as CHP plants and heat pumps.
Some of the interesting conclusions from the study were that portfolio design has a significant impact on the MEM performance. Installing a CHP in the energy system has considerably decreased imports from the primary grid but increased exports. This shows that a higher share of CHP will reduce renewable energy utilization. On the contrary, adding heat pumps has improved renewable energy utilization by converting the excess energy generation to meet the heating demand. However, the addition of heat pumps increases the electric grid size and the imports from the primary grid as well. It was also concluded that the impact of PV system size on imports and exports is significantly higher than that of wind energy systems. Moreover, the modeling accuracy has a significant impact on the analysis as well.
5.1 Future scope
The scenarios were developed considering only CHP plants and heat pumps. However, the scenarios could be extended to include energy storage, fuel cells, electric boilers, and solar thermal energy systems. In this study, a deep learning-based algorithm was developed to forecast solar power; however, the impact of wind generation on the system performance is significantly higher than that of PV generation. Hence, a detailed model for wind generation should be developed to make the analysis more accurate. The forecasting model developed in this study is deterministic, and since renewable generation is subject to uncertainties, the model can be further extended to quantify uncertainty.
Data availability statement
The datasets presented in this article are not readily available because the raw data for this study includes sensitive information, its availability is restricted to protect confidentiality. Requests to access the datasets should be directed to c2FpLnMucC5yYWplbmRyYW5AbnRudS5ubw==.
Author contributions
SP: conceptualization, methodology, writing–original draft, writing–review and editing, data curation, formal analysis, investigation, software, validation, and visualization. AG: data curation, resources, supervision, validation, and writing–review and editing.
Funding
The author(s) declare that no financial support was received for the research, authorship, and/or publication of this article.
Acknowledgments
The authors would like to extend their sincere gratitude to the Norwegian University of Science and Technology (NTNU) for their invaluable support in crafting this article, which includes providing access to relevant sources and dataset.
Conflict of interest
The authors declare that the research was conducted in the absence of any commercial or financial relationships that could be construed as a potential conflict of interest.
Publisher’s note
All claims expressed in this article are solely those of the authors and do not necessarily represent those of their affiliated organizations, or those of the publisher, the editors, and the reviewers. Any product that may be evaluated in this article, or claim that may be made by its manufacturer, is not guaranteed or endorsed by the publisher.
Abbreviations
ANN, artificial neural network; ARIMA, auto-regressive integrated moving average; ARMA, auto-regressive moving average; CEEP, critical excess electricity production; CHP, combined heat and power system; CPP, central power plant; DER-CAM, Distributed Energy Resources Customer Adoption Model; DL, deep learning; EEEP, exportable excess electricity production; GW, giga watt; kW, kilo watt; kWh, kilo-watt hour; MAE, mean absolute error; MEM, multi-energy microgrid; ML, machine learning; MWh, mega-watt hour; NTNU, Norwegian University of Science and Technology; PES, primary energy supply; PV, photovoltaic systems; RES, renewable energy share; RMSE, root-mean-squared error; RNN, recurrent neural network.
Footnotes
1http://www.solardesigntool.com/components/module-panel-solar/Sunpower/2731/SPR-X20-327-COM/specification-data-sheet.html
2https://www.visualcrossing.com/
4https://www.dnv.com/Publications/energy-transition-norway-2021-212201
5https://www.statnett.no/en/about-statnett/news-and-press-releases/news-archive-2022/increased-consumption-results-in-a-negative-norwegian-energy-balance-from-2027/
6https://www.ssb.no/435431/energy-consumption-in-households-in-norway.gwh-kwh
References
Abdilahi, A. M., Mohd Yatim, A. H., Mustafa, M. W., Khalaf, O. T., Shumran, A. F., and Mohamed Nor, F. (2014). Feasibility study of renewable energy-based microgrid system in somalilands urban centers. Renew. Sustain. Energy Rev. 40, 1048–1059. doi:10.1016/j.rser.2014.07.150
Adefarati, T., and Bansal, R. (2019). Reliability, economic and environmental analysis of a microgrid system in the presence of renewable energy resources. Appl. Energy 236, 1089–1114. doi:10.1016/j.apenergy.2018.12.050
Ahmad, F., and Alam, M. S. (2017). Feasibility study, design and implementation of smart polygeneration microgrid at amu. Sustain. Cities Soc. 35, 309–322. doi:10.1016/j.scs.2017.08.007
Ahmed, A., and Khalid, M. (2019). A review on the selected applications of forecasting models in renewable power systems. Renew. Sustain. Energy Rev. 100, 9–21. doi:10.1016/j.rser.2018.09.046
Ahmed, S. D., Al-Ismail, F. S. M., Shafiullah, M., Al-Sulaiman, F. A., and El-Amin, I. M. (2020). Grid integration challenges of wind energy: a review. IEEE Access 8, 10857–10878. doi:10.1109/ACCESS.2020.2964896
Alam, M. S., Al-Ismail, F. S., Salem, A., and Abido, M. A. (2020). High-level penetration of renewable energy sources into grid utility: challenges and solutions. IEEE Access 8, 190277–190299. doi:10.1109/ACCESS.2020.3031481
Aydin, D., Casey, S. P., and Riffat, S. (2015). The latest advancements on thermochemical heat storage systems. Renew. Sustain. Energy Rev. 41, 356–367. doi:10.1016/j.rser.2014.08.054
Bai, B., Wang, K., Bu, L., Liu, S., Cheng, M., and Yue, C. (2019). “Feasibility evaluation for a multi-energy microgrid case study in China,” in 2019 IEEE PES Asia-Pacific Power and Energy Engineering Conference (APPEEC), December 01–04, 2019 (Macao, China: IEEE), 1–5. doi:10.1109/APPEEC45492.2019.8994575
Bartolini, A., Carducci, F., Muñoz, C. B., and Comodi, G. (2020). Energy storage and multi energy systems in local energy communities with high renewable energy penetration. Renew. Energy 159, 595–609. doi:10.1016/j.renene.2020.05.131
Berg, K., and Löschenbrand, M. (2022). A data set of a Norwegian energy community. Data Brief 40, 107683. doi:10.1016/j.dib.2021.107683
Bouw, K., Noorman, K. J., Wiekens, C. J., and Faaij, A. (2021). Local energy planning in the built environment: an analysis of model characteristics. Renew. Sustain. Energy Rev. 144, 111030. doi:10.1016/j.rser.2021.111030
Cabrera, P., Lund, H., Thellufsen, J. Z., and Sorknæs, P. (2020). The MATLAB toolbox for EnergyPLAN: a tool to extend energy planning studies. Sci. Comput. Program. 191, 102405. doi:10.1016/j.scico.2020.102405
Calise, F., Cappiello, F. L., Dentice d’Accadia, M., and Vicidomini, M. (2021). Smart grid energy district based on the integration of electric vehicles and combined heat and power generation. Energy Convers. Manag. 234, 113932. doi:10.1016/j.enconman.2021.113932
Dargan, S., Kumar, M., Ayyagari, M. R., and Kumar, G. (2020). A survey of deep learning and its applications: a new paradigm to machine learning. Archives Comput. Methods Eng. 27, 1071–1092. doi:10.1007/s11831-019-09344-w
Dolara, A., Leva, S., and Manzolini, G. (2015). Comparison of different physical models for pv power output prediction. Sol. Energy 119, 83–99. doi:10.1016/j.solener.2015.06.017
Eales, A., Archer, L., Buckland, H., Frame, D., and Galloway, S. (2018). “Feasibility study for a solar pv microgrid in Malawi,” in 2018 53rd International Universities Power Engineering Conference (UPEC), September 4–7, 2018 (Glasgow, United Kingdom: IEEE), 1–6. doi:10.1109/UPEC.2018.8542002
Graça Gomes, J., Xu, H., Yang, Q., and Zhao, C. (2021). An optimization study on a typical renewable microgrid energy system with energy storage. Energy 234, 121210. doi:10.1016/j.energy.2021.121210
Herc, L., Pfeifer, A., and Duić, N. (2022). Optimization of the possible pathways for gradual energy system decarbonization. Renew. Energy 193, 617–633. doi:10.1016/j.renene.2022.05.005
Huang, R., Huang, T., Gadh, R., and Li, N. (2012). “Solar generation prediction using the arma model in a laboratory-level micro-grid,” in 2012 IEEE Third International Conference on Smart Grid Communications (SmartGridComm), November 5–8, 2012 (Tainan, Taiwan: IEEE), 528–533. doi:10.1109/SmartGridComm.2012.6486039
Hussain, A., Bui, V.-H., and Kim, H.-M. (2019). Microgrids as a resilience resource and strategies used by microgrids for enhancing resilience. Appl. Energy 240, 56–72. doi:10.1016/j.apenergy.2019.02.055
Jung, J., and Villaran, M. (2017). Optimal planning and design of hybrid renewable energy systems for microgrids. Renew. Sustain. Energy Rev. 75, 180–191. doi:10.1016/j.rser.2016.10.061
Kamal, M. M., Ashraf, I., and Fernandez, E. (2022). Planning and optimization of microgrid for rural electrification with integration of renewable energy resources. J. Energy Storage 52, 104782. doi:10.1016/j.est.2022.104782
Kiss, V. M. (2015). Modelling the energy system of pécs – the first step towards a sustainable city. Energy 80, 373–387. doi:10.1016/j.energy.2014.11.079
Klemm, C., and Vennemann, P. (2021). Modeling and optimization of multi-energy systems in mixed-use districts: a review of existing methods and approaches. Renew. Sustain. Energy Rev. 135, 110206. doi:10.1016/j.rser.2020.110206
Kovačević Markov, K., and Rajaković, N. (2019). Multi-energy microgrids with ecotourism purposes: the impact of the power market and the connection line. Energy Convers. Manag. 196, 1105–1112. doi:10.1016/j.enconman.2019.05.048
Kumar, A., Singh, A. R., Deng, Y., He, X., Kumar, P., and Bansal, R. C. (2019). Integrated assessment of a sustainable microgrid for a remote village in hilly region. Energy Convers. Manag. 180, 442–472. doi:10.1016/j.enconman.2018.10.084
Li, M., Zhang, X., Li, G., and Jiang, C. (2016). A feasibility study of microgrids for reducing energy use and ghg emissions in an industrial application. Appl. Energy 176, 138–148. doi:10.1016/j.apenergy.2016.05.070
Lopes, J. P., Hatziargyriou, N., Mutale, J., Djapic, P., and Jenkins, N. (2007). Integrating distributed generation into electric power systems: a review of drivers, challenges and opportunities. Electr. Power Syst. Res. 77, 1189–1203. doi:10.1016/j.epsr.2006.08.016
Louzazni, M., Mosalam, H., Khouya, A., and Amechnoue, K. (2020). A non-linear auto-regressive exogenous method to forecast the photovoltaic power output. Sustain. Energy Technol. Assessments 38, 100670. doi:10.1016/j.seta.2020.100670
Lund, H., Thellufsen, J. Z., Østergaard, P. A., Sorknæs, P., Skov, I. R., and Mathiesen, B. V. (2021). Energyplan – advanced analysis of smart energy systems. Smart Energy 1, 100007. doi:10.1016/j.segy.2021.100007
Martínez Ceseña, E. A., Good, N., Syrri, A. L., and Mancarella, P. (2018). Techno-economic and business case assessment of multi-energy microgrids with co-optimization of energy, reserve and reliability services. Appl. Energy 210, 896–913. doi:10.1016/j.apenergy.2017.08.131
Mashayekh, S., Stadler, M., Cardoso, G., and Heleno, M. (2017). A mixed integer linear programming approach for optimal der portfolio, sizing, and placement in multi-energy microgrids. Appl. Energy 187, 154–168. doi:10.1016/j.apenergy.2016.11.020
Masrur, H., Gamil, M. M., Islam, M. R., Muttaqi, K. M., Lipu, M. S. H., and Senjyu, T. (2022). An optimized and outage-resilient energy management framework for multicarrier energy microgrids integrating demand response. IEEE Trans. Industry Appl. 58, 4171–4180. doi:10.1109/TIA.2022.3160683
Mayer, M. J., and Gróf, G. (2021). Extensive comparison of physical models for photovoltaic power forecasting. Appl. Energy 283, 116239. doi:10.1016/j.apenergy.2020.116239
Moreira, M., Balestrassi, P., Paiva, A., Ribeiro, P., and Bonatto, B. (2021). Design of experiments using artificial neural network ensemble for photovoltaic generation forecasting. Renew. Sustain. Energy Rev. 135, 110450. doi:10.1016/j.rser.2020.110450
Netsanet, S., Zhang, J., Zheng, D., and Hui, M. (2016). “Input parameters selection and accuracy enhancement techniques in pv forecasting using artificial neural network,” in 2016 IEEE International Conference on Power and Renewable Energy (ICPRE), October 21–23, 2016 (Shanghai, China: IEEE), 565–569. doi:10.1109/ICPRE.2016.7871139
Noorollahi, Y., Golshanfard, A., Ansaripour, S., Khaledi, A., and Shadi, M. (2021). Solar energy for sustainable heating and cooling energy system planning in arid climates. Energy 218, 119421. doi:10.1016/j.energy.2020.119421
Orhan, T., Shafiullah, G. M., Stojcevski, A., and Oo, A. (2014). “A feasibility study on microgrid for various islands in Australia,” in 2014 Australasian Universities Power Engineering Conference (AUPEC), September 28–October 01, 2014 (Perth, WA: IEEE), 1–8. doi:10.1109/AUPEC.2014.6966604
Østergaard, P., Lund, H., Thellufsen, J., Sorknæs, P., and Mathiesen, B. (2022). Review and validation of energyplan. Renew. Sustain. Energy Rev. 168, 112724. doi:10.1016/j.rser.2022.112724
Østergaard, P. A. (2012). Comparing electricity, heat and biogas storages’ impacts on renewable energy integration. Energy 37, 255–262. doi:10.1016/j.energy.2011.11.039
Østergaard, P. A. (2013). Wind power integration in aalborg municipality using compression heat pumps and geothermal absorption heat pumps. Energy 49, 502–508. doi:10.1016/j.energy.2012.11.030
Parag, Y., and Ainspan, M. (2019). Sustainable microgrids: economic, environmental and social costs and benefits of microgrid deployment. Energy Sustain. Dev. 52, 72–81. doi:10.1016/j.esd.2019.07.003
Pascual, J., Barricarte, J., Sanchis, P., and Marroyo, L. (2015). Energy management strategy for a renewable-based residential microgrid with generation and demand forecasting. Appl. Energy 158, 12–25. doi:10.1016/j.apenergy.2015.08.040
Perry, S., Klemeš, J., and Bulatov, I. (2008). Integrating waste and renewable energy to reduce the carbon footprint of locally integrated energy sectors. Energy 33, 1489–1497. doi:10.1016/j.energy.2008.03.008
Prina, M. G., Lionetti, M., Manzolini, G., Sparber, W., and Moser, D. (2019). Transition pathways optimization methodology through energyplan software for long-term energy planning. Appl. Energy 235, 356–368. doi:10.1016/j.apenergy.2018.10.099
Qing, X., and Niu, Y. (2018). Hourly day-ahead solar irradiance prediction using weather forecasts by lstm. Energy 148, 461–468. doi:10.1016/j.energy.2018.01.177
Rodríguez, F., Fleetwood, A., Galarza, A., and Fontán, L. (2018). Predicting solar energy generation through artificial neural networks using weather forecasts for microgrid control. Renew. Energy 126, 855–864. doi:10.1016/j.renene.2018.03.070
Sahoo, A. K., Abhitharan, K., Kalaivani, A., and Karthik, T. (2015). Feasibility study of microgrid installation in an educational institution with grid uncertainty. Procedia Comput. Sci. 70, 550–557. doi:10.1016/j.procs.2015.10.099
Sandvall, A. F., Börjesson, M., Ekvall, T., and Ahlgren, E. O. (2015). Modelling environmental and energy system impacts of large-scale excess heat utilisation – a regional case study. Energy 79, 68–79. doi:10.1016/j.energy.2014.10.049
Shahbazbegian, V., Dehghani, F., Shafiyi, M. A., Shafie-khah, M., Laaksonen, H., and Ameli, H. (2023). Techno-economic assessment of energy storage systems in multi-energy microgrids utilizing decomposition methodology. Energy 283, 128430. doi:10.1016/j.energy.2023.128430
Singh, S., Singh, M., and Kaushik, S. C. (2016). Feasibility study of an islanded microgrid in rural area consisting of pv, wind, biomass and battery energy storage system. Energy Convers. Manag. 128, 178–190. doi:10.1016/j.enconman.2016.09.046
Sivaneasan, B., Yu, C., and Goh, K. (2017). Solar forecasting using ann with fuzzy logic pre-processing. Energy Procedia 143, 727–732. doi:10.1016/j.egypro.2017.12.753
Sorrell, S. (2015). Reducing energy demand: a review of issues, challenges and approaches. Renew. Sustain. Energy Rev. 47, 74–82. doi:10.1016/j.rser.2015.03.002
Stadler, M., Groissböck, M., Cardoso, G., and Marnay, C. (2014). Optimizing distributed energy resources and building retrofits with the strategic der-camodel. Appl. Energy 132, 557–567. doi:10.1016/j.apenergy.2014.07.041
Vidal-Amaro, J. J., Østergaard, P. A., and Sheinbaum-Pardo, C. (2015). Optimal energy mix for transitioning from fossil fuels to renewable energy sources – the case of the mexican electricity system. Appl. Energy 150, 80–96. doi:10.1016/j.apenergy.2015.03.133
Waqar, A., Nawaz, M. S., Aamir, M., Alam, I., Ali, S. U., and Ahmad, J. (2019). “Multi-objective analysis of der sizing in microgrids using probabilistic modeling,” in 2019 International Conference on Electrical, Communication, and Computer Engineering (ICECCE), July 24–25, 2019 (Swat, Pakistan: IEEE), 1–6. doi:10.1109/ICECCE47252.2019.8940702
Wazirali, R., Yaghoubi, E., Abujazar, M. S. S., Ahmad, R., and Vakili, A. H. (2023). State-of-the-art review on energy and load forecasting in microgrids using artificial neural networks, machine learning, and deep learning techniques. Electr. Power Syst. Res. 225, 109792. doi:10.1016/j.epsr.2023.109792
Wen, L., Zhou, K., Yang, S., and Lu, X. (2019). Optimal load dispatch of community microgrid with deep learning based solar power and load forecasting. Energy 171, 1053–1065. doi:10.1016/j.energy.2019.01.075
Keywords: multi-energy microgrid, energy system analysis, solar power forecasting, deep learning, artificial neural network, EnergyPLAN
Citation: Punyam Rajendran SS and Gebremedhin A (2024) Deep learning-based solar power forecasting model to analyze a multi-energy microgrid energy system. Front. Energy Res. 12:1363895. doi: 10.3389/fenrg.2024.1363895
Received: 31 December 2023; Accepted: 23 February 2024;
Published: 18 March 2024.
Edited by:
Yirui Wang, Ningbo University, ChinaReviewed by:
Quetzalcoatl Hernandez, National Autonomous University of Mexico, MexicoYashwant Sawle, Madhav Institute of Technology and Science Gwalior, India
Copyright © 2024 Punyam Rajendran and Gebremedhin. This is an open-access article distributed under the terms of the Creative Commons Attribution License (CC BY). The use, distribution or reproduction in other forums is permitted, provided the original author(s) and the copyright owner(s) are credited and that the original publication in this journal is cited, in accordance with accepted academic practice. No use, distribution or reproduction is permitted which does not comply with these terms.
*Correspondence: Sai Sasidhar Punyam Rajendran, c2FpLnMucC5yYWplbmRyYW5AbnRudS5ubw==