 Fuqiang Zhang1
 Qingqing Zhou
- 1State Grid Energy Research Institute Co., Ltd., Beijing, China
- 2Economic and Technological Research Institute of State Grid Qinghai Electric Power Company, Xining, Qinghai, China
- 3School of Economics and Management of North China Electric Power University, Beijing, China
In order to give full play to the energy supply potential of distributed energy resources, this paper studies the scheduling optimization of CHP-VPP. First, the CHP unit and various distributed energy sources are aggregated into VPP. Carbon recycling and utilizing are realized through carbon capture and power-to-gas devices. At the same time, carbon storage and hydrogen storage devices are added to decouple carbon capture and P2G procedures. Then, the risk of VPP real-time scheduling is quantified through uncertainty scenario generation and CVaR. Finally, with the goals of operating cost, carbon emission, and operation risk, a multi-objective stochastic scheduling optimization model of VPP is constructed, and the subjective and objective ensemble weighting method is used to solve the problem. The example results show that the proposed method can boost the wastage of wind and photovoltaic power, and also lower the carbon emissions of VPPs.
1 Introduction
The scale of distributed energy resources on the demand side has grown rapidly over the years. Due to its high energy efficiency, less pollution, and strong flexibility, it will be the key to alleviating China’s energy shortage. Aiming at the problems of small capacity, large quantity and uneven distribution of distributed energy resources, virtual power plants (VPP) use advanced communication technology to realize the aggregation of different distributed energy sources, which can effectively play the spatiotemporal complementary ability of various resources and fully tap the energy supply potential of distributed energy resources.
From another perspective, multi-energy complementarity is the general trend of the future development of the energy field. And electricity and heat as the two main forms of user energy consumption, whose coupling degree will continue to deepen. In this context, some scholars put forward the concept of the combined heat and power-virtual power plant (CHP-VPP), aiming to realize the cooperative optimal scheduling of electricity and heat through electrothermal coupling equipment such as the combined heat and power (CHP) units and electric boilers with the advanced communication and control technology of virtual power plants. At present, many scholars have studied the combined heat and power virtual power plant. Yang H studied cogeneration virtual power plants that include thermal power plants, wind farms, photovoltaic power plants, and electric boilers (Yang et al., 2024). Basu M integrated consideration of electrical, thermal, and cold requirements, improve the flexibility and economy of the system (Basu, 2023). Feng Y studied the virtual power plant coupling multiple resources of electricity, heat and gas to reduce the cost of the system (Feng et al., 2023). Some scholars have installed heat storage tanks to absorb wind power in thermoelectric joint virtual power plants and established a VPP dispatching optimization algorithm with the purpose of maximizing economic benefits (Schulz et al., 2005; Xia et al., 2016; Nazari-Heris et al., 2018). The above literature only focuses on the economic benefits of VPP, but in the context of the “Dual carbon” goal, carbon emissions will be a key indicator of optimal scheduling of virtual power plants. How to realize low carbon operation of VPP while giving full play to the potential of VPP energy supply is the main issue in the field of VPP research.
In the above context, the progress of carbon capture and Power-to-gas (P2G) technology provides an effective way for the green development of VPP. Tan C studied carbon capture units, which promoted the consumption of electricity from virtual power plants, and made the carbon emission reduction effect more significant (Tan et al., 2021). Ju L studied power-to-gas devices to absorb excess wind and solar power generation and convert CO2 into CH4, effectively reducing the carbon emissions of VPP (Ju et al., 2019). Babaee S studied CO2 recycling through Gas-power Plant Carbon Capture (GPPCC) and P2G (Babaee and Loughlin, 2018). Zhu C studied a carbon storage device to decouple the capture and treatment process of CO2 (Zhu et al., 2023), and Wang C studied a hydrogen storage device to decouple the production and consumption process of H2 (Wang et al., 2024). The above literature does not consider the influence of the coupling operation mode of GPPCC and P2G on the degree of carbon cycling. However, the carbon storage device can decouple the CO2 capture and treatment process (Smit et al., 2014), and the hydrogen storage device can decouple the H2 production and consumption process (Gorre et al., 2020). In addition, many scholars ignore the uncertainties of renewable energy when they study the reduction of carbon emissions by VPP. Therefore, in this paper, the above characteristics of carbon storage device and hydrogen storage device are used to flexibly control the two gas raw materials required for methanation process. The purpose of renewable energy time shift is realized, and the degree of carbon recycling of GPPCC and P2G is improved. At the same time, under the premise of improving the economy of the system, the carbon emission reduction potential is maximized. Moreover, uncertainty processing methods such as scenario generation (SG) and conditional value at risk (CVaR) theory are introduced to enable VPP to deal with the volatilities of scenery while reducing carbon emission.
In response to the above problems, this paper uses proposes an optimal dispatching method for a combined heat and power VPP that considers carbon capture and electricity-to-gas conversion. The CHP unit and various distributed energy sources on the user side are aggregated into CHP-VPP. Then, GPPCC and P2G are used to realize carbon recycling, and the carbon and hydrogen storage devices are used to decouple the carbon capture and water electrolysis process, at the same time, the time shift of renewable energy power is realized. In addition, SG and CVaR theory are used to quantify the risk of VPP real-time scheduling. Finally, taking operation cost, carbon emission, and operation risk as optimization objectives, a virtual power plant multi-objective stochastic dispatching optimization model is constructed. The comparison between this paper and published studies is shown in Table 1.
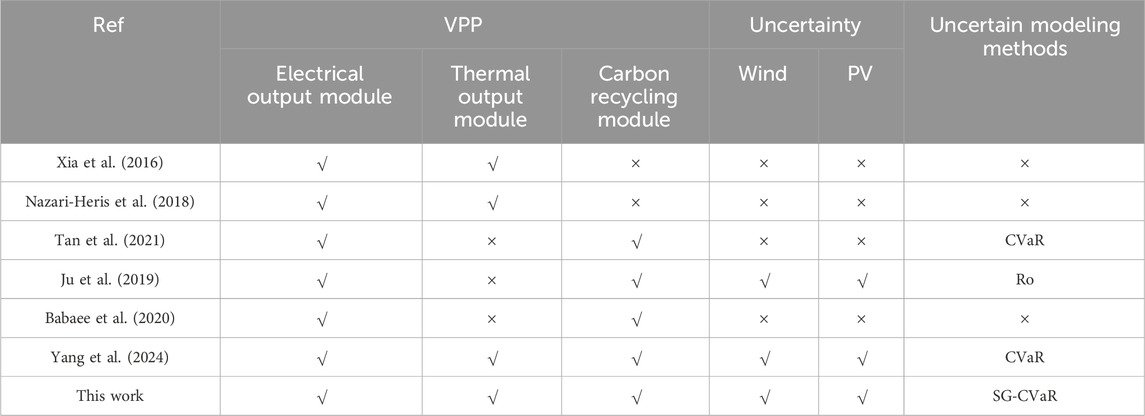
Table 1. Comparing this work with recent research.
2 Structure and operating model of virtual power plant
In Section 2 of this paper, the material or energy input and output models of components of virtual power plant are introduced, aiming at clarifying the energy or material flow relationship between components.
2.1 Structure of virtual power plant
The combined heat and power virtual power plant mainly includes a distributed electrical/thermal output module and a carbon recycling module. Among them, the distributed electrical/thermal output module includes distributed wind power, distributed photovoltaic, electric boiler, and controllable load. The carbon recycling module includes CHP unit, GPPCC, P2G, and carbon storage and hydrogen storage devices, which can recycle CO2 generated by the CHP unit. Besides, GPPCC includes carbon capture and carbon storage. The VPP dispatching center will predict the available energy output in advance, obtain the operating status of each unit, and formulate an electric heating cooperative dispatching plan for VPP. In addition, VPPs can interact with power grids to fill power supply gaps or sell surplus power. The energy or material flow relationships between the components of VPP is shown in Figure 1.
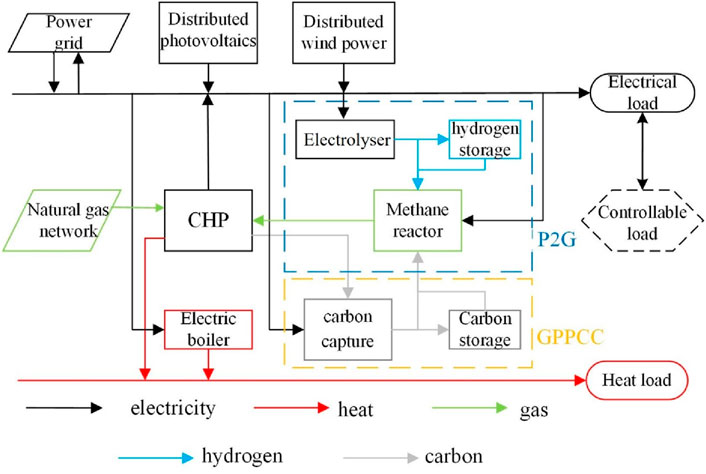
Figure 1. Energy flow of VPP.
2.2 Operating model of virtual power plant
In this paper, VPP mathematical model including CHP, P2G, GPPCC and other components is established. In addition, a multi-objective optimization model considering operational cost, carbon emission and operational risk is constructed. By solving the optimization model, the optimization objectives of VPP such as reducing carbon emission, reducing operation cost and optimizing power generation plan can be achieved, so as to make the operation of power system more efficient, stable and reliable.
2.2.1 Distributed power/heat output module
Distributed electrical/thermal output module includes distributed wind/Photovoltaic (PV), electric boilers, and controllable loads.
(1) Distributed wind/PV
Based on the predicted wind power output, the VPP will develop an output plan for the internally distributed wind power, which satisfies the following relationships listed in Equation 1:
Where,
Where,
Where,
The modeling of distributed PV is consistent with that of distributed wind power, and the possibility distribution function of PV prediction error is referenced (De Giorgi et al., 2015).
(2) Electric boilers
The electric boilers can supply heat to the system with the help of the wind-wind output, and the relationship between the heat production power
Where,
(3) Controllable loads
Customers can sign a contract with a VPP to increase their electricity consumption during valley hours or reduce it during peak hours, and receive certain compensation (Hao et al., 2023) as shown in Equation 5:
Where,
2.2.2 Carbon recycling and utilizing module
The carbon recycling module includes CHP unit, GPPCC, P2G, and gas storage units.
(1) CHP unit
In this paper, the extraction type CHP unit is used to extract part of steam from the two stages of the steam turbine as a heat source for external heating, and its feasible region is represented as shown in Equation 6 (Banadkouki, 2023; Zhang et al., 2024):
Where,
The CO2 produced and natural gas consumed by the unit are shown in Equation 7 (Zhang et al., 2022):
Where,
(2) GPPCC
In order to better control the operation of GPPCC, this paper defines two indicators with reference to Ref. (Bassano et al., 2020): flue gas diversion ratio
Where,
The energy consumption of GPPCC can be calculated as shown in Equation 9:
Where,
Where,
In addition, a carbon storage device is added to the GPPCC to store part of the CO2, generated by the unit when the renewable energy output is low, so as to realize the decoupling of carbon capture and the electron-to-gas procedure. The relationship between CO2 captured by GPPCC and CO2 consumed by P2G is as shown in Equation 11:
Where,
(3) P2G
P2G technology is mainly divided into two types: electric to hydrogen and electric to natural gas. Electric to hydrogen is electrolysis of water to generate hydrogen and oxygen. Subsequently, water and methane are generated through Sabatier catalytic reaction. Based on the idea of cascade utilization of energy, the electric to gas system helps the consumption of renewable energy, and the energy conversion efficiencies are 75%–85% and 75%–80%, respectively (Marzi et al., 2023). The energy conversion procedure is shown as Equation 12:
Where,
In addition, a hydrogen storage device is added to the P2G to store excess H2 when the renewable energy output is high, thus decoupling the electrolytic water and methanation procedures, while achieving the time shift of renewable energy power. The relationship between H2 production by electrolytic water and H2 consumption by methanation is as shown in Equation 13:
Where,
(4) Gas storage devices
In this paper, both carbon storage devices and hydrogen storage devices are considered, which are used to decouple carbon capture, water electrolysis, and methanation procedures, maximize the absorption of wind power generation, and improve the degree of carbon recycling. In addition, the gas storage devices also require a high compression energy consumption. The operation modeling of the gas storage devices are shown as Equation 14:
Where,
3 Multi-objective stochastic dispatching optimization model of virtual power plant
Section 3 introduces the scheduling optimization model of virtual power plant. On the basis of the component model in Section 2, the optimal value of the decision variable is obtained through the objective function and some constraints.
3.1 Uncertainty scenario generation
This paper describes the uncertain factors of renewable energy output through the generation of uncertainty scenarios. In order to model the probability distribution of output power of fan and photovoltaic, it is necessary to mine the information of historical data to directly model the uncertainty of output power. Currently, Latin hypercube sampling is the most common method for scene generation (Zhang et al., 2023; Ju et al., 2024), but this method ignores the correlation between the renewable energy output at different times. Therefore, in order to take into account the randomness and correlation of renewable energy output at all times, this paper proposes a scenario generation method considering the temporal correlation of wind power and PV output. The steps of this method are as follows:
(1) First, the covariance matrix
Where,
(2)
(3) According to the probability distribution function in Section 1.2.1, the sample values of each period are inversely transformed to obtain the scenery prediction error, and then the corresponding N scenery output scenarios are calculated by Equation 2.
In order to reduce the amount of computation, this paper uses k-means clustering to reduce scenes to
3.2 Multi-objective conventional dispatching optimization model
The objective functions of VPP conventional dispatching optimization model include minimum operating cost and minimum carbon emission.
(1) Minimum operating cost
The operating cost includes the power generation cost of CHP unit
The power generation cost of CHP units includes fuel costs and start-up and shutdown costs, which are calculated as Equation 17:
Where,
Operation and maintenance costs include the operating costs of wind power, photovoltaic, GPPCC, P2G, and electric boilers, which are calculated as Equation 18:
Where,
Controllable load cost includes response output cost and standby output cost (Hao et al., 2023), which are calculated as Equation 19:
Where, the cost factor of
The income from the buying and selling of electricity for the public grid is calculated as Equation 20:
Where,
(2) Minimum carbon footprint
Considering that China is still dominated by thermal power generation, this paper will also include the equivalent carbon emissions of electricity purchased in the public grid into the carbon emissions of VPP. The calculation formula is shown in Equation 21.
Where,
VPPs routine dispatching optimization model includes the following constraints:
(1) Electrical/thermal power balance constraint
In order to achieve the electricity/heat supply and demand balance of the VPP in each period, Equation 22 is established:
(2) CHP unit output constraint
In order to limit the thermal and electrical output of CHP unit from exceeding its output range, Equation 23 is established:
Where,
(3) Controllable load constraint
In order to realize the reasonable transfer of controllable load, the transferable range is set. Therefore, Equation 24 is established:
Where,
(4) Equipment operation constraint
Similarly, GPPCC, P2G and other units also need to set their output ranges. Therefore, Equation 25 is established:
Where,
(5) Gas storage device constraint
The decision maker needs to consider the capacity limit and output range of the gas storage device, so Equation 26 is established:
Where,
The conventional VPP scheduling model also includes system backup constraints, for details, please refer to Ref. (Zou et al., 2023).
3.3 Multi-objective stochastic dispatching optimization model
On the basis of value at risk (VaR), CVaR considers the risk distribution beyond the confidence level, and can reflect the maximum possible loss within the full probability interval of the portfolio under the given confidence degree. Therefore, this paper adopts CVaR theory to quantify the loss of load risk in real-time VPP scheduling, and takes it as an optimization target to reflect the operational risk of VPP, so as to cope with the incertitude of wind power generations. The approximate calculation formula of CVaR is as shown in Equation 27 (Ju et al., 2022):
Where,
The measurement index of risk is often related to load loss and load loss duration (He et al., 2023), so this paper takes the loss penalty cost
Where,
VPP multi-objective random dispatching optimization model is as shown in Equation 29:
s.t. Equation 22 – 26This section considers the uncertainty of new energy output, combined with the conventional VPP scheduling model, and then constructs the VPP multi-objective random scheduling optimization model. According to this idea, the decision maker can make the optimal VPP unit scheduling scheme.
4 Solving method of multi-objective model
In Section 4, according to the optimization model proposed in Section 3, the solution method of the optimization model is introduced.
4.1 Objective function dimensionality reduction
The three objective functions in this paper have different orders of magnitude, so the reduced semi-gradient membership function is used to de-dimensionalize. For the specific method, please refer to reference (Xuan et al., 2021). Membership function is as shown in Equation 30:
Where,
4.2 Subjective and objective integration weighting method
There are two kinds of weighting methods: subjective weighting and objective weighting. The results of subjective weighting depend heavily on the subjective knowledge of experts. The results of objective weighting may not necessarily represent the actual importance of the indicators (Song et al., 2020). Neither subjective weighting method nor objective weighting method can perfectly reflect the importance of each objective function. Therefore, this paper chooses the analytic hierarchy process (AHP) as the subjective weighting method and the entropy weighting method as the objective weighting method. An integrated subjective and objective weighting method is proposed to assign weights to each optimization objective. Specific calculations are as shown in Equation 31:
Where,
4.3 Model solution
After the objective function is de-dimensional and weighted by subjective and objective integration, Equation 29 can be converted into the form of Equation 32, and the result of VPP multi-objective scheduling optimization can be obtained by solving it. In addition, the first item of Equation 8 needs to be linearized.
5 Example analysis
5.1 Example data
For the purpose of this paper, the VPP of a certain place in China is selected as the simulation object, VPP has two 0.8 MW CHP units with a combined capacity of 1 MW for wind and 0.4 MW for PV, a capacity of 0.15 MW for electric boilers, and a maximum response output of 0.03 MW for controllable loads. The penalty cost coefficient of loss of load is 800 yuan/MW, the confidence is 0.8, and the power upper limit of VPP interacting with the grid is set to 0.1 MW. Figure 2 shows the predicted next-day wind power and electric heating load. It can be seen that the scene generation method takes into account the randomness and correlation of the output of the scenery at every moment, and is more in line with the actual output of the scenery. In this paper, examples are simulated on Matlab R2016a. The time spent in generating and reducing uncertain scenes is about 5s, and the results can be obtained within 15s for model solving.
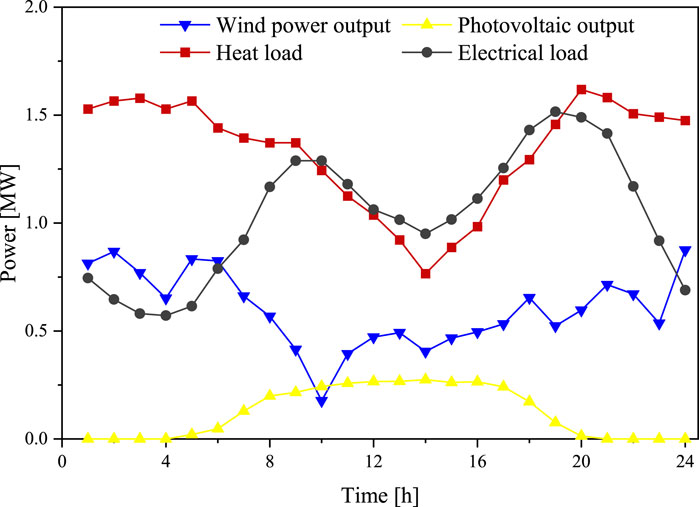
Figure 2. Forecasting wind power, photovoltaic power, power load, and heating load in the next day.
5.2 Scenario setting
In order to analyze the carbon recycling capability of GPPCC and P2G and the effectiveness of the uncertainty coping method, the following four scenarios are set for simulation analysis.
Scenario 1: Basic scenario. GPPCC and P2G were not introduced, and the uncertainty coping method in this paper was not adopted.
Scenario 2: Carbon recycling scenario. GPPCC and P2G were introduced, but uncertainty coping methods were not adopted.
Scenario 3: Risk avoidance scenario. The uncertainty coping method was adopted, but GPPCC and P2G were not introduced.
Scenario 4: Integrated scenario. Both GPPCC and P2G are introduced, and uncertainty coping methods are adopted.
5.3 Example result
Firstly, the entropy weight method and analytic hierarchy procedure were used to calculate the weight of the objective function under each scenario. Then, the sensitivity analysis of decision-maker’s subjective and objective factor preference coefficient is carried out, and the weight of subjective and objective integration was calculated according to Equation 31, as shown in Table 2.
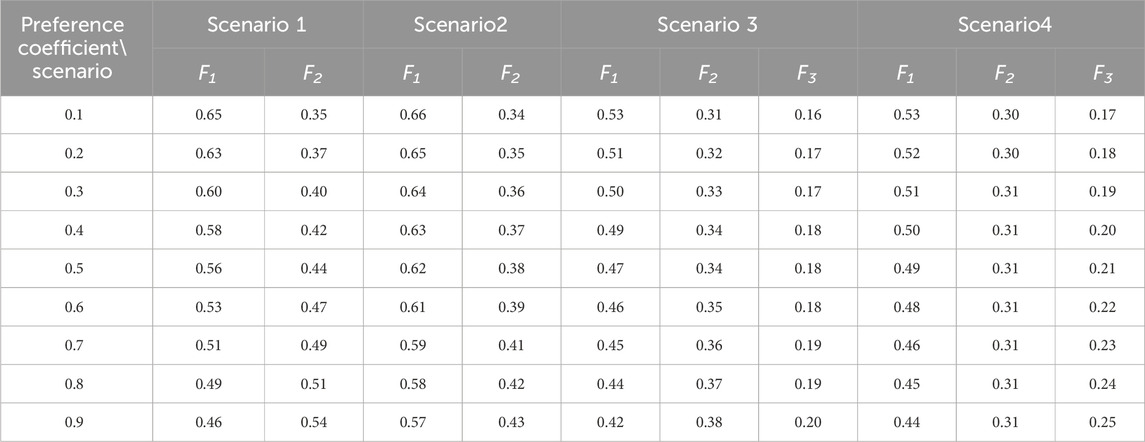
Table 2. Weights of objectives in different cases.
It can be seen that when r gradually increases, the weight of running cost F1 gradually decreases. In addition, the weight of carbon emission F2 and risk cost F3 are gradually increasing. This is because when r is small, the subjective weight has more influence, and the subjective weighting method pays more attention to the impact of operating costs on the system. It is worth pointing out that in Scenario 2-4, F1 is the most weighted optimization target regardless of how r changes. This also reflects the importance of running costs to the entire system.
Table 3 shows the optimization results of scenarios when r = 0.1, and Figure 3 shows the difference between the optimization results of scenarios when r
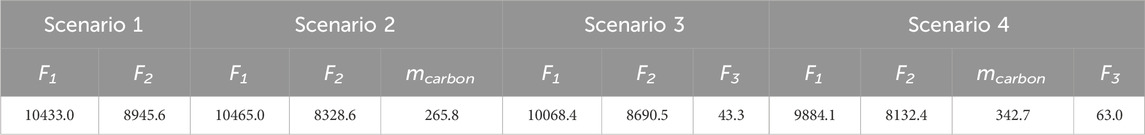
Table 3. Optimization results of different cases under r = 0.1.

Figure 3. The difference between the optimization results of scenarios. When r
In addition, the relationship between the value of the objective function and r can be analyzed from Figure 3. With the increase of r, the weight of F1 decreases, while the weight of F2 and F3 increases. Therefore, the operation cost of each scenario gradually increases, and the carbon emission and risk cost overall show a downward trend. In addition, for Scenario 2 and Scenario 4 where carbon recovery exists, the amount of carbon recovery increases significantly, with an increase ratio of 3.08% and 1.61% respectively. For Scenario 3 and 4 with risk cost, as r increases from 0.1 to 0.9, F3 decreases by 99.7% and 69.53% in Scenario 3 and 4, respectively.
According to the results of the sensitivity analysis in Figure 3, when the value of r is centered, the importance distribution of each objective in VPP is more balanced: VPP neither attaches too much importance to operational risks nor ignores carbon recycling. Therefore, in order to compare the results of different scenarios more conveniently, the results when the subjective and objective factor preference coefficient r is 0.5 are selected for further analysis.
5.3.1 Analysis on the effectiveness of uncertainty coping methods
As shown in Figure 3 (r = 0.5), compared with Scenario 1 and Scenario 2, Scenario 3 and Scenario 4 adopted the uncertainty coping method in this paper, and the operating cost was reduced by 383.21CNYand 572.76CNY, the carbon emission was reduced by 241.91 kg and 194.11 kg, respectively, but the operating risk was increased by 5.27CNYand 39.17CNY.
As can be seen, Scenario 1 and Scenario 2 adopt the conventional system reserve constraint and arrange the reserve capacity according to the fixed proportion of the wind-view planned output. Scenario 3 and Scenario 4 adopt the uncertainty coping method in this paper, which can fully consider the real-time risk situation, arrange more planned output for wind power in periods 7–8, 17–18, and 21–22, and bear certain risks to gain greater benefits. In addition, compared with Scenario 1 and Scenario 2, Scenario 3 and Scenario 4 have generally lower controllable load backup output, which saves part of the backup cost for VPP. The above analysis shows that the uncertainty coping method in this paper can fully measure the risk situation in real-time scheduling, and arrange wind power generation plan and backup plan more reasonably so that VPP can obtain more benefits while avoiding risks in real-time scheduling. Figure 4 shows the target values under different confidence levels in Scenario 4.

Figure 4. Objective values with different
As shown in Figure 4, with the increase in confidence, the attitude of decision-makers gradually becomes conservative, resulting in a gradual increase in operating costs and carbon emissions, and a gradual decrease in operating risks. When
5.3.2 GPPCC and P2G carbon recycling capacity analysis
As shown in Figure 3 (r = 0.5), compared with Scenario 1, Scenario 2 recycled 268.54 kg, carbon emission decreased by 615.49 kg, and operation cost increased by 16.87CNY, which greatly improved the environmental protection of VPP at the cost of a certain economic loss. Compared with scenario 3, scenario 4 recycle 345.38 kg of CO2, reduces carbon emissions by 567.69 kg, reduces operating costs by 172.68CNY, and improves the economy and environmental protection of VPP. Figure 5 shows the operating power of water electrolysis, methanation, and carbon capture units in scenarios 2 and 4.
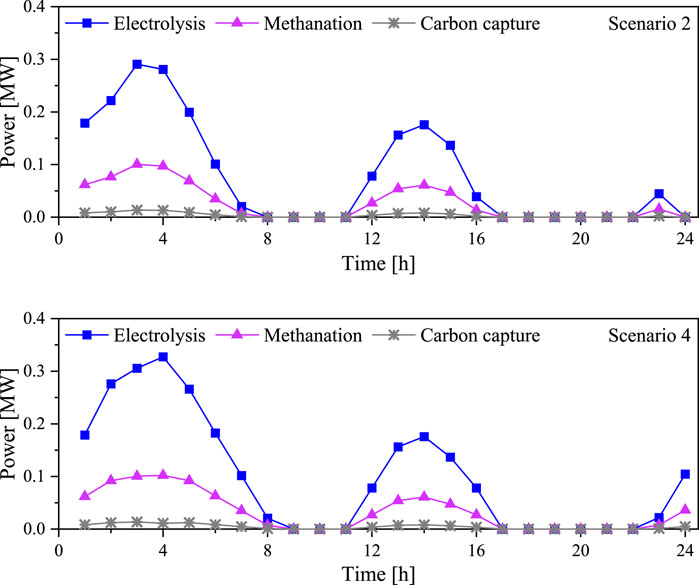
Figure 5. Operating power of different units in case 2 and case 4.
It can be seen that during periods 1–7, 12–16, and 23–24, GPPCC and P2G will use surplus renewable energy to generate electricity and realize the recycling of CO2. Among them, Scenario 4, due to the uncertainty coping method, can fully measure the risks in real-time operation of VPP, and choose to absorb more wind power generation to improve economic and environmental benefits, such as periods 4–7 and 13–16. In addition, in both Scenario 2 and Scenario 4, GPPCC and P2G do not reach their maximum operating power, because the limited backup provided by CHP units and controllable loads prevents GPPCC and P2G from generating a high percentage of wind power. Figure 6 shows the running power of P2G in scenario 4 under different new spares.
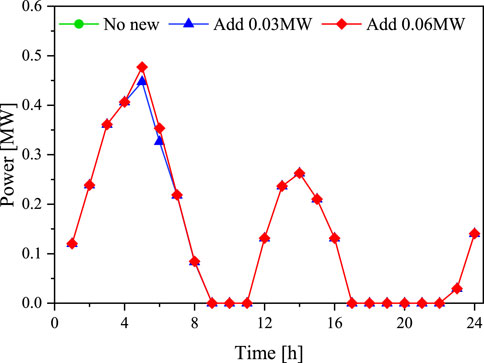
Figure 6. Operating power of P2G with different additional reserve capacity.
As can be seen from Figure 6, with the boost of spare capacity, the operating power of P2G at periods 5–8 and 13–15 keeps rising, indicating that the carbon recycling capacity of GPPCC and P2G is limited by the spare capacity of VPP, and seeking new spare resources within VPP will be the key to improve the carbon recycling degree of GPPCC and P2G.
5.3.3 Analysis on the degree of carbon recycling improved by gas storage devices
According to Figure 6, in conventional carbon cycle modeling, carbon capture, water electrolysis, and methanation operate in a coupled manner, which cannot maximize the recycling of CO2. Carbon storage device and hydrogen storage device are now added, and the initial gas storage is set to 0 m3 and 50 m3 respectively (standard condition). Table 4 shows the carbon cycle utilization before and after adding the gas storage device. It can be seen that when the carbon storage device and hydrogen storage device are added at the same time, the carbon cycle utilization is increased by 32.67 m3, and the degree of carbon recycling is increased by 9.46%, which is 20.46 m3 and 11.48 m3 more than that when only the carbon storage device or hydrogen storage device is added. Figures 7, 8 respectively show the operating power and storage capacity when only carbon storage device or hydrogen storage device is added and the operating power and storage capacity when two gas storage devices are added.
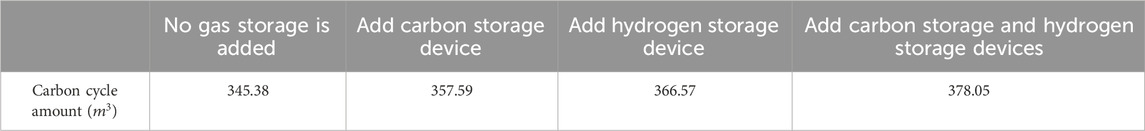
Table 4. Recycled carbon quantity before and after adding gas storage devices.
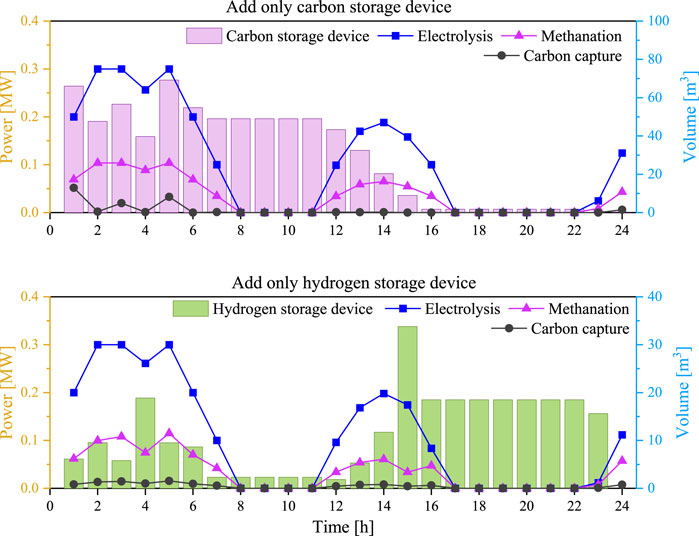
Figure 7. Operating power and stored gas quantity after adding carbon storage or hydrogen storage devices.
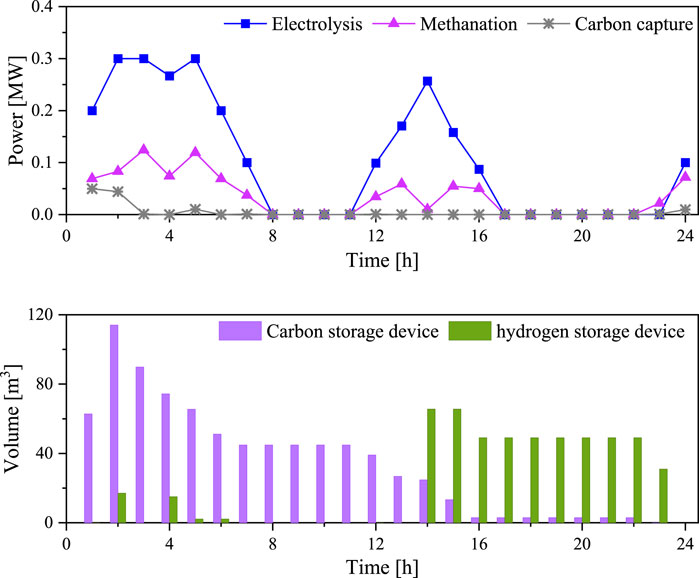
Figure 8. Operating power and stored gas quantity after adding carbon storage and hydrogen storage devices.
As shown in Figure 7, the carbon storage device can realize the decoupling of carbon capture and methanation procedures, storing excess CO2, at periods 1 and 5, and converting it into CH4 at periods 11–15. Although the degree of carbon recycling has been improved to some extent, the electrolysis of water and methanation still operate in a coupled manner, and the surplus of renewable energy generation cannot be fully utilized. The hydrogen storage device can realize the decoupling of electrolytic water and methanation procedure, generate and store H2 by using surplus renewable energy generation in periods 4 and 12–14, and consume it in periods 4–7 and 23–24 to achieve the time shift of renewable energy power. The degree of carbon recycling is also improved to a certain extent, but carbon capture and methanation still operate in a coupling manner, unable to make full use of CO2 during the entire scheduling cycle.
As shown in Figure 8, water electrolysis, methanation, and carbon capture all operate in a decoupled manner when both carbon and hydrogen storage devices are added. The carbon storage device mainly stores excess CO2 at periods 1-2, and the hydrogen storage device mainly stores excess H2 at periods 4 and 14–15. The combined use of the two gas storage devices can not only effectively use the CO2 generated during the whole dispatching cycle, but also realize the time shift of renewable energy power with H2 as the medium, and maximize the carbon recycling degree of GPPCC and P2G. At this time, the average energy utilization efficiency of VPP as a whole is about 94.17%. Among them, the average energy use efficiency of renewable energy is only 71.22%. It can be seen that although carbon capture and power to gas devices can use surplus renewable energy electricity to achieve CO2 recycling, the energy loss caused by this procedure needs to be further optimized.
6 Conclusion
In this paper, GPPCC and P2G are introduced into a combined heat and power virtual power plant to achieve CO2 recycling, and carbon storage devices and hydrogen storage devices are added to decouple carbon capture and P2G procedures. Then, the uncertainty scenario generation and CVaR theory are used to quantify the risk of load loss in VPP real-time scheduling, and the multi-objective stochastic dispatching optimization model of the virtual power plant is constructed with the target of operating cost, carbon emission, and operating risk. Finally, the validity and applicability of the model are verified by a design example, and the conclusions are as follows:
(1) The uncertainty analysis method in this paper can fully measure the risk situation in real-time scheduling, and arrange wind power generation plan and backup plans more reasonably so that VPP can obtain more benefits while avoiding risks in real-time scheduling.
(2) The GPPCC and P2G combined carbon and hydrogen storage devices can flexibly control the production and consumption of CO2 and H2, and effectively decouple the carbon capture, water electrolysis and methanation processes. At the same time, the time shift of renewable energy power is realized, thus maximizing the degree of carbon recovery. The example analysis shows that the carbon cycle degree increases by 9.46% when carbon storage device and hydrogen storage device are added at the same time.
(3) Combined carbon recycling and risk avoidance, the result of operation is better than only one measure. In Scenario 4, the total operating cost and carbon emissions are reduced by 555.89 CNY and 809.6 kg, respectively, and the VPP energy utilization efficiency reaches 94.17%.
In the future, with the continuous maturity of carbon cycle technology, CHP units, GPPCC and P2G modules will effectively improve the efficiency of CHP virtual power plants. Meanwhile, new power generation resources will be added to the VPP, such as solar thermal electric plants, electro hydrogen coupling systems, etc. Which will further improve the efficiency of VPP.
Data availability statement
The original contributions presented in the study are included in the article/supplementary material, further inquiries can be directed to the corresponding author.
Author contributions
FZ: Visualization, Writing–review and editing. YG: Visualization, Writing–review and editing. XZ: Investigation, Writing–original draft. FL: Investigation, Writing–original draft. QZ: Validation, Writing–original draft.
Funding
The author(s) declare that financial support was received for the research, authorship, and/or publication of this article. This work is supported by the State Grid Corporation of China, the Science & Technology project 5108-202218280A-2-428-XG. The funder was not involved in the study design, collection, analysis, interpretation of data, the writing of this article, or the decision to submit it for publication.
Conflict of interest
Authors FZ and YG were employed by State Grid Energy Research Institute Co., Ltd. Author XZ and FL were employed by State Grid Qinghai Electric Power Company.
The remaining authors declare that the research was conducted in the absence of any commercial or financial relationships that could be construed as a potential conflict of interest.
Publisher’s note
All claims expressed in this article are solely those of the authors and do not necessarily represent those of their affiliated organizations, or those of the publisher, the editors and the reviewers. Any product that may be evaluated in this article, or claim that may be made by its manufacturer, is not guaranteed or endorsed by the publisher.
References
Babaee, S., and Loughlin, D. H. (2018). Exploring the role of natural gas power plants with carbon capture and storage as a bridge to a low-carbon future. Clean Technol. Environ. policy 20 (2), 379–391. doi:10.1007/s10098-017-1479-x
Banadkouki, M. R. Z. (2023). Selection of strategies to improve energy efficiency in industry: a hybrid approach using entropy weight method and fuzzy TOPSIS. Energy 279, 128070. doi:10.1016/j.energy.2023.128070
Bassano, C., Deiana, P., Vilardi, G., and Verdone, N. (2020). Modeling and economic evaluation of carbon capture and storage technologies integrated into synthetic natural gas and power-to-gas plants. Appl. Energy 263, 114590. doi:10.1016/j.apenergy.2020.114590
Basu, M. (2023). Optimal day-ahead scheduling of renewable energy-based virtual power plant considering electrical, thermal and cooling energy. J. Energy Storage 65, 107363. doi:10.1016/j.est.2023.107363
De Giorgi, M. G., Congedo, P. M., Malvoni, M., and Laforgia, D. Error analysis of hybrid photovoltaic power forecasting models: a case study of mediterranean climate[J]. Energy Convers. Manag., 2015, 100: 117–130. doi:10.1016/j.enconman.2015.04.078
Feng, Y., Jia, H., Wang, X., Ning, B., Liu, Z., and Liu, D. (2023). Review of operations for multi-energy coupled virtual power plants participating in electricity market. Energy Rep. 9, 992–999. doi:10.1016/j.egyr.2023.04.149
Gorre, J., Ruoss, F., Karjunen, H., Schaffert, J., and Tynjälä, T. (2020). Cost benefits of optimizing hydrogen storage and methanation capacities for Power-to-Gas plants in dynamic operation. Appl. Energy 257, 113967. doi:10.1016/j.apenergy.2019.113967
Hao, J., Zheng, P., Li, Y., Zhang, Z., Zhang, J., Yang, J., et al. (2023). Study on the operational feasibility domain of combined heat and power generation system based on compressed carbon dioxide energy storage. Energy 291, 130122. doi:10.1016/j.energy.2023.130122
He, S., Gao, H., Chen, Z., and Liu, J. (2023). Data-driven worst conditional value at risk energy management model of energy station. Energy 266, 126421. doi:10.1016/j.energy.2022.126421
Higgins, P., Foley, A. M., Douglas, R., and Li, K. (2014). Impact of offshore wind power forecast error in a carbon constraint electricity market. Energy 76, 187–197. doi:10.1016/j.energy.2014.06.037
Ju, L., Bai, X., Li, G., Gan, W., Qi, X., and Ye, F. (2024). Two-stage robust transaction optimization model and benefit allocation strategy for new energy power stations with shared energy storage considering green certificate and virtual energy storage mode. Appl. Energy 362, 122996. doi:10.1016/j.apenergy.2024.122996
Ju, L., Zhao, R., Tan, Q., Lu, Y., and Wang, W. (2019). A multi-objective robust scheduling model and solution algorithm for a novel virtual power plant connected with power-to-gas and gas storage tank considering uncertainty and demand response. Appl. Energy 250, 1336–1355. doi:10.1016/j.apenergy.2019.05.027
Ju, L. W., Yin, Z., Lu, X. L., Yang, S., and Rao, R. (2022). A Tri-dimensional Equilibrium-based stochastic optimal dispatching model for a novel virtual power plant incorporating carbon Capture, Power-to-Gas and electric vehicle aggregator. Appl. Energy 324, 119776. doi:10.1016/j.apenergy.2022.119776
Marzi, E., Morini, M., Saletti, C., Vouros, S., Zaccaria, V., Kyprianidis, K., et al. (2023). Power-to-Gas for energy system flexibility under uncertainty in demand, production and price. Energy 284, 129212. doi:10.1016/j.energy.2023.129212
Nazari-Heris, M., Madadi, S., and Abapour, S. Optimal stochastic scheduling of virtual power plant considering NaS battery storage and combined heat and power units[J]. J. Energy Manag. Technol., 2018, 2(3): 1–7. doi:10.22109/jemt.2018.133447.1095
Schulz, C., Roder, G., and Kurrat, M. (2005) “Virtual power plants with combined heat and power micro-units,” in 2005 international conference on future power systems. Amsterdam, Netherlands: IEEE, 5.
Smit, B., Park, A. H. A., and Gadikota, G. 2014, The grand challenges in carbon capture, utilization, and storage. Front. Energy Res.: 55, doi:10.3389/fenrg.2014.00055
Song, X., Zhao, R., De, G., Wu, J., Shen, H., Tan, Z., et al. (2020). A fuzzy-based multi-objective robust optimization model for a regional hybrid energy system considering uncertainty. Energy Sci. Eng. 8 (4), 926–943. doi:10.1002/ese3.674
Tan, C., Wang, J., Geng, S., and Tan, Z. (2021). Three-level market optimization model of virtual power plant with carbon capture equipment considering copula–CVaR theory. Energy 237, 121620. doi:10.1016/j.energy.2021.121620
Wang, C., Wang, H., Ji, X., Xu, H., Yang, C., and Meng, X. (2024). Hybrid energy storage capacity configuration strategy for virtual power plants based on variable-ratio natural gas-hydrogen blending. Int. J. Hydrogen Energy 58, 433–445. doi:10.1016/j.ijhydene.2024.01.175
Xia, Y., Liu, J., Huang, Z., and Zhang, X. (2016). Carbon emission impact on the operation of virtual power plant with combined heat and power system. Front. Inf. Technol. Electron. Eng. 17, 479–488. doi:10.1631/fitee.1500467
Xuan, A., Shen, X., Guo, Q., and Sun, H. (2021). A conditional value-at-risk based planning model for integrated energy system with energy storage and renewables. Appl. Energy 294, 116971. doi:10.1016/j.apenergy.2021.116971
Yang, H., Tian, X., Liu, F., Liu, L., Li, L., and Wang, Q. (2024). A multi-objective dispatching model for a novel virtual power plant considering combined heat and power units, carbon recycling utilization, and flexible load response. Front. Energy Res. 11, 1332474. doi:10.3389/fenrg.2023.1332474
Yang, Y., Li, Z., Mandapaka, P. V., and Lo, E. Y. (2023). Risk-averse restoration of coupled power and water systems with small pumped-hydro storage and stochastic rooftop renewables. Appl. Energy 339, 120953. doi:10.1016/j.apenergy.2023.120953
Zhang, S., Gu, W., Wang, J., Zhang, X.-P., Meng, X., Lu, S., et al. (2024). Steady-state security region of integrated energy system considering thermal dynamics. IEEE Trans. Power Syst. 39, 4138–4153. doi:10.1109/tpwrs.2023.3296080
Zhang, S., Gu, W., Zhang, X.-P., Lu, H., Lu, S., Yu, R., et al. (2022). Fully analytical model of heating networks for integrated energy systems. Appl. Energy 327, 120081. doi:10.1016/j.apenergy.2022.120081
Zhang, Y., Pan, Z., Wang, H., Wang, J., Zhao, Z., and Wang, F. (2023). Achieving wind power and photovoltaic power prediction: an intelligent prediction system based on a deep learning approach. Energy 283, 129005. doi:10.1016/j.energy.2023.129005
Zhu, C., Bao, G., Xu, R., Song, Z., and Liu, Y. (2023). Low-carbon economic analysis of a virtual power plant with wind and solar power considering the integrated flexible operation mode of a carbon capture thermoelectric unit. Int. J. Greenh. Gas Control 130, 104011. doi:10.1016/j.ijggc.2023.104011
Zou, D., Gong, D., and Ouyang, H. (2023). The dynamic economic emission dispatch of the combined heat and power system integrated with a wind farm and a photovoltaic plant. Appl. Energy 351, 121890. doi:10.1016/j.apenergy.2023.121890
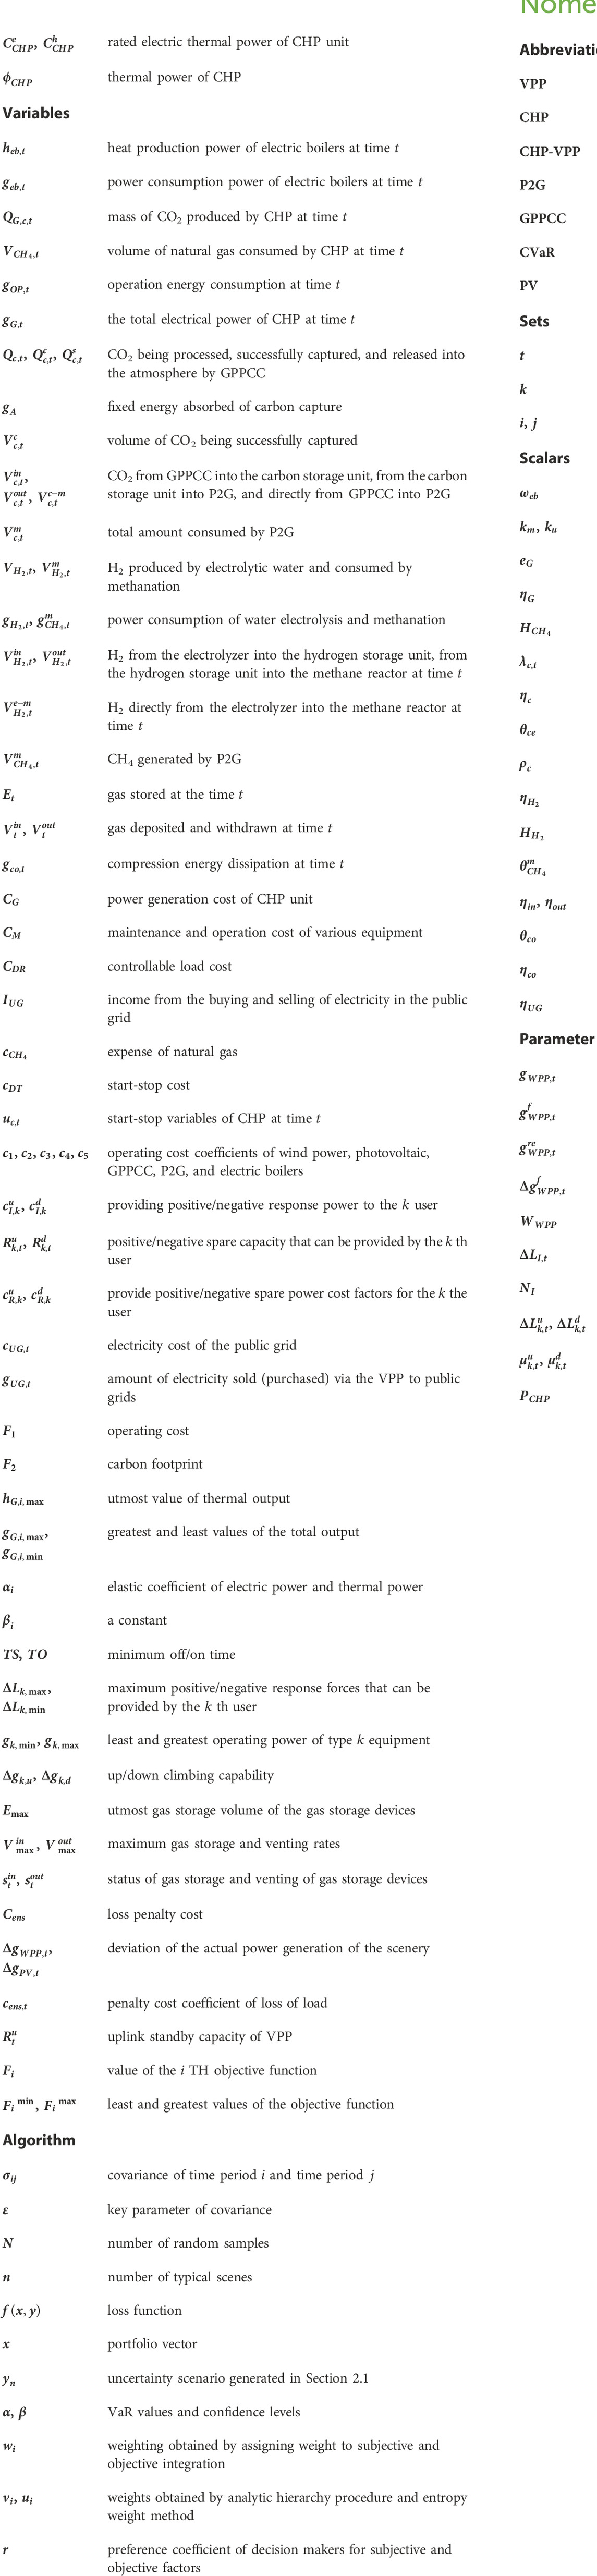
Nomenclature
Keywords: virtual power plant (VPP), combined heat and power (CHP), carbon capture, power to gas (P2G), conditional value at risk (CVaR)
Citation: Zhang F, Gong Y, Zhang X, Liu F and Zhou Q (2024) A multi-objective stochastic optimization model for combined heat and power virtual power plant considering carbon recycling and utilizing. Front. Energy Res. 12:1363360. doi: 10.3389/fenrg.2024.1363360
Received: 30 December 2023; Accepted: 10 June 2024;
Published: 21 August 2024.
Edited by:
Zhengmao Li, Aalto University, FinlandReviewed by:
Shenbo Yang, Beijing University of Technology, ChinaWei Fan, Beihang University, China
Xianyou Pan, Shanghai University of Electric Power, China
Suhan Zhang, Hong Kong Polytechnic University, Hong Kong SAR, China
Copyright © 2024 Zhang, Gong, Zhang, Liu and Zhou. This is an open-access article distributed under the terms of the Creative Commons Attribution License (CC BY). The use, distribution or reproduction in other forums is permitted, provided the original author(s) and the copyright owner(s) are credited and that the original publication in this journal is cited, in accordance with accepted academic practice. No use, distribution or reproduction is permitted which does not comply with these terms.
*Correspondence: Qingqing Zhou, NTAzNjA5MTgxQHFxLmNvbQ==