 Huachun Han
 Qun Li
- Electric Power Research Institute, State Grid Jiangsu Electric Power Co., Ltd., Nanjing, China
Introduction: Virtual Synchronous Generators (VSGs) are used in Voltage Source Converter-based Multi-Terminal High-Voltage Direct Current (VSC-MTDC) systems to enhance power system stability. However, the MTDC framework can lead to instability due to reduced inertia in certain grid areas, especially during load switching at VSC stations. This instability is exacerbated by untimely adjustments of the VSG's power setpoint, leading to voltage and frequency oscillations.
Methods: This study introduces a cooperative control approach for the DC voltage of the VSG, employing a consensus algorithm and Model Predictive Control (MPC). This method aims to achieve incremental power for the VSG and provide interactive power commands for both the grid side and the wind farm side. The consensus algorithm ensures coherent system adjustments, while the MPC algorithm tracks DC-side voltage changes in real time.
Results: The application of this cooperative control approach significantly enhances DC voltage regulation performance. It effectively reduces the extent of frequency drops and mitigates secondary frequency drop (SFD) issues, particularly those arising from the use of wind farms for frequency regulation and the associated speed recovery in wind turbine units.
Discussion: The increase in supplemental power effectively utilizes the energy stored in DC-side capacitors for power balance regulation and introduces additional inertial power into the system. Electromagnetic transient simulations have confirmed the effectiveness of the Consensus MPC-VSG method, demonstrating its ability to optimize the dynamic performance of VSC-MTDC systems and promote stability in DC voltage and frequency.
Conclusion: The findings suggest that employing the Consensus MPC-VSG method offers a promising solution for enhancing the stability and operational efficiency of VSC-MTDC systems, addressing the challenges posed by the inherent segmentation of the grid and the integration of renewable energy sources like wind farms.
1 Introduction
Wind energy, a quintessential form of renewable energy, has been experiencing a consistent annual increase in power generation capacity (Howlader et al., 2014). Offshore Wind Farms (OWFs), in particular, have garnered considerable attention in the renewable energy sector due to their minimal land usage, superior wind speeds, and extensive annual operation hours. However, their remote location necessitates considerable power transmission to connect with onshore grids. The use of Voltage Source Converter-based Multi-Terminal High-Voltage Direct Current (VSC-MTDC) has emerged as an effective solution for this problem (Lee et al., 2021; Xu et al., 2007). Compared to point-to-point High-Voltage Direct Current (HVDC) transmission systems, the formation of MTDC grids can reduce wind power curtailment, enhance reliability during equipment failures, and decrease capacity requirements for MTDC connections to asynchronous AC grids. However, MTDC divides the AC grid into regions with lower inertia, leading to a decoupling effect between OWFs and the main grid. The lack of mutual support capability among the ports can easily lead to frequency oscillations when the system is perturbed (Zhu et al., 2014; Zhu et al., 2021). Thus, while offering multiple benefits, MTDC integration of OWFs introduces certain challenges that must be addressed to ensure the reliable and stable operation of power systems.
The operation of MTDC grids is largely contingent on the active power control methods employed (Kirakosyan et al., 2023). Consequently, numerous studies have proposed improved active power regulation control techniques aimed at ensuring the continuous, reliable functioning of MTDC systems and providing grid support services. Among them, the Virtual Synchronous Generator (VSG) control strategy has garnered extensive attention in VSC-MTDC systems (Zhong and Weiss, 2011; Huan et al., 2018; Wang et al., 2020; Leon and Mauricio, 2023; Huang et al., 2017; Liu et al., 2023; Li et al., 2018; Wu et al., 2017a; Liu et al., 2022a; Cao et al., 2018; Liu et al., 2022b). The utilization of VSGs in MTDC systems introduces unique stability concerns, exacerbated during load switching events. The segmentation of the grid in the MTDC framework, leading to areas with reduced inertia, amplifies the impact of continuous power fluctuations at VSC stations during load transitions. Furthermore, the modern trend of utilizing wind farms for frequency regulation introduces an additional layer of complexity. Wind turbine units, while contributing to renewable energy generation, may inadvertently cause secondary frequency drops (SFD) during the speed recovery process. This phenomenon poses a significant threat to the overall stability of power systems. In the contemporary landscape of power systems, where the integration of renewable energy sources is gaining prominence, the significance of addressing these challenges becomes paramount. As renewable energy, including wind farms, contributes a substantial share to the overall power generation, the effective utilization of VSGs in MTDC systems becomes crucial for maintaining grid stability. In order to enhance the stability of VSG in MTDC operation (Huan et al., 2018), proposed a unified VSG control strategy aimed at improving the stability of very weak AC grids (Wang et al., 2020). put forth a VSG control method with adaptive parameter tuning to suppress low-frequency oscillations in VSC-MTDC systems (Leon and Mauricio, 2023). introduced a dual-degree of freedom VSG method to enhance inertia emulation and reference tracking constraints. However, these VSG methods primarily serve to provide frequency support to the system, thereby requiring at least one VSC for voltage control in MTDC systems. In order to apply VSG control in DC transmission system (Huang et al., 2017), presented a self-synchronizing VSG control exploiting the dynamic characteristics of the DC link capacitor to provide frequency support while also ensuring voltage control. Nonetheless, this approach only considered the frequency response and voltage control of a single VSC. For multiple interconnected VSCs, a significant risk of voltage collapse has been revealed once uneven power allocation causes VSG-controlled VSC to enter current saturation mode (Liu et al., 2023). Thereby, in MTDC systems, Grid Side VSC-Stations (GSVSC) may need to consider multiple VSCs for power sharing and voltage control. Therefore (Li et al., 2018; Wu et al., 2017a), proposed a VSG control strategy for suppressing DC side oscillations in VSC-MTDC systems, thereby providing inertia and damping characteristics while controlling DC side voltage. This DC-side VSG voltage control method retains the characteristics of droop control, allowing multiple VSCs to control DC voltage and power sharing. A coordinated VSG control proposed in Liu et al. (2022a) brought a new prospective to realize damping and inertia control according to the DC voltage (Cao et al., 2018). employed a V2-P-ω droop characteristic VSG control method to emulate system inertia and damping, redistributing DC power among GSVSCs through additional power generated by virtual rotating inertia and virtual speed regulators. In these applications, the converter station is involved in DC voltage regulation, necessitating the VSG to precisely track the power reference of the external DC voltage control loop. However, solely utilizing local variable operations and VSG controllers, power injected into the VSC station tends to fluctuate persistently without timely adjustment of the output power command when system loads switch. This can lead to significant frequency drops and substantial DC-side voltage oscillations (Li et al., 2017).
Wind turbine units participate in frequency regulation primarily by utilizing additional power injection. The frequency response control of these wind turbines, which relies on the inertia of their rotors, involves rapidly releasing rotor kinetic energy to provide brief frequency support (Attya and Hartkopf, 2013; Yang et al., 2023). However, this approach can lead to a SFD issue when wind turbine units reduce rotor speed while releasing energy to support the frequency. After exiting frequency regulation, the rotor must absorb energy to return to its initial operational state, potentially resulting in SFD, which can be even more severe than the primary frequency drop if left uncontrolled. To address the SFD issue (Ullah et al., 2008), proposes a method where, during the rotor speed recovery phase, the wind turbine unit reduces its power output by a constant value. However, this approach still encounters a significant degree of SFD (Wu et al., 2017b). suggests using energy storage systems to solve the SFD problem, but this solution increases investment costs (Kang et al., 2016). presents an improved strategy based on torque limits and introduces rotor speed as a reference for additional power, slightly below the power output at the end of the frequency regulation period, which reduces SFD to some extent. Some studies have attempted to reduce SFD to some extent by tuning frequency control parameters like inertia response control coefficients or droop control coefficients, but their effectiveness is limited (Lee et al., 2016). Most of the prior research has focused on improving wind turbine control from the wind farm side, without considering the power output balance among all VSC stations in the global MTDC system. As wind power integration continues to expand, the issue of unbalanced power output during wind turbine exit from frequency regulation can worsen, potentially exacerbating SFD problems. Therefore, this study aims to enhance DC voltage control performance to reduce the magnitude of frequency and DC voltage oscillations during load transitions and mitigate SFD in the system. This approach seeks to coordinate power balance among all VSC stations within the MTDC system.
The Model Predictive Control (MPC) optimization method has been gaining attention for its ability to handle constraints. MPC computes a series of control modifications to minimize multiple objectives and meet constraints in future time steps (Maciejowski, 2002). In HVDC systems, the application of MPC spans fast power tracking (Mariethoz et al., 2014)., electromechanical oscillation damping suppression (Fuchs et al., 2014), and secondary frequency control (Namara et al., 2016), thus playing a crucial supportive role in multi-objective coordinated control.
Currently, in the realm of enhancing control strategies for VSG within MTDC systems, the predominant focus lies on optimizing the control difference strategy at individual VSC stations. However, this approach lacks a simultaneous consideration of the influence exerted by wind farms on the frequency regulation of VSC stations. The inadequacy of attention to factors such as DC voltage regulation and coordinated control methods poses challenges in sustaining optimal dynamic performance for VSC stations within the MTDC framework. This limitation underscores the necessity for a more comprehensive and integrated control methodology to address the complexities inherent in MTDC systems and promote effective cooperation among VSC stations. In response to limitations in existing VSG control and MTDC systems, coupled with the advantages of MPC, this study proposes VSG control refinements. This approach integrates consensus variables to add interactions among VSC stations and bolstering mutual inertia effects within the system. The principal contributions of this cooperative control methodology can be summarized as follows:
1. Taking into consideration the VSG’s role in mitigating DC voltage fluctuations within the MTDC network, this study established an evaluation function for voltage stability. This function serves as a foundation for deriving the relationship between DC voltage and the injection of active power.
2. Based on the discrete model of VSG, this study formulated an objective function to facilitate the optimization control of DC voltage and active power. By utilizing the MPC method to calculate incremental power, this study derive instructions for interactive power, thereby enhancing the mutual inertia effects between system.
3. Recognizing the SFD that can arise due to the inherent comprehensive inertia control mechanisms of OWFs, the introduction of additional inertia power effectively mitigates the oscillatory effects of frequency compensation. In the presence of load disturbances, this enhanced approach optimizes the convergence of power and DC voltage output, simultaneously effectively raising the minimum point of frequency descent.
The structure of this chapter unfolds as follows: Section 2 provides a comprehensive overview of the control scheme for MTDC systems. Section 3 introduces a cooperative control approach for DC voltage regulation, which leverages consensus and MPC strategies to mitigate power fluctuations. Moreover, the stability of the controller is ascertained using Lyapunov stability theory. In Section 4, a parameter analysis methodology is established, employing the Krasovskii’s method. Section 5 applies the aforementioned DC voltage cooperative approach to the optimization control of the MTDC system, the effectiveness of which is subsequently validated through rigorous simulation studies.
2 VSC-MTDC system structure and traditional control strategies
The VSC-MTDC system encompasses various different topological structures (Rahman et al., 2016; Wang et al., 2018). A typical topology is illustrated in Figure 1, where the power generation from an OWF is collected by the Wind Farm Side VSC (WFVSC) and injected into the VSC-MTDC system. Electrical power is transmitted through long subsea cables to the Point of Common Coupling (PCC), after which the power is distributed to each GSVSC based on the control strategy.
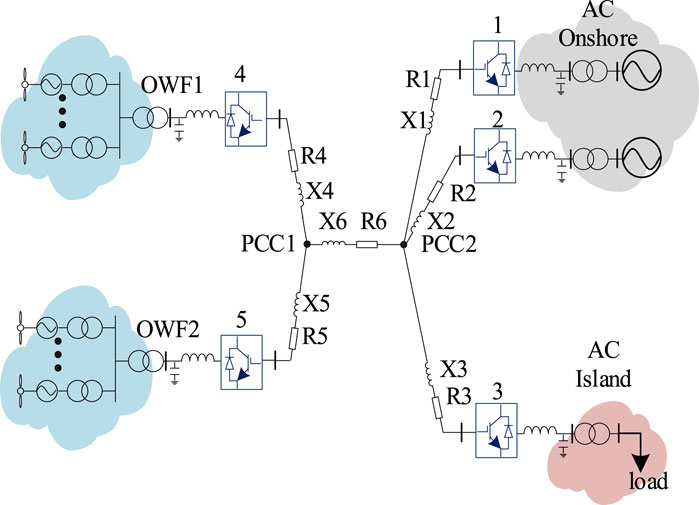
FIGURE 1. VSC-MTDC system topology diagram.
Within the VSC-MTDC system, the WFVSC and GSVSC implement distinct control strategies as shown in Figure 2. Here, Lf and Cf denote the filtering inductance and capacitance of the VSC output respectively; rf represents the equivalent resistance of the VSC filter; eabc and ilabc are the terminal voltage and current of the VSC; uoabc and ioabc are the output voltage and current of the VSC; vdc is the voltage of the DC-side capacitor. The subscript abc (dq) signifies the corresponding variables within the abc (dq) coordinate axes. Given that the OWF is considered as a weak AC grid, it requires the WFVSC to provide voltage and frequency support as depicted in Figure 2A.
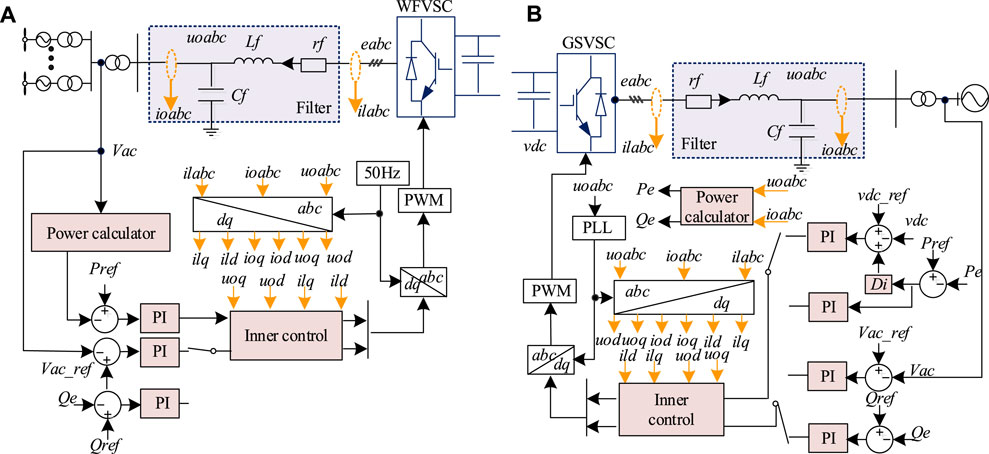
FIGURE 2. MTDC control Schematic: (A) WFVSC, and (B) GSVSC.
For the GSVSC, the primary task is to ensure the power transmission from the OWF to the grid. Current research primarily focuses on single-point voltage control or multi-machine droop control strategies to achieve master-slave or distributed control. Employing droop control strategies within a networked control system ensures good dynamic stability of the DC voltage (Wang et al., 2018), as depicted in Figure 2B.
3 MTDC cooperative DC voltage control
3.1 DC voltage control based on VSG
Traditional droop control strategies do not provide inertia and damping for the DC system. To effectively mitigate fluctuations in DC voltage, this study adopts the strategy of implementing VSG control on the GSVSC side. The governing equation for the VSG control of DC voltage is as follows (Li et al., 2018):
Where Cv and Dv represent the virtual capacitance and damping coefficient, respectively; vdcvri and vdcn denote the virtual voltage on the DC side and the rated voltage value, respectively. Pm and Pe represent the mechanical input power and electrical output power of the synchronous machine.
According to Eq. 1, it can be seen that the term for simulated inertia power is Cvdvdcvir/dt, while the term for simulated damping power is Dv (vdcvir–vdcn). Within the MTDC network, the VSG functions primarily to stabilize the DC voltage. In instances where the DC voltage experiences oscillations, the VSG will produce virtual inertia power to counter these fluctuations. This means that the generation of virtual inertia power is for the purpose of suppressing oscillatory phenomena. The speed of oscillations in DC voltage has a direct relationship with the generation of virtual inertia power within the system. Specifically, faster oscillations lead to an increased production of virtual inertia power, which offers inertia support during transient processes. Additionally, a larger virtual inertia constant equates to a slower rate of change in DC voltage, which is synonymous with a lower frequency of oscillation. The inertia power and damping power of the VSG are adjusted according to the changes in the DC side voltage. When the system tends toward stability, dvdcvir/dt = 0. The damping power of the VSG is proportional to the offset of the DC side voltage, and as long as there is a voltage offset (vdcvir–vdcn), there will be a contribution from the damping power.
According to the direction of power flow, the charging and discharging of the DC capacitor control the value of the DC-side voltage, which can be obtained as follows:
Where N is the number of DC capacitors in the VSC-MTDC; C is the capacitance of a single DC capacitor; vdci is the actual DC line voltage of the ith GSVSC controlling the DC-side voltage; SVSCi is the apparent capacity of a single converter station; Pin/Pdc and Pout/Pac are the input and output power of the VSC-MTDC system respectively; ΔPC is the per-unit value of the electromagnetic power absorbed or released by the DC capacitor.
Equation 2 reveals that in order to ensure power balance between the GSVSC and the WFVSC, the DC voltage must be controlled to be constant. However, as a capacitor is an energy storage component, it can release or absorb power by adjusting the voltage. Therefore, it is feasible to use this characteristic of the DC capacitors in the VSC-MTDC system to balance power transmission (Liu and Chen, 2015). By regulating the DC link voltage through power compensation, the VSC-MTDC system can inject more or less active power into the onshore grid than the active power collected from the OWF.
3.2 Comprehensive inertia control and SFD
Additionally, addressing the frequency regulation problem of OWF, a comprehensive inertia control method enables the wind turbine units to have an inertia response and primary frequency regulation ability (Liu and Chen, 2015; Wang and Tomsovic, 2019). In the active control loop of the wind turbine units, the rate of frequency change and frequency deviation Δf are introduced, thereby realizing the additional active power reference value in the frequency response process, as shown in Eq. 3.
Where f represents the system frequency; Δf denotes the frequency deviation; Kd is the inertia control coefficient; Kp is the droop control coefficient; ΔPadd is the additional active power.
In cases of increasing frequency, wind turbine units can easily reduce their power output through wind curtailment. However, this study chiefly addresses situations in which units augment their output power by releasing rotor kinetic energy during frequency decreases. Using comprehensive inertia control as an exemplar, this response process primarily comprises two pivotal phases: the frequency support and rotor speed recovery stages, as illustrated in Figure 3. The entire response process can be categorized into two key phases: the frequency support phase and the rotor speed recovery phase. Here, ω0 and P0 denote the initial rotor speed and unit power, respectively; ωoff signifies the rotor speed at the conclusion of frequency regulation; PW represents the unit’s power output, while ΔPW indicates the power variation observed at the conclusion of the frequency support phase.
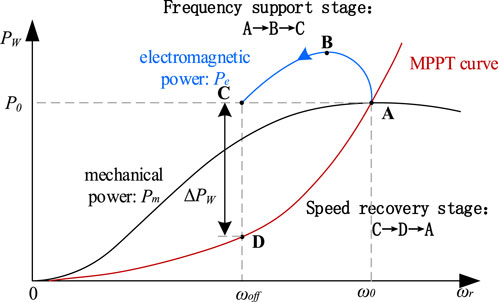
FIGURE 3. Frequency response procedure of wind turbine based on rotor kinetic energy.
This process can be delineated into four distinct stages:
1. Stage A: This represents the wind turbine unit’s normal operational state, where it operates in Maximum Power Point Tracking (MPPT) mode, producing the optimal power level, denoted as P0.
2. Stage B: When the system encounters power insufficiency, the wind turbine unit responds by augmenting its power output to support the frequency, introducing supplementary power as per Eq. 3. During this stage, the output Pe surpasses the Pm, prompting the rotor to release kinetic energy and consequently reduce its speed.
3. Stage C: The unit exits the frequency regulation phase, reducing its power output by ΔPW, and gradually restores rotor speed by following the MPPT curve.
4. Stage D: As wind turbine unit output power Pe falls below mechanical power Pm, the rotor absorbs energy. Rotor speed gradually recovers to the optimal level, reinstating an equilibrium state, and reverts to MPPT mode operation (effectively returning to Stage A).
Figure 3 illustrates that when ΔPW exceeds a certain threshold, the system inevitably experiences secondary frequency drops.
3.3 DC voltage cooperative control
Accounting for the intrinsic variability of OWF power output and the dynamic switching of grid-side loads, continuous adjustments are needed in the power of the VSC station. Without timely adaptation of the VSC station’s output power command, potential disturbances to the power balance may instigate significant frequency variations, potentially jeopardizing system stability.
Within this context, the OWF is modeled as a SG that provides supplementary power to the AC onshore grid. The balance of power in the SG is governed by the swing equation, Pm-Pe = Jωdω/dt, where J represents the moment of inertia parameter. Upon disturbance in the AC onshore gird, this balance is disrupted, prompting the energy stored in the capacitor to automatically offset the unbalanced power, leading to a reduction or oscillation in the DC voltage. Combining (3), OWF participates in system frequency regulation. From the principle of energy conservation, the following can be deduced:
When energy changes are defined as ΔEc and ΔEJ, the subsequent derivation from Eq. 4 is:
Equation 5 encapsulates the actual physical dynamics of the DC-side capacitor. Fundamentally, the energy stored in the rotor must be fully utilized during the control process to emulate the inertia stored in the virtual capacitor. For MTDC systems, this involves harnessing energy both from the OWF grid and the capacitor itself. Furthermore, voltage distribution within the MTDC system demonstrates non-uniform properties across the entire DC system. While some voltages within the MTDC grid may be well-regulated, other ports may display significant deviations from expected values (Kirakosyan et al., 2023).
In this study, to ensure fairness among VSCs participating in control tasks with VSG voltage control, the inertia power ΔPiner = Cvdvdcvir/dt is introduced as a consensus variable in the voltage control strategy. This variable is incorporated into the VSC station with voltage control as an additional power command, bolstering the DC-side voltage balancing capability, facilitating mutual inertia support, and improving frequency stability.
In the system’s initial operational phase, the power injection of the ith converter, denoted as Pi, aligns with its reference power, Pref. However, in the event of active power imbalance, the actual power injection will diverge from its reference value. If there is an overabundance of active power in the DC system, the VSC will increase its drawn power from the MTDC system. Conversely, if the DC system’s active power is lacking, the VSC will decrease its drawn power. As such, this paper proposes the introduction of power deviation, as resolved by MPC, as an adjustment variable. This adjustment pre-distributes power injection values among the VSCs, in accordance with the VSC’s output power.
For the voltage control group, let the DC-side voltage it is about to control be vdci, and this voltage can be measured in real-time. Based on the consensus protocol, the method of updating the supplemental power for the ith VSC in the group is presented as Eq. 6:
Where
If there is a communication link between VSCi and VSCj, then aij = 1, otherwise aij = 0.
Let
Where
According to Eq. 1, the rotor motion equation of the VSG can be described as a state equation, as shown in Eq. 10.
Where v(t) is defined as the difference between vdcvir and vdcn, which represents the voltage-related term in the state equation. Pm represents the control input variable, and Pe can be considered as the disturbance variable.
The discrete state equation is presented in Eq. 11:
The coefficients in Eq. 11 are detailed in Eq. 12.
Where Ts represents the sampling period. In this study, a three-step model prediction method due to its capacity for an extended prediction horizon is utilized. This allows for a more accurate representation of the system’s dynamic behavior and a stronger response to disturbances, as it can foresee changes further ahead and adjust the control strategy accordingly. The three-step prediction output vector is presented in Eq. 13:
The voltage prediction equation is presented in Eq. 14:
The coefficients in Eq. 14 are detailed in Eq. 15:
The objective function aims to minimize the weighted sum of the squared deviations of the voltage, Δv, and the change in the rated power, ΔPm, as shown in Eq. 16:
Where τ and υ are the weighting coefficients for voltage and power variations, respectively. Additionally, Δv (k+i|k) and ΔPm (k+i|k) represent the errors between the predicted voltage and power at instant k. Based on the predicted inputs, Eq. 16 can be described as follows:
Where Ty = diag (τ, τ, τ) and TP = diag (υ, υ, υ). Ty and TP are the error weighting matrices for voltage and active power, respectively. R (k+1) represents the reference values for the control outputs at time k+1. The desired steady-state Δv is zero, hence R (k+1) = [0,0,0].
Due to the presence of constraints, it is not possible to obtain an analytical solution for the optimization problem in Eq. 17. Therefore, a numerical solution method is employed, transforming the constrained MPC optimization problem into a quadratic programming (QP) formulation. To facilitate the solution of the optimization problem in Eq. 17, auxiliary variables are defined:
By substituting Eq. 14 into Eq. 17, and in conjunction with Eq. 18, it can be obtained that:
Given that
The coefficients in Eq. 20 are detailed in Eq. 21
Where
By transforming the voltage constraint in Eq. 14 into the form Cz ≥ b, Eq. 13 can be reformulated as Eq. 22:
From Eq. 23, it can be seen that the MPC optimization problem is transformed into the following QP problem description:
The coefficients in Eq. 24 are detailed in Eq. 25.
By combining Eq. 21 and Eq. 24, the solution for MPC, denoted as ΔPm*(k), can be obtained. According to the working principle of MPC, an initial control sequence will be applied to the system. In the next sampling period, the constraint optimization problem will be updated, and the solution to ΔPm*(k) will be recalculated. According to Eq. 24, the power increment in a single VSG can be quickly solved, which is the correlation value of voltage and injected power. The variation of power increment for VSG can be written as:
Through Eq. 26, the association value between voltage and active power can be obtained, where
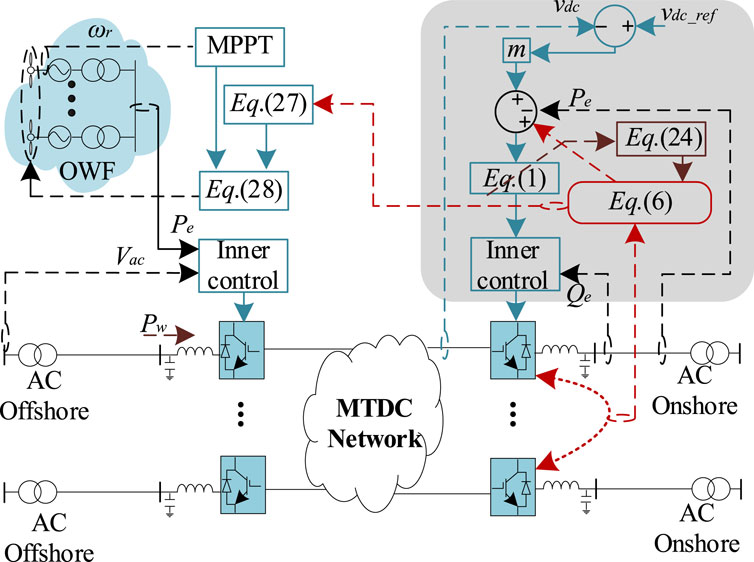
FIGURE 4. Schematic of the proposed DC voltage cooperative control.
Figure 4 illustrates the control schematic of the proposed method. In addition, in accordance with the description in Eq. 5, to fully utilize the energy from the OWF, the frequency regulation equation for the OWF is further depicted as:
Where
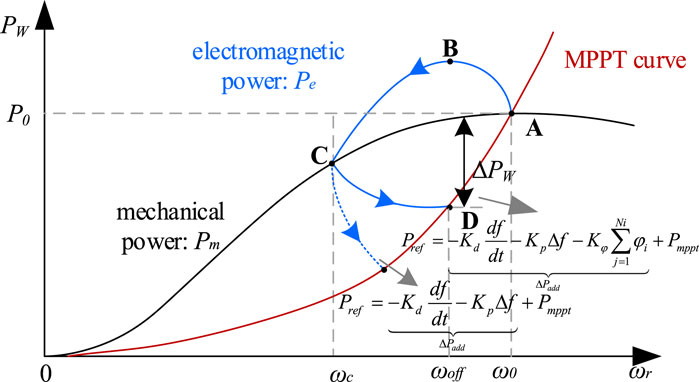
FIGURE 5. Frequency response control strategy for wind turbine units considering cooperative control.
In response to frequency fluctuations in the AC grid caused by disturbances, the VSC station will adjust its output power. This adjustment is made by leveraging the energy from the OWF and the voltage of the DC-side capacitor to compensate for power imbalance, thereby enabling quick convergence of frequency. Simultaneously, leveraging the V−P characteristic, the total power generated by the OWF will be automatically distributed to the VSC station based on the state of DC voltage and AC power.
4 MTDC parameter stability analysis
To analyze the parameters of the MTDC, a small signal analysis method is employed for parameter analysis (Kalcon et al., 2012). On the synchronous dq frame, the state-space equation of the LC filter can be expressed as:
where uodq and iodq are the dq-axis output voltage and the dq-axis output current of VSG, respectively. ildq and udq* are the dq-axis terminal current and the voltage reference of VSG, respectively.
The state-space equations of the transmission line on the dq frame are given as follows:
where ubdq is the dq-axis voltage of power grid.
The voltage reference value (ud∗,uq∗) and current reference value (ild*,ilq*) of the VSG controlled inverter are defined as follows:
Where kd-qv1p and kd-qv1i are the PI gains of the outer loop, and kd-qc1p and kd-qc1i are PI gains of the inner loop. The state variables x12 to x15 are defined to assess the modelling of controllers.
By combining Eqs 1, 2, 29, 30, 31, the small signal model of the linearized system can be delineated as follows:
Where Δx represents the state variable, Δu signifies the controller input, and Δy is defined as the output of the VSC-MTDC system. Anxn, Bnxk, Cmxn and Dmxk are respectively the state matrix, input matrix, output matrix, and direct transmission matrix of the linearized model.
Stability analysis of system parameters belongs to the broad spectrum of stability analysis issues. The stability of system parameters and the determination of parameters that satisfy system stability can be ascertained through the Lyapunov direct method. The selection of an appropriate Lyapunov function becomes crucial in determining system stability and resolving the range of control parameters. This study intends to construct a Lyapunov function using the Krasovskii method (Shuai et al., 2019; Haidar and Pepe, 2021).
According to the state equation of the system, the Lyapunov function V (∆x) and the derivative function
Where f (∆x,∆u) is the nonlinear steady n-dimensional function of the system; fT (∆x,∆u) is the transpose matrix of f (∆x,∆u); J (∆x) is the Jacobian matrix of the system, and
5 Simulink
To verify the efficacy of the proposed method, the five-port VSC-MTDC model depicted in Figure 1 is simulated using MATLAB/Simulink software. This includes two asynchronous land-based power grids and two networks of OWFs. The system parameters are based on (Wang et al., 2018), and the PI controller has been adjusted following the method proposed in (Yazdani and Iravani, 2010) to provide fast reference signal tracking. The total wind power of each OWF is 240 MW. The initial power distribution ratio of GSVSC is 3:1:2, as shown in Table 1. The control parameters are delineated in Table 2.
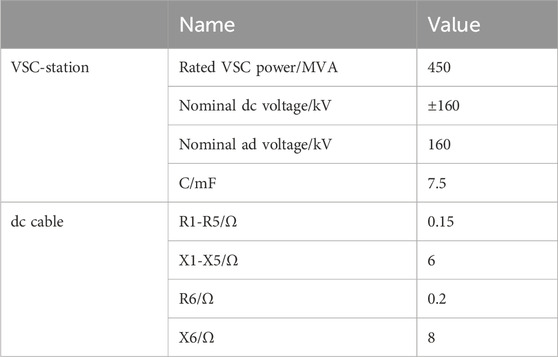
TABLE 1. Initial parameters.
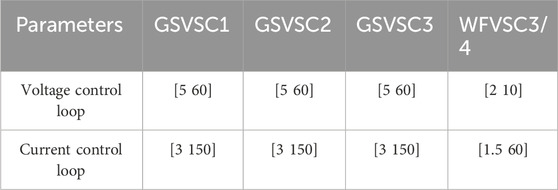
TABLE 2. Control parameters.
5.1 Influence of the DC-Link capacitors’ size
Different DC-side capacitors can contribute differently to the system’s power, thus the relationships between various virtual capacitors Cv, damping coefficients Dv, and DC-side capacitor C are analyzed. The given power of VSG1 is taken as the input variable, while the active power of VSG1 is set as the output variable. The feasible parameter domain for variables is solved based on Eqs 32 and 33, and the system’s resonance peak Mr under various parameters is obtained using the direct transmission matrix of the linearized model, as shown in Figure 6. The color gradient serves as a visual representation denoting the magnitude of the resonance peak Mr, which is applied here as an indicator for assessing the system’s comparative stability. Typically, a heightened resonance peak tends to correlate with diminished relative stability.
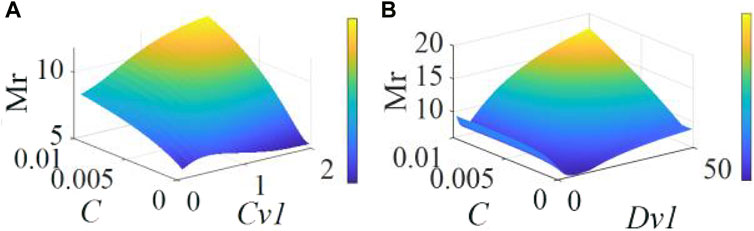
FIGURE 6. Resonant peak of system. (A) C and Cv1, and (B) C and Dv1.
Figure 6 reveals the significant impact of capacitor capacity on system stability. As the capacitor size increases, the system’s stability correspondingly decreases. This phenomenon occurs because, despite a larger DC link capacitor’s ability to greatly reduce DC voltage fluctuations, under these conditions, the GSVSC unable absorb more power from the DC network to provide the necessary power support. Furthermore, grid frequency deviation increases with the growth of the DC link capacitor, which further exacerbates the decline in stability.
Figure 7 shows the schematic diagram of the effects of changes in Cv1 and Dv1 parameters on system stability. Although the system can maintain asymptotic stability within a large range, larger inertia parameters require matching with larger capacitors. Overall, the size of the capacitor, virtual capacitor, and damping coefficient directly affect the system’s stability. In order to achieve optimal performance, these factors need to be considered comprehensively and adjusted appropriately. In this paper, Cv1 = 1.3,Dv1 = 7.5; Cv2 = 1.1, Dv2 = 2.5; Cv3 = 1.2, Dv3 = 5 are selected.
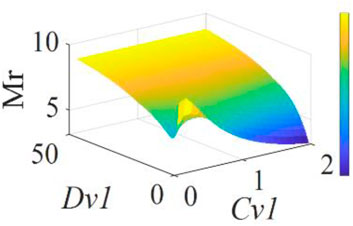
FIGURE 7. Resonant peak of system.
5.2 Performance during load switching
To assess the effectiveness of the control strategy, a load switching experiment was conducted at 8 s. The assigned values for the parameters in this context are as follows: Kp = 1.5,Kd = 0.5,
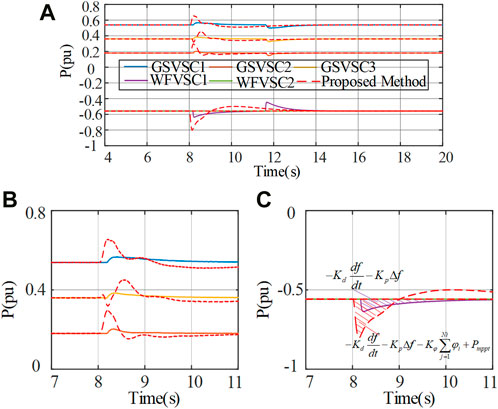
FIGURE 8. Power output comparison: (A) active power, (B) enlarged view of GSVSC, and (C) enlarged view of WFVSC.
Figure 9 presents the frequency variations during load switching in the system. Load switching in AC onshore grid 1 introduces noticeable frequency fluctuations in GSVSC1. Traditional control strategies maintain a minimum frequency point at 49.8 Hz, while the proposed cooperative control approach achieves 49.83 Hz, as shown in Figure 9B. When OWF performs secondary frequency adjustment for GSVSC, relying solely on traditional comprehensive inertia control may lead to SFD. However, the introduction of the proposed voltage cooperative control effectively mitigates SFD, as shown in Figures 9B–D. These figures display before-and-after comparisons of the frequencies for GSVSC1-3 when employing the proposed method. After the adoption of the proposed method, the overall frequency variations in the system exhibit improved convergence, accompanied by a reduction in the impact of SFD.
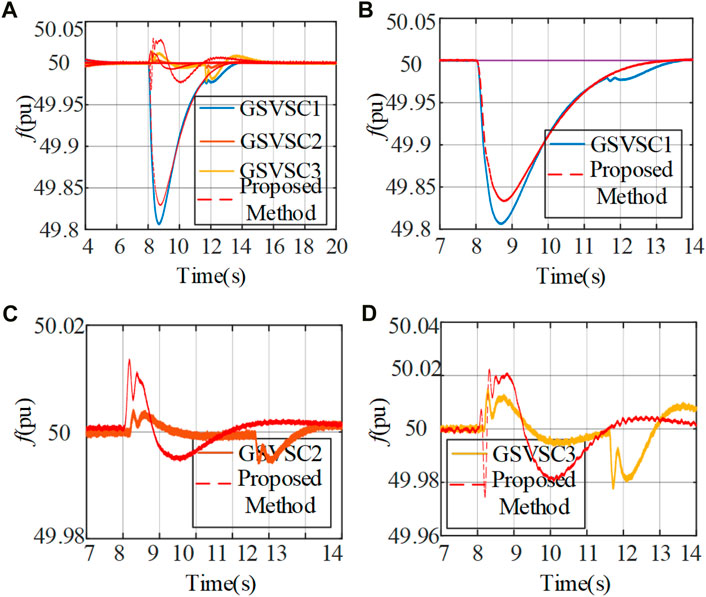
FIGURE 9. Dynamic performance of load change: (A) output frequency, (B) enlarged view of GSVSC1, (C) enlarged view of GSVSC2, and (D) enlarged view of GSVSC3.
Regarding fluctuations in DC voltage, the effectiveness of the proposed coordinated control method in leveraging the stored energy within DC-side capacitors to mitigate power variations is illustrated in Figure 10. Through coordinated control, there is efficient utilization of the energy reserves stored in the DC-side capacitors for power regulation. This results in reduced frequency variations, thereby achieving a smoother output.
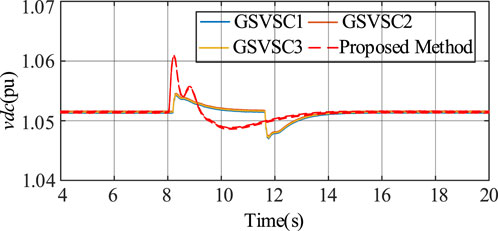
FIGURE 10. Dynamic performance under load change of DC voltage.
Figure 11 illustrates the corresponding supplemental power output. It is evident from Figure 11 that when the system attains stability, the supplemental power reaches zero, having no impact on the system’s output. Furthermore, by utilizing the correlation values between voltage and injected power, calculated through MPC, the system effectively tracks changes in active power. This verification underscores the efficacy of the proposed method under load switching conditions and its robustness in response to variations in load.
FIGURE 11. Consensus variable.
During the regulation process, only OWF1 participates in frequency regulation. In previous research, the frequency dead zone is generally selected to be (±0.02∼0.05) Hz, while in this paper, ±0.02 Hz is chosen. As shown in Figure 8, at t = 11.8 s, OWF1 exits frequency regulation work. Meanwhile, to ensure that the unit has certain frequency regulation capabilities and to reduce instances of unit stall and shutdown, this study stipulates that the output power of the unit involved in frequency response from OWF1 should not be less than 20% of the rated capacity.
5.3 Performance analysis in agent loss scenarios
Figures 12–15 showcase the assessment of the proposed method’s performance in the case of agent loss. Within this set, Figure 12A presents a global comparison chart of active power output, while Figures 12B, C offers a detailed enlargement of the power. At t = 10 s, GSVSC2 loses communication with others, signifying an agent loss scenario. It is noteworthy that GSVSG2 can continue to function normally based on the predefined default reference (0 kW). Concurrently, the remaining VSGs can continue to function normally. Under cooperative control, the OWF also contributes additional active power for system balance regulation, as depicted in Figure 12C.
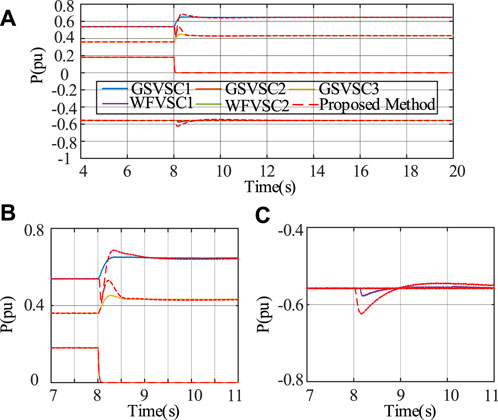
FIGURE 12. Dynamic performance under agent loss: (A) active power, (B) enlarged view of GSVSC, and (C) enlarged view of WFVSC.
Figure 13 illustrates the frequency variation output curve. Given GSVSC2’s limited frequency fluctuations during power output changes, traditional control strategies yield reduced SFD. Nonetheless, the adoption of the proposed coordinated control method improves frequency convergence for GSVSC1 and GSVSC3 while mitigating the frequency drop in GSVSC2. This results in an overall enhancement of frequency convergence and system stability.
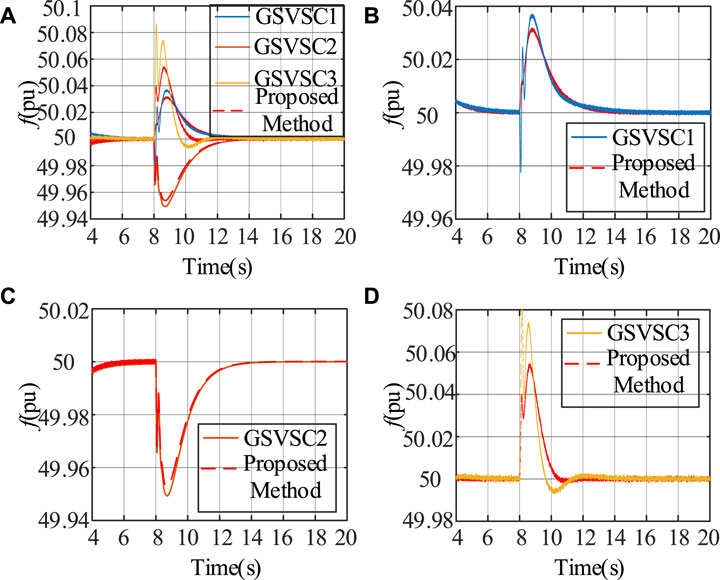
FIGURE 13. Dynamic performance under agent loss: (A) output frequency, (B) GSVSC1, (C) GSVSC2, and (D) GSVSC3.
Figure 14 displays a comparative plot of voltage output curves. With the adoption of the proposed coordinated control method, DC-side capacitors release additional energy to fulfill the system’s power demands and expedite convergence to a stable state when the system reaches equilibrium. This highlights the efficient utilization of energy stored in the DC-side capacitors. Figure 15 illustrates the corresponding supplemental power output.
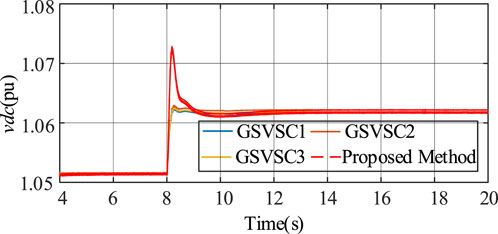
FIGURE 14. Dynamic performance under agent loss of DC voltage.
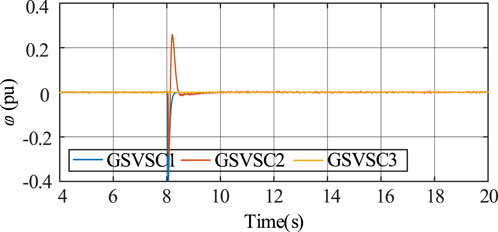
FIGURE 15. Consensus variable of the proposed method.
The simulation results reveal the effectiveness and robustness of the proposed method in cases of agent loss. Although the communication capabilities of the agent may be interrupted due to malfunctions, the proposed method ensures the stable operation of the power system and successfully suppresses excessive voltage and frequency fluctuations. This also highlights the superiority and potential of the method when faced with system imbalances and uncertainties.
5.4 Performance analysis under non-ideal communication
In a communication system, latency encompasses various components, including system fault detection and trip time, transmission delay, and control total delay. These components can be quantified as follows: fault detection time is 3 ms, and the average trip time is 6 ms. Transmission delay is directly proportional to the length of the communication line, represented as 2 times the line length divided by the speed of light. The control total delay, which encompasses network power flow calculations, is fixed at 10 ms. For instance, assuming a VSC interstation line length of 150 km, the resulting communication delay τij is calculated as 20 ms. To assess the algorithm’s effectiveness in the presence of communication delays, a total delay of τij = 1,000 ms is designated within the MTDC for validation purposes. In a suboptimal communication setting, the reception of information from node j to node i can be described as follows:
Where ξij(k) is the communication delay; μij(k) is the channel noise using Gaussian noise simulation. Integrate (34) into the system's input signal to simulate the scenario of operating in a non-ideal communication environment.
Figure 16 provides a robustness assessment in a non-ideal communication network environment, specifically with ξij = 1000 ms. Figure 16A visualizes μij(k). As illuminated by Figures 16B–D, the proposed method sustains its performance effectively amidst substantial communication delays. These figures underscore that the system retains its stability notwithstanding the pronounced communication delays. By demanding less data transmission, the proposed method enhances the communication delay margin, demonstrating the robustness and resilience of this control strategy under non-ideal network conditions.
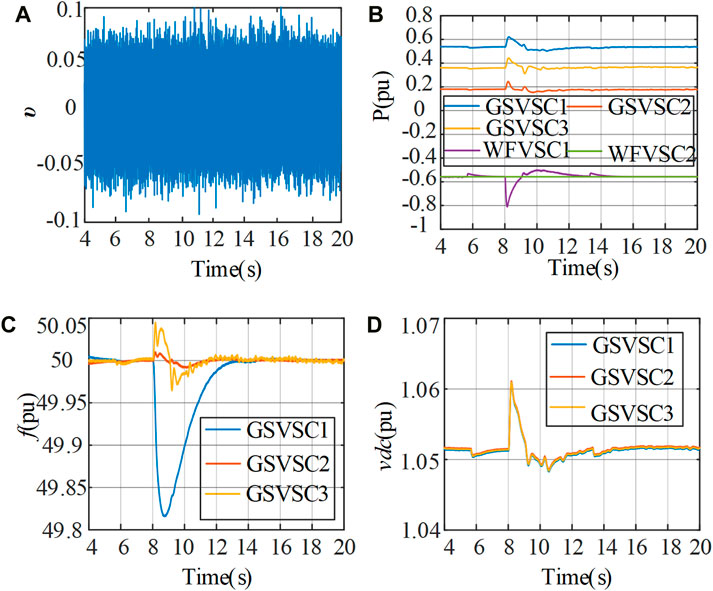
FIGURE 16. Dynamic performance under non-ideal communication: (A) communication noise, (B) active power, (C) output frequency, and (D) DC voltage.
6 Conclusion
This paper has explored a VSC-MTDC voltage operation control strategy based on the VSG consensus MPC algorithm. Within the MTDC system, a challenge emerges during power regulation–the absence of inertial interaction support at the VSC station. To address this issue, this paper proposes a cooperative control strategy, incorporating MPC for VSG power increment acquisition, and employing a consensus algorithm to enhance inter-MTDC system inertia. After in-depth research and analysis, the main conclusions are as follows:
1) The proposed cooperative control strategy employs MPC to manage VSG power increments as an adjustment parameter for DC voltage control, effectively utilizing the DC-side capacitor voltage energy for power imbalance regulation. Importantly, this strategy demands minimal communication information for implementation.
2) Under the influence of supplementary power, the convergence rates of system DC voltage, active power, and output frequency have all been enhanced. Simultaneously, the adverse effects of SFD resulting from OWF frequency regulation have correspondingly decreased.
3) Simulation results demonstrate that, in comparison to the conventional DC voltage VSG control method, the cooperative control strategy presented in this study significantly mitigates frequency droop, improves power balance among different VSC stations, and maximizes the utilization of energy from DC-side capacitors. Notably, even in scenarios characterized by agent loss or non-ideal communication, the algorithm remains effective, showcasing notable attributes of high latency tolerance and robust convergence.
Data availability statement
The original contributions presented in the study are included in the article/supplementary material, further inquiries can be directed to the corresponding author.
Author contributions
HH: Conceptualization, Data curation, Investigation, Methodology, Writing–original draft. QuL: Conceptualization, Formal Analysis, Methodology, Resources, Writing–review and editing. QiL: Investigation, Software, Validation, Writing–review and editing.
Funding
The author(s) declare financial support was received for the research, authorship, and/or publication of this article. This research was funded by the Science and Technology Project of State Grid Corporation of China, grant number 5100-202118472A-0-5-ZN.
Conflict of interest
Authors HH, QuL, and QiL were employed by State Grid Jiangsu Electric Power Co., Ltd.
Publisher’s note
All claims expressed in this article are solely those of the authors and do not necessarily represent those of their affiliated organizations, or those of the publisher, the editors and the reviewers. Any product that may be evaluated in this article, or claim that may be made by its manufacturer, is not guaranteed or endorsed by the publisher.
References
Attya, A., and Hartkopf, T. (2013). Control and quantification of kinetic energy released by wind farms during power system frequency drops. IET Renew. Power Gener. 7 (3), 210–224. doi:10.1049/iet-rpg.2012.0163
Cao, Y., Wang, W.-Y., Li, Y., Tan, Y., Chen, C., He, L., et al. (2018). A virtual synchronous generator control strategy for VSC-MTDC systems. IEEE Trans. Energy Convers. 33 (2), 750–761. doi:10.1109/tec.2017.2780920
Fuchs, A., Imhof, M., Demiray, T., and Morari, M. (2014). Stabilization of large power systems using VSC-HVDC and model predictive control. IEEE Trans. Power Del 29 (1), 480–488. doi:10.1109/tpwrd.2013.2280467
Haidar, I., and Pepe, P. (2021). Lyapunov—Krasovskii characterizations of stability notions for switching retarded systems. IEEE Trans. Autom. Control. 66 (1), 437–443. doi:10.1109/tac.2020.2979754
Howlader, A.-M., Urasaki, N., and Saber, A.-Y. (2014). Control strategies for wind-farm-based smart grid system. IEEE Trans. Ind. Appl. 50 (5), 3591–3601. doi:10.1109/tia.2014.2304411
Huan, L.-B., Xin, H.-H., Yang, H., Wang, Z., and Xie, H. (2018). Interconnecting very weak AC systems by multiterminal VSC-HVDC links with a unified virtual synchronous control. IEEE J. Emerg. Sel. Top. Power Electron. 6 (3), 1041–1053. doi:10.1109/jestpe.2018.2825391
Huang, L.-B., Xin, H.-H., and Yang, H. (2017). A virtual synchronous control for voltage-source converters utilizing dynamics of DC-link capacitor to realize self-synchronization. IEEE J. Emerg. Sel. Top. Power Electron. 5 (4), 1565–1572. doi:10.1109/jestpe.2017.2740424
Kalcon, G.-O., Adam, G.-P., Anaya-Lara, O., Lo, S., and Uhlen, K. (2012). Small signal stability analysis of multi-terminal VSC-based DC transmission systems. IEEE Trans. Power Syst. 27 (4), 1818–1830. doi:10.1109/tpwrs.2012.2190531
Kang, M., Kim, K., Muljadi, E., Park, J., and Kang, Y.-C. (2016). Frequency control support of a doubly-fed induction generator based on the torque limit. IEEE Trans. Power Syst. 3 (6), 4575–4583. doi:10.1109/tpwrs.2015.2514240
Kirakosyan, A., Ameli, A., Tarek, H.-M., Fouly, E. L., Salama, M. M. A., and El-Saadany, E. F. (2023). A novel control technique for enhancing the operation of MTDC grids. IEEE Trans. Power Syst. 38 (1), 559–571. doi:10.1109/tpwrs.2022.3155692
Lee, G. S., Moon, S. I., and Kwon, D. H. (2021). DC current and voltage droop control method of hybrid HVDC systems for an offshore wind farm connection to enhance AC voltage stability. IEEE Trans. Energy Convers. 36 (1), 468–479. doi:10.1109/TEC.2020.3005777
Lee, J., Muljadi, E., Sørensen, P., and Kang, Y.-C. (2016). Releasable kinetic energy-based inertial control of a DFIG wind power plant. IEEE Trans. Sustain. Energy. 7 (1), 279–328. doi:10.1109/tste.2015.2493165
Leon, A.-E., and Mauricio, J.-M. (2023). Virtual synchronous generator for VSC-HVDC stations with DC voltage control. IEEE Trans. Power Syst. 38 (1), 728–738. doi:10.1109/tpwrs.2022.3164027
Li, C., Li, Y., Cao, Y., Zhu, H., Rehtanz, C., and Hager, U. (2018). Virtual synchronous generator control for damping DC-side resonance of VSCMTDC system. IEEE J. Emerg. Sel. Top. Power Electron. 6 (3), 1054–1064. doi:10.1109/jestpe.2018.2827361
Li, D., Zhu, Q., Lin, S., and Bian, X.-Y. (2017). A self-adaptive inertia and damping combination control of VSG to support frequency stability. IEEE Trans. Energy Convers. 32 (1), 397–398. doi:10.1109/tec.2016.2623982
Li, Q., Gao, D.-W., Zhang, H., Wu, Z., and Wang, F. (2019). Consensus-based distributed economic dispatch control method in power systems. IEEE Trans. Smart Grid. 10 (1), 941–954. doi:10.1109/tsg.2017.2756041
Liu, H., and Chen, Z. (2015). Contribution of VSC-HVDC to frequency regulation of power systems with offshore wind generation. IEEE Trans. Energy Convers. 30 (3), 918–926. doi:10.1109/tec.2015.2417130
Liu, Y., Wang, Y., Liu, H., Xiong, L., and Peng, Y. (2022b). An LVRT strategy with quantitative design of virtual impedance for VSG. Int. J. Electr. Power Energy Sys. 140, 107661. doi:10.1016/j.ijepes.2021.107661
Liu, Y., Wang, Y., Liu, X., Wang, M., Xu, Z., and Liu, H. (2023). Steady-state angle stability analysis of parallel grid-forming converters in current saturation mode. IEEE Trans. Power Electron 38 (7), 8039–8044. doi:10.1109/tpel.2023.3267624
Liu, Y., Wang, Y., Wang, M., Xu, Z., Peng, Y., and Li, M. (2022a). Coordinated VSG control of photovoltaic/battery system for Maximum power output and grid supporting. IEEE J. Emerg. Sel. Top. Power Electron. 12 (1), 301–309. doi:10.1109/JETCAS.2022.3143716
Mariethoz, S., Fuchs, A., and Morari, M. (2014). A VSC-HVDC decentralized model predictive control scheme for fast power tracking. IEEE Trans. Power Del. 29 (1), 462–471. doi:10.1109/tpwrd.2013.2265277
Namara, P.-Mc., Negenborn, R.-R., Schutter, B.-D., Lightbody, G., and McLoone, S. (2016). Distributed MPC for frequency regulation in multi-terminal HVDC grids. Control Eng. Pract. 46, 176–187. doi:10.1016/j.conengprac.2015.11.001
Rahman, M.-H., Xu, L., and Yao, L. (2016). Protection of large partitioned MTDC networks using dc-dc converters and circuit breakers. Prot. Control Mod. Power Syst. 1 (2), 19–9. doi:10.1186/s41601-016-0030-0
Shuai, Z.-K., Shen, C., Liu, X., Li, Z., and Shen, Z. J. (2019). Transient angle stability of virtual synchronous generators using lyapunov’s direct method. IEEE Trans. Smart Grid. 10 (4), 4648–4661. doi:10.1109/tsg.2018.2866122
Ullah, N.-R., Thiringer, T., and Karlsson, D. (2008). Temporary primary frequency control support by variable speed wind turbines—potentialand applications. IEEE Trans. Power Syst. 23 (2), 601–612. doi:10.1109/tpwrs.2008.920076
Wang, S., and Tomsovic, K. (2019). Fast frequency support from wind turbine generators with auxiliary dynamic demand control. IEEE Trans. Power Syst. 34 (5), 3340–3348. doi:10.1109/tpwrs.2019.2911232
Wang, W.-Y., Jiang, L., Cao, Y.-J., and Li, Y. (2020). A parameter alternating VSG controller of VSC-MTDC systems for low frequency oscillation damping. IEEE Trans. Power Syst. 35 (6), 4609–4621. doi:10.1109/tpwrs.2020.2997859
Wang, W.-Y., Li, Y., Cao, Y.-J., Häger, U., and Rehtanz, C. (2018). Adaptive droop control of VSC-MTDC system for frequency support and power sharing. IEEE Trans. Power Syst. 33 (2), 1264–1274. doi:10.1109/tpwrs.2017.2719002
Wu, W.-H., Chen, Y.-D., Luo, A., Zhou, L., Zhou, X., Yang, L., et al. (2017a). A virtual inertia control strategy for DC microgrids analogized with virtual synchronous machines. IEEE Trans. Ind. Electron. 64 (7), 6005–6016. doi:10.1109/tie.2016.2645898
Wu, Z.-P., Gao, D.-W., Zhang, H., Yan, S., and Wang, X. (2017b). Coordinated control strategy of battery energy storage system and PMSG-WTG to enhance system frequency regulation capability. IEEE Trans. Sustain. Energy. 8 (3), 1330–1343. doi:10.1109/tste.2017.2679716
Xu, L., Yao, L., and Sasse, C. (2007). Grid integration of large DFIG-based wind farms using VSC transmission. IEEE Trans. Power Syst. 20 (3), 976–984. doi:10.1109/tpwrs.2007.901306
Yang, D., Wang, X., Chen, W., Jin, Z., and Jin, E. (2023). Adaptive frequency droop feedback control-based power tracking operation of a DFIG for temporary frequency regulation. IEEE Trans. Power Syst. Early access 2023, 1–10. doi:10.1109/TPWRS.2023.3277009
Yazdani, A., and Iravani, R. (2010). Voltage-sourced converters in power systems: modeling, control and applications. New York, NY, USA: Wiley.
Zhong, Q.-C., and Weiss, G. (2011). Synchronverters: inverters that mimic synchronous generators. IEEE Trans. Ind. Electron. 58 (4), 1259–1267. doi:10.1109/tie.2010.2048839
Zhu, J.-B., Guerrero, J.-M., Hung, W., Booth, C. D., and Adam, G. P. (2014). Generic inertia emulation controller for multi-terminal voltage-source-converter high voltage direct current systems. IET Renew. Power Gener. 8 (7), 740–748. doi:10.1049/iet-rpg.2014.0109
Keywords: VSC-MTDC, VSG, DC voltage, MPC, consensus algorithm, SFD
Citation: Han H, Li Q and Li Q (2024) Cooperative control of the DC-link voltage in VSC-MTDC grid via virtual synchronous generators. Front. Energy Res. 12:1363323. doi: 10.3389/fenrg.2024.1363323
Received: 30 December 2023; Accepted: 06 February 2024;
Published: 12 March 2024.
Edited by:
Liansong Xiong, Xi’an Jiaotong University, ChinaReviewed by:
Xiaokang Liu, Polytechnic University of Milan, ItalyWenzhou Lu, Jiangnan University, China
Longjun Wang, South China University of Technology, China
Copyright © 2024 Han, Li and Li. This is an open-access article distributed under the terms of the Creative Commons Attribution License (CC BY). The use, distribution or reproduction in other forums is permitted, provided the original author(s) and the copyright owner(s) are credited and that the original publication in this journal is cited, in accordance with accepted academic practice. No use, distribution or reproduction is permitted which does not comply with these terms.
*Correspondence: Huachun Han, aGFuaHVhY2h1bl9zZ2NjQDE2My5jb20=