 Xiu Ji
 Meiyue Li
 Meng Li
 Huanhuan Han
94% of researchers rate our articles as excellent or good
Learn more about the work of our research integrity team to safeguard the quality of each article we publish.
Find out more
ORIGINAL RESEARCH article
Front. Energy Res. , 25 July 2024
Sec. Smart Grids
Volume 12 - 2024 | https://doi.org/10.3389/fenrg.2024.1361306
This article is part of the Research Topic Demand Side Management in Microgrids View all 10 articles
Under the background of “carbon peak and carbon neutrality”, the interconnection of multiple regional integrated energy systems has become an important way to coordinate multiple energy sources and save energy and reduce emissions. This paper proposes a low-carbon economic dispatch model for multi-regional integrated energy systems considering the joint demand response mechanism; first, the concept and model of joint demand response are proposed, and on this basis, the energy conversion model between multiple energy forms in the multi-regional integrated energy system is studied; secondly, green certificate trading and carbon trading mechanisms are introduced, and green certificate trading and carbon trading are combined through the green certificate emission reduction mechanism; finally, a low-carbon economic dispatch model is proposed with the goal of minimizing the sum of system energy purchase cost, green certificate trading cost, carbon trading cost and joint demand response compensation cost. The example results show that the introduction of joint demand response mechanism and green certificate-carbon trading mechanism in the multi-regional integrated energy system reduces the total system cost and carbon emissions by 14.03% and 26.04% respectively.
With the “dual carbon” goal being proposed, accelerating the planning of renewable energy development has become an important measure for the power system revolution. However, factors such as the immaturity of technology and the mismatch between renewable energy and power load have hindered the realization of this goal. The emergence of integrated energy systems has provided an effective way to solve these problems (Jiang et al., 2022; Jiang et al., 2023; Yi et al., 2024).
There are many differences in control characteristics and network characteristics. At present, most research focuses on modeling are many different dynamic energy flows in the integrated energy system, and the dispatch command response proc methods, dispatch strategies, demand response and market mechanisms. For the integrated energy system in a specific area, when actually executing equipment dispatch commands, due to its single load characteristics and certain technical limitations, it may bring additional operation and maintenance costs to the long-term investment of certain equipment, thereby posing a threat to the safe and economic operation of the system (Ling et al., 2019). Therefore, establishing an integrated energy system that considers multiple uncertainties in regional joint operation, namely, a multi-regional integrated energy system (MDIESs), can make full use of the advantages of multi-regional integrated energy systems to avoid resource waste and insufficient energy supply, and can also effectively solve the limitations of the technology and equipment of a single regional integrated energy system.
This paper mainly studies multiple regional integrated energy systems with load regulation characteristics, whose main electricity, natural gas, and heat energy are supplied by connecting different energy sources to the regional external network. This multi-regional integrated energy system can be regarded as a larger “load” or a “load” with energy storage characteristics. It coordinates and dispatches in the input, conversion, and consumption of energy, which can meet the requirements of different load demands of users and achieve the overall goal of improving the economic efficiency of the interconnected system. At the same time, users in a single region adjust their previous electricity consumption methods and energy arrangements, and by interconnecting multiple regional integrated energy systems as a whole, strengthen the coordinated regulation of energy between regions, and participate in the energy regulation of the large power grid at different times as a whole, so as to achieve the goal of presenting the overall joint demand response characteristics to the outside world (Gan et al., 2021; Zhang et al., 2022; Gao et al., 2024).
By optimizing the demand-side response of the load of the multi-regional integrated energy system, the coordinated dispatching capability and operating economy of the multi-regional integrated energy system can be improved. Reference (Wang et al., 2022) introduces demand-side management considering user satisfaction for multi-electric-gas interconnected integrated energy systems with different wind power penetration rates, and proposes a multi-energy system coordinated dispatching model considering the day-ahead interconnection line dispatching plan; Reference (Zhou et al., 2022) takes the minimum expected operating cost of the integrated energy system as the goal, and establishes an energy Internet stochastic optimization model considering comprehensive demand response.
With the development of integrated energy systems, it is urgent to reduce carbon emissions within the integrated energy system. There are two main ways to solve this problem. One is to increase the use of low-carbon energy in energy supply, and the other is to reduce carbon dioxide emissions from various end-use sectors on the load side (Zhang and Liu, 2023). From a market perspective, for the first approach, green certificate trading (GCT) is considered to be a promising way to promote the penetration of renewable energy generation into the electricity market; for the second approach, carbon emission trading (CET) is considered to be an effective mitigation mechanism to reduce global greenhouse gas emissions.
At present, many studies have explored the impact of CET on the low-carbon economic operation of regional integrated energy systems. Reference (Gao et al., 2024) introduced the CET mechanism into the economic optimization model of the integrated energy system, discussed the unit output before and after the introduction of the CET mechanism, and verified the effectiveness of the CET mechanism in reducing IES carbon emissions. Reference (Guo and Zhou, 2023) improved the CET mechanism, divided the unit carbon trading price into segments according to the range of carbon emissions, proposed a ladder-type carbon trading price, and then carried out the optimization scheduling of the integrated energy system with the minimum sum of the ladder-type carbon trading cost and the operating cost as the optimization goal. With the continuous increase in the penetration rate of high-proportion renewable energy, improving the consumption of renewable energy is an important method to reduce carbon emissions. The GCT mechanism provides favorable policy support for improving the absorption capacity of renewable energy (Yue et al., 2023). Reference (Fan et al., 2023) established a bilateral transaction model between distribution companies and renewable energy generators based on cooperative game theory and the GCT mechanism, which improved the absorption capacity of renewable energy. Reference (Gao et al., 2021) proposed an IES operation optimization model based on the GCT mechanism that takes into account the responsibility weight of renewable energy absorption, which improved the proportion of green electricity and system economy.
With the gradual improvement of the CET market and the GCT market, the mutual incentive and complementary characteristics of the two markets have attracted widespread attention (Li et al., 2023; Zhang and Liu, 2023). The above literature only considers the impact of the CET mechanism or the GCT mechanism on the optimal operation of IES, and does not study the impact of CET and GCT acting on the optimal operation of IES at the same time, which cannot give full play to the low-carbon operation characteristics of the multi-regional integrated energy system.
Therefore, this paper connects multiple regional integrated energy systems through electricity, gas, and heat networks to form a multi-regional integrated energy interconnection system, and establishes a multi-regional integrated energy system interconnection coordination optimization to achieve the “integrated demand side response (IDSR)” of the entire interconnected system. Considering the load balance constraints of electricity, gas, heat, and cooling, a low-carbon economic dispatch model of the multi-regional integrated energy system is established, and a multi-regional integrated energy low-carbon economic dispatch strategy considering the joint demand side response is proposed.
The main contributions of this paper are:
1. Compared with a single regional integrated energy system, a multi-regional integrated energy system can effectively fill the gap in the coordination of time and space scales of a single regional integrated energy system and improve the stability of the system;
2. A joint demand response mechanism is proposed, and its working principle and impact on system operation are analyzed;
3. A green certificate-carbon joint trading model is introduced, and a GCT and step-by-step carbon trading cost calculation model is constructed to guide users to change their energy behavior;
4. With the goal of minimizing the total cost of a multi-regional integrated energy system, an economic operation model of an integrated energy system considering green certificate-carbon joint trading and joint demand response is established, and the impact of GCT, carbon trading and demand response mechanisms on IES operating costs is studied, in order to provide a reference for promoting the realization of the “dual carbon” goal.
IDSR refers to clustering multiple regional IES that can be regarded as “adjustable loads” into a “joint” organic whole on the basis of traditional demand-side response, not just individual regional-level IES. Load regulation and demand response issues are considered internally, and through coordinated dispatch among various regional integrated energy systems, the interconnected system formed by each regional integrated energy system presents demand-side demand response characteristics to the outside world as a whole [19].
The principle of IDSR is shown in Figure 1:
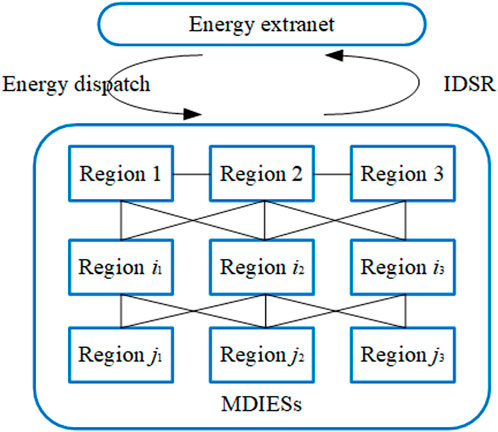
Figure 1. Principle of IDSR.
In the interconnected system, the regional integrated energy system guides load users to adjust their multi-energy consumption characteristics through price incentive mechanisms, and realizes the coordination of multiple energy sources in time and space between regional systems. Considering the multi-regional integrated energy system itself, under the premise of ensuring its own load demand and the safe and stable operation of the large power grid, when the external power grid of the interconnected system reaches its peak, it converts other forms of energy to supplement the power shortage and the shortage of cold and hot power caused by the reduction of power, thereby reducing the power demand for the external power grid. When the external power grid is at a low load, it improves the overall power consumption capacity of the multi-energy interconnected system. Through the coordinated scheduling of the supply and demand of multiple types of energy between single regional integrated energy systems, the joint demand-side response capability with large time scale and capacitive scale adjustable characteristics is realized on the basis of the interconnection of multi-regional integrated energy system clusters.
The schematic diagram of the interconnected system of multi-regional integrated energy systems is shown in Figure 2, which consists of multiple regional integrated energy systems and natural gas networks, thermal energy and electric energy storage distributed in different regions.

Figure 2. Multi region integrated energy system interconnection system.
When a multi-regional integrated energy system implements joint demand response, it will have a certain impact on user satisfaction, so users need to be compensated to a certain extent. According to the load change under the joint demand response, the user demand response compensation cost is obtained:
In the formula:
The joint demand response methods used in this paper can be divided into three types: load reduction, load reduction and replaceable load. According to the actual operation situation, different joint demand response methods have different impacts on users, so it is necessary to constrain the adjustable load ratio range, as shown in Figure 2
In the formula:
The schematic diagram of a single regional integrated energy system is shown in Figure 3, which consists of Combined heat and power unit (CHP), gas boilers (GB), Power to gas (P2G), electric refrigerators (ER), absorption refrigerators (AR) and Electric air conditioner (EA). The regional comprehensive energy system converts and distributes the input electric energy, natural gas energy and thermal energy. After collecting the energy through the four types of energy management at the end of the system, it provides users with electric energy, gas energy, thermal energy and cold energy. Each regional integrated energy system can be equipped with various equipment, including photovoltaic equipment (PV), wind power generators (WT), Combined heat and power, gas boilers, Power to gas, electric refrigerators, absorption refrigerators, Electric air conditioner, natural gas/heat/electricity storage equipment wait.
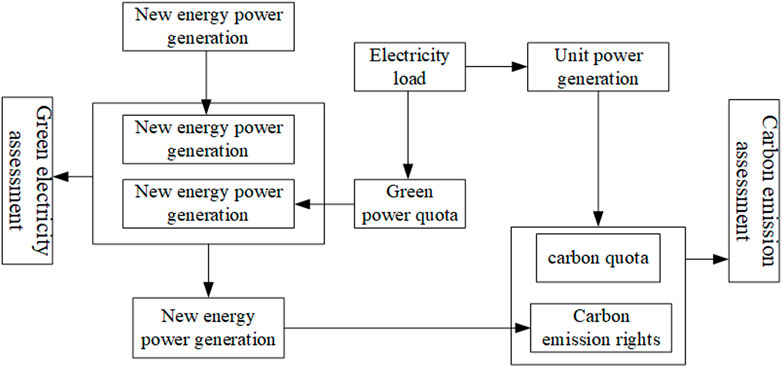
Figure 3. Regional IES electrical heating (cooling) multi-energy system structure.
CHP generates electricity by burning natural gas and supplies the waste heat from power generation to the heat load. The combined heat and power unit model is:
In the formula:
As a traditional energy supply device for heat loads, GB generates heat energy by using natural gas. Its model is:
In the formula:
The air conditioner generates heat and cold energy by consuming electrical energy. Its mathematical model is:
In the formula:
The electric refrigerator uses a thermal energy conversion device driven by high-grade energy to increase its internal temperature and pressure by performing isentropic compression on the refrigerator to achieve heat transfer from a low-temperature body to a high-temperature body. Its mathematical model is:
In the formula:
The absorption refrigerator is a device that converts thermal energy into cold energy. Its model is:
In the formula:
The electric hydrogen production device realizes electricity-gas coupling by converting electric energy into natural gas. Its model is:
In the formula:
GCT mechanism refers to a trading mechanism that controls carbon emissions by establishing a legal carbon emission rights recognition mechanism and allowing the purchase and sale of carbon emission rights. The implementation of the GCT mechanism allows companies to adjust production plans based on carbon quotas set by supervisory authorities. Carbon quotas refer to carbon emission standards issued free of charge by the government to enterprises. If a company generates more carbon emissions than its carbon quota, it needs to purchase carbon emissions from the carbon trading market. Instead, companies can generate revenue by selling remaining carbon emission rights.
The main methods for allocating carbon emission rights at home and abroad include free allocation, auction allocation and free auction. This paper mainly uses the baseline method to determine the free carbon emission share of the park’s IES. The carbon emission sources in the park’s comprehensive energy system mainly come from cogeneration units, gas boilers and higher-level power purchases. GCT mechanism model is:
In the formula:
Green certificates represent the green environmental attributes of new energy. The number of green certificates held by IES operators is directly proportional to the amount of new energy power generation. When the number of green certificates held is greater than the green certificate quota, IES operators can sell excess green certificates to obtain income; otherwise, they need to purchase green certificates to meet the green certificate quota. The expressions for the number of green certificate quotas, the number of green certificates obtained by new energy power generation and the green certificate transaction cost are:
In the formula:
In order to gradually increase the penetration rate of new energy in IES and promote green and low-carbon energy development, the CET mechanism and GCT are allowed to be well coupled. After the green certificate quota is met, the excess green certificate can offset part of the carbon emissions during the carbon emission assessment. This will encourage IES operators to use more new energy power generation and increase the weight of new energy power generation. The schematic diagram of the carbon-green certificate coupling mechanism is shown in Figure 4.
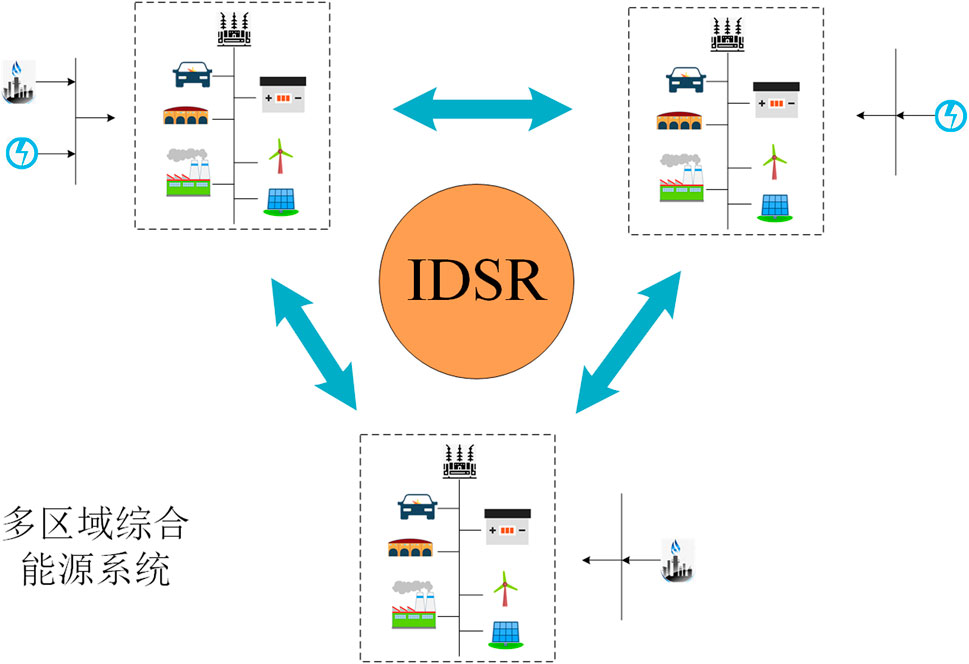
Figure 4. Schemetic diagram of the coopling machanism of GCT-CET mechanism.
Since my country’s thermal power generation accounts for up to 70% of the country’s total power generation, the difference in carbon emission intensity between thermal power units and wind turbines is used as the carbon emission coefficient offset by the green certificate. Therefore, when considering the coupling mechanism of CET and GCT, the actual carbon emissions of IES are further expressed as:
In the formula:
Therefore, the carbon trading cost can be further expressed as:
Eq. 15 is a piecewise function, which is difficult to solve directly with existing commercial solvers and requires convex conversion. The constraints of CET and GCT are shown in Eqs 9–14.
For the MDIESs composed of multi-region integrated energy system interconnection, when considering IDSR for system optimization, the total research cycle is divided into periods, and the total cost of the cluster system is considered to be the lowest. At the same time, considering the load balance constraints and other constraints of the electricity, gas, heating, and cooling systems, a multi-regional energy interconnection optimization function is established.
The objective function can be found in Eqs 16-19. For the MDIESs considering the joint demand response and green certificate-carbon trading mechanism, the multi-regional integrated energy system energy purchase cost
Where:
In the formula:
In the formula:
In addition to the balance of electric load, gas load, heat load and cooling load within a single regional integrated energy system, the multi-regional integrated energy system constraints should also consider the interaction constraints between a single regional integrated energy system and the upper-level power grid. IDSR constraints are shown in Eqs 1, 2. The internal constraints between regional integrated energy systems are shown in Eqs 3–8.
In the formula:
In the formula:
In the formula:
In the formula:
This section takes the MDIESs as an example to verify the effectiveness of the proposed model. The MDIESs is divided into three regional integrated energy systems: living area, learning area and industrial area. The equipment composition of each regional integrated energy system is the same, but the equipment capacity is different. Taking 1 day (24 h) as the dispatching cycle and the unit dispatching time as 1 h, the electricity, gas, heating and cooling loads of each regional comprehensive energy system are shown in Figure 5; the time-of-use electricity price and time-of-use natural gas price are shown in Table 1. The base price of the carbon trading mechanism is set at 0.15 CNY/kg, with each additional carbon trading price increasing by 0.2 CNY/kg within the range, and the green certificate trading price is set at 100 CNY/book. The internal equipment efficiency parameters of the multi-region energy interconnection system are shown in Table 2.
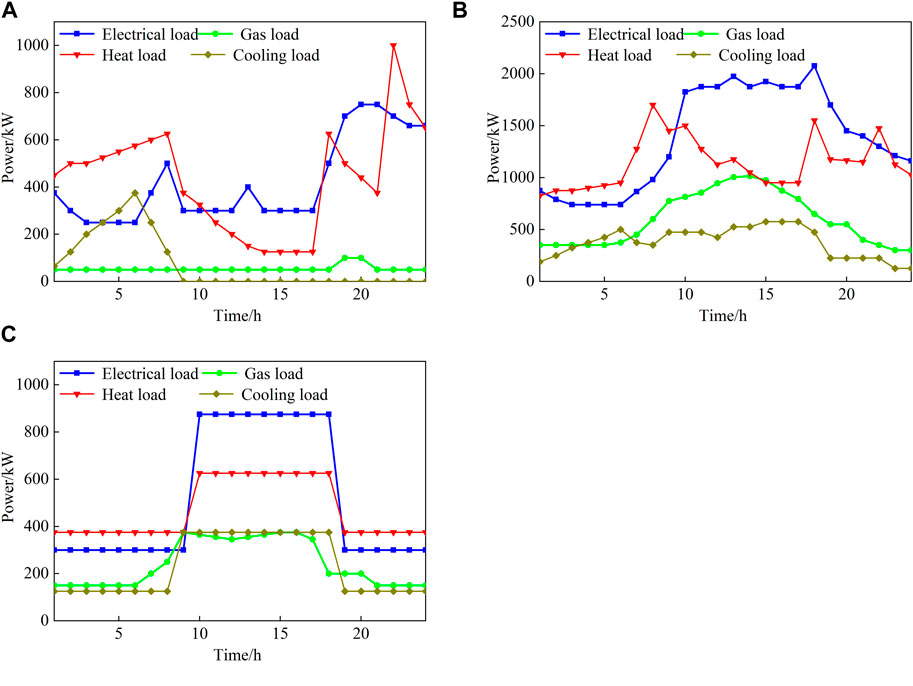
Figure 5. Load diagram of integrated energy system in a single region.
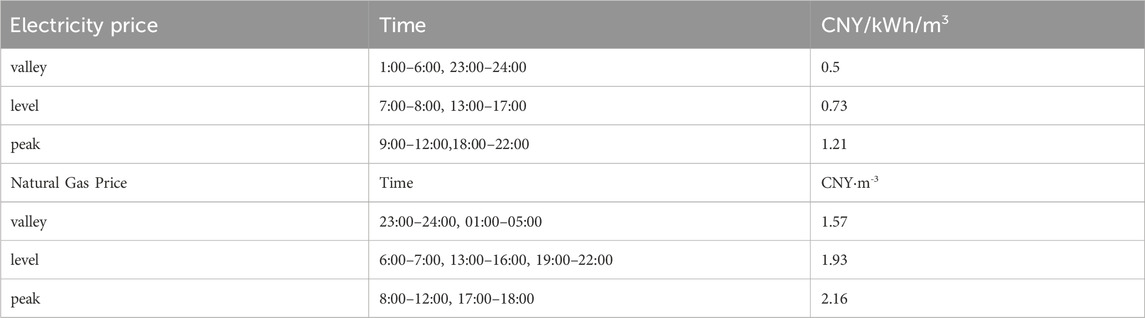
Table 1. Time-of-use electricity prices and time-of-use gas prices.
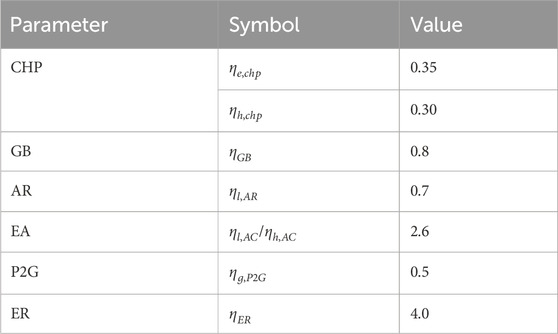
Table 2. Equipment efficiency of multi-regional energy Internet system.
The electric energy of the multi-region integrated energy system is centralized and connected to the grid in Region 3; the natural gas required by the system is supplied by the natural gas sources connected to Region 1 and Region 2. When insufficient, it is converted and supplemented through P2G equipment in each region or mutual adjustment between regions is carried out; The external heat energy required by the system can be supplied by the thermal energy connected to Zone 1, or supplemented by gas boilers and air conditioners in the regional integrated energy system. The proportional factors of curtailable, transferable and replaceable loads in a given multi-zone energy interconnection system are all 10%.
The following six scenarios are set for comparative analysis:
Scenario 1: Multi-regional integrated energy system does not consider joint demand response; Scenario 2: Multi-regional integrated energy system only considers joint demand response.
Scenario 3: Multi-regional integrated energy system only considers carbon trading mechanism; Scenario 4: Multi-regional integrated energy system only considers green certificate trading mechanism; Scenario 5: Multi-regional integrated energy system considers carbon-green certificate coupling mechanism.
Scenario 6: Multi-regional integrated energy system considers joint demand response mechanism and carbon-green certificate coupling mechanism.
The simulation results of this paper are shown in Table 3. It can be concluded that: Compared with Scenario 1, the system operation cost of Scenario 2 is reduced by 8.82%. This is because after the joint demand response is adopted in the multi-regional integrated energy system in Scenario 2, each regional integrated energy system can be adjusted through energy transmission, which reduces the system operation cost and improves the system operation stability. Compared with Scenario 1, the total system cost of Scenario 5 is reduced by 9.17%. This is because Scenario 5 considers the carbon-green certificate coupling mechanism. The system can offset part of the carbon emissions through the low carbon emissions of renewable energy in the green certificate trading mechanism and participate in the carbon trading mechanism. Therefore, the system obtains the green certificate income and the carbon emission reduction benefits of the green certificate, which greatly reduces the carbon trading cost of the multi-regional integrated energy system. Compared with Scenario 4 and Scenario 3, the system operation cost of Scenario 5 is reduced by 0.87% and 8.21% respectively, and the carbon emissions are reduced by 22.0% and 4.57% respectively. This is because Scenario 5 mainly reduces the total system cost by absorbing new energy compared with Scenario 4, while Scenario 5 mainly reduces the carbon emissions of the system by limiting the output of high-carbon units compared with Scenario 3. Scenario 6 combines the joint demand response mechanism and the green certificate-carbon trading mechanism to further reduce the total cost and carbon emissions of the system.
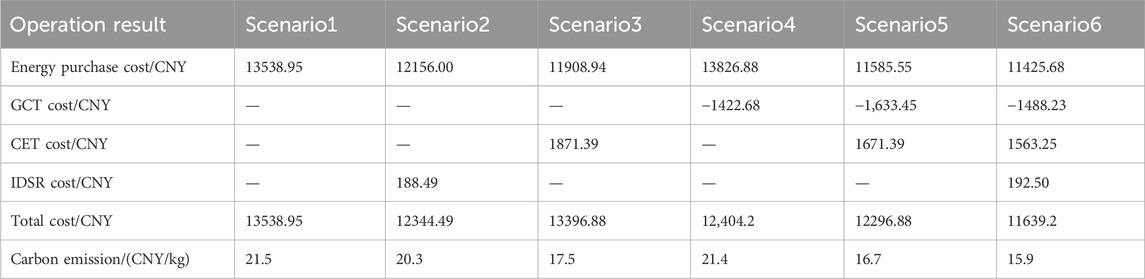
Table 3. Comparison and results of system operating costs under different scenarios.
When optimizing the operation of the MDIESs when considering the overall demand side response of the interconnection system, users adjust the energy supply (substitution) in each area and time period through four methods: reducing electrical load, transferring electrical load, replacing electrical load and replacing gas load. A positive load value means that this type of energy is used to replace other forms of energy, and a negative value means that other forms of energy are used to replace this type of energy; load reduction is always a negative value). The energy dispatch optimization results of MDIESs under scenario 1 and scenario 2 are shown in Figure 6.
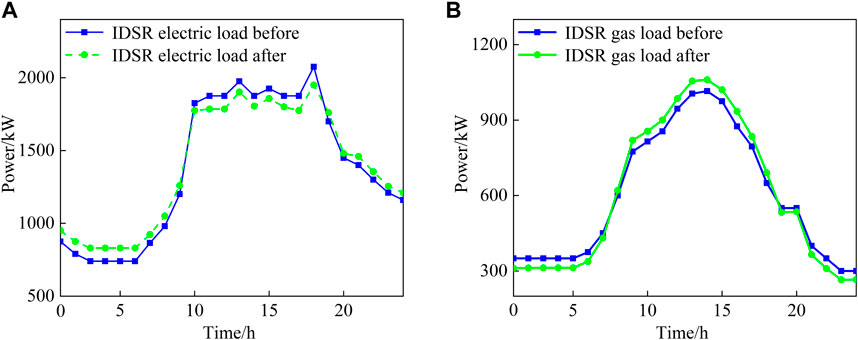
Figure 6. Comparison of system electrical and gas loads before and after considering ISDR.
Comparing Figure 6A, B, it can be seen that compared with Scenario 1, the MDIESs in Scenario 2 participates in joint demand side response, and the overall power load fluctuation of the system is greatly suppressed. During the peak hours of electricity consumption (10:00–17:00), the total electricity load of the interconnected system is significantly reduced. During the low hours of electricity consumption (0:00–10:00 and 17:00–24:00), the total electricity load of the interconnected system The power has increased. At the same time, under the IDSR, the MDIESs converts excess electric energy into natural gas through P2G equipment during the low period of electricity consumption, replacing part of the gas load and reducing the demand for natural gas load of the interconnected system during this period; in During peak hours of electricity consumption, MDIESs uses cheaper natural gas at this time to replace part of the electricity load through cogeneration units, reducing the demand for electricity loads in the interconnected system. This has greatly reduced the electricity and gas costs of MDIESs, and the mutual substitution between electricity and gas has also changed part of the heat energy source of the interconnection system, that is, consuming more natural gas to generate heat. Reduces interconnected system heat costs. Therefore, after considering the joint demand side response, the total 24-h electric load of the multi-regional energy interconnection system is reduced by 267 MW, and the peak-to-valley difference of the electric load curve is reduced by 9.20% compared with the multi-regional energy interconnection system that does not consider the joint demand side response. In addition, during the low period of electricity consumption, the interconnected system the heat load demand is supplemented by air conditioning, and the cheaper natural gas is used for heating through gas boilers during peak hours, further reducing the peak-valley difference in the interconnected system’s electrical load curve by 3.27%. The electric-gas load adjustment amount of each regional integrated energy system is shown in Figure 7, and the interactive power curve of the internal tie line of the multi-regional integrated energy system is shown in Figure 8.
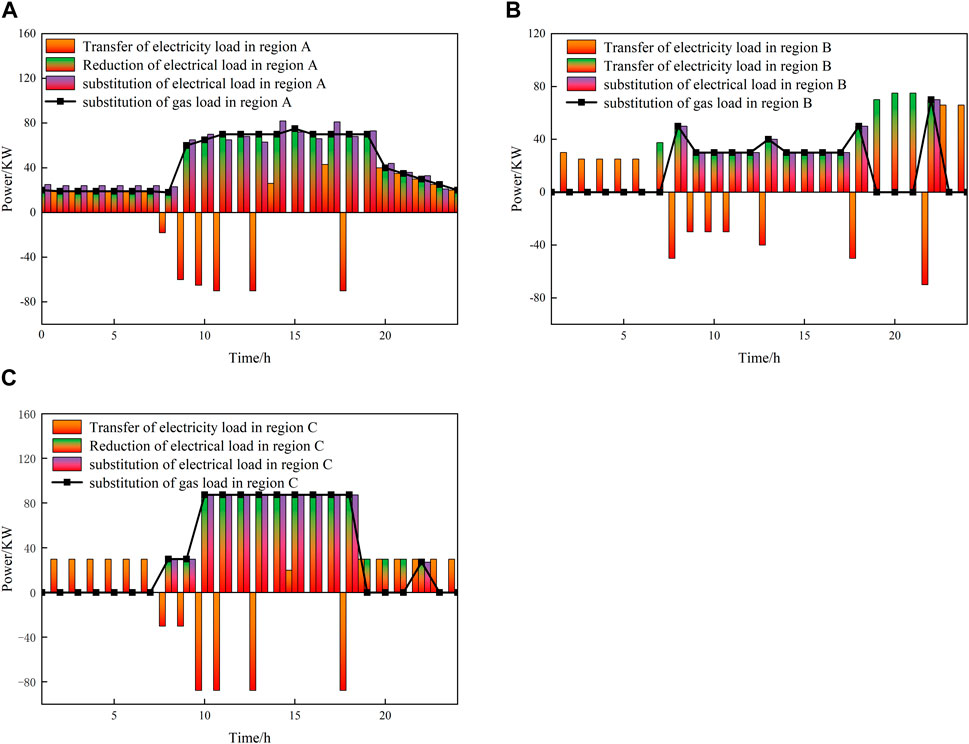
Figure 7. Regional electricity-gas load adjustment amount when considering IDSR in MDIESs.
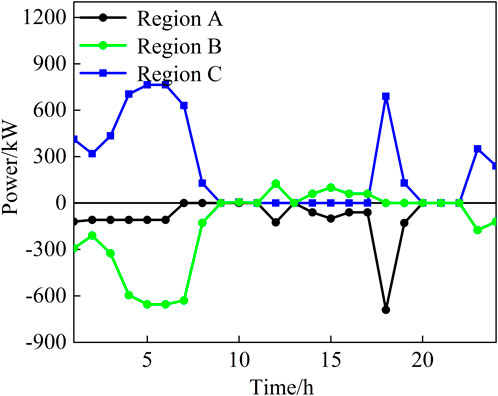
Figure 8. Interactive power curve of internal tie lines of MDIESs.
Figure 7 compares the adjustment amounts of the electric load and gas load of the comprehensive energy system in each region before and after participating in the IDSR. As can be seen from the figure, since cutting a large amount of electric load will lead to a reduction in the electricity sales revenue of the power grid company, the MDIESs mainly adopts three methods of transferring electric load, replacing electric load and replacing gas load when carrying out joint demand side response. At this time, the electrical load adjustment amount and the gas load adjustment amount account for 12.31% and 14.23% of the total 24-h electrical load and gas load of the interconnected system before adjustment respectively. In addition, it can be seen from Figure 6 that the amount of electric load reduction is large during peak hours and small during valley hours.
In short, the “joint” organic whole formed by multiple regional-level multi-energy interconnections. When participating in joint demand-side response, the interconnected system can use economic means and dynamic electricity price incentives adopted by multiple regions to guide users in the interconnected system to optimize their own energy consumption behavior. It then guides multiple energy sources in each area to be dispatched and optimized in time and space. In MDIESs, users can adopt different joint demand-side response methods including load reduction, load transfer and load substitution to achieve the following two effects: (1) Improve the system through peak cutting and valley filling or peak shifting substitution The flexibility of electric load, natural gas load and thermal energy load can alleviate the over-increasing trend of system peak load periods and improve the energy regulation capability of the interconnected system; (2) When the power of large power grids contains a high proportion of clean energy, peak shifting and peak replacement can increase the overall energy utilization rate of the regional energy interconnection system can promote clean energy consumption, reduce system carbon emissions, and improve overall demand response capabilities.
The price of the CET is equivalent to the weight of renewable energy consumption in the multi-regional integrated energy system., so the price of the CET will determine the output of renewable energy; at the same time, the GCT price is equivalent to the low-carbon target in the MDIESs. The weight of the GCT price will determine the unit output; at the same time, the CET and the GCT price interact with each other by changing the renewable energy output and unit output, thereby affecting the operation of the MDIESs, as shown in Figures 9, 10.
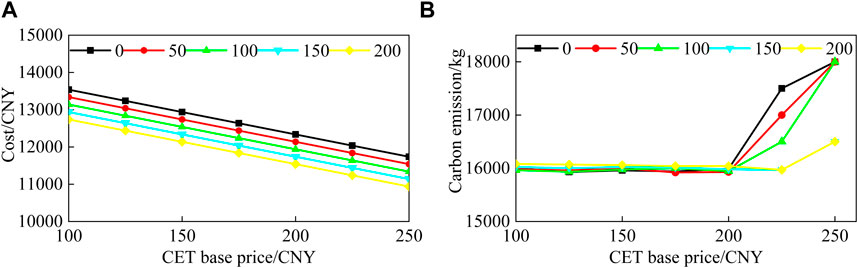
Figure 9. The impact of GCT machanisam base price on the system.
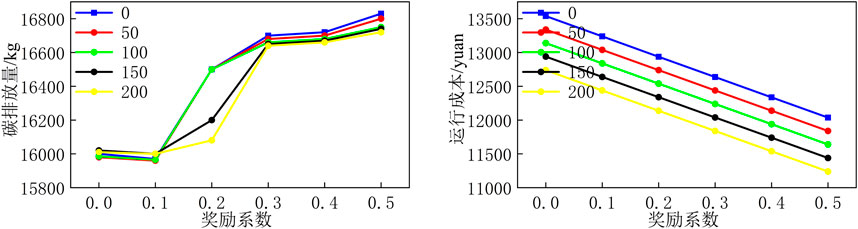
Figure 10. The impact of reward coefficient on the system.
Figure 9 shows the carbon emissions and operating costs of the MDIESs under different green certificate prices and carbon trading base prices. As shown in Figure 9, as the price of green certificates increases, the impact of green certificates on the MDIESs increases. In order to obtain the benefits of green certificates, the system consumes a large amount of renewable energy, stabilizes the energy purchase demand of the system, thereby reducing the system However, since the system can fully absorb renewable energy, the reduction in carbon emissions is not obvious; as the carbon trading base price increases, the carbon emissions and operating costs of the system decrease. This is due to the green Certificate-carbon linkage trading causes the carbon quota allocated by the system to be greater than the actual carbon emissions. Revenues can be obtained by selling carbon emission rights, and at the same time, carbon revenue is obtained with the amount of carbon emissions; but when the carbon trading base price increases to a certain value, the system There is little room for carbon emission reduction from energy supply units, and further increasing the carbon trading base price will weaken the regulating effect of carbon emissions.
Through green CET-GCT mechanism, the actual carbon emissions of the MDIESs are less than the carbon emission allocation, and profits can be obtained by selling carbon emission rights. At this time, the intervention of the reward coefficient significantly affects the system’s carbon emission reduction enthusiasm, that is, the more carbon emission rights sold, the higher the selling price. Figure 9 shows the system carbon emissions and operating costs under different green certificate prices and reward coefficients when the CET price mechanism is 100 yuan/book.
As shown in Figure 10, as the reward coefficient increases, the system operating cost gradually decreases, but the carbon emissions increase due to the declining area. At this time, the size of the reward coefficient changes the system’s sensitivity to carbon emissions. That is, the greater the reward coefficient, the higher the sensitivity. However, due to the constraints of the unit output, the carbon emissions decrease slowly; at the same time, because the system has been selling carbon emission rights, the continuous increase in the reward coefficient will cause the system to further increase carbon emissions in order to obtain further carbon emission quotas; the impact of the green certificate price on the system under different reward coefficients is similar to the impact of the green certificate price on the system under different carbon trading base prices.
From the above analysis, it can be seen that as the price of CET increases, the carbon emissions of the system decrease and the region stabilizes. This is because the wind and solar output has been fully absorbed. Carbon emissions cannot be reduced only through the price of green certificates. When the carbon trading benchmark price is greater than a certain value, the system’s low-carbon units have been fully generated, and carbon emissions cannot be reduced; the compensation coefficient plays an important role in the green certificate-carbon linkage transaction, which can significantly increase carbon income, greatly mobilize the carbon emission reduction initiative of enterprises, and reasonably solve carbon emissions The contradiction between emissions and economics. Therefore, when formulating the parameters of the green CET-GCT mechanism model, it is necessary to match the green certificate price and the carbon trading base price with the value of the reward coefficient in order to better improve the low-carbon economy of the system.
This paper proposes a low-carbon economic dispatch model for multi-regional integrated energy systems considering joint demand response. The characteristics of joint demand response, green certificate trading mechanism and carbon trading mechanism are comprehensively considered, and different economic operation strategies of multi-regional integrated energy systems are compared and the impact of different carbon trading prices and carbon trading reward coefficients on the operation cost of multi-regional integrated energy systems is analyzed. The following main conclusions are obtained:
1. On the basis of multi-regional integrated energy systems, the coordinated interaction between load supply and demand within multi-regional integrated energy systems can effectively improve the level of electric load demand response of clusters;
2. After the multi-regional integrated energy systems are interconnected, operation strategies with economic optimization as the goal can be formulated according to different operation scenarios of power grids and gas grids, and one or more multi-energy systems in the cluster can be coordinated to participate in the grid demand side response, which has greater flexibility and can effectively cope with the uncertainty of renewable energy output.
3. Through the GCT mechanism, GCT and carbon trading mechanisms are linked to achieve energy transformation and energy conservation and emission reduction, and encourage multi-regional integrated energy systems to actively absorb renewable energy to obtain benefits, which has superior low-carbon economy.
4. The impact of green certificate-carbon linkage trading parameters on system carbon emissions and operation costs is analyzed. Appropriate green certificate prices, carbon trading prices and reward coefficients can effectively constrain system carbon emissions and operating costs.
In summary, considering the joint demand response mechanism and the carbon-green certificate coupling mechanism not only meets the national “30·60” goal, reduces carbon emissions and optimizes the IES energy structure, but also the case results prove that the research results of this paper can provide a certain reference for the future low-carbon development of IES.
The original contributions presented in the study are included in the article/Supplementary Material, further inquiries can be directed to the corresponding author.
XJ: Conceptualization, Methodology, Writing–original draft, Project administration. MiL: Conceptualization, Methodology, Writing–review and editing. MnL: Conceptualization, Methodology, Writing–original draft. HH: Conceptualization, Formal Analysis, Writing–review and editing.
The author(s) declare financial support was received for the research, authorship, and/or publication of this article. This project is funded by Jilin Province’s “Land Scenery Three Gorges” high-quality development major science and technology project-park-level multi-microgrid system participating in key technology research projects for grid-friendly interaction (project number: 20230303003SF).
Thank you for the funding of the “Land Scenery Three Gorges” high-quality development major science and technology project in Jilin Province - Park level multi micro grid system participation in grid friendly interaction key technology research project (project number: 2023030303SF).
The authors declare that the research was conducted in the absence of any commercial or financial relationships that could be construed as a potential conflict of interest.
All claims expressed in this article are solely those of the authors and do not necessarily represent those of their affiliated organizations, or those of the publisher, the editors and the reviewers. Any product that may be evaluated in this article, or claim that may be made by its manufacturer, is not guaranteed or endorsed by the publisher.
Fan, W., Tan, Q., Zhang, A., Ju, L., Wang, Y., Yin, Z., et al. (2023). A Bi-level optimization model of integrated energy system considering wind power uncertainty. Renew. Energy 202, 973–991. doi:10.1016/j.renene.2022.12.007
Gan, W., Yan, M., Yao, W., Guo, J., Ai, X., Fang, J., et al. (2021). Decentralized computation method for robust operation of multi-area joint regional-district integrated energy systems with uncertain wind power. Appl. Energy 298, 117280. doi:10.1016/j.apenergy.2021.117280
Gao, L., Fei, F., Jia, Y., Wen, P., Zhao, X., Shao, H., et al. (2024). Optimal dispatching of integrated agricultural energy system considering ladder-type carbon trading mechanism and demand response. Int. J. Electr. Power Energy Syst. 156, 109693. doi:10.1016/j.ijepes.2023.109693
Gao, S., Song, T. E., Liu, S., Zhou, C., Xu, C., Guo, H., et al. (2021). Joint optimization of planning and operation in multi-region integrated energy systems considering flexible demand response. IEEE Access 9, 75840–75863. doi:10.1109/ACCESS.2021.3081798
Guo, Z., and Zhou, S. (2023). Modeling and multi-stage planning of cement-IIES considering carbon-green certificate trading. Processes 11 (4), 1219. doi:10.3390/pr11041219
Jiang, H. D., Liu, L. J., Dong, K., and Fu, Y. W. (2022). How will sectoral coverage in the carbon trading system affect the total oil consumption in China? A CGE-based analysis. Energy Econ. 110, 105996. doi:10.1016/j.eneco.2022.105996
Jiang, H. D., Purohit, P., Liang, Q. M., Liu, L. J., and Zhang, Y. F. (2023). Improving the regional deployment of carbon mitigation efforts by incorporating air-quality co-benefits: a multi-provincial analysis of China. Ecol. Econ. 204, 107675. doi:10.1016/j.ecolecon.2022.107675
Li, Y., Wang, W., Kou, Y., and Zhu, S. (2023). Considering green certificate-carbon joint trading and demand response integrated energy system economic operation. Taiyangneng Xuebao/Acta Energiae Solaris Sin. 44 (11). doi:10.19912/j.0254-0096.tynxb.2022-1153
Ling, J., Zhang, L., Sun, Y., Zhang, L., Chen, N., and Gao, B. (2019). “A bidding optimization method for renewable energy cross-regional transaction under green certificate and carbon emissions trading mechanisms,” in Annual IEEE International Conference on Cyber Technology in Automation, Control and Intelligent Systems, Tianjin, China, July19–23, 2018. doi:10.1109/CYBER.2018.8688082
Wang, J., Xing, H., Wang, H., Xie, B., and Luo, Y. (2022). Optimal operation of regional integrated energy system considering integrated demand response and exergy efficiency. J. Electr. Eng. Technol. 17, 2591–2603. doi:10.1007/s42835-022-01067-6
Yi, Y., Chang, L., Wu, B., Zhao, J., Peng, H., Li, L., et al. (2024). Life cycle assessment of energy storage technologies for new power systems under dual-carbon target: a review. Energy Technol. 12. doi:10.1002/ente.202301129
Yue, Z., Liu, H., Li, Y., Zhong, Y., Yao, J., and Li, Y. (2023). Tri-layer low-carbon distributed optimization of integrated energy systems based on hybrid games under stochastic scenarios. IET Generation, Transm. Distribution 17 (24), 5323–5339. doi:10.1049/gtd2.13013
Zhang, J., and Liu, Z. (2023). Low carbon economic dispatching model for a virtual power plant connected to carbon capture system considering green certificates-carbon trading mechanism. Sustain. Energy Technol. Assessments 60, 103575. doi:10.1016/j.seta.2023.103575
Zhang, S., Wang, D., Cheng, H., Song, Y., Yuan, K., and Du, W. (2022). Key technologies and challenges of low-carbon integrated energy system planning for carbon emission peak and carbon neutrality. Dianli Xit. Zidonghua/Automation Electr. Power Syst. 46. doi:10.7500/AEPS20210703002
Keywords: integrated energy system, carbon emission trading, integrated demand side response, low-carbon, carbon peak and carbon neutrality
Citation: Ji X, Li M, Li M and Han H (2024) Low-carbon dispatch of multi-regional integrated energy systems considering integrated demand side response. Front. Energy Res. 12:1361306. doi: 10.3389/fenrg.2024.1361306
Received: 25 December 2023; Accepted: 21 June 2024;
Published: 25 July 2024.
Edited by:
Deepak Kumar, Birla Institute of Technology, IndiaReviewed by:
Srinvasa Rao Gampa, Seshadri Rao Gudlavalleru Engineering College, IndiaCopyright © 2024 Ji, Li, Li and Han. This is an open-access article distributed under the terms of the Creative Commons Attribution License (CC BY). The use, distribution or reproduction in other forums is permitted, provided the original author(s) and the copyright owner(s) are credited and that the original publication in this journal is cited, in accordance with accepted academic practice. No use, distribution or reproduction is permitted which does not comply with these terms.
*Correspondence: Meiyue Li, MTM0NjQxNzQ1NTdAMTYzLmNvbQ==
Disclaimer: All claims expressed in this article are solely those of the authors and do not necessarily represent those of their affiliated organizations, or those of the publisher, the editors and the reviewers. Any product that may be evaluated in this article or claim that may be made by its manufacturer is not guaranteed or endorsed by the publisher.
Research integrity at Frontiers
Learn more about the work of our research integrity team to safeguard the quality of each article we publish.