 Ziwei Wang1
 Jun Liu
95% of researchers rate our articles as excellent or good
Learn more about the work of our research integrity team to safeguard the quality of each article we publish.
Find out more
ORIGINAL RESEARCH article
Front. Energy Res. , 07 February 2024
Sec. Advanced Clean Fuel Technologies
Volume 12 - 2024 | https://doi.org/10.3389/fenrg.2024.1361290
This article is part of the Research Topic Production Technology for Deep Reservoirs View all 37 articles
The space of production well plays a crucial role in the heat extraction performance of the Enhanced Geothermal System (EGS), which have the potential to meet the growing global energy demand as a reliable energy source. Nonetheless, there has been insufficient research and attention focused on comprehending the impact of the space of production well on the efficiency and effectiveness of EGS. In this work, a series of numerical simulations were conducted to assess the impact of the space of production well on heat extraction efficiency in EGS. Three different cases were considered: Case 50 with 50 m production well spacing, Case 100 with 100 m production well spacing, and Case 150 with 150 m production well spacing. At the X-Y plane and Y-Z plane, the simulation results indicated that there were slight differences in temperature variation among the Case 50, Case 100 and Case 150. And the cooling area decreasing as the spacing of production wells decreased. Moreover, the delivery of cooling water via the injection well and its subsequent distribution to various reference points lead to a decline in temperature at each point, albeit with varying degrees of variation. Besides, the established efficiency (ef) for Case 50 is smaller than the Case 100 and Case 150 during the last 15 years. These findings contribute valuable insights to the exploration and exploitation of EGS systems and can serve as a guide for further research in this field.
Nowadays, as a matter of fact, energy consumption has recently increased significantly due to the world economy’s rapid growth, which is also causing the intended low-carbon and green process—that is, a high-speed and green development—to go more quickly (Olasolo et al., 2016; Liu et al., 2017a; Liu et al., 2017b; Zheng et al., 2019; Hao et al., 2021; Lin et al., 2021; Zhao et al., 2022). With this context in mind, unconventional oil/gas resources like tight sandstone gas and shale oil, as well as renewable energy sources like solar, wind, and enhanced geothermal systems (EGS), emerge on the scene (Zheng et al., 2018; Kumari and Ranjith, 2019; Cheng et al., 2021; Steffen et al., 2021). Therein, the EGS is thought to have the capacity to supply the growing energy needs for the reason that it has an endless supply of resources that can be obtained for less money than traditional fuels from almost any place in the globe (Lu, 2018; Abdelhafiz et al., 2023; Zhao et al., 2023). Undoubtedly, a highly effective development pertaining to this type of renewable energy source is required to support this issue. Due to its emerging nature and potential to generate clean, low-carbon energy, EGS is receiving a lot of attention. There are also efforts underway to steer EGS toward a commercially viable platform through the use of cost-cutting measures, enhanced performance, and technology validation (Lu, 2018). As a result, many initiatives were carried out and demonstrated some successful and acknowledged accomplishments (Olasolo et al., 2016).
Actually, EGS is now commonly known as an engineered geothermal system, which has replaced the previous phrases used in earlier research, such as hot dry rock and hot sedimentary aquifers (Christ et al., 2017). Rudimentary studies on the creation of artificial geothermal reservoirs, and heat exchange and transport were arranged in relation to the EGS-related investigations (Feng et al., 2012; Zhang and Jiang, 2012; Li and Lior, 2014). Additionally, the Songliao Basin in Northeast China was the subject of a study on the 30-year heat extraction process in an EGS system, which examined the most significant variable factors involved (Huang et al., 2015). Besides, predictions were made regarding the diverse effects on EGS results during extended periods of operation under varying geological situations (Chen et al., 2013a; Chen et al., 2013b). Moreover, Gan et al. (2021) and Spycher and Pruess (2010) conducted research on an EGS system that employed CO2 as the working fluid instead of water. Furthermore, based on the utilization of fracture network simulation techniques for an EGS system, the study also analyzed the hydraulic fracturing process (Wang and Zhang, 2011). While these mentioned literature sources may have different focuses, they share a common aspect, which is the utilization of numerical modeling. Furthermore, upon reviewing past accomplishments in relation to EGS systems, it is apparent that the impact of the space of production well on heat extraction efficiency has not been adequately addressed. This lack of consideration may restrict the optimal positioning of production wells for heat extraction.
Indeed, numerical approaches have become extensively utilized in research on geological resources in recent years, particularly in endeavors aiming to simulate complex engineering scenarios that are impractical to conduct in a traditional experimental setup (Sun et al., 2013; Chen et al., 2019; Li and Elsworth, 2019; Liu et al., 2021; Yang et al., 2023). This study employs numerical modeling to simulate the process of heat extraction from an EGR system. Herein, the production well spacing is varied to assess its impact on heat extraction efficiency. Moreover, the study also contrasts the heat extraction effectiveness under various operational circumstances to conduct a quantitative analysis of how the space of production well affects heat extraction efficiency from an EGS system. This numerical study is carried out on an engineering scale about how the well space influence the heat extraction performance, providing a new viewpoint and possibly providing some guidance for the exploration and exploitation of EGS-related issues.
For this numerical study conducted at an engineering scale, a hot dry rock (HDR) cubic model with edge length of 400 m was employed, which is a further work on the basis of our previous investigations (Wang et al., 2016a; Wang et al., 2016b; Hu et al., 2022; Ke et al., 2022; Wang et al., 2022; Wang et al., 2023). Within this model, the EGS system was situated at its center with dimensions of 250 m in length, 250 m in width, and 150 m in height (Figure 1). The simulated reservoir in this study has a depth of 600 m from the surface to the bottom, while the roof of the reservoir is located at a burial depth of 300 m. In addition, to examine the impact of the space of production well on heat extraction efficiency, EGS system comprises of injection well and production wells. Three distinct situations are established, wherein each model features a single injection well with a length of 50 m with coordinates midpoint at X: -100, Y: 0, Z: 0 (Figure 2), and the origin of coordinates situates at the central position of the EGS system (Figure 1). The spacing of production wells in Case 50, Case 100, and Case 150 is 50, 100, and 150 m, respectively (Figure 2).
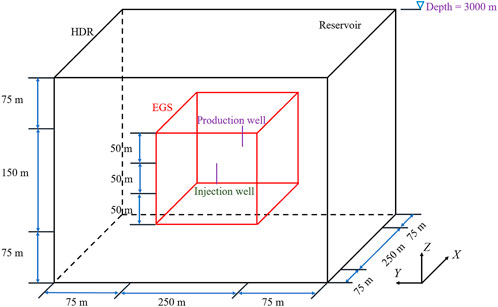
Figure 1. Numerical model used in this work.
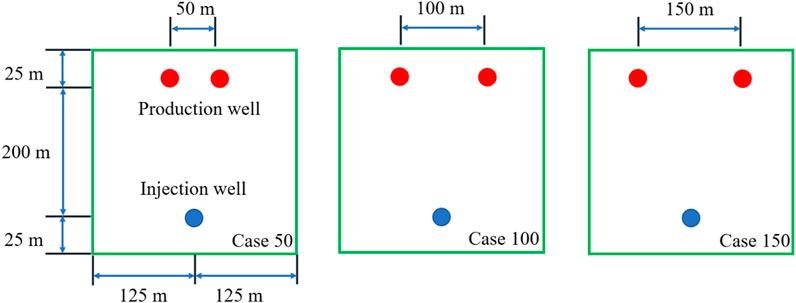
Figure 2. Modeling cases description regarding the injection-production wells planform of the EGS system.
In this work, a 3D THM coupling model was created to simulate the procedure of the heat extraction from HDR system. The model incorporates a few hypotheses pertaining to heat transmission and fluid flow to effectively simulate the process (Zimmermann et al., 2009; Ye et al., 2021; Huang et al., 2023; Wang et al., 2023; Liu et al., 2024).
(1) The working fluid is water, which exists as a liquid in the pores throughout the heat extraction procedure.
(2) It is assumed that the initial EGS system brims with water, and the fluid in the matrix follows Darcy’s law as laminar flow.
(3) The heat transmission process within the matrix is governed by Fourier’s law. Calorific balance can be achieved locally between the rock mas and working fluid.
These hypotheses are commonly used as reasonable conditions in numerical studies related to EGS systems (Lu, 2018; Zhao et al., 2023).
Therefore, based on the above assumptions, the main control equations of this heat extraction simulation process are as follows (Sun et al., 2019; Tan et al., 2021; Zinsalo et al., 2021; Zhao et al., 2023).
When the working fluid flow in the porous medium a, the mass conservation law in the seepage field can be described as:
Furthermore, according to the Darcy’s law, the expressions of q is defined as:
The local thermal balance is the main feature of the heat exchange between the cryogenic fluid and the rock surface in the temperature field. During this heat exchange process, the liquid and the solid have the same temperature at any location. Hence, the energy conservation law can be expressed as:
In addition, the temperature can determine the density (ρw), the thermal conductivities (λw), the heat capacity (cp,w), and the dynamic fluid viscosity (μf) of water. The governing equations are described as (Sun et al., 2019; Aliyu and Archer, 2021; Zhou et al., 2022):
In this work, the boundary/initial conditions and main reservoir physical parameters for the numerical simulation model referred from previous research (Han et al., 2020; Yu et al., 2021; Zhou et al., 2022) are listed in Table 1. Moreover, during the modeling process, all simulation cases run in 30 years.
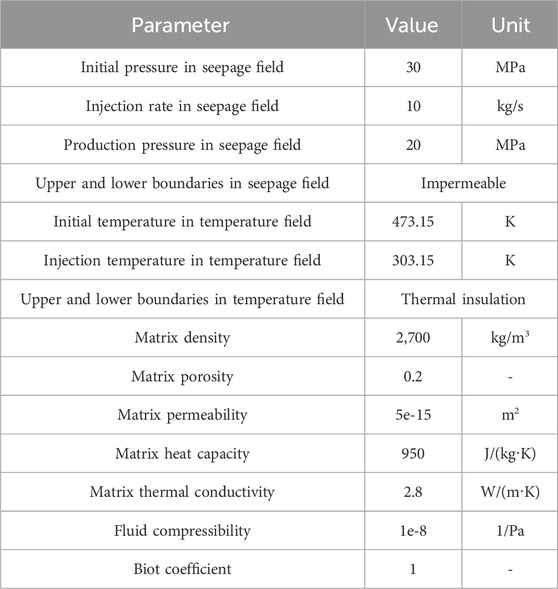
Table 1. Reservoir physical properties.
The assessment of heat extraction performance in an EGS system heavily relies on temperature as a fundamental parameter (Rodriguez et al., 2013; Guo et al., 2018; Yang et al., 2021). Consequently, this study focuses on comparing the heat extraction efficiency of an EGS system utilizing water as the working fluid by analyzing temperature. Firstly, the overall temperature distribution throughout the EGS system is investigated, followed by setting up three reference points to track the temperature variation during variable simulated cases. Subsequently, three operation cases (Case 50, Case 100 and Case 150) were compared in terms of the temperature changes across the entire system.
In this work, the trend of overall temperature change from various directions for different numerical simulation cases are analyzed from three planes, which include plane X-Z (Y = 0), plane Y-Z (X = 0) and plane X-Y (Z = 0)–according to the coordinate system in Figure 1.
The X-Z plane represents a cross-section that passes through both the injection well and the center of the EGS system (Figure 1). In Figure 2, the Y-coordinate is set to 0 on this plane. Basically, the area of cooling place gets larger from the injection well to production well during the water injection process (Figures 3–5). Nevertheless, in the X-Z plane, the temperature variation tendency seems to be similar for different production well spacing. Herein, the reason for the insignificant difference among all numerical simulation cases might be analyzed from two aspects. On the one hand, during the simulated process, the water is injected from one injection well with stable injection rate of 10 kg/s. On the other hand, the water (relatively low temperature) can scarcely transport on a large scale in the low permeability system, which makes the water extraction from production well influenced the water seepage. In general, the overall temperature variation tendency in X-Z plane of EGS system is less affected by the well spacing.

Figure 3. Temperature change in the X-Z plane for Case 50.
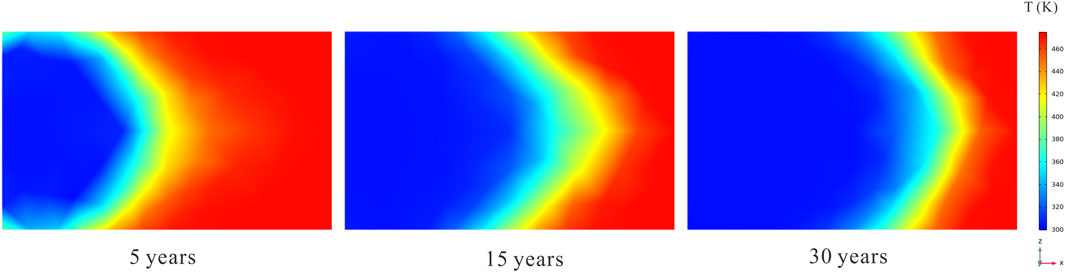
Figure 4. Temperature change in the X-Z plane for Case 100.
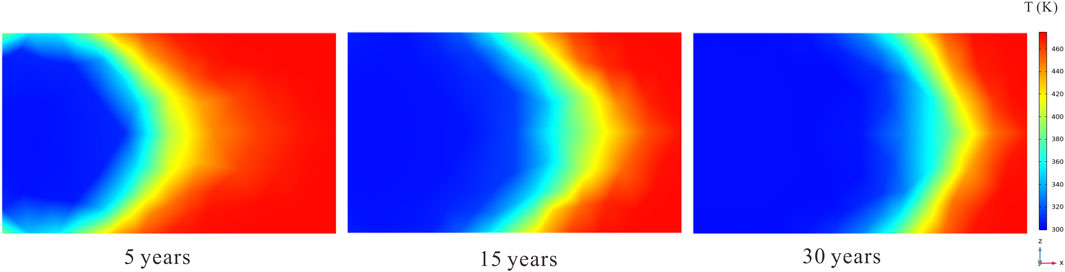
Figure 5. Temperature change in the X-Z plane for Case 150.
The Y-Z plane is a slide that across the EGS center, where X = 0 in the coordinate system in Figure 1. Herein, as the water continuously injected from injection well, the area of cooling place becomes grater (Figures 6–8). When comparing the temperature variations among the different numerical cases, a noticeable difference can be observed when examining the X-Z plane (Figures 3–5) as mentioned earlier. It becomes evident that having smaller production well spacing leads to a smaller cooling area during heat extraction. This observation provides a perceptual understanding of the relationship between the spacing of production wells and the corresponding cooling area. Additionally, considering the inconspicuous difference observed in the X-Z plane, it can be hypothesized that the variation in temperature resulting from the space of production well primarily affects the Y-Z plane. Therefore, during heat extraction process, this variation is likely to contribute to the volume difference.
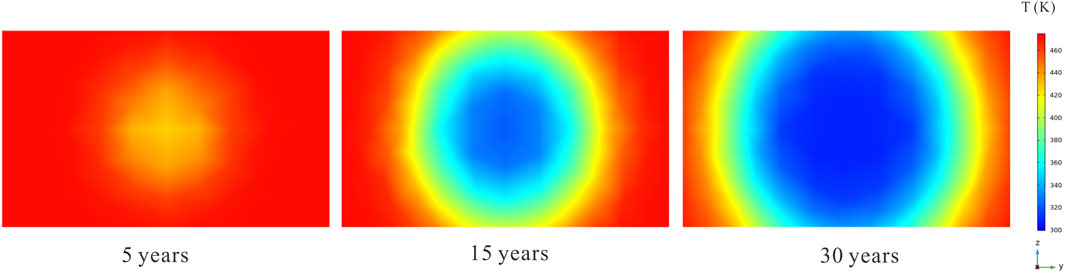
Figure 6. Temperature change in the Y-Z plane for Case 50.
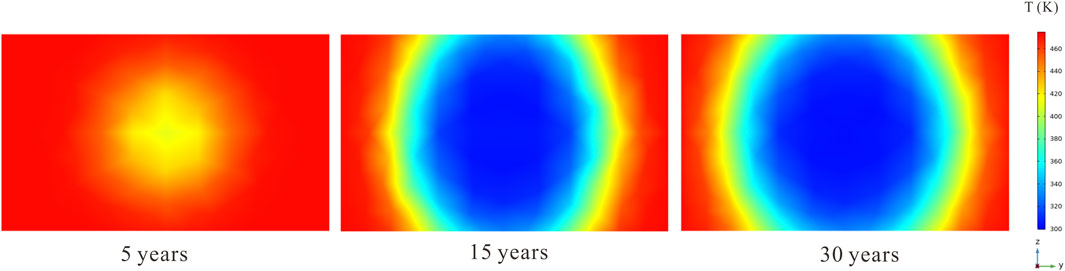
Figure 7. Temperature change in the Y-Z plane for Case 100.
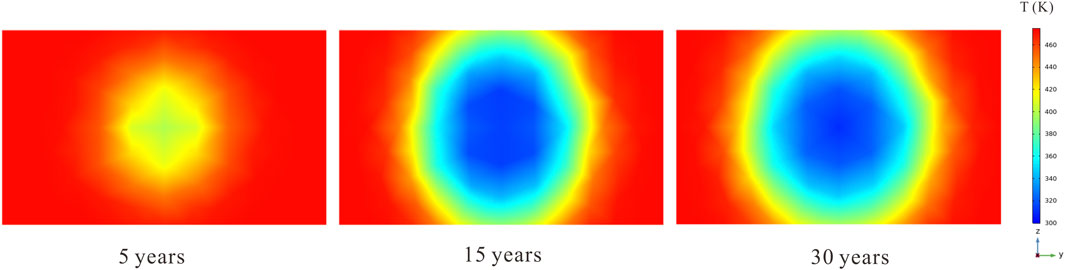
Figure 8. Temperature change in the Y-Z plane for Case 150.
In this study, the X-Y plane is perpendicular to the wellbore of production/injection well (Figure 1). It is utilized to examine the horizontal temperature variation within the EGS system. In general, across all operational cases, the cooling area within the EGS system gradually expands as water is injected from the injection well. It is observed that this expansion occurs in a manner where the cooling area extends from the injection well towards the production well (Figures 9–11). Similar to the temperature variation tendency of the X-Z plane (Figures 3–5), the difference among three numerical cases is not apparent in the X-Y plane and the stable injection rate and low permeability system might be the main factors.
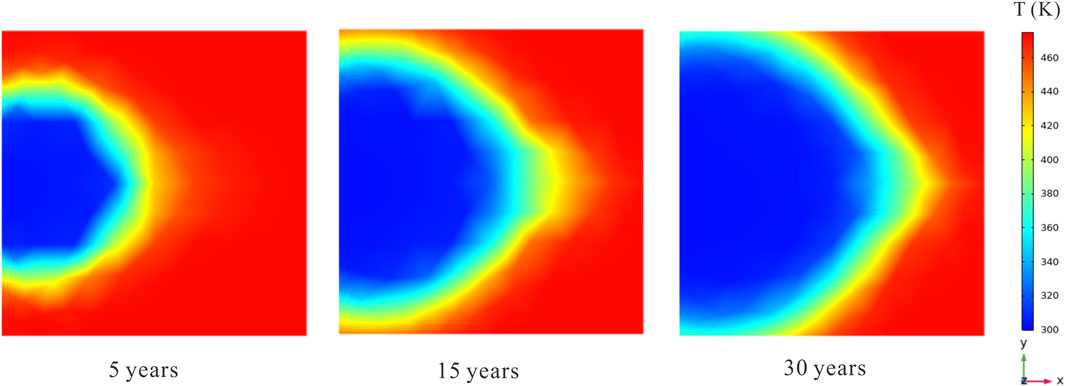
Figure 9. Temperature change in the X-Y plane for Case 50.
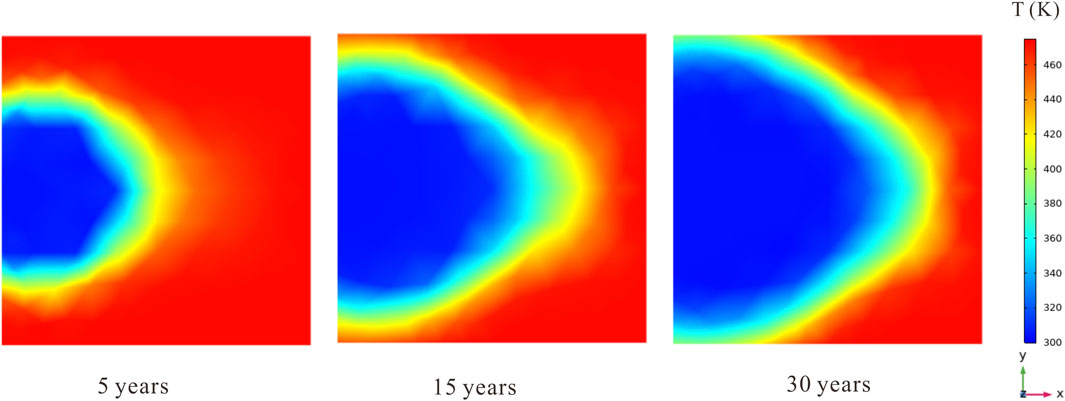
Figure 10. Temperature change in the X-Y plane for Case 100.
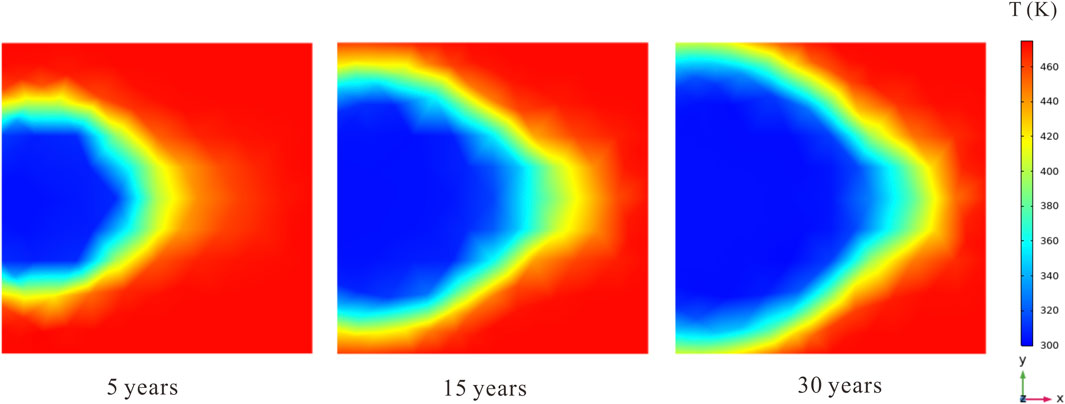
Figure 11. Temperature change in the X-Y plane for Case 150.
In order to more comprehensively illustrate the temperature change among distinct simulation cases, the dynamic alterations in temperature are quantitatively evaluated based on three reference points. These representative points are located at coordinates (X = 100, Y = −50, Z = 25), (X = 100, Y = 0, Z = 25), and (X = 100, Y = 50, Z = 25), as illustrated in Figure 1. The temperature change at the three reference points is visually depicted in Figures 12–14, respectively.
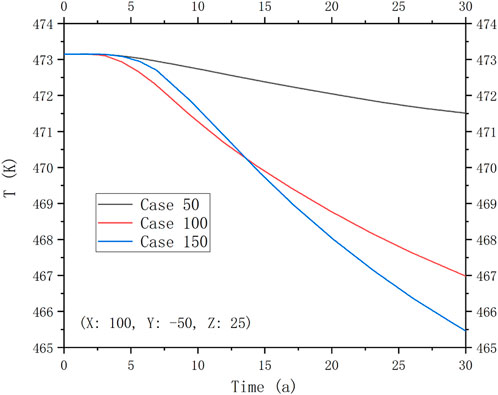
Figure 12. Temperature change in reference point at (X = 100: Y = −50: Z = 25).
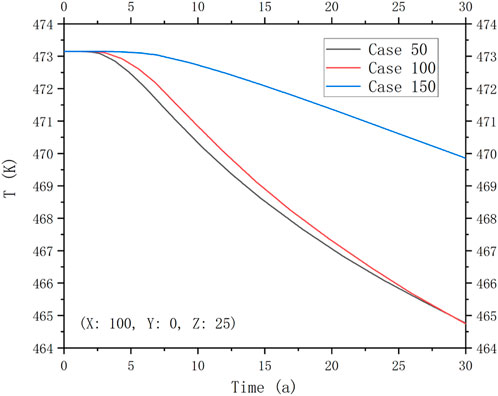
Figure 13. Temperature change in reference point at (X = 100: Y = 0: Z = 25).
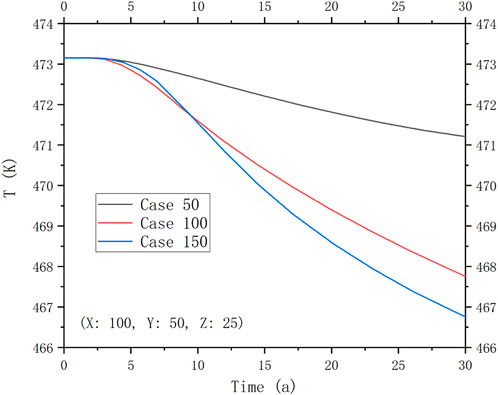
Figure 14. Temperature change in reference point at (X = 100: Y = 50: Z = 25).
In general, at each reference point, the temperature undergoes only slight variations during the initial ∼3”years across all simulation cases (as shown in Figures 12–14). This is attributed to the fact that the cooling water injected into the system has not yet reached these points, and also due to the fact that the heat extraction from the production well has a relatively mild impact on the EGS. Subsequently, the temperature at these points begins to decrease as the cooling water is continually injected and reaches the reference points, exhibiting varying degrees of amplitude in its variation. For Case 50, the temperature variation at the designated coordinates (X = 100, Y = 50, Z = 25) is gradual and steady throughout the entire heat extraction process. This can be attributed to the water pressure discrepancy between the injection well and the production well, which stimulates the movement of cooled water in the direction of the production well. However, for Case 100 and Case 150, the injected cooling water eventually reaches the location at (X = 100, Y = 50, Z = 25) due to the seepage induced by the hot water extraction from the production well. For Case 150, a larger quantity of cooling water flows towards this specific point compared to Case 100. This discrepancy arises because the injected cooling water exhibits a tendency to flow towards the production well, driven by the disparity in fluid pressure.
In regard to the point at (X = 100, Y = 0, Z = 25), the temperature fluctuation demonstrates a comparable pattern and inclination in Case 50 and Case 100 (as shown in Figure 13). This is likely due to the fact that, the cooling water encounters analogous seepage space and flow conditions in its path towards this reference point. Moreover, the disparity in fluid pressure between the injection well and the location at (X = 100, Y = 0, Z = 25) is comparable for both Case 50 and Case 100, as demonstrated in this work. Throughout the entire heat extraction period in Case 150, the temperature at the reference coordinates (X = 100, Y = 50, Z = 25) exhibits a consistently smooth variation. This can be also attributed to the discrepancy in water pressure between the injection well and the production well, which propels the flow of cooling water towards the production well and ensures a continuous provision of cooling water to the reference points. Additionally, an observation can be made at the location of (X = 100, Y = −50, Z = 25), where there is a comparable temperature variation tendency (as seen in Figure 12) to that observed at point (X = 100, Y = 50, Z = 25) (as depicted in Figure 14). It can be inferred that the underlying mechanism responsible for the temperature variation at both of these points is similar to the aforementioned process.
In this study, an efficiency metric called heat extraction efficiency (marked as ef) has been introduced (Zhao et al., 2023). The purpose of this metric is to examine the attenuation process during the temperature variation in the EGS. The heat extraction efficiency is derived by dividing the heat recovery by the total heat stored in the EGS, providing valuable insights into the overall effectiveness of heat extraction (Zhao et al., 2023),
Figure 15 presents the ef performance for each numerical case, as determined by Eq. 10. The calculations reveal slight variations among the different simulation cases, as shown in Figure 15. In general, it can be noted that for three numerical simulation cases, there is a swift surge in the ef during the first 10 years, succeeded by a relatively sluggish progression in the final 20 years. Throughout the heat extraction process, the variation of ef for Case 50 exhibits a slightly lower trend compared to Case 100 and Case 150. Therefore, it could be concluded that the larger the well spacing, the higher the value of ef during the last 20 years.
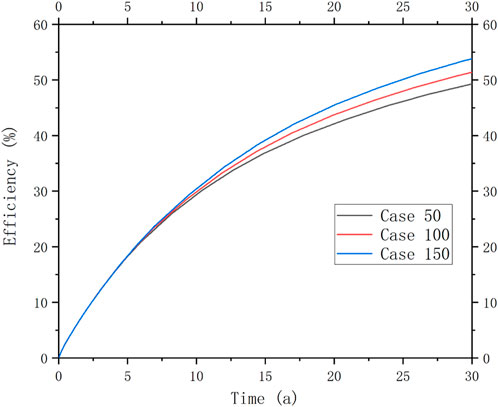
Figure 15. The value of ef for each case in 30 years.
When investigating the temperature variation during the heat extraction process, there are minimal disparities observed among the three operation cases on the X-Y plane and Y-Z plane. Furthermore, a noticeable observation is that smaller production well spacing leads to a smaller cooling area during heat extraction.
Based on the investigation conducted on the points (X = 100: Y = 0: Z = 25), (X = 100: Y = 50: Z = 25), and (X = 100: Y = −50: Z = 25), it is observed that the temperature is piecemeal reduce in each reference point for the unceasing injection of cooling water and its arrival at the representative locations at (X = 100, Y = 0, Z = 25), (X = 100, Y = −50, Z = 25), and (X = 100, Y = 50, Z = 25), albeit with varying amplitude of variation. Notably, among the three numerical cases, the temperature change at points (X = 100: Y = −50: Z = 25) and (X = 100: Y = 50: Z = 25) exhibits a significant difference. Conversely, for Case 50 and Case 100, the temperature change at the point (X = 100: Y = 0: Z = 25) appears less pronounced.
As for the ef, it is noteworthy that the variation of the ef for Case 50 exhibits a slightly lower trend compared to Case 100 and Case 150. This finding suggests that the spacing of production wells has impact on the ef in an EGS system during the last 15 years. Therein, it could be concluded that the larger the well spacing, the higher the value of ef.
The original contributions presented in the study are included in the article/Supplementary material, further inquiries can be directed to the corresponding author.
ZW: Conceptualization, Writing–original draft. BZ: Conceptualization, Methodology, Writing–original draft. XZ: Data curation, Methodology, Writing–original draft. LY: Investigation, Project administration, Writing–original draft. YF: Conceptualization, Methodology, Writing–review and editing. HY: Methodology, Validation, Writing–original draft. PZ: Methodology, Writing–review and editing. JL: Funding acquisition, Supervision, Writing–review and editing.
The author(s) declare financial support was received for the research, authorship, and/or publication of this article. This study was financially supported by the China Three Gorges Corporation (Grant No. WWKY-2021-0393) and the Natural Science Foundation of Chongqing, China (Grant No. CSTB2023NSCQ-LZX0036).
Authors ZW, BZ, XZ, LY, YF, and HY were employed by China Three Gorges Corporation. Author BZ was employed by China Three Gorges Corporation.
The remaining authors declare that the research was conducted in the absence of any commercial or financial relationships that could be construed as a potential conflict of interest.
All claims expressed in this article are solely those of the authors and do not necessarily represent those of their affiliated organizations, or those of the publisher, the editors and the reviewers. Any product that may be evaluated in this article, or claim that may be made by its manufacturer, is not guaranteed or endorsed by the publisher.
Abdelhafiz, M. M., Oppelt, J., Mahmoud, O., and Hegele, L. A. (2023). Effect of drilling and wellbore geometry parameters on wellbore temperature profile: implications for geothermal production. Adv. Geo-Energy Res. 8 (3), 170–180. doi:10.46690/ager.2023.06.04
Aliyu, M., and Archer, R. (2021). A thermo-hydro-mechanical model of a hot dry rock geothermal reservoir. Renew. Energ 176, 475–493. doi:10.1016/j.renene.2021.05.070
Chen, J., Jiang, F., and Luo, L. (2013a). Numerical simulation of down-hole seepage flow in enhanced geothermal system. Chin. J. Comput. Phys. 30, 871–878.
Chen, J., Lou, L., and Jiang, F. (2013b). Thermal compensation of rocks encircling heat reservoir in heat extraction of enhanced geothermal system. Chin. J. Comput. Phys. 30, 862–870.
Chen, S., Ding, B., Gong, L., Huang, Z., and Sun, S. (2019). Comparison of multi-field coupling numerical simulation in hot dry rock thermal exploitation of enhanced geothermal systems. Adv. Geo-Energy Res. 3 (4), 396–409. doi:10.26804/ager.2019.04.07
Cheng, L., Li, D., Wang, W., and Liu, J. (2021). Heterogeneous transport of free CH4 and free CO2 in dual-porosity media controlled by anisotropic in situ stress during shale gas production by CO2 flooding: implications for CO2 geological storage and utilization. ACS Omega 6 (40), 26756–26765. doi:10.1021/acsomega.1c04220
Christ, A., Rahimi, B., Regenauer-Lieb, K., and Chua, H. T. (2017). Techno-economic analysis of geothermal desalination using Hot Sedimentary Aquifers: a pre-feasibility study for Western Australia. Desalination 404, 167–181. doi:10.1016/j.desal.2016.11.009
Feng, Z., Zhao, Y., Zhou, A., and Zhang, N. (2012). Development program of hot dry rock geothermal resource in the Yangbajing Basin of China. Renew. Energy 39 (1), 490–495. doi:10.1016/j.renene.2011.09.005
Gan, Q., Candela, T., Wassing, B., Wasch, L., Liu, J., and Elsworth, D. (2021). The use of supercritical CO2 in deep geothermal reservoirs as a working fluid: insights from coupled THMC modeling. Int. J. Rock Mech. Min. Sci. 147, 104872. doi:10.1016/j.ijrmms.2021.104872
Guo, L. L., Zhang, Y. B., Zhang, Y. J., Yu, Z. W., and Zhang, J. N. (2018). Experimental investigation of granite properties under different temperatures and pressures and numerical analysis of damage effect in enhanced geothermal system. Renew. Energy 126, 107–125. doi:10.1016/j.renene.2018.02.117
Han, S., Cheng, Y., Gao, Q., Yan, C., and Zhang, J. (2020). Numerical study on heat extraction performance of multistage fracturing Enhanced Geothermal System. Renew. Energy 149, 1214–1226. doi:10.1016/j.renene.2019.10.114
Hao, L., Zhou, M., Song, Y., Ma, X., Wu, J., Zhu, Q., et al. (2021). Tin-based perovskite solar cells: further improve the performance of the electron transport layer-free structure by device simulation. Sol. Energy 230, 345–354. doi:10.1016/j.solener.2021.09.091
Hu, X., Lv, J., Li, S., Du, G., Wang, Z., Li, H., et al. (2022). Joint interpretation technology of favorable HDR geothermal resource exploration in Northern Songliao Basin. Unconv. Resour. 2, 133–138. doi:10.1016/j.uncres.2022.08.005
Huang, L. K., He, R., Yang, Z. Z., Tan, P., Chen, W. H., Li, X. G., et al. (2023). Exploring hydraulic fracture behavior in glutenite formation with strong heterogeneity and variable lithology based on DEM simulation. Eng. Fract. Mech. 278, 109020. doi:10.1016/j.engfracmech.2022.109020
Huang, X., Zhu, J., and Li, J. (2015). “Analysis of wellbore heat transfer in enhanced geothermal system using CFD modeling,” in Proceedings of world geothermal congress, Melbourne, Australia, April 2015.
Ke, Z., Feng, B., Liu, Y., Cui, Z., and Liu, X. (2022). Dissolution and sedimentation patterns of typical minerals in artificial reservoirs under different environments. Unconv. Resour. 2, 60–71. doi:10.1016/j.uncres.2022.08.004
Kumari, W., and Ranjith, P. G. (2019). Sustainable development of enhanced geothermal systems based on geotechnical research – a review. Earth Sci. Rev. 199, 102955. doi:10.1016/j.earscirev.2019.102955
Li, M., and Lior, N. (2014). Comparative analysis of power plant options for enhanced geothermal systems (EGS). Energies 07 (12), 8427–8445. doi:10.3390/en7128427
Li, Z., and Elsworth, D. (2019). Controls of CO2–N2 gas flood ratios on enhanced shale gas recovery and ultimate CO2 sequestration. J. Petrol. Sci. Eng. 179, 1037–1045. doi:10.1016/j.petrol.2019.04.098
Lin, T., Liu, X., Zhang, J., Bai, Y., Liu, J., Zhang, Y., et al. (2021). Characterization of multi-component and multi-phase fluids in the Upper Cretaceous oil shale from the Songliao basin (NE China) using T1–T2 NMR correlation maps. Pet. Sci. Technol. 39 (23-24), 1060–1070. doi:10.1080/10916466.2021.1990318
Liu, J., Bai, X., and Elsworth, D. (2024). Evolution of pore systems in low-maturity oil shales during thermal upgrading - quantified by dynamic SEM and machine learning. Petroleum Sci., doi:10.1016/j.petsci.2023.12.021
Liu, J., Xie, L. Z., He, B., Gan, Q., and Zhao, P. (2021). Influence of anisotropic and heterogeneous permeability coupled with in-situ stress on CO2 sequestration with simultaneous enhanced gas recovery in shale: quantitative modeling and case study. Int. J. Greenh. Gas. Control 104, 103208. doi:10.1016/j.ijggc.2020.103208
Liu, J., Yao, Y., Liu, D., and Elsworth, D. (2017a). Experimental evaluation of CO2 enhanced recovery of adsorbed-gas from shale. Int. J. Coal Geol. 179, 211–218. doi:10.1016/j.coal.2017.06.006
Liu, J., Yao, Y., Liu, D., Pan, Z., and Cai, Y. (2017b). Comparison of three Key marine shale reservoirs in the southeastern margin of the sichuan basin, SW China. Minerals 7 (10), 179. doi:10.3390/min7100179
Lu, S. M. (2018). A global review of enhanced geothermal system (EGS). Renew. Sust. Energ Rev. 81, 2902–2921. doi:10.1016/j.rser.2017.06.097
Olasolo, P., Juárez, M., Olasolo, J., Morales, M. P., and Valdani, D. (2016). Economic analysis of Enhanced Geothermal Systems (EGS). A review of software packages for estimating and simulating costs. Appl. Therm. Eng. 104, 647–658. doi:10.1016/j.applthermaleng.2016.05.073
Rodriguez, C. E. C., Palacio, J. C. E., Venturini, O. J., Lora, E. E. S., Cobas, V. M., dos Santos, D. M., et al. (2013). Exergetic and economic comparison of ORC and Kalina cycle for low temperature enhanced geothermal system in Brazil. Appl. Therm. Eng. 52 (1), 109–119. doi:10.1016/j.applthermaleng.2012.11.012
Spycher, N., and Pruess, K. (2010). A phase-partitioning model for CO2-brine mixtures at elevated temperatures and pressures: application to CO2-enhanced geothermal systems. Transp. Porous Media 82 (1), 173–196. doi:10.1007/s11242-009-9425-y
Steffen, J., Lengsfeld, S., Jung, M., Ponick, B., Gracia, M. H., Spagnolo, A., et al. (2021). Design of a medium voltage generator with DC-cascade for high power wind energy conversion systems. Energies 14, 3106. doi:10.3390/en14113106
Sun, H., Yao, J., Gao, S. H., Fan, D. Y., Wang, C. C., and Sun, Z. X. (2013). Numerical study of CO2 enhanced natural gas recovery and sequestration in shale gas reservoirs. Int. J. Greenh. Gas. Control 19, 406–419. doi:10.1016/j.ijggc.2013.09.011
Sun, X., Liao, Y., Wang, Z., and Sun, B. (2019). Geothermal exploitation by circulating supercritical CO2 in a closed horizontal wellbore. Fuel 254, 115566. doi:10.1016/j.fuel.2019.05.149
Tan, P., Jin, Y., and Pang, H. W. (2021). Hydraulic fracture vertical propagation behavior in transversely isotropic layered shale formation with transition zone using XFEM-based CZM method. Eng. Fract. Mech. 248, 107707. doi:10.1016/j.engfracmech.2021.107707
Wang, D., Dong, Y., Li, Y., Wang, Y., Li, Y., Liu, H., et al. (2022). Numerical simulation of heat recovery potential of hot dry rock under alternate temperature loading. Unconv. Resour. 2, 170–182. doi:10.1016/j.uncres.2022.09.006
Wang, R., Ding, W., Zhang, Y., Wang, Z., Wang, X., He, J., et al. (2016a). Analysis of developmental characteristics and dominant factors of fractures in Lower Cambrian marine shale reservoirs: a case study of Niutitang formation in Cen'gong block, southern China. J. Petroleum Sci. Eng. 138, 31–49. doi:10.1016/j.petrol.2015.12.004
Wang, R., Gu, Y., Ding, W., Gong, D., Yin, S., Wang, X., et al. (2016b). Characteristics and dominant controlling factors of organic-rich marine shales with high thermal maturity: a case study of the Lower Cambrian Niutitang Formation in the Cen'gong block, southern China. J. Nat. Gas Sci. Eng. 33, 81–96. doi:10.1016/j.jngse.2016.05.009
Wang, Y., and Zhang, K. (2011). Modeling approaches for fractures in enhanced geothermal system (EGS). Shanghai Land Resour. 32, 77–80. doi:10.3969/j.issn.2095-1329.2011.03.021
Wang, Z. W., Zhang, B., Yin, L. K., Yang, L. M., Fan, Y. F., Yin, H. M., et al. (2023). The number of production wells affects the heat extraction performance of an enhanced geothermal system: insights from engineering-scale 3D THM coupling numerical simulations. Front. Earth Sci. 11, 1185936. doi:10.3389/feart.2023.1185936
Yang, R., Wang, Y., Song, G., and Shi, Y. (2023). Fracturing and thermal extraction optimization methods in enhanced geothermal systems. Adv. Geo-Energy Res. 9 (2), 136–140. doi:10.46690/ager.2023.08.07
Yang, R. Y., Hong, C. Y., Liu, W., Wu, X. G., Wang, T. Y., and Huang, Z. W. (2021). Non-contaminating cryogenic fluid access to high-temperature resources: liquid nitrogen fracturing in a lab-scale Enhanced Geothermal System. Renew. Energy 165, 125–138. doi:10.1016/j.renene.2020.11.006
Ye, Z., Wang, J., and Hu, B. (2021). Comparative study on heat extraction performance of geothermal reservoirs with presupposed shapes and permeability heterogeneity in the stimulated reservoir volume. J. Petroleum Ence Eng. 206, 109023. doi:10.1016/j.petrol.2021.109023
Yu, P., Dempsey, D., and Archer, R. (2021). A three-dimensional coupled thermo-hydro-mechanical numerical model with partially bridging multi-stage contact fractures in horizontal-well enhanced geothermal system. Int. J. Rock Mech. Min. 143, 104787. doi:10.1016/j.ijrmms.2021.104787
Zhang, F. Z., and Jiang, P. X. (2012). Thermodynamic analysis of a binary power cycle for different EGS geofluid temperatures. Appl. Therm. Eng. 48, 476–485. doi:10.1016/j.applthermaleng.2012.04.028
Zhao, P., He, B., Zhang, B., and Liu, J. (2022). Porosity of gas shale: is the NMR-based measurement reliable? Pet. Sci. 19, 509–517. doi:10.1016/j.petsci.2021.12.013
Zhao, P., Liu, J., and Elsworth, D. (2023). Numerical study on a multifracture enhanced geothermal system considering matrix permeability enhancement induced by thermal unloading. Renew. Energy 203, 33–44. doi:10.1016/j.renene.2022.12.056
Zheng, S. J., Yao, Y. B., Liu, D. M., Cai, Y. D., and Liu, Y. (2018). Characterizations of full-scale pore size distribution, porosity and permeability of coals: a novel methodology by nuclear magnetic resonance and fractal analysis theory. Int. J. Coal Geol. 196, 148–158. doi:10.1016/j.coal.2018.07.008
Zheng, S. J., Yao, Y. B., Liu, D. M., Cai, Y. D., Liu, Y., and Li, X. W. (2019). Nuclear magnetic resonance T2 cutoffs of coals: a novel method by multifractal analysis theory. Fuel 241, 715–724. doi:10.1016/j.fuel.2018.12.044
Zhou, L., Zhu, Z., Xie, X., and Hu, Y. (2022). Coupled thermal-hydraulic-mechanical model for an enhanced geothermal system and numerical analysis of its heat mining performance. Renew. Energy 181, 1440–1458. doi:10.1016/j.renene.2021.10.014
Zimmermann, G., Tischner, T., Legarth, B., and Huenges, E. (2009). Pressure-dependent production efficiency of an enhanced geothermal system (EGS): stimulation results and implications for hydraulic fracture treatments. Pure Appl. Geophys. 166 (5-7), 1089–1106. doi:10.1007/s00024-009-0482-5
Zinsalo, J., Lamarche, L., and Raymond, J. (2021). Design and optimization of multiple wells layout for electricity generation in a multi-fracture enhanced geothermal system. Sustain Energy Techn 47, 101365. doi:10.1016/j.seta.2021.101365
Keywords: space of production well, heat extraction efficiency, enhanced geothermal system (EGS), numerical simulation, engineering scale
Citation: Wang Z, Zhang B, Zhu X, Yang L, Fan Y, Yin H, Zhao P and Liu J (2024) How does the space of production wells influence the heat extraction efficiency?–defined by a 3D modeling work in enhanced geothermal system (EGS). Front. Energy Res. 12:1361290. doi: 10.3389/fenrg.2024.1361290
Received: 25 December 2023; Accepted: 22 January 2024;
Published: 07 February 2024.
Edited by:
Feng Dong, China University of Geosciences, ChinaReviewed by:
Jianhua Zou, Chongqing Three Gorges University, ChinaCopyright © 2024 Wang, Zhang, Zhu, Yang, Fan, Yin, Zhao and Liu. This is an open-access article distributed under the terms of the Creative Commons Attribution License (CC BY). The use, distribution or reproduction in other forums is permitted, provided the original author(s) and the copyright owner(s) are credited and that the original publication in this journal is cited, in accordance with accepted academic practice. No use, distribution or reproduction is permitted which does not comply with these terms.
*Correspondence: Bo Zhang, emhhbmdfYm8xN0BjdGcuY29tLmNu
Disclaimer: All claims expressed in this article are solely those of the authors and do not necessarily represent those of their affiliated organizations, or those of the publisher, the editors and the reviewers. Any product that may be evaluated in this article or claim that may be made by its manufacturer is not guaranteed or endorsed by the publisher.
Research integrity at Frontiers
Learn more about the work of our research integrity team to safeguard the quality of each article we publish.