 Bin He
 Weixuan Yin
- School of Infrastructure Engineering, Dalian University of Technology, Dalian, Liaoning, China
Hydropower and photovoltaic power are widely used as clean energy sources around the world. Hydro-Photovoltaic complementary is precisely the use of the regulation performance of hydropower stations and the peak regulation performance of PV electric fields to improve the system’s power generation efficiency. The Yalong River basin as one of China’s clean energy bases, is rich in water and light resources. And now its midstream Yangfanggou hydropower station has just been completed, and the relevant PV electric field is in the construction planning stage. It is worth studying how to effectively utilize its hydropower and PV output resources. Therefore, Yangfanggou hydropower station and its PV electric field are taken as the research objects in this paper. The possibility of hydro-photovoltaic complementarity is analyzed within the year and day respectively. Then, a short-term scheduling model of hydro-photovoltaic complementarity is constructed according to the principle, and its operation mode and effect are optimized using the genetic algorithm NSGA-II. The results indicate that the annual power generation of the system is increased by about 1.4 billion kWh from the original hydropower through the hydro-photovoltaic complementary, and the annual guaranteed output is also increased with a large increase degree at the same time.
1 Introduction
Hydro-photovoltaic complementary mainly compensates for photovoltaic volatility, intermittency and randomness through the regulating ability of hydropower stations to enhance the system’s ability to consume photovoltaic (PV) power, thus improving the system’s guaranteed output (Züttel et al., 2022). As an important part of sustainable development in the world, energy affects ecological changes and human lifestyles (Anoune et al., 2018). Nowadays, with rapid economic and social development, energy shortage is becoming more and more prominent, and electricity supply is becoming more and more tight (An et al., 2019; Liu et al., 2023), so clean energy development has become an important issue of concern for all countries in the world (Khan and Iqbal, 2005; Li et al., 2018).
As clean energy sources, hydropower and PV resources have been vigorously developed and applied on a global scale (Zhang et al., 2019). The research on hydropower and PV power generation in other countries is more mature, which started earlier than that in China. Margeta et al. first proposed the combination of solar and hydro resources, using the advantages of rapid peak and frequency regulation of hydropower plants to compensate for the shortage of photovoltaic plants, to ensure the safe and stable operation of the power grid (Margeta and Glasnovic, 2012). Dimitra Apostolopoulou et al. proposed an optimal dispatch scheme for hydro-photovoltaic complementary operation based on the Tana River in Kenya that maximizes the head level and minimizes the overflow effect at each dam (Apostolopoulou and McCulloch, 2019). In China, Ming Bo et al. established a short-term robust optimization model for hydro-photovoltaic complementary operation considering the uncertainty of photovoltaic output (Ming et al., 2018). Ding Hang et al. established a short-term optimal scheduling model for hydro-photovoltaic complementary operation based on the first phase of Longyangxia project (Ding et al., 2016). Zhang Yusheng et al. developed a general framework for the short-term optimal operation strategy of the hybrid hydro-photovoltaic system of the terrace based on the Banduo-Yangqu terrace hydropower station (Zhang et al., 2021). Tang et al. established an optimization model to determine the optimal sites and sizes of wind and PV power plants, which aimed to maximize the power output complementary coefficient (Tang et al., 2020). In the field of evaluation and analysis methods for power systems, Nedaei and Walsh developed a new analysis method for efficiency evaluation and optimization of hydropower systems based on the hydropower output model (Nedaei and Walsh, 2022).
Under the influence of China's “14th Five-Year Plan”, renewable energy sources such as solar energy and water energy have a bright future, and are receiving widespread attention and developing at a rapid pace (Mi et al., 2019; Liu et al., 2022). Judging from the 10-year historical data from 2012 to 2021, the proportion of non-fossil energy installed capacity has increased significantly. In 2021, the full-caliber non-fossil energy installed capacity will reach 1.12 billion kilowatts, a year-on-year increase of 13.4%, accounting for 47.0% of the total power generation installed capacity, surpassing coal power installed capacity for the first time (Liang et al., 2020). From the installed capacity growth rate, the installed capacity of solar power grew faster in 2021, up 20.9% year-on-year, and hydropower grew 5.6% year-on-year.
It is not difficult to find that China attaches great importance to the development of new energy. At present, China’s 13 major hydropower bases, including Jinsha River, Dadu River, Yalong River, Wujiang River, Hongshui River, Lancang River and Yellow River, are also under comprehensive development and construction. Among them, the Yalong River Hydropower Base ranks the third in the “China’s Thirteen Largest Hydropower Base Plan”, second only to the Jinsha River Hydropower Base and the Yangtze River Upstream Hydropower Base, and the potential hydropower resources of the whole basin are 30 million kilowatts (Wu et al., 2022).
This paper takes Yangfanggou hydropower station (YHS) and its PV electric field on the Yalong River as the research object. Firstly, this paper analyzes the possibility of hydro-photovoltaic complementation within the year and day from the annual, monthly and daily output characteristics of the hydropower station and PV electric field. Then it constructs a scheduling model of hydro-photovoltaic complementation according to the principle of complementation. Finally, according to the output of the model, it analyzes and studies the hydro-photovoltaic complementation operation mode of YHS and its operation effect.
In this research, as opposed to previous studies, the PV electric field is still in the planning period and its specific power load demand is uncertain. Therefore, the novelty of this article is the establishment of a new multi-objective hydro-photovoltaic complementary model to meet the practical needs of hydro-photovoltaic complementary in the hydropower station. The model not only considers daily power generation, but also introduces other indicators: guaranteed output, water abandonment and PV abandonment rate, which comprehensively analyzes the changes after and before the hydro-photovoltaic complementary.
2 Basin case
The Yalong River ranks third in “China’s Thirteen Largest Hydropower Base Plan”, after the Jinsha River and the upper reaches of the Yangtze River (Wu et al., 2022). The Yalong River, located in the west of Sichuan Province and is the largest tributary of the Jinsha River. The Yalong River basin is rich in water, with many beaches and urgent water, large natural gap and abundant hydropower resources. The mainstream of the Yalong River is planned to be developed with 22 large and medium-sized cascade hydropower stations, such as Wenpo, Lianghekou, Yangfanggou, Jinping- I, Jinping- II and Ertan hydropower stations, which can install about 30 million kW. The mainstream of the Yalong River is planned to be constructed in three sections: the upstream section is in the planning stage, the midstream section is in the planning and construction stage, and the downstream section has been completed. The distribution of hydropower stations and PV electric fields in the Yalong River basin is shown in Figure 1.
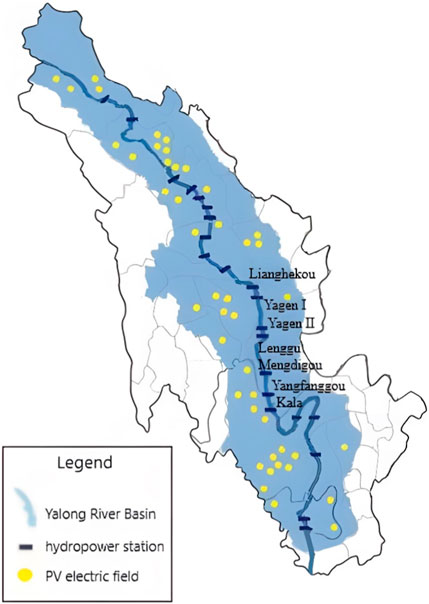
FIGURE 1. Distribution of hydropower and PV stations in Yalong basin.
The middle river section hydropower development plan for “one reservoir seven cascade”, installed about 11.845 million kW. The installed capacity of Lianghekou Hydropower Station is 3 million kW, and the average annual generating capacity is 11.062 billion kWh, which is a controlled “leading” reservoir in the middle reaches. The installed capacity of YHS is 1.5 million kW, and the average annual generating capacity is 5.965 billion kWh. The Yalong River basin is not only rich in water energy resources, but is also located in an area rich in solar energy resources. The Yangfanggou PV electric field is currently in the construction planning stage, with a total installed capacity of 1 million kW planned.
This paper takes the YHS in the middle reaches of the Yalong River as the object of study. Through frequency analysis of the water input data for a total of 60 years from 1950 to 2010, the water input process of five typical years was selected, namely, the year of abundant water, the year of medium abundant water, the year of flat water, the year of medium dry water and the year of dry water. The PV output was calculated from the PV radiation values at the Muli PV station for each time of the year, and the typical PV output process for each month of the year was obtained by dividing the set and scenario analysis. All above will form the basis for subsequent research on hydro-photovoltaic complementary.
3 Analysis of the possibility of hydro-photovoltaic complementation
Hydro-photovoltaic complementarity can mainly enhance the grid’s ability to consume PV and the stability of the system (Li et al., 2020; Wei et al., 2022), because the regulating ability of the hydropower station can compensate for the volatility, intermittency and randomness of PV output, and using the abundant energy of PV energy can compensate for the shortcomings of the seasonal peaking power of hydropower (Huang et al., 2020; Fan et al., 2021; Gu et al., 2022). This section is intended to analyze the potential for daily hydro-photovoltaic complementarity of YHS in terms of the characteristics of its hydropower and PV output.
The hydropower resources of the Yalong River basin are rich but unevenly distributed seasonally. It is sufficient in the rainy season from July to October and scarce in the dry season. On the contrary, PV power has the characteristics of high output in the dry season and low output in the flood season, providing a substantial amount of power support in the dry season, which forms a useful complement to hydropower in season. This section analyzed the incoming water information from 1950 to 2010, and ranked the incoming water from rich to dry in frequency to obtain five typical years from rich to dry. The hydropower output and PV output for each month of the Flat Water Year are shown in Figure 2.
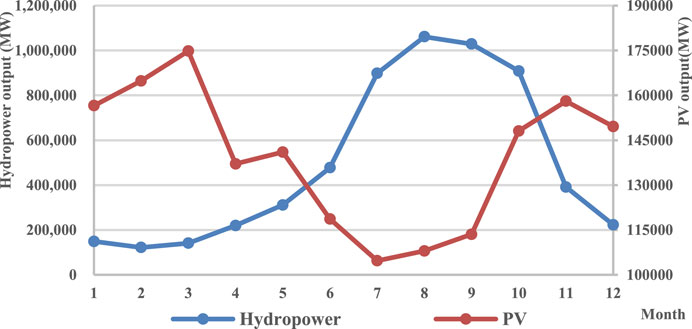
FIGURE 2. Hydropower and PV output by month in the Flat Water Year.
The PV power generation depends mainly on solar irradiance, which is sensitive and volatile with seasonal and weather changes, so there is a certain pattern of PV output with seasonal and weather differences. In this paper, the hour-by-hour PV output process of the Muli PV electric field for a year is classified by month, and the typical daily PV output process for each month is filtered out by scenario analysis. It is not difficult to see that the PV output varies considerably within the day, with the maximum at midday and 0 at night. On the contrary, hydropower is more stable during the day, so it is possible to bundle photovoltaic and hydropower as a combined power source. With the help of reservoir storage, it is equivalent to converting the daytime photoelectricity into hydroelectricity to be stored in the reservoir until the peak of electricity consumption for power generation, which also reflects the good hydro-photovoltaic complementarity.
Based on the analysis of the hydropower and PV output characteristics of YHS, it is easy to find that there is a possibility of complementarity between hydropower and PV power, laying the foundation for the study of short-term optimal scheduling of hydro-photovoltaic complementarity.
4 Model
Through the above qualitative analysis of the possibility of intra-year and intra-day hydro-photovoltaic complementarity between the YHS hydropower plant and the PV electric fields, the following short-term scheduling model for hydro-photovoltaic complementarity is established to quantitatively analyse the system’s ability to consume PV and enhance power output. This paper determines that the principles of system’s hydro-photovoltaic complementarity include: water balance, maximum intra-day output, stable intra-day power output and the principle of less abandonment of photovoltaic and water power, based on the characteristics of the tasks undertaken by YHS.
4.1 Hydro-photovoltaic complementary model
This paper establishes an intra-day hydro-photovoltaic complementary short-term scheduling model based on the water and photovoltaic energy resources in the YHS basin. The maximum daily output, the minimum fluctuation of power output and the minimum abandonment of photovoltaic and water are set as the objective functions of the system. The constraints include PV output constraint, hydropower output constraint, hydroelectricity constraint, power balance constraint, water quantity balance constraint and more than three other constraints (Gu et al., 2022).
The objective functions of hydro-photovoltaic complementary model are as follows:
Objective function 1: Maximum daily output after hydro-photovoltaic complementary.
Where,
Objective function 2: Minimal intra-day power output fluctuation of hydro-photovoltaic complementary systems (Zhang et al., 2021).
Objective function 3: Minimum abandonment of water.
Where,
Objective function 4: Minimum abandonment of photovoltaic.
Where,
The constraints on the hydro-photovoltaic complementary model are as follows:
Constraint 1: PV output constraint.
Where,
Constraint 2: Hydropower output constraint.
Where,
Constraint 3: Hydroelectricity constraint.
Where, C is the amount of electricity generated by the hydropower station under the total water constraint during the scheduling period, determined according to water and power scheduling, and it is a constant value; ∆T is the duration of the one period (Liu et al., 2023).
Constraint 4: Power balance constraint.
Where,
Constraint 5: Water balance constraint.
Where,
Constraint 6: Upper and lower water level constraint.
Where,
Constraint 7: Generation flow constraints.
Where,
Constraint 8: Head restraint.
Where,
4.2 Model solving methods
NSGA-II is one of the most popular multi-objective genetic algorithms, which was proposed by Srinivas and Deb in 2000 on the basis of NSGA (Li and Wang, 2021). As a representative of multi-objective optimization algorithms, it reduces the complexity of non-inferiority sorting genetic algorithms. It not only has the advantages of simple implementation, high efficiency and high accuracy, but also has the advantages of fast running speed and good convergence of the solution set. In addition, the convergence and distributivity can be well maintained under multiple constraints (Li and Qiu, 2016). It can effectively perform multi-objective optimization through methods such as fast non-dominated sorting and congestion calculation (Li et al., 2018; Su et al., 2023). Combined with the characteristics of the hydro-photovoltaic complementary optimal scheduling model, this paper chooses NSGA-II to optimize the model solution.
The settings for the NSGA-II algorithm are as follows: the population is 200, and the number of iterations is 5,000; The probability of cross operation occurring is 0.9, and the distribution index for adjusting the exploratory properties of cross operation is 20.0; The mutation probability is 0.9, and the distribution index controlling the exploratory nature of mutation operations is 30.0.
4.3 Model inputs and outputs
The model inputs include: hourly flow rates of 5 typical years, reservoir level-volume curves, reservoir level-discharge flow curves, and typical daily output of the PV electric fields for each month.
The model outputs include: the hourly output and power generation of the hydro-photovoltaic complementary system, the amount of the PV generation abandonment, and the amount of the water abandonment.
5 Results and analysis
5.1 Analysis of complementary results for each typical year
The data in this paper are based on the analysis of the model outputs. The results of guaranteed output (95%), power generation, PV and water abandonment after hydro-photovoltaic complementary for each typical years are shown in Table 1, and the comparison of guaranteed output before and after the hydro-photovoltaic complementary is shown in Figure 3.
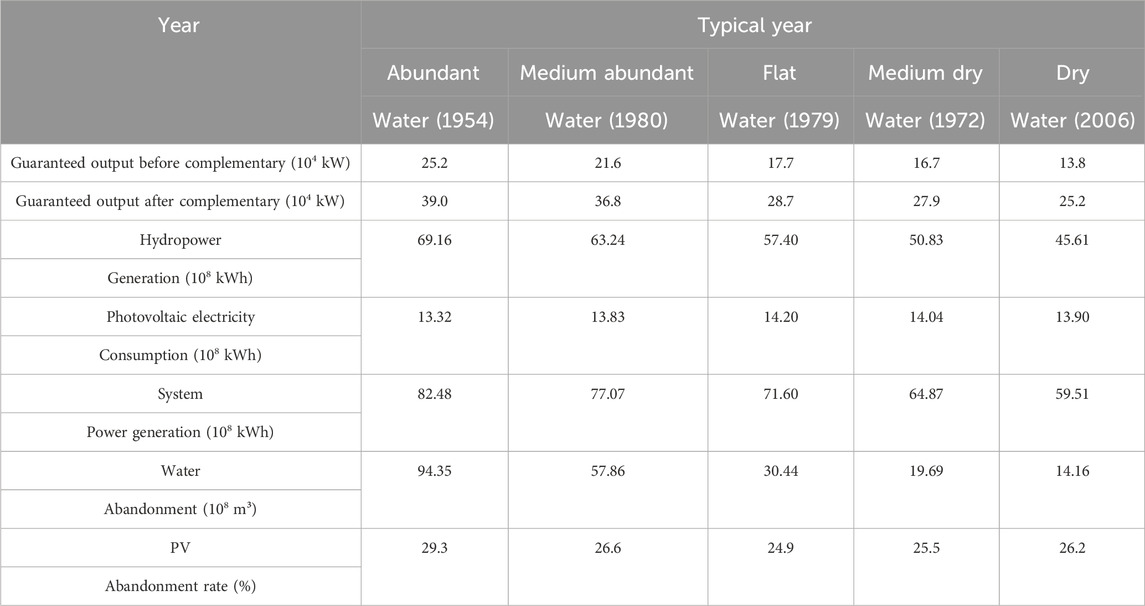
TABLE 1. Guaranteed output and annual power generation at 95% frequency for each typical year.
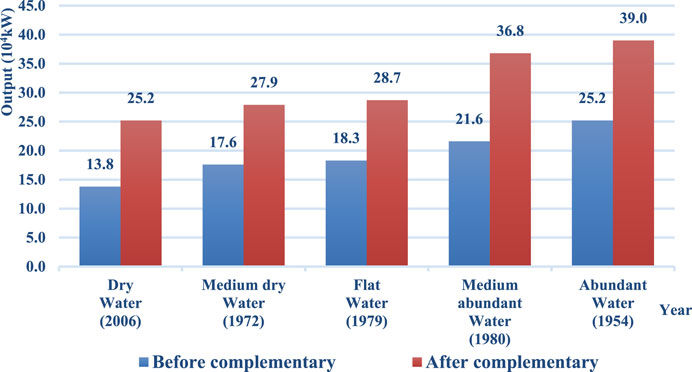
FIGURE 3. Guaranteed output for each typical years before and after hydro-photovoltaic complementary.
Using the Flat Water year (1979) as an example, the guaranteed output after hydro-photovoltaic complementary was 287,000 kW, an increase of 110,000 kW or 62.1% over the pre-complementary period (hydro alone); the annual power generation after the complementary was 7.16 billion kWh, an increase of 1.42 billion kWh or 24.7% over the pre-complementary period. In addition, the annual water abandonment of the Flat Water Year was 3.044 billion m³, and the PV abandonment rate was 24.9%.
In summary, the guaranteed output, hydropower generation and annual system generation for each typical year gradually increase with the incoming water from dry to abundant. The amount of photovoltaic electricity consumption in each typical year is generally stable, at approximately 1.4 billion kWh. As the amount of incoming water increases in each typical year, the amount of water abandonment also gradually increases, but the PV abandonment rate is basically stable at between 25% and 30%.
5.2 Analysis of complementary results for each typical month
Based on the hour-by-hour power output process after the complementary for each typical year of YHS, January and July were identified as typical months due to the different water incoming during the rich and dry seasons. The guaranteed output at 95% frequency for the typical months in each typical year is shown in Table 2.
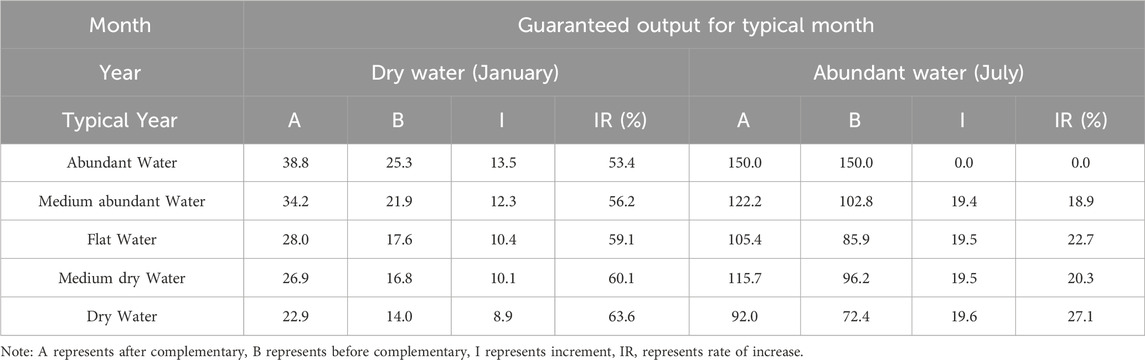
TABLE 2. Guaranteed output at 95% frequency for each typical month (January and July) (104 kW).
From the table, it is found that the increase of guaranteed output for the dry water month in each typical year after the complementary was about 100,000 kW, with an increase rate of about 60%. The increase of guaranteed output for the abundant water month in each typical year was approximately 200,000 kW, with an increase rate of approximately 20%, except the abundant water year. In the abundant water year, it remained unchanged at 1.5 million kW with no increase, as the system reached full generation before the complementary due to the high incoming water.
It can be seen that for the dry water month, the increase in guaranteed output after hydro-photovoltaic complementary is more significant; for the rich water month, while the increase is large, but the increase rate is not as significant as the dry water month.
5.3 Analysis of typical daily complementary results (flat water year)
Based on the hourly output process after the complementary of YHS in the Flat Water year, the typical daily output process was selected for analysis according to the abundant, medium, and dry incoming water during the month. The typical daily hourly output process is shown in Figure 4.
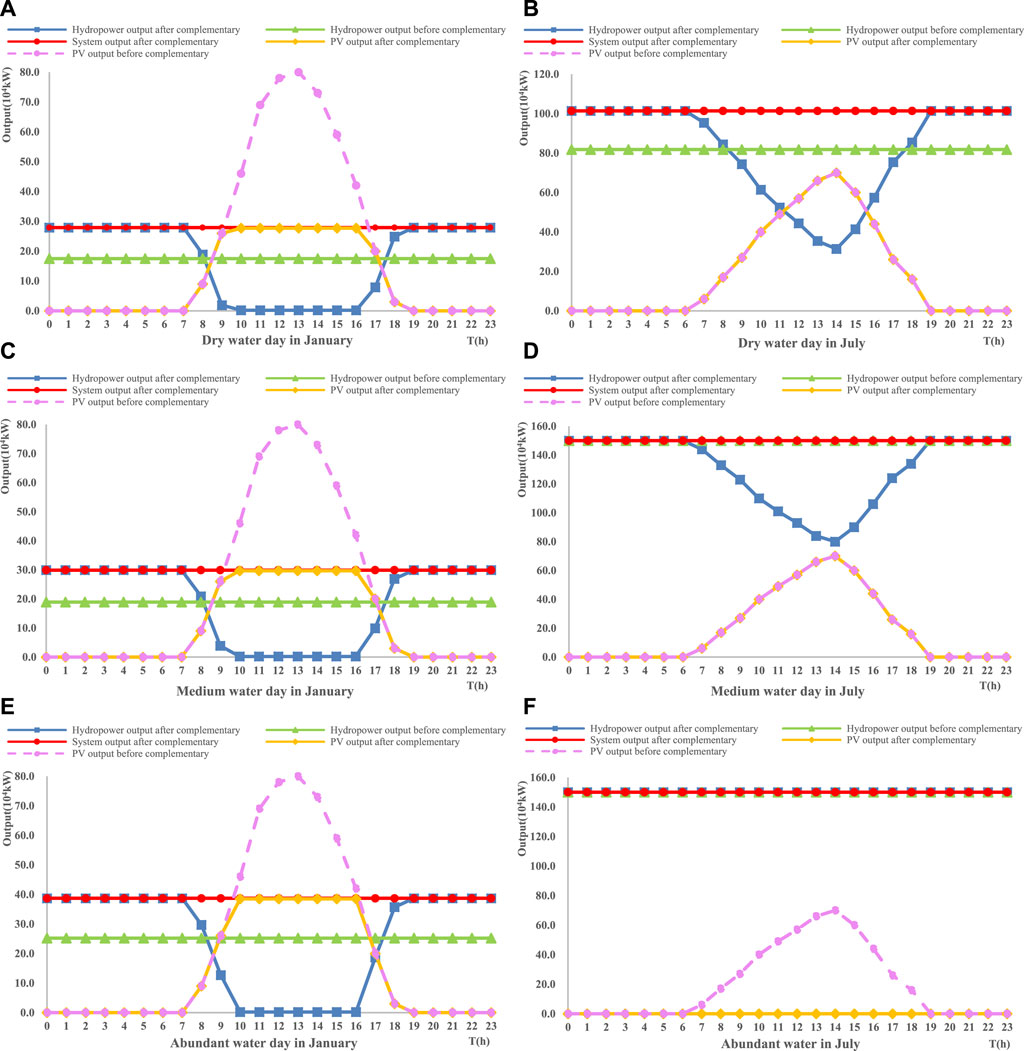
FIGURE 4. Typical daily hourly output process before and after the complementary in the Flat Water Year.
The analysis of the complementary results found that due to the dry incoming water in January, there is no water abandonment, but the PV abandonment rate of all cases is between 35% and 50%. July is a period of abundant water, when the incoming water is the abundant water day, there is both water and PV abandonment, and PV cannot be all consumed; when the incoming water is the medium water day and dry water day, there is no PV abandonment, and PV is fully consumed.
6 Conclusion
This paper focuses on the possibilities and ways on hydro-photovoltaic complementary in the YHS, and proposes an optimal scheduling model for hydro-photovoltaic complementary based on the YHS and its PV electric fields. Some key conclusions can be summarized as follows.
(1) Through an intra-annual and intra-day analysis of the water and solar resources in the Yangfanggou basin, the complementary possibilities on season and day-night are identified respectively.
(2) The hydro-photovoltaic complementary model is built to carry out quantitative calculation on hydro-photovoltaic complementary. After the complementary, the annual power generation of the system is increased by about 1.4 billion kWh from the original hydropower, and the annual guaranteed output is increased by about between 100,000 and 150,000 kW, with a large increase degree.
(3) The system has a smooth power delivery process, with an adequate complementary. However, the PV abandonment rate is relatively high and basically stable at 25%–30%, especially when the incoming water is particularly abundant or dry. Therefore, how to absorb PV better and reduce the waste of PV resources need be further studied.
Data availability statement
The original contributions presented in the study are included in the article/Supplementary material, further inquiries can be directed to the corresponding author.
Author contributions
BH: Conceptualization, Supervision, Writing–review and editing. WY: Data curation, Formal Analysis, Methodology, Writing–original draft, Writing–review and editing. GL: Funding acquisition, Project administration, Writing–review and editing. LJ: Investigation, Resources, Software, Writing–review and editing.
Funding
The author(s) declare that no financial support was received for the research, authorship, and/or publication of this article.
Acknowledgments
The authors acknowledge financial support from the National Natural Science Foundation of China funded project (51779030).
Conflict of interest
The authors declare that the research was conducted in the absence of any commercial or financial relationships that could be construed as a potential conflict of interest.
Publisher’s note
All claims expressed in this article are solely those of the authors and do not necessarily represent those of their affiliated organizations, or those of the publisher, the editors and the reviewers. Any product that may be evaluated in this article, or claim that may be made by its manufacturer, is not guaranteed or endorsed by the publisher.
References
An, Y., Zhao, Z., Wang, S., Huang, Q., and Xie, X. (2019). Coordinative optimization of hydro-photovoltaic-wind-battery complementary power stations. CSEE J. Power Energy Syst. 6 (2), 410–418. doi:10.17775/CSEEJPES.2019.00330
Anoune, K., Bouya, M., Astito, A., and Abdellah, A. B. (2018). Sizing methods and optimization techniques for PV-wind based hybrid renewable energy system: a review. Renew. Sust. Energ Rev. 93, 652–673. doi:10.1016/j.rser.2018.05.032
Apostolopoulou, D., and McCulloch, M. (2019). Optimal short-term operation of a cascaded hydro-solar hybrid system: a case study in Kenya. IEEE Trans. Sustain. Energy 10 (4), 1878–1889. doi:10.1109/tste.2018.2874810
Ding, H., An, Y., Wang, S. K., and Wang, H. (2016). Optimization of short-term operation of hydro-photovoltaic power system. Sci. Discov. 4 (6). doi:10.11648/j.sd.20160406.15
Fan, H. Y., Yan, T. X., and Guo, S. (2021). Methods on scheduling of hydro-photovoltaic complementary system. E3S Web Conf. 257, 01034. doi:10.1051/E3SCONF/202125701034
Gu, T. T., Zhou, L. C., and Xiong, F. J. (2022). Stability analysis of cascade hydro-photovoltaic complementation power system in cascade hydropower station. Fifth Int. Conf. Mechatronics Comput. Technol. Eng. (MCTE 2022) 12500, 768–773. doi:10.1117/12.2660719
Huang, H., Qin, L., Yu, Y. Y., and Wei, D. W. (2020). Smart-power generation technology of clean energy with water-light multi-energy complementary. Distrib. Energy 5 (2), 21. doi:10.16513/j.2096-2185.DE.1901118
Khan, M. J., and Iqbal, M. T. (2005). Pre-feasibility study of stand-alone hybrid energy systems for applications in newfoundland. Renew. Energy. 30 (6), 835–854. doi:10.1016/j.renene.2004.09.001
Li, B., and Wang, J. W. (2021). Economic dispatch methods for smart grid based on improved SPEA2 and improved NSGA2. Front. Energy Res. 9. doi:10.3389/fenrg.2021.767721
Li, F. F., and Qiu, J. (2016). Multi-objective optimization for integrated hydro-photovoltaic power system. Appl. Energy. 167, 377–384. doi:10.1016/j.apenergy.2015.09.018
Li, F. F., Qiu, J., and Wei, J. H. (2018). Multi-objective optimization for hydro-photovoltaic hybrid power system considering both energy generation and energy consumption. Energy Sci. Eng. 6 (5), 362–370. doi:10.1002/ese3.202
Li, H., Li, H. J., Lu, W. H., Wang, Z. H., and Bian, J. (2020). Optimal power flow calculation considering large-scale photovoltaic generation correlation. Front. Energy Res. 8. doi:10.3389/fenrg-2020.590418
Liang, D., Tian, Z., Ren, F., and Pan, J. (2020). Installed hydropower capacity and carbon emission reduction efficiency based on the EBM method in China. Front. Energy Res. 8, 82. doi:10.3389/fenrg.2020.00082
Liu, B. X., Peng, Z. H., Liao, S. L., Liu, T. Y., and Lu, J. (2023). A multi-objective optimization model for the coordinated operation of hydropower and renewable energy. Front. Energy Res. 11, 1193415. doi:10.3389/fenrg.2023.1193415
Liu, Z., Deng, Z., He, G., Wang, H., Zhang, X., Lin, J., et al. (2022). Challenges and opportunities for carbon neutrality in China. Nat. Rev. Earth Environ. 3 (2), 141–155. doi:10.1038/s43017-021-00244-x
Margeta, J., and Glasnovic, Z. (2012). Theoretical settings of photovoltaic-hydro energy system for sustainable energy production. Sol. Energy. 86 (3), 972–982. doi:10.1016/j.solener.2012.01.007
Mi, Z., Yuan, B., and Zhang, J. F. (2019). Study on the scale of new energy development during the 14th five-year plan period. IOP Conf. Ser. Earth Environ. Sci. 371, 042059. doi:10.1088/1755-1315/371/4/042059
Ming, B., Liu, P., Cheng, L., Zhou, Y. L., and Wang, X. X. (2018). Optimal daily generation scheduling of large hydro-photovoltaic hybrid power plants. Energy Conv. Manag. 171, 528–540. doi:10.1016/j.enconman.2018.06.001
Nedaei, M., and Walsh, P. R. (2022). Technical performance evaluation and optimization of a run-of-river hydropower facility. Renew. Energy. 182, 343–362. doi:10.1016/j.renene.2021.10.021
Su, R., He, G. B., Su, S., Duan, Y. R., Cheng, J. Z., Hao, C., et al. (2023). Optimal placement and capacity sizing of energy storage systems via NSGA-II in active distribution network. Front. Energy Res. 10. doi:10.3389/fenrg.2022.1073194
Tang, Y. J., Fang, G. H., Tan, Q. F., WenLei, X. X. H., and Ding, Z. Y. (2020). Optimizing the sizes of wind and photovoltaic power plants integrated into a hydropower station based on power output complementarity. Energ Convers. Manage 206, 112465. doi:10.1016/j.enconman.2020.112465
Wei, D. H., Li, H. W., Ren, Y., Yao, X. H., Wang, L., and Jin, K. Y. (2022). Modeling of hydrogen production system for photovoltaic power generation and capacity optimization of energy storage system. Front. Energy Res. 10, 1004277. doi:10.3389/fenrg.2022.1004277
Wu, X. F., Yu, L., Wu, S. Q., Jia, B. Y., Dai, J. Y., Zhang, Y., et al. (2022). Trade-offs in the water-energy-ecosystem nexus for cascade hydropower systems: a case study of the Yalong River, China. Front. Environ. Sci. 10, 857340. doi:10.3389/fenvs.2022.857340
Zhang, H. X., Lu, Z. X., Hu, W., Yang, Y. T., Dong, L., and Zhang, J. T. (2019). Coordinated optimal operation of hydro-wind-solar integrated systems. Appl. Energy. 242, 883–896. doi:10.1016/j.apenergy.2019.03.064
Zhang, Y. S., Ma, C., Yang, Y., Pang, X. L., Liu, L., and Lian, J. J. (2021). Study on short-term optimal operation of cascade hydro-photovoltaic hybrid systems. Appl. Energy 291, 116828. doi:10.1016/J.APENERGY.2021.116828
Keywords: hydropower, PV, hydro-photovoltaic complementary, NSGA-II, guaranteed output, typical year
Citation: He B, Yin W, Liang G and Jiang L (2024) Research on hydro-photovoltaic complementary analysis of Yangfanggou hydropower station on Yalong River. Front. Energy Res. 12:1361214. doi: 10.3389/fenrg.2024.1361214
Received: 25 December 2023; Accepted: 19 February 2024;
Published: 06 March 2024.
Edited by:
Hong Xian Li, Deakin University, AustraliaReviewed by:
Mojtaba Nedaei, University of Padua, ItalyYilong Jia, Western Sydney University, Australia
Copyright © 2024 He, Yin, Liang and Jiang. This is an open-access article distributed under the terms of the Creative Commons Attribution License (CC BY). The use, distribution or reproduction in other forums is permitted, provided the original author(s) and the copyright owner(s) are credited and that the original publication in this journal is cited, in accordance with accepted academic practice. No use, distribution or reproduction is permitted which does not comply with these terms.
*Correspondence: Guohua Liang, Z2hsaWFuZ0BkbHV0LmVkdS5jbg==