 Hao Yan
 Tengzhou Xie
 Jian Li1
- 1School of Mechanical Engineering, Hefei University of Technology, Hefei, China
- 2Intelligent Manufacturing Institute of HFUT, Hefei, China
Hydrofoil, as the basic shape of the fluid blade, is widely used in fluid transport and energy conversion. However, friction resistance and pressure differential resistance are generated in the hydrofoil flow process, resulting in substantial energy consumption and negatively affecting the economy. On this basis, we propose two drag-reducing structures based on Clark-Y hydrofoil. In the design process of the jet structure, we considered the bionic jet velocity, jet angle and jet structure position as the design parameters and obtained the optimal jet structure by using Taguchi method. Finally, the two schemes (Clark-Yori and Clark-Yopt) are numerically simulated using large eddy simulation. Results show that when Ujet = 1.44 m/s, θ = 3° and x = 18.6 mm, the jet structure can play a significant drag reduction effect. Compared with Clark-Yori, the drag coefficient of Clark-Yopt is reduced by 26.5%, and the lift drag ratio is increased by 16.4%. Compared with Clark-Yori, Clark-Yopt can reduce the wall shear stress of the leading edge of the hydrofoil, thereby diminishing the frictional resistance. Meanwhile, the jet structure can effectively balance the area of the low-pressure region on the suction side of the hydrofoil, significantly reducing the pressure differential resistance. Clark-Yopt can accelerate the vortex collapse that decreases turbulence intensity and turbulence resistance. Moreover, it can effectively block the near-wall reflux of hydrofoil and reduce the internal friction between the reflux and the main flow.
1 Introduction
Hydrofoil, as the basic shape of the fluid blade, plays an important role in the fluid transport and energy conversion and is mostly used in shipping and navigation vehicles and other fields (Lv et al., 2013; Shen et al., 2022; Liu et al., 2023). When the ship or vehicle moves forward, the fluid passing around the hydrofoil produces resistance, such as friction resistance and pressure differential resistance, which is extremely unstable. As a result, energy consumption increases and the navigation economy declines. An in-depth investigation shows that because of the instability of the flow, where the flow transitions from layer to turbulent flow, the velocity gradient between the fluids increases, exhibiting frictional resistance, differential pressure resistance and other resistance. The wall surface with hydrophobic characteristics causes the turbulent boundary layer to slip and reduce Reynolds stress, thereby diminishing turbulence and reducing drag (Nowrouz Mohammad et al., 2012; Nowrouz Mohammad et al., 2013). Injecting air into the turbulent boundary layer to form an air layer also affects the near-wall turbulent structure and inhibits Reynolds stress, achieving a better drag reduction effect (Park et al., 2015; Feng Yan-Yan et al., 2020; Zhang et al., 2021). The effective suppression of various drags caused by turbulence has important research significance in solving engineering application problems. Therefore, the research on optimising drag reduction performance is urgent.
Bionics, as a subject of studying the law of biological evolution to obtain technical methods to solve practical engineering problems, has been the focus of researchers in recent years, and some achievements have been made in the exploration process. Fish has evolved on the earth for hundreds of millions of years and is the most widely distributed aquatic organism. The fish scale structure, as the most common component structure, has shown excellent drag reduction performance and is a natural non-smooth drag reduction structure (Dou et al., 2012; Muthuramalingam et al., 2019; Muthuramalingam et al., 2020; Wang et al., 2021; Ganesh Natarajan and Bruce Ralphin Rose, 2022). Therefore, the fish scale structure has unique research potential in the field of bionic drag reduction. Muthukumar et al. (Muthuramalingam et al., 2019; Muthuramalingam et al., 2020) conducted a geometric reconstruction of the topological structure of the European perch scale surface on a plate and performed numerical and experimental flow simulations. They found staggered velocity stripes with a velocity difference of approximately 9% on the fish scale array surface, indicating that the existence of the fish scale array resulted in stable low and high-speed stripes. These regularly arranged fringe structures can inhibit the transition of layers to turbulent flow. In a follow-up study, they found that the fish scale array has a delay effect of approximately 55% on the TS wave, further proving its drag reduction performance. They pointed out that the theoretical drag reduction effect can reach 27%. Ganesh Natarajan S et al. (Ganesh Natarajan and Bruce Ralphin Rose, 2022) examined the drag reduction effect at various angles of attack at a specific Reynolds number by using 3D-printed bionic fish scale film pasted on NACA0021. They achieved the maximum drag reduction rate of 9.57% at 0° angle of attack and pointed out that the angle of attack for the best drag reduction performance is between 0° and 10°. Their analysis revealed that the fish scale structure reduces the shear stress of the aerofoil wall, resulting in drag reduction. Dou et al., 2012 analysed the surface microstructure of fish scales and found micron-scale caves on the surface. The results showed that under low-pressure conditions, due to flow separation and eddy current, the gas phase was generated at the solid–liquid surface, and part of the solid–liquid shear force was replaced by gas–liquid shear force, thereby reducing the friction resistance. Wang et al., 2021 studied the microscopic morphology of Sciaenops ocellatus and the arrangement of fish scales and then prepared biomimetic fish scale surfaces with hydrophobic properties using laser processing. Compared with an aluminium alloy surface, the drag reduction rate of biomimetic fish scale surface under laminar flow conditions can reach 4.814%. They pointed out that drag reduction performance decreases gradually as the transition from layer to turbulent flow occurs.
In addition to the exploration of the bionic fish scale drag reduction structure, the researchers proposed another drag reduction idea, namely, jet drag reduction. Yunqing Gu et al. (Gu et al., 2014) proposed a biomimetic jet surface based on shark gills. A frictional torque test was carried out on the smooth surface and biomimetic jet surface through a torque signal coupler at different rotational speeds, and the results showed that the biomimetic jet surface could thicken the viscous bottom and reduce the shear stress on the wall, as well as the frictional resistance. When Li et al., 2017 studied the jet surface model of the bionic shark’s gills, they found that a smaller jet angle is preferred when the velocity ratio remains unchanged. When the jet angle is fixed, a greater flow rate ratio indicates better drag reduction effect. In addition, they proposed that the bionic jet changes the flow structure of the turbulent boundary layer, increases the thickness of the viscous bottom layer and reduces the normal velocity gradient of the wall, thereby decreasing the friction resistance. Chen et al., 2021 studied the influence mechanism of jet on flow resistance through the structure of shark gill jet. The results showed that jets can reduce the boundary layer on the surface of objects, producing a drag-reduction effect. The drag reduction effect is improved with the increase in jet velocity, and the curved nozzle is more conducive to reducing drag. Bedri et al. (Yagiz et al., 2012) used a flow control device to study the feasibility of a 2D profile bump and an independent jet actuator. They also explored a hybrid control that integrates the two elements to mitigate the shock wave and thus minimize wave resistance during transonic flight conditions. The results showed that after optimising the relevant design parameters, the total resistance was reduced by 3.94% and the lift was increased by 5.03%. Shen et al., 2018 studied drag reduction efficiency and heat flow reduction efficiency of unit mass reverse jet. The results showed that under the pre-treatment requirements of reducing drag and heat flow, the reduction efficiency of drag and heat flow can be improved by optimising jet temperature and pressure, which is conducive to saving occupied space, reducing system weight and promoting vehicle loading. Kim et al., 2020 studied the drag reduction parameters of countercurrent jet in supersonic flow through numerical simulation. The results showed that amongst the five relevant parameters, jet mass flow is the dominant factor in drag reduction and transition of countercurrent jet, and the nozzle size has little influence on drag reduction. In addition, under high-temperature conditions, an appropriate trade-off between each parameter is crucial to obtain the maximum drag reduction rate. The methods of biomimetic fish scale and jet drag reduction are both effective in drag reduction. Organically combining these approaches can achieve a more effective hybrid drag reduction structure.
Taguchi method, as an orthogonal experimental design algorithm, can obtain the optimal parameter combination with the least number of experiments and the lowest cost under the action of multiple parameters. Li et al. (Yan et al., 2022) obtained the optimal active jet structure through the Taguchi design of three parameters, namely, jet position, jet ratio and angle between jet and aerofoil surface, reducing the cavitation volume of the aerofoil to only 29.95% of the original aerofoil. Wang et al. (Wang et al., 2021a; Wang et al., 2021b) carried out the Taguchi design of the fluidised bed gas chamber and the airway and conducted numerical and experimental analyses to obtain the parameter combination with the lowest powder discharge residual rate and the best velocity distribution uniformity. Bai et al., 2022 carried out Taguchi design on eight parameters of the impeller meridian profile of the submersible electric pump, resulting in a 3.5% increase in head and a 6.1% increase in efficiency after model optimisation. Feng et al. (Feng Guozeng et al., 2020) used the Taguchi method to analyse the influence of three channel parameters of the air distributor on the drag coefficient, and the difference between the predicted results and the simulated results was 4.9%, providing a performance reference for the local manufacturing and early development of the air distributor. Kotcioglu et al., 2013 designed Taguchi experiments on six design parameters of the heat exchanger, including the ratio of duct width to height, the ratio of winglet length to duct length, winglet angle, Reynolds number, flow rate and pressure drop. They also optimised the heat exchanger to obtain the minimum pressure drop and maximum heat transfer.
In summary, bionic fish scale drag reduction and jet drag reduction are effective methods. If the two can be organically combined, then an improved hybrid drag reduction structure can be obtained. On this basis, Clark-Y hydrofoil is considered the research object, and different types of drag reduction structures are proposed: intermittent bionic fish scale structure, bionic fish gill jet structure and bionic fish scale hybrid drag reduction structure. The former is considered the basic structure, and we replaced the fish scale drag reduction structure of the front edge of the hydrofoil with a jet structure. Then, we obtained the optimal combination of jet parameters through the Taguchi method to achieve the optimal hybrid drag reduction structure. Finally, a large eddy simulation was used to analyse the influence of the two drag reduction structures on the drag reduction of the hydrofoil. This study aims to provide a reference for further research on drag reduction.
2 Model building and numerical calculation
2.1 Design of fish scale drag reduction structure
The current research literature indicates that fish scale structure has great potential for fluid drag reduction. As shown in Figure 1, the fish scale samples were obtained from crucian carp, Bream, and perch obtained from the market. These three types of freshwater fish are widely distributed and easily obtained, and their scale sizes and distribution densities are relatively different. Such differences are necessary for the study of the macroscopic size of fish scales. In the process of fish scale sampling, the lateral scale of each fish was considered the central sampling line (Position3), and two sampling lines were obtained equidistant from the upper and lower sides. On each sampling line, five fish scales were obtained equidistant from the gills to the tail, and the surface of the sample was cleaned with ethanol solution. To standardize the sample size, a dimensionless approach is adopted, wherein the aspect ratio (L/D) is used as the size reference (Ganesh Natarajan and Bruce Ralphin Rose, 2022). In this study, the length–diameter ratio of samples on each sampling line was averaged, as shown in Figure 1D. After averaging, the length–diameter ratio of the samples on each sampling line was statistically sorted out, and the average length–diameter ratio obtained from all sampling lines was averaged again, until the average length–diameter ratio of all samples was finally obtained, that is, L/D = 1.165. Therefore, the diameter of the circular section of the fish scale was set to D = 6.00 mm in this study, and the length is L = 6.99 mm. As shown in Figure 1E, the suction side of the hydrofoil (with a string length of 56 mm) is divided into three drag reduction regions (drr1, drr2, drr3), in which drr1 is between the dividing line L1 and L2, drr2 is between L2 and L3, and drr3 is between L3 and the tail edge of the hydrofoil. Moreover, the dividing line L1 is 3 mm from the leading edge of the hydrofoil. L2 is 18.60 mm from the front of the hydrofoil, and L3 is 37.20 mm from the front of the hydrofoil. The distance between the fish scale structure (total length 11.50 mm) in each drag reduction area and the dividing line was l1,l2, and l3, respectively, where l1 = 0.96 mm, l2 = 1.51 mm and l3 = 6.66 mm. The overlapping size of the adjacent fish scales O = 2 mm, and the thickness of each fish scale h = 0.36 mm.
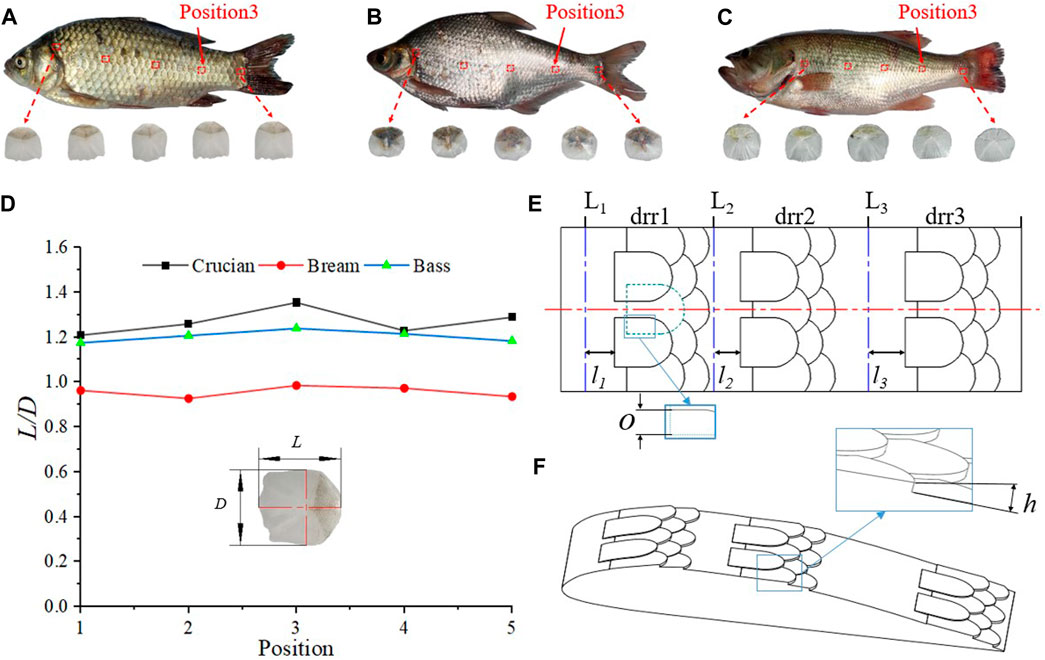
Figure 1. Intermittent fish scale drag reduction structure (A) Crucian; (B) Bream; (C) Bass; (D) length-to-diameter ratio (L/D) of fish scale samples; (E) 2D diagrams; (F) 3D diagram.
2.2 Acquisition of bionic jet parameters
We obtain the relevant parameters of the gill jet by using pigments that are more distinguished from water and observing the process of their outward diffusion through the gills with a high-speed camera. The fish have a relatively short respiratory cycle; thus, we set the fps of the high-speed camera to 300 frames to obtain a complete gill jet cycle, as shown in Figure 2F of the high-speed camera placement. Figure 2E shows the entire cycle of gill respiration and pigment diffusion. We measured the pigment diffusion speed with one gill breath as a cycle and obtained the gill jet velocity of three types of fish through multiple measurements and averaging, as shown in Figure 2G. As shown in Figure 2E, the main body of pigment exhaled through the gills diffuses backward, but some pigments diffuse to the bottom of the gills. The pigment that diffuses to the bottom of the gills accumulates at the bottom because of the limited volume of the container, obtaining inaccurate result. Figure 2G shows that the pigment speed exhaled through fish gills increases continuously at the initial stage, reaching a peak value at approximately 5/12T, and then the pigment continues to diffuse whilst the speed decreases continuously. The initial diffusion speed of pigment continues to increase because the exhalation stage of fish lasts for a while.
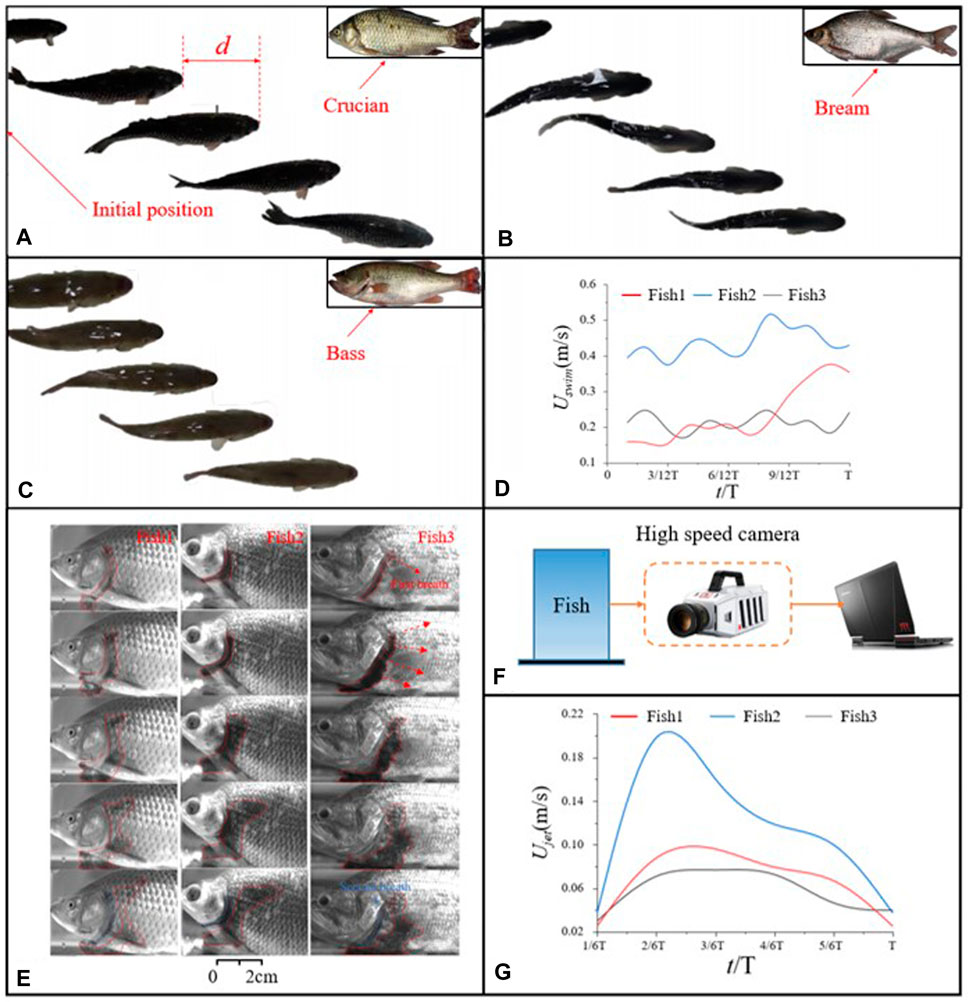
Figure 2. Fish swimming in a cycle: (A) Crucian; (B) Bream; (C) Bass; (D) Swimming speed of the three fish, (E) Breathing cycles of the three fish species; (F) Schematic obtained using high-speed photography cameras; (G) acquired gill jet velocity; To obtain the jet parameters formed by the gills breathing, we initially measured the swimming under normal conditions, determined the range that could be photographed by the camera as a period and measured the speed of the fish in a period based on the position of the fish head. (A), (B) and (C) show the swimming process of the three fish types in a cycle. To obtain more accurate data, we have carried out multiple measurements for each fish type, using the average value of the measured results as the data to draw the swimming speed changes of fish in a cycle, as shown in (D).
To obtain the bionic jet parameters, we define the jet scale: Sjet = Ujet/Uswim, where Uswim takes the average value of the whole period. Ujet takes the average value of the intermediate time region because of the large error between the initial and the end of the gill jet, and the Sjet of the three fish is finally calculated as 0.30, 0.32, and 0.29; thus, 0.29≤Sjet≤0.32.
2.3 Experimental design of Taguchi algorithm
In our previous research, the bionic jet structure played a significant role in inhibiting cavitation. We also analysed its lift resistance characteristics, and found that it has excellent effects in reducing drag (Yan et al., 2022). In the study of fish scale drag reduction, we found that at low speeds, the drag reduction effect of fish scale during the flow around hydrofoil is considerable. This condition is caused by the fish scale structure that can effectively inhibit the reflux near the wall of the hydrofoil and transform the fluid flow state into laminar flow, greatly reducing the turbulent resistance. However, with the increase in flow velocity, the fluid cannot easily maintain a laminar flow state. Thus, transition to a turbulent state is achieved. On this basis, we change the drr1 drag-reducing structure of the new intermittent fish-scale structure into a bionic jet structure, so that the two can be organically combined to obtain a hydrofoil with excellent drag-reducing performance at high speed.
As shown in Figure 3, in the bionic jet structure, jet velocity, jet angle and starting position are important dimension parameters. In Section 2.2, we measured that the ratio of the bionic jet is 0.29≤Sjet≤0.32, whereas the mainstream velocity is U∞ = 4.5 m/s. Therefore, the swimming velocity of fish is similar to the mainstream velocity of hydrofoil. The jet velocity of fish gills is similar to that of biomimetic jets, so the range of biomimetic jet velocity obtained after similarity transformation is 1.305 m/s ≤ Ujet≤1.440 m/s. Our previous research on drag reduction of fish scale structure indicated that the distance between the farthest return of hydrofoil near the wall and the leading edge of hydrofoil was 16.8 mm ≤ x ≤ 18.6 mm (where the chord length of hydrofoil C = 56 mm), and the backflow was mostly concentrated in the range of 9° outside the suction side based on the tangent line of hydrofoil near the wall. Therefore, our jet slot was considered the normal line. The angle of counterclockwise rotation is considered the jet angle. Thus, 0°≤θ ≤ 9°, where the jet slit width d = 0.005 C = 0.28 mm (Yan et al., 2022). Therefore, to seek the best jet structure arrangement scheme, based on the above studies, the jet velocity Ujet, jet angle θ and starting position x are considered the control factors, and the hydrofoil lift drag ratio k and drag coefficient Cd are considered the response factors. Moreover, different contribution degrees of each control factor to the response factors are obtained by Taguchi method. On this basis, the optimal design parameter combination is selected. In this study, four-level values with equal spacing are selected for the three control factors within an appropriate range. The selected control factors and their specific level values are shown in Table 1. By analysing the influence of these control factors on the response factors after the combination of different level values, the different contribution degrees of each control factor to the response factors can be obtained, and the optimal parameter combination can be selected.
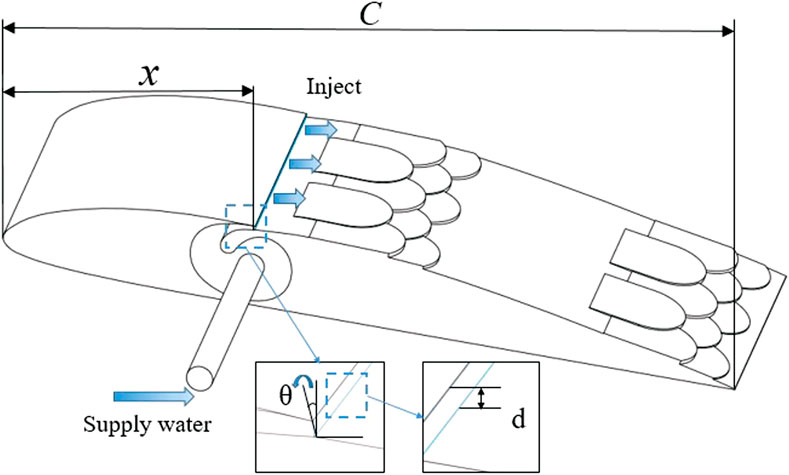
Figure 3. Bionic jet structure.
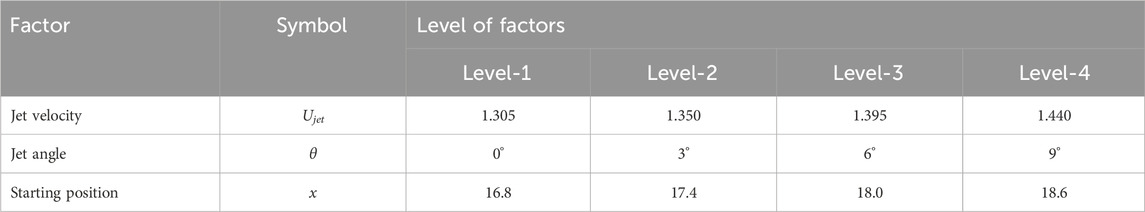
Table 1. Factors and levels selected to be analysed.
The traditional three-factor and four-level experiments require 64 trials to enable the different factors to fully influence the results. This condition is evidently a tremendous test workload. Therefore, the Taguchi method provides an orthogonal array table, and only 16 tests are required to obtain the influence of each factor for three factors and four levels, greatly improving the test efficiency, as shown in Table 2.

Table 2. Standard L16 OA with factors and level.
2.4 Numerical calculation
2.4.1 Boundary conditions and governing equations
ANSYS Fluent software based on the finite volume method is often used for simulation analysis. The calculation area is shown in Figure 4. The total length of the fluid domain is 14°C, the width is 3.4°C, and the spanwise span is 0.36°C. The total length of the body of influence (boi) region is 1.75°C, the width is 0.5°C, and the distance velocity inlet of the hydrofoil front is 5 C. In this study, the attack angle of the aerofoil is 8°, the inlet velocity is 4.5 m/s, and the outlet is set as the pressure outlet, corresponding to the cavitation number of 0.8. The SIMPLE algorithm is used to solve the coupling of the velocity field and pressure field. The diffusion term is interpolated by the least square method, the convection term is discretised by a bounded central difference scheme, and the turbulent transport equation and some scalar equations are discretised by second-order upwind.
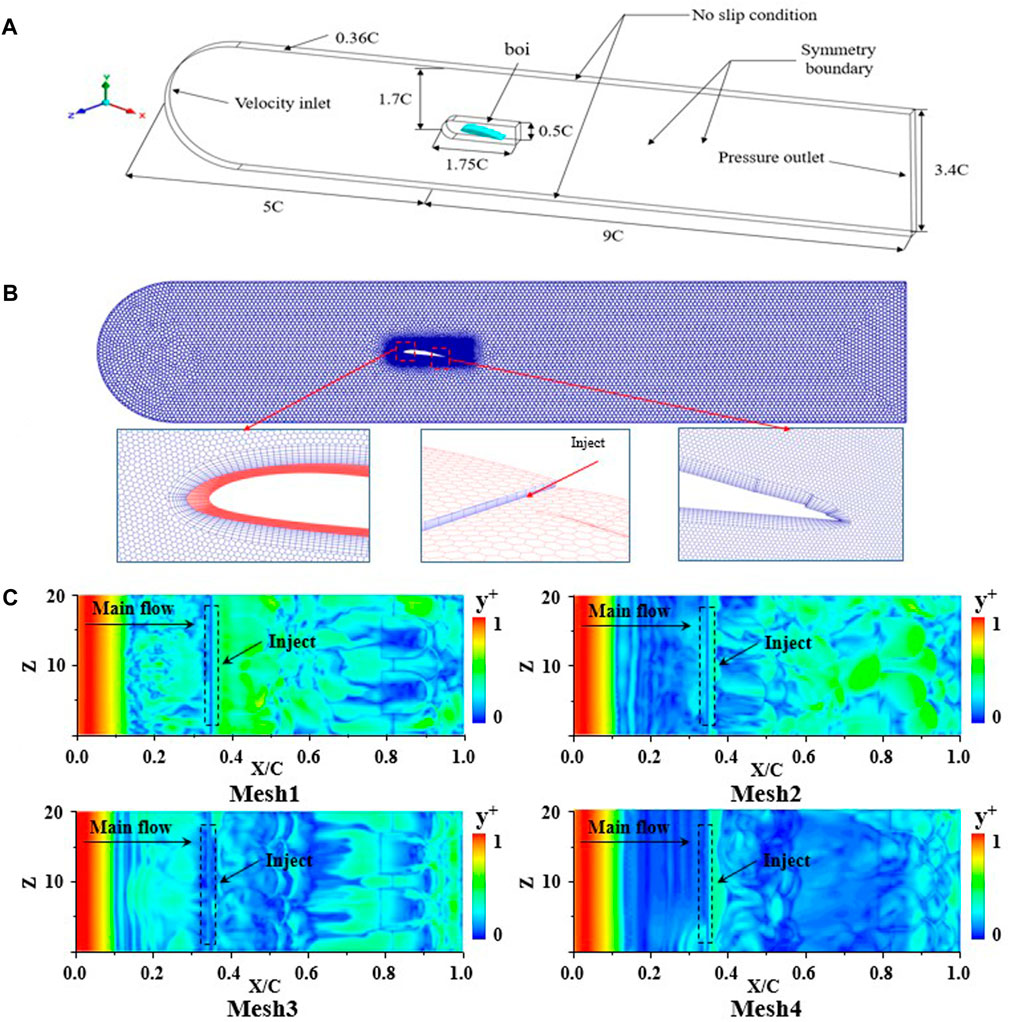
Figure 4. (A) Computation area; (B) Meshing; (C) y+ at four grid scales.
2.4.2 Numerical method
In the study, we used LES to assay the surrounding fluid state of the hydrofoil. In LES, large-scale turbulence was directly solved using a low-pass filter, and small-scale turbulence was processed by subgrid-scale (SGS) (Yan et al., 2022). The relevant continuity and momentum equations are as follows:
where p is the pressure of the compound, ui is the velocity component, and μc and ρc represent the viscosity and density of the compound, respectively. LES is a simulation technique that resolves the large-scale turbulent structures whilst modelling the smaller scales. Eqs 1, 2 are usually separated into two sections: subgrid-scale (SGS) and grid-scale (GS), which are computed using Favre filtering. The calculation results are shown in equation 3, 4:
The stress tensor τij of SGS is expressed as follows:
τij in Eq. 5 needs to be modelled. Eddy current or subgrid viscosity μs is commonly used in subgrid modelling and can be computed using various technical methods. In the eddy viscosity model, these variables are represented in Equation 6, 7:
2.4.3 Grid division and grid independence verification
When the fluid domain involves relatively complex structures, unstructured meshing can also satisfy the simulation requirements. Therefore, in this study, we used Fluent meshing, and we sequentially encrypted the boi region and ensured that y+ was less than 1 to verify grid independence. Under the premise that the maximum size of the global mesh is 5 mm, the local maximum mesh size of the boi region is set to 0.30, 0.25, 0.20, and 0.15 mm, and the mesh is gradually encrypted in turn. At the same time, the boundary layer mesh is set as follows: the height of the first layer mesh is set to 0.10 mm, the number of layers is set to 8, and the generation method is uniform.
In this study, one of the drag reduction schemes (Ujet = 1.44 m/s, θ = 3°, x = 18.6 mm) is considered, and the average lift coefficient Cl and average drag coefficient Cd are used as the evaluation criteria to verify the grid independence. The relevant definitions are as follows: Cl=Fl/(0.5
As shown in Table 3, the comparison of Cl and Cd of the underwater wing of the four mesh scales shows that the coefficient values change with the increase in the number of grids, but the amplitude of change is different from the former. The change rates of Cl between adjacent grids are 0.8%, 0.1% and 0.1%, and the change rates of Cd are 1.58%, 0.7%, and 0.7%. At the same time, as shown in Figure 4C, y+ decreases with the increase in the number of grids, and y+ can be less than 1 under the four grid scales. By comprehensive comparison, the fluctuation amplitude of Cl, Cd and y+ of the Mesh4 scheme are relatively smaller. Thus, the influence of mesh4 mesh scale on the calculation results can be ignored, and it can accurately predict the flow state of fluid and the lift resistance characteristics of hydrofoil.
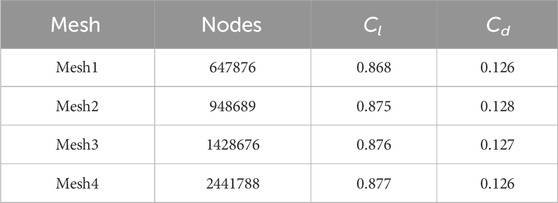
Table 3. Comparison of Cl and Cd of four grid types.
2.4.4 Verification of numerical methods
The chord length and span of the aerofoil used in this study are different from the data in the public literature. Thus, the dimension parameters used in the numerical method verification are the same as those in the references, that is, the chord length of the aerofoil is 70 mm and the span is 21 mm. The proposed numerical method verifies that the Clark-Y hydrofoil is selected for numerical simulation under the condition of an 8° angle of attack and 10 m/s mainstream velocity. On the basis of the Reynolds number of chord length at 7 × 10⁵, cavitation number at 0.8 and cavitation model at Sauer model, we adopt the same boundary conditions as the references. The Cl obtained by simulation is compared with Cd. As shown in Table 4, the data are Cl and Cd after a similar transformation between the published literature and the numerical results in this study. Compared with the experimental results of Wang (Wang et al., 2001) and the numerical simulation results of Yan (Yan et al., 2020; Yan et al., 2021) and Li (Yan et al., 2022), the Cl errors are 0.7%, 1.7% and 1.9%, and the Cd errors are as follows: 0.8%, 6%, and 7.5%. The coefficient error of the numerical simulation results can be controlled to 8% when compared with the experimental results or the published data, verifying the accuracy of the proposed numerical method and the reliability of the grid division.
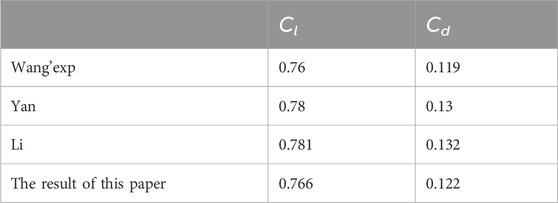
Table 4. Lift coefficients and drag coefficients of Clark-Y.
3 Result analysis of Taguchi algorithm
3.1 Analysis of signal-to-noise ratio
In Taguchi’s algorithm, the signal-to-noise ratio (S/N) refers to the power ratio of signal to noise. It is generally divided into three signal-to-noise ratios, namely, large-the-better (LTB), small-the-better (STB) and nominal-the-better (NTB) (Wang et al., 2021a; Wang et al., 2021b), whose definition formulas are shown as Equation 8, 9, 10:
For the two responses in this study, a higher lift–drag ratio is preferred. Thus, the signal-to-noise ratio with high hope characteristics is selected. A smaller drag coefficient achieves better performance, so the signal-to-noise ratio of the desired characteristic is selected. Through numerical simulation, the lift–drag ratio k and drag coefficient Cd of the aerofoil of each scheme are obtained, as shown in Table 5.
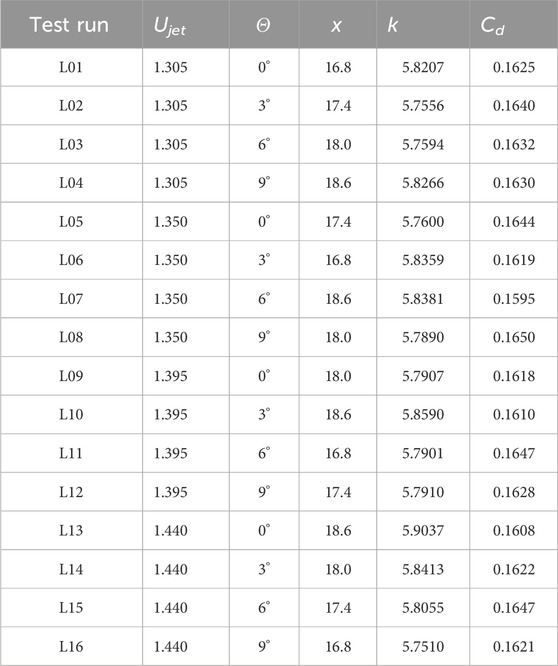
Table 5. Results of the response variable.
Based on the numerical calculation results of each scheme k and Cd in Table 5, the SNR response of each factor level is calculated, as shown in Tables 6, 7, where Delta is the difference between the maximum and minimum S/N ratio average response of each factor. A greater Delta value indicates greater contribution of the corresponding factor to the SNR response, and vice versa. As shown in Table 6, when the SNR response is k, factor x (Delta = 0.12, Rank = 1) contributes the most to the SNR response, and factor Ujet (Delta = 0.05, Rank = 2) and factor θ(Delta = 0.05, Rank = 3) contribute the least. When the SNR response is Cd, in Table 7, factor x (Delta = 0.16, Rank = 1) contributes the most to the SNR response, and factor θ(Delta = 0.05, Rank = 2) and factor Ujet (Delta = 0.04, Rank = 3) contribute the least.

Table 6. Response table for signal-to-noise Ratios(k).
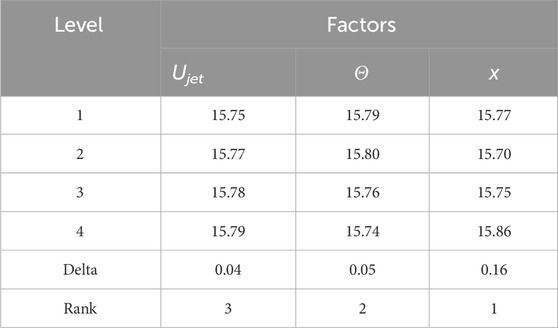
Table 7. Response table for signal-to-noise ratios (Cd).
3.2 Main effect diagram analysis
The analysis results indicate that each control factor has a different contribution degree to the response factor, that is, a major factor affects the response, referred to as the main effect. A larger slope of the curve indicates a more evident main effect. In the main effect diagram of k, as shown in Figure 5A, factor x has the largest main effect value, followed by factor Ujet and θ. In the main effect diagram of Cd, as shown in Figure 5B, factor x has the largest main effect value, followed by factor θ, and factor Ujet has the smallest main effect value. The analysis of the main effect diagram of k and Cd indicates that the position of the jet structure greatly influences the variation of the lift–drag ratio and drag coefficient of the hydrofoil, and the drag reduction performance of the hydrofoil can be optimised when the maximum lift–drag ratio is obtained.
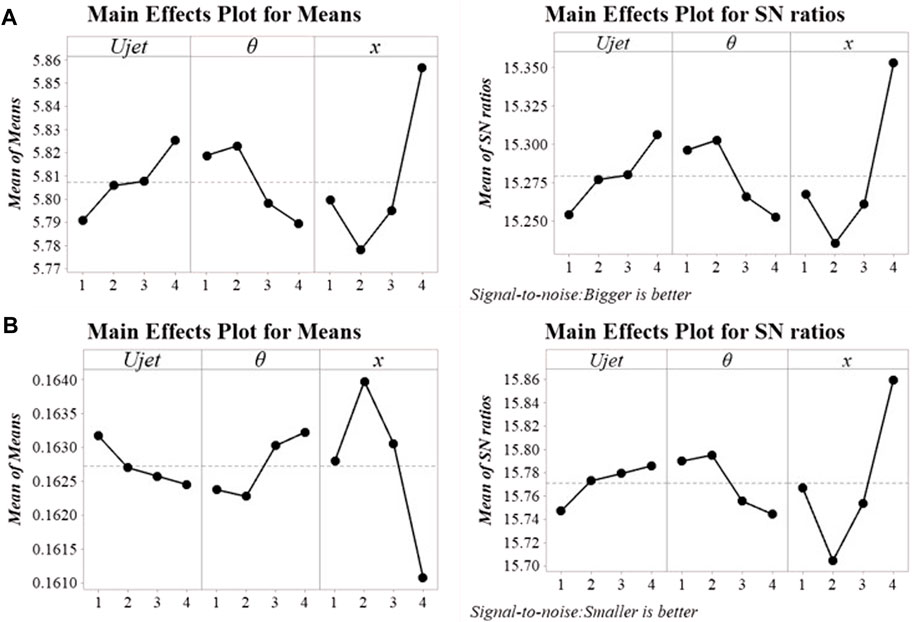
Figure 5. (A) Main effect diagram of signal-to-noise ratio and mean of k; (B) Main effect diagram of signal-to-noise ratio and mean of Cd.
4 Result analysis
The above analysis illustrates that when Ujet = 1.44 m/s, θ = 3°, and x = 18.6 mm, the lift–drag ratio of hydrofoil is the largest and the drag coefficient is the smallest. To study and verify the lift resistance characteristics under the optimal combination of factors, we perform transient analysis on the original scheme (Clark-Yori) and the optimal scheme with jet structure (Clark-Yopt), as follows:
4.1 Lift resistance characteristic analysis
As shown in Figure 6 and Table 8, in terms of the transient change of lift coefficient, Clark-Yopt is lower than Clark-Yori most of the time because the low-pressure area on the suction side of Clark-Yopt is reduced after the addition of jet structure, thereby weakening the hydrofoil lift, which is reflected in the average result. The lift coefficient of Clark-Yopt decreased by 12.2%. The drag coefficient of Clark-Yopt is lower than that of Clark-Yori during most of the transient changes, because the jet structure can block the return flow near the wall of the hydrofoil to reduce the friction resistance. In addition, the reduction of the low-pressure area minimises the pressure differential resistance, which is reflected in the average result. The drag coefficient of Clark-Yopt decreased by 26.5%. The lift–drag ratio of Clark-Yopt is superior to that of Clark-Yori most of the time. Thus, Clark-Yopt obtains better hydraulic characteristics, reflecting the average result. The lift–drag ratio of Clark-Yopt increases by 16.4%.
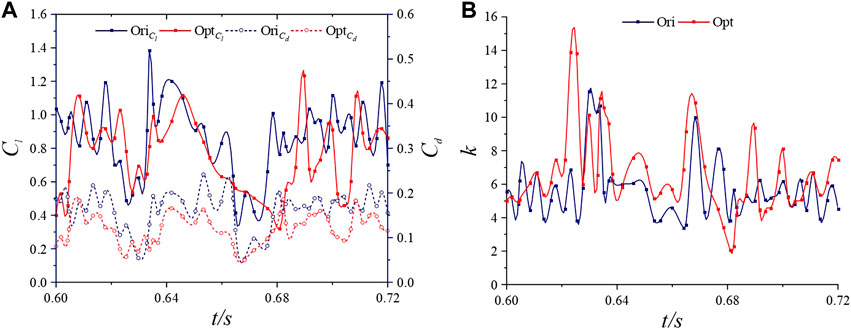
Figure 6. Variation curves of Cl, Cd, and k of Clark-Yori and Clark-Yopt over a while: (A) Cl and Cd; (B) k.
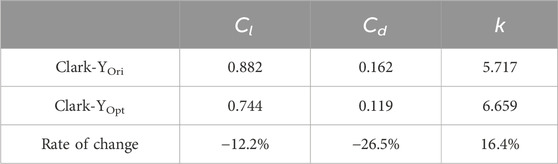
Table 8. Comparison of Cl, Cd and k averages of Clark-Yori and Clark-Yopt schemes in the same period.
Although the lift of Clark-Yopt is decreased, its drag is greatly reduced, and the lift–drag ratio is increased to a certain extent. These findings indicate that the addition of jet structure can reduce the drag and increase the lift–drag ratio, verifying the reliability of Taguchi’s method.
4.2 Analysis of friction resistance and shear stress
As shown in Figure 7, the transient change in the friction-resistance coefficient, Clark-Yopt is lower than Clark-Yori in most of the same period, but it also increases in part of the time, which is reflected in the average result. Its frictional resistance coefficient is reduced by only 5.4%.
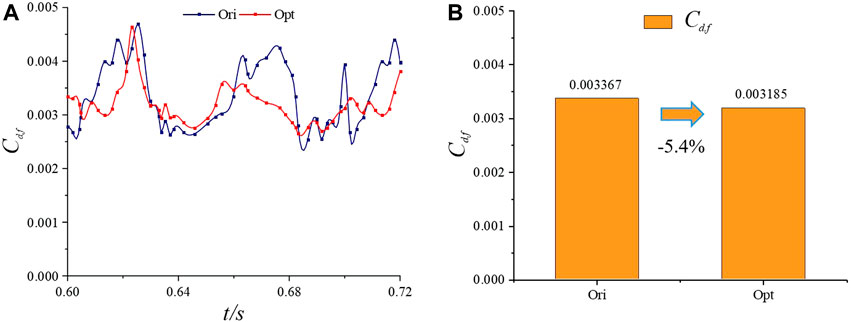
Figure 7. Friction resistance coefficient Cd,f of Clark-Yori and Clark-Yopt over a while: (A) transient change curve; (B) averaging results and drag reduction over the same period.
As shown in Figure 8, to further analyse the frictional resistance, we studied the transient distribution of shear stress on the wall of the two hydrofoils. After comparative analysis, we obtained the following: Compared with Clark-Yori, the wall shear stress of Clark-Yopt increases relatively at 1/8t and gradually increases after the jet structure, indicating that the jet structure does not play a good drag reduction effect at 1/8 t. From 2/8 t to 3/8 t, the wall shear stress of Clark-Yopt decreases significantly, and the decrease is most remarkable near the jet structure. This finding is caused by the jet that blocks the return flow near the wall of the hydrofoil, resulting in a relatively average velocity distribution near the wall of the hydrofoil. Consequently, the friction resistance is reduced. At 4/8 t, the wall shear stress of Clark-Yopt has no significant change. The shear stress at the trailing edge of Clark-Yopt decreased significantly at 5/8 t. However, it did not change remarkably at 6/8 t, and increased at 7/8 t. At 8/8 t, the wall shear stress of Clark-Yopt decreases evidently, and this effect is mostly concentrated near the jet structure. It also decreases at the tail edge of the hydrofoil.
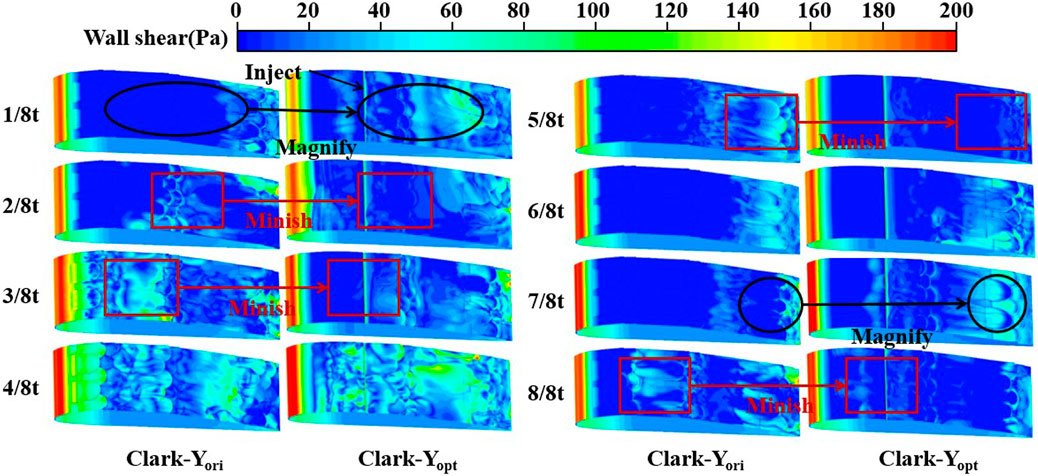
Figure 8. Transient shear stress distribution of Clark-Yori and Clark-Yopt over a while 4.3 Pressure differential resistance and pressure analysis.
In general, after the addition of a jet structure, the friction resistance of the hydrofoil is reduced to a certain extent, because the jet minimises the shear stress near the wall of the hydrofoil. However, the reduction of friction resistance does not play a good role in the early stage, and this drag reduction effect becomes increasingly important with the increase in time.
As shown in Figure 9, in terms of the transient change in pressure differential resistance coefficient, Clark-Yopt is significantly lower than Clark-Yori in most of the same period. However, it increases slightly in part of the time, which is reflected in the average result. The reduction in the pressure differential resistance coefficient reached 21.1%.
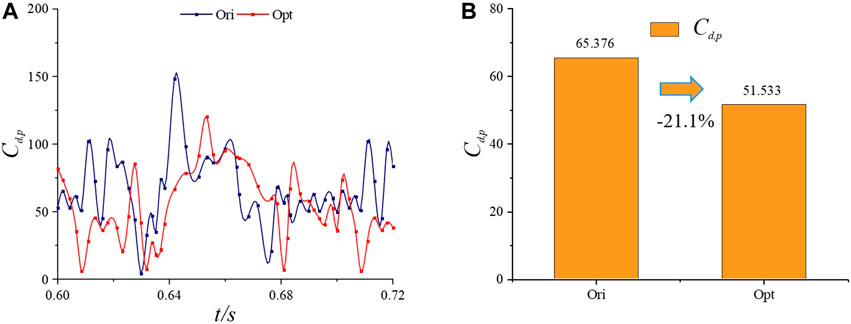
Figure 9. Pressure differential resistance coefficient Cd,p of Clark-Yori and Clark-Yopt over a while: (A) transient change curve; (B) averaging results and drag reduction over the same period.
As shown in Figures 10, 11, to further analyse the effect of fish scale structure on the reduction of pressure differential resistance, we examined the pressure coefficient and its transient changes under the two schemes, in which the pressure coefficient was defined as Cp = 2p/ρU∞2. As shown in Figure 10, results of analysis and comparison suggest that the fluctuation range of the pressure coefficient of Clark-Yopt is smaller than that of Clark-Yori. Such stable pressure change is important for the reduction of pressure differential resistance, indicating that the jet can balance the change in the low-pressure region to a certain extent. Figure 11 shows the high-pressure areas in front of the hydrofoil and low-pressure areas on the suction side. The distribution and size of the low-pressure area change with the flow of hydrofoil around, significantly affecting the pressure differential resistance. Specific analysis is as follows: compared with Clark-Yori, the low-pressure area at the trailing edge of Clark-Yopt increases from 1/8 t to 2/8 t, thereby increasing the pressure differential resistance of Clark-Yopt. At 3/8 t, the area of the low-pressure region on the suction side of Clark-Yopt decreases significantly because the jet structure reduces the area of the low-pressure region by supplementing the fluid to the low-pressure region. This effect continues until 5/8 t. At 6/8 t, the area of the low-pressure region of Clark-Yopt increases slightly, indicating that the drag reduction effect of the jet structure is weakened when the area of the low-pressure region is large. Until 7/8 t, the effect of jet structure on the area of the low-pressure region becomes evident. At 8/8 t, the low-pressure region on the suction side of Clark-Yopt is greatly reduced, effectively decreasing the pressure differential resistance.
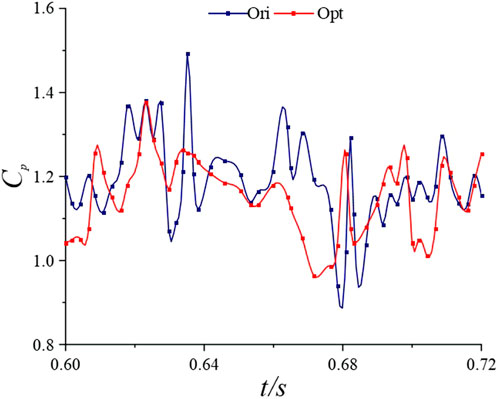
Figure 10. Average pressure coefficient Cp of Clark-Yori and Clark-Yopt over a duration.
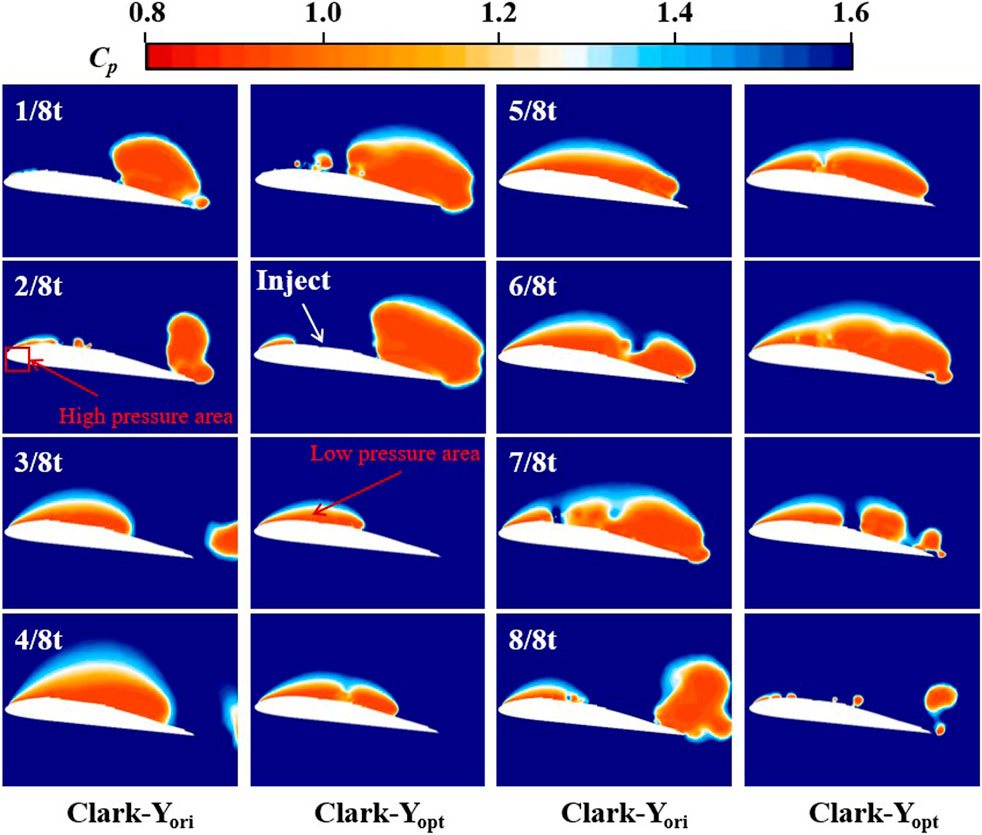
Figure 11. Distribution of transient pressure coefficients of Clark-Yori and Clark-Yopt over a duration.
In general, the jet structure remarkably affects the reduction of pressure differential resistance. The jet can effectively reduce the area of the low-pressure region, minimising the pressure differential resistance of the hydrofoil. However, when the area of the low-pressure region is large, the drag reduction effect of the jet structure is weakened to a certain extent.
4.3 Analysis of turbulence intensity
In addition to effectively minimising friction resistance and pressure differential resistance, the flow state of the fluid is important for drag reduction. It can effectively suppress turbulence, promoting a transition towards laminar flow state and further reducing resistance. On this basis, we further analyse the turbulence strength of the fluid, defined as follows:
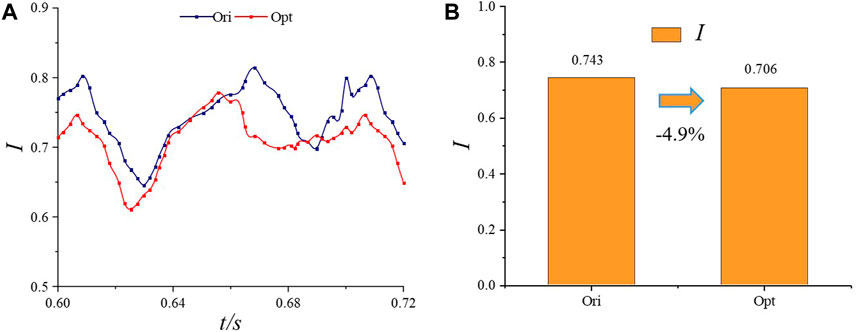
Figure 12. Turbulence intensity of Clark-Yori and Clark-Yopt over a duration I: (A) transient curve; (B) averaging results and reduction rates over the same period.
To further compare the turbulence intensity of the two schemes, the transient turbulence intensity distribution was analysed, as shown in Figure 13. Compared with Clark-Yori, the turbulence intensity distribution on the suction side of Clark-Yopt did not change significantly from 1/8 t to 2/8 t. The turbulence intensity on the suction side of Clark-Yopt did not decrease until 3/8 t, and the turbulence intensity near the jet structure decreased significantly. This inhibition effect on turbulence continued until 6/8 t, and at 5/8 t and 6/8 t, the turbulence intensity on the suction side of Clark-Yopt decreased significantly. This finding shows that the jet can effectively inhibit the further development of turbulence during the turbulent flow. At 7/8 t, the turbulence intensity at the trailing edge of Clark-Yopt increases slightly and does not decrease significantly until 8/8 t.
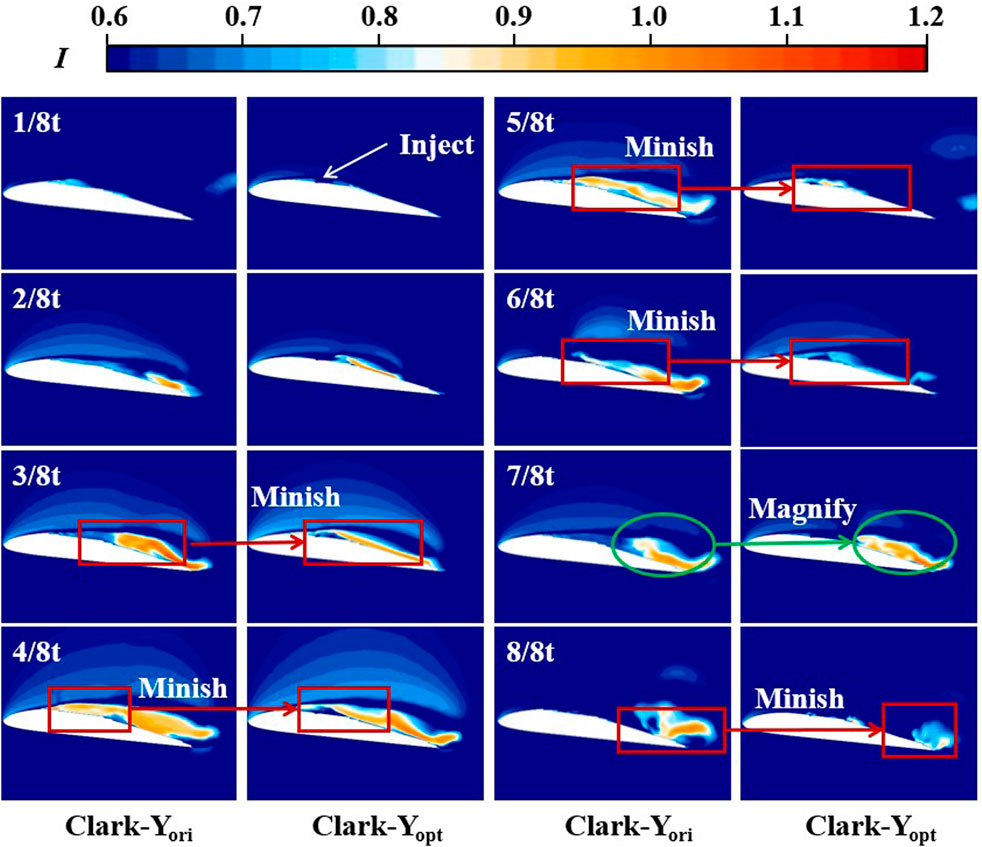
Figure 13. Transient turbulence intensity of Clark-Yori and Clark-Yopt over a duration I.
In general, the jet structure does not play an excellent role in inhibiting turbulence when it appears, but can effectively inhibit its further development. This approach is important for effectively reducing turbulence resistance.
4.4 Vorticity analysis
As shown in Figure 14, to further analyse how fish scale structure reduces turbulence intensity, the generation, development and shedding of vortices were further discussed under the Q criterion. The specific analysis is as follows: at 1/8 t, vortexes appear near the leading edge of the hydrofoil. Compared with Clark-Yori, the vortexes on the suction side of Clark-Yopt begin to collapse due to the jet structure. At 2/8 t, the vortexes on the suction side of Clark-Yopt begin to collapse in a large area, indicating that the jet accelerates the collapse of vortexes to suppress turbulence. From 3/8 t to 4/8 t, no significant change was observed between the two schemes, until 5/8 t when the vortex at the trailing edge of Clark-Yopt began to collapse in a large area. At 6/8 t, the vortex began to fall off towards the trailing edge, and the vortex near the jet structure of Clark-Yopt further collapsed. This accelerated collapse effect on the vortex lasted until 7/8 t. At 8/8 t, the vortices of the two schemes have fallen off near the trailing edge, but the vortices of Clark-Yopt are relatively small.
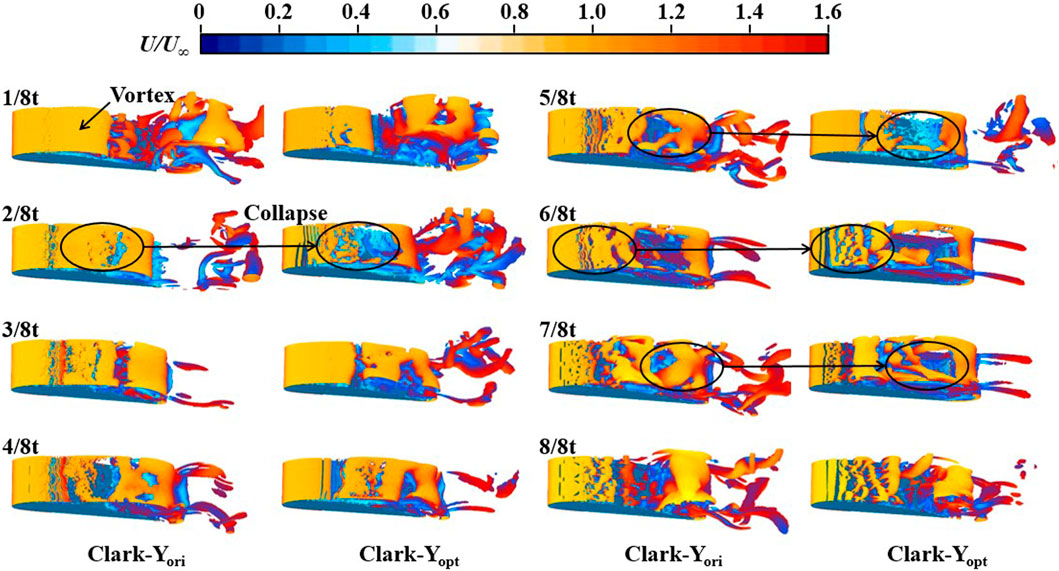
Figure 14. Transient vorticity distribution of Clark-Yori and Clark-Yopt over a duration (Q = 0.01).
In general, the jet structure accelerates the collapse of the vortex. This effect is evident in the vortex generation, and a more significant effect is observed on the development and shedding of the subsequent vortex. Consequently, the turbulence is inhibited and transformed into a laminar flow state to further reduce the turbulence resistance.
4.5 Speed analysis
Previously, we analysed that the fish scale structure can effectively reduce friction resistance, pressure differential resistance and turbulence resistance. To further observe the drag reduction effect, we further examined the velocity distribution around the hydrofoil. As shown in Figure 15, because Clark-Yopt has a jet drag-reducing structure, the velocity around its hydrofoil is relatively higher. It is reflected in the cloud image, namely, a larger high-speed mainstream area and a smaller low-speed reflux area. Moreover, a smaller low-speed reflux area indicates that the internal friction between the mainstream and reflux can be more effectively reduced. Specific analysis is as follows: compared with Clark-Yori, no significant difference in velocity distribution is observed between the two schemes at 1/8 t because no evident reflux exists on the hydrofoil near the wall at this time. Thus, the effect of jet structure on blocking reflux is weak. At 2/8 t, the near-wall reflux of hydrofoil begins to appear, at which time the jet structure of Clark-Yopt plays a role in blocking the reflux; it still has a certain blocking effect until 3/8 t. Therefore, the low-speed reflux area of Clark-Yopt is smaller than that of Clark-Yori. In addition, at 4/8 t, the reflux area reaches the maximum. When the reflux velocity is higher, the blocking effect of the jet structure becomes weakened. At 5/8 t, the low-speed return area of both schemes decreases relatively. However, the low-speed return area of Clark-Yopt is smaller. Until 8/8 t, the jet structure can effectively inhibit the internal friction between fluids and efficiently reduce the resistance.
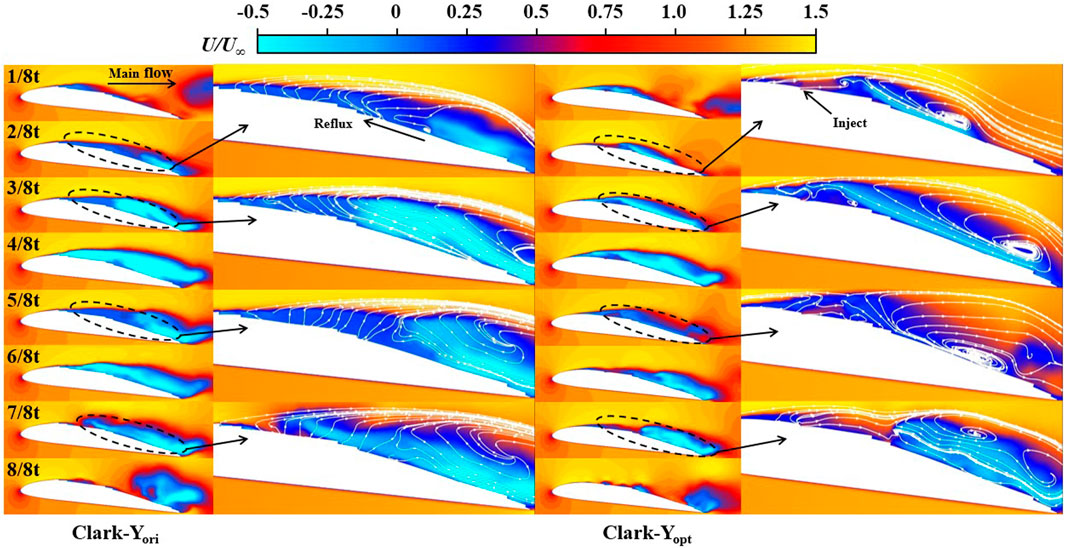
Figure 15. Transient velocity distribution of Clark-Yori and Clark-Yopt over a duration.
In general, the jet structure can inhibit the return flow near the wall and effectively reduce the internal friction resistance of the fluid. Therefore, the speed of the suction side of Clark-Yopt is relatively higher, confirming the reduction of various resistances analysed in the previous section.
5 Conclusion
On the basis of the intermittent fish scale drag reduction structure, a bionic jet drag reduction idea, which organically combined the fish scale drag reduction and jet drag reduction, is proposed. The results show the optimal parameter combination through the Taguchi algorithm, as follows: Ujet = 1.44 m/s, θ = 3° and x = 18.6 mm. The drag reduction effect of the two schemes was further analysed through large eddy simulation. The lift resistance characteristics, friction resistance and shear stress, pressure difference resistance and pressure distribution, turbulence intensity, vorticity distribution and velocity distribution were assessed, and the following conclusions were obtained:
(1) Compared with Clark-Yori, the lift force of Clark-Yopt is reduced, but it still has better drag reduction effect. Whilst reducing drag, the lift–drag ratio of hydrofoil is greatly increased and the hydraulic performance of hydrofoil is improved.
(2) The friction resistance analysis indicates that a jet can effectively reduce the shear stress of the hydrofoil wall, thereby diminishing the friction resistance. The analysis of pressure differential resistance also indicated that the pressure fluctuation on the suction side of Clark-Yopt with jet structure is relatively stable, which is important for the reduction in pressure differential resistance. Moreover, Clark-Yopt can effectively decrease the pressure difference between the leading edge and the tail edge of the hydrofoil, greatly minimising the pressure differential resistance. This drag reduction effect is relatively weakened.
(3) For the fluid flow state near the hydrofoil, the jet structure can effectively inhibit the occurrence of turbulence and transform the fluid into laminar flow state, reducing the turbulence resistance. Further analysis of the vorticity distribution on the suction side of the hydrofoil suggested that the jet structure accelerates the collapse of the vorticity to achieve turbulence suppression.
(4) The analysis of the velocity distribution around the hydrofoil indicated that the mainstream velocity of Clark-Yopt is higher and the area of the high-speed region is relatively larger. This condition is caused by the jet structure that blocks the reflux and greatly weakens the internal friction between the mainstream and the reflux, verifying the drag–reduction effect of the jet structure to a certain extent.
Author contributions
HY: Conceptualization, Formal Analysis, Methodology, Writing–review and editing. TX: Data curation, Funding acquisition, Software, Validation, Writing–original draft, Writing–review and editing. JL: Formal Analysis, Funding acquisition, Software, Supervision, Writing–review and editing. JF: Data curation, Funding acquisition, Investigation, Validation, Writing–original draft. XD: Data curation, Funding acquisition, Project administration, Software, Writing–original draft.
Funding
The author(s) declare that financial support was received for the research, authorship, and/or publication of this article. This work was supported by the Fundamental Research Funds for the Central Universities (NO: JZ2021HGTB0090), the University Synergy Innovation Program of Anhui Province under Grant No. GXXT-2019-004, the financial support provided by the National Natural Science Foundation of China (51806053).
Acknowledgments
The authors are grateful for the support of the National Natural Science Foundation of China.
Conflict of interest
The authors declare that the research was conducted in the absence of any commercial or financial relationships that could be construed as a potential conflict of interest.
Publisher’s note
All claims expressed in this article are solely those of the authors and do not necessarily represent those of their affiliated organizations, or those of the publisher, the editors and the reviewers. Any product that may be evaluated in this article, or claim that may be made by its manufacturer, is not guaranteed or endorsed by the publisher.
References
Bai, L., Yang, Y., Zhou, L., Li, Y., Xiao, Yu, and Shi, W. (2022). Optimal design and performance improvement of an electric submersible pump impeller based on Taguchi approach. Energy 252 (2022), 124032. doi:10.1016/j.energy.2022.124032
Chen, K., Wei, Z. G., Lin, Y. S., Zhao, X. F., Qi, X., Huang, C. H., et al. (2021). IOP conf. Series: earth and environmental science. IOP Conf. Ser. Earth Environ. Sci. 701, 012056. doi:10.1088/1755-1315/701/1/012056
Dou, Z., Wang, J., and Chen, D. (2012). Bionic research on fish scales for drag reduction. J. Bionic Eng 9, 457–464. doi:10.1016/s1672-6529(11)60140-6
Feng, G., Lei, S., Guo, Y., Shi, D., and Shen, J. B. (2020b). Optimisation of air-distributor channel structural parameters based on Taguchi orthogonal design. Case Stud. Therm. Eng. 21, 100685. doi:10.1016/j.csite.2020.100685
Feng, Y.-Y., Hu, H., Peng, G.-Yi, and Zhou, Yu (2020a). Microbubble effect on friction drag reduction in a turbulent boundary layer. Ocean. Eng. 211, 107583. doi:10.1016/j.oceaneng.2020.107583
Ganesh Natarajan, S., and Bruce Ralphin Rose, J. (2022). Performance enhancement of futuristic airplanes by nature inspired biomimetic fish scale arrays—a design approach. Biomim. Intell. Robotics 2 (2022), 100045. doi:10.1016/j.birob.2022.100045
Gu, Y., Zhao, G., Zheng, J., Li, Z., Liu, W., and Muhammad, F. K. (2014). Experimental and numerical investigation on drag reduction of non-smooth bionic jet surface. Ocean. Eng. 81, 50–57. doi:10.1016/j.oceaneng.2014.02.015
Kim, Y., Roh, T.-S., Huh, H., and Lee, H. J. (2020). Study on the combined effect of various injection conditions on the drag reduction by a counter-flow jet in supersonicflow. Aerosp. Sci. Technol. 98, 105580. doi:10.1016/j.ast.2019.105580
Kotcioglu, I., Cansiz, A., and Nasiri Khalaji, M. (2013). Experimental investigation for optimization of design parameters in a rectangular duct with plate-fins heat exchanger by Taguchi method. Appl. Therm. Eng. 50, 604–613. doi:10.1016/j.applthermaleng.2012.05.036
Li, F., Zhao, G., and Liu, W. (2017). Research on drag reduction performance of turbulent boundary layer on bionic jet surface. Proc IMechE Part M J Eng. Marit. Environ. 231 (1), 258–270. doi:10.1177/1475090216642463
Liu, B., Xu, X., Pan, D., and Wang, X. (2023). Research on shipping energy-saving technology: hydrofoil amphibious vehicle driven by waterjet propulsion. J. Clean. Prod. 382 (2023), 135257. doi:10.1016/j.jclepro.2022.135257
Lv, K., Liu, Y., You, C., Zou, Y., Shi, Z., Lv, P., et al. (2013). Hydrodynamic investigations of a cross-domain vehicle with the capability of high-speed cruising on water surface. Ocean Engineering 25 (6), 944–953.
Muthuramalingam, M., Puckert, D. K., Rist, U., and Bruecker, C. (2020). Transition delay using biomimetic fish scale arrays. Sci. Rep. 10 (1), 14534. doi:10.1038/s41598-020-71434-8
Muthuramalingam, M., Villemin, L. S., and Bruecker, C. (2019). Streak formation in flow over biomimetic fish scale arrays. J. Exp. Biol. 222 (16), jeb205963. doi:10.1242/jeb.205963
Nowrouz Mohammad, N., Mohammad Saadat, B., and Setareh, S. (2013). Analysis of shear rate effects on drag reduction in turbulent channel flow with superhydrophobic wall. J. Hydrodynamics 25 (6), 944–953. doi:10.1016/s1001-6058(13)60444-8
Nowrouz Mohammad, N., Setareh, S., and Alireza, M. (2012). Drag reduction in a turbulent channel flow with hydrophobic wall. J. Hydrodynamics 24 (3), 458–466. doi:10.1016/s1001-6058(11)60267-9
Park, H. J., Tasaka, Y., Oishi, Y., and Murai, Y. (2015). Drag reduction promoted by repetitive bubble injection in turbulent Channelflows. Int. J. Multiph. Flow 75, 12–25. doi:10.1016/j.ijmultiphaseflow.2015.05.003
Shen, B. X., Liu, W. Q., and Yin, L. (2018). Drag and heat reduction efficiency research on opposing jet in supersonicflows. Aerosp. Sci. Technol. 77, 696–703. doi:10.1016/j.ast.2018.03.051
Shen, H., Xiao, Q., Zhou, J., Su, Y., and Bi, X. (2022). Design of hydrofoil for the resistance improvement of planing boat based on CFD technology. Ocean. Eng. 255 (2022), 111413. doi:10.1016/j.oceaneng.2022.111413
Wang, F., Yan, H., Zeng, Y. S., Xu, W., Zang, H. Z., and Meng, J. (2021a). Design optimization of a fluidized bed with a novel air chamber using the CFD-Taguchi method. Proc. IMechE Part C. J. Mech. Eng. Sci. (0), 1–14. doi:10.1177/09544062211029325
Wang, F., Yan, H., Zeng, Y. S., Xu, W., Zang, H. Z., and Meng, J. (2021b). Design of a novel flat-cloth airway in powder tank based on Taguchi optimization. Proc. IMechE Part C. J. Mech. Eng. Sci. (0), 1–13. doi:10.1177/09544062211010864
Wang, G., Senocak, I., Shyy, W., Ikohagi, T., and Cao, S. (2001). Dynamics of attached turbulent cavitating flows. Prog. Aero. Sci. 37, 551–581. doi:10.1016/s0376-0421(01)00014-8
Wang, Y., Zhang, Z., Xu, J., and Yu, H. (2021). One-step method using laser for large-scale preparation of bionic superhydrophobic & drag-reducing fish-scale surface. Surf. Coatings Technol. 409 (2021), 126801. doi:10.1016/j.surfcoat.2020.126801
Yagiz, B., Kandil, O., and Volkan Pehlivanoglu, Y. (2012). Drag minimization using active and passiveflow control techniques. Aerosp. Sci. Technol. 17, 21–31. doi:10.1016/j.ast.2011.03.003
Yan, H., Jian, Li a, Wu, M., Xie, C., Liu, C., and Qi, F. (2022). Study on the influence of active jet parameters on the cavitation performance of Clark-Y hydrofoil. Ocean. Eng. 261 (2022), 111900. doi:10.1016/j.oceaneng.2022.111900
Yan, H., Su, X. Z., Zhang, H. Z., Hang, J. W., Zhou, L., Liu, Z. F., et al. (2020). Design approach and hydrodynamic characteristics of a novel bionic airfoil. Ocean. Eng. 216, 108076. doi:10.1016/j.oceaneng.2020.108076
Yan, H., Zhang, H. Z., Zeng, Y. S., and He, X. Y. (2021). Lift-drag characteristics and unsteady cavitating flow of bionic hydrofoil. Ocean. Eng. 225, 108821. doi:10.1016/j.oceaneng.2021.108821
Keywords: biomimetic fish scale drag reduction, biomimetic jet drag reduction, large eddy simulation, Taguchi algorithm, hydrofoil
Citation: Yan H, Xie T, Li J, Fan J and Dai X (2024) Drag reduction of Clark-Y hydrofoil by biomimetic fish scale structure under the condition of biomimetic jet. Front. Energy Res. 12:1360495. doi: 10.3389/fenrg.2024.1360495
Received: 23 December 2023; Accepted: 07 March 2024;
Published: 04 April 2024.
Edited by:
Yilin Fan, UMR6607 Laboratoire de Thermique et Énergie de Nantes (LTeN), FranceReviewed by:
Dominique Tarlet, Université de Nantes, FranceLimin Wang, Chinese Academy of Sciences (CAS), China
Copyright © 2024 Yan, Xie, Li, Fan and Dai. This is an open-access article distributed under the terms of the Creative Commons Attribution License (CC BY). The use, distribution or reproduction in other forums is permitted, provided the original author(s) and the copyright owner(s) are credited and that the original publication in this journal is cited, in accordance with accepted academic practice. No use, distribution or reproduction is permitted which does not comply with these terms.
*Correspondence: Tengzhou Xie, eHR6QG1haWwuaGZ1dC5lZHUuY24=