 Louis Merceron
 Guillaume Boissonnet1
 François Maréchal
- 1CEA/DES/I-Tésé, Université Paris Saclay, Gif-sur-Yvette, France
- 2Industrial Processes and Energy Systems Engineering, Institute of Mechanical Engineering, École Polytechnique Fédérale de Lausanne, Lausanne, Switzerland
1 Introduction
1.1 General context
Humans affect Earth’s climate by the release of greenhouse gases (GHGs) in the atmosphere (P.R. Shukla et al., 2022). In 2015, 195 countries signed the Paris Agreement, which aimed at “holding the increase in the global average temperature to well below 2°C above pre-industrial levels” (UNFCCC (2015)). As a consequence, France pledged to reach climate neutrality in 2050 and, in this goal, started a strategy released by the Ministère de la transition écologique et solidaire (2020) (French Environment minister). This strategy relies significantly on biomass and does not take into account GHG emissions and energy needs from international transport (maritime and aviation). This raises two problems; the first is the hard-to-quantify availability and environmental impacts of biomass. The second is that to reach global climate neutrality, international transport emissions must be reduced, and so, countries must take responsibility for these emissions and include them in their strategy. The long-range transport sector is one of the most challenging sectors to defossilize, especially because the volume and mass density requirements are such that only a carbonaceous vector (or energy carrier) can be used (Gray et al., 2021). To shift away from fossil fuel, these vectors must be synthetically produced and, so, require a source of carbon. The same goes for chemicals but with the additional parameter of end-of-life processing. To know where the carbon in an energy vector comes from, the best method is to quantify all carbon flows in the system. Carbon constitutes biomass at approximately 50% in mass, and this makes biomass an important provider of non-fossil carbon. Biomass is foreseen to be used in diverse sectors, and it is primordial then to study the trade-offs between the different possible uses of biomass and the optimal carbon flows for the production of e-bio-fuels and chemicals. Among sectors that need a carbonaceous vector, aviation is one of the most important sectors because there is currently no alternative to carbonaceous fuel and because it is an important energy consumer (5% of primary energy in France in 2019). This paper aims to answer the following questions: 1) what are the implications on the energy system of climate neutrality while considering every sector and only limited import of fossil energy? 2) What are the implications of importing renewable and fossil jet fuel and how much would the production of sustainable aviation fuel (SAF) cost? 3) How do different hypotheses concerning the share of Fischer–Tropsch (FT) impact the optimal system? The method applied uses the open-source linear programming optimization tool EnergyScope TD to model the entirety of the French energy system, and this model is enhanced with a carbon flow optimization component.
The paper is organized as follows: Section 1 describes the state-of-the-art and the research gaps this paper aims to fill; Section 2 presents the methodology, detailing the integration of carbon flows into the EnergyScope TD model and clarifying the data assumptions that underlie this analysis; Section 3 presents and analyzes the results; Section 4 is a discussion on the conclusions that can be drawn from the results. In addition, this section explains the different limitations of the study; and Section 5 draws the general conclusion of this paper and advises on what orientation future works should take.
1.2 The carbon flows and the climate neutrality
It is not obvious why switching from a fossil carbonaceous vector to a non-fossil carbonaceous vector has a positive impact on climate. Indeed, in both cases, a carbon dioxide molecule is eventually emitted into the atmosphere on combustion, contributing to the greenhouse effect. However, fossil fuel on combustion emits carbon that was previously contained in the ground effectively, changing the concentration of
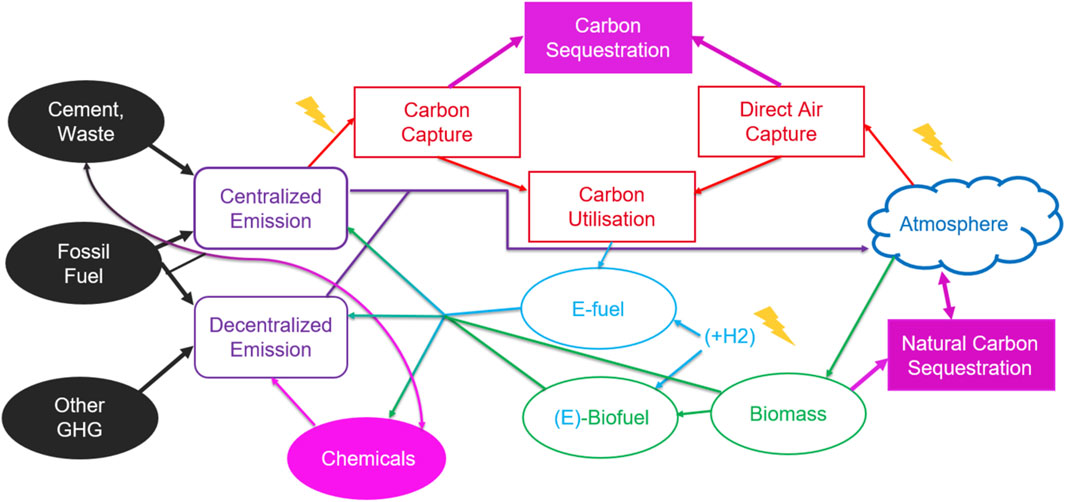
Figure 1. Carbon and GHG flow in the system. Bolt means an important need for electricity use in the process.
Hence, the objective is to replace fossil fuels with sustainable fuels; to do so, there is a need for carbon and an energy source. Carbon and energy can come from various sources, leading to the following classification. Fuels that use biomass both as a source of energy and source of carbon are classified as biofuels, the fuels that use biomass as a carbon source and biomass and hydrogen as a source of energy are e-bio-fuels, and the fuels that use
1.3 Energy system model climate neutrality and aviation
International transport is often a blind spot of countries; as a consequence or as a cause, many studies of energy modeling do not take into account the international transport sector in the energy system. It is then primordial to consider every sector of the energy system when studying the production of SAF because the competing use of carbon resources, such as biomass, influences the whole system.The strategies of European countries often cope with the absence of international transport by relying on massive imports of low-emission energy in their climate-neutral strategy. It is, for example, the case for France’s neighbors, such as Switzerland (Office fédéral de l’énergie OFEN, 2020), Germany (Prognos AG and Wuppertal Institut, 2021), or Belgium (Gouvernement Belge, 2019). Let us assume that the import of green energy means a need for another country to be a net exporter of energy. The energy exporter can be a neighbor, but in Europe, there is no country capable and willing to export enough energy to supply for the rest of the continent. The exporter can also be a country where there is abundant potential for renewable energy (e.g., North Africa), but the import of energy from these (often developing) countries raises questions on the already reached climate neutrality of the said country and the energy justice of such partnerships (Lindner, 2023). Relying on massive imports of energy ultimately leaves the importing country vulnerable to energy import variability and its effect on the commercial and geopolitical balance.
Many studies aim to study the future of aviation by looking at how to produce the necessary fuels. Among the research conducted on the subject, some conduct a techno–economic analysis of the process for producing SAF, and some evaluate the cost of producing SAF at the system level. All these techno–economic studies have diverse focuses. Ueckerdt et al. (2021) investigated the general challenges in e-fuel production. Habermeyer et al. (2023) examined the future cost of the power-and-biomass-to-liquid (PBtL) process. Huang et al. (2021) looked at the cost of diverse sustainably produced carbon molecules. This type of paper does not consider the impact on the system of producing the fuels. They do not put into perspective the emission reduction achieved within a fuel with the related objective at the scale of the system but focus more on the economic and process analysis. To explore these two aspects, studies use energy system models to optimize the system at the whole country’s energy system scale.
Among them, some focus on subjects that are related to the production of SAF. For example, Blanco et al. (2018) studied the production of hydrogen in Europe and its relationship with the production of e-fuel. Rixhon et al. (2022) investigated the impact of non-energy demand and chemical production on the system. Korberg et al. (2021) evaluated the role of biomass gasification in the energy system and found that e-bio-fuel plays a major role in the future energy system. Li et al. (2020) studied the feasibility of reaching carbon neutrality for Switzerland while taking into account international transport but without considering the impact of the production of biomass on GHG emissions. Sacchi et al. (2023) showed the impact of reaching a climate-neutral aviation sector considering e-fuel and direct air capture with carbon sequestration (DACCS) to offset the direct impact of aviation on climate.
The FT process produces a blend of different fuels, and some studies do not consider this and take into account a 100% share of jet fuel produced. For example, Dray et al. (2022) and Bergero et al. (2023) studied the future of aviation considering the evolution of the demand, with different technological improvements and sustainable fuel penetration, but they take into account 100% of jet fuel at the output of the FT process, whereas Sacchi et al. (2023) took only an 18% share of jet fuel at the output of the process. Furthermore, no studies consider the impact of the co-product on the system and investigate the impact of changing the share of jet fuel at the output of the FT process.
1.4 Research gap
The reviewed literature showed that to model carbon neutrality, a model must take into account every emitter sector of society and the couplings between these sectors. Some sectors are often not considered by energy system optimization, and this is especially the case for the international transport and non-energy sector. These sectors are deeply coupled with carbon resources because fuels and chemicals contain carbon. Biomass is an important carbon resource but is also considered to produce heat and electricity and to store carbon geologically or biologically, leading to an important competition between all uses of biomass and carbon resources in general. Optimization often relies on carbon dioxide removal (CDR) technologies to balance emissions even though the availability of such technologies is not granted (Carton et al., 2020). Finally, the import of GHG-neutral fuel is often a way for the model to attain balance without the consideration of the import implications. Other non-thoroughly discussed aspects of aviation in the literature include the impact on the system of the non-
This paper utilizes a classic multi-energy sector optimization model to quantify the requirements for achieving climate neutrality, with a particular focus on aviation. The study novelty lies in exploring diverse pathways toward aviation climate neutrality, including the integration of e-bio-fuels. Additionally, the introduction of carbon flow modeling to the EnergyScope TD framework enhances the understanding of carbon utilization across sectors and enables the implicit assessment of the e-fuel climate impact. Notably, this study marks the first comprehensive analysis, to the best of our knowledge, of the system-level impact of the share of jet fuel produced through the FT process. By incorporating these advancements, our research aims to provide valuable insights into the challenges of climate neutrality at the scale of the energy system and associated with the transition to a fossil-free aviation.
2 Materials and methods
2.1 Model
2.1.1 Modeling framework
The model used is based on EnergyScope TD, which was developed consecutively by Moret (2017), Limpens et al. (2019), and Rixhon et al. (2022). EnergyScope TD is a linear programming tool that optimizes both investment (i.e., installed capacity) and operation at the same time. This tool allows an hourly resolution and solving in 1 min on a personal computer using the typical days (TD) method. The main objective of the model is to minimize the total cost of the system while constrained by a maximum of GHG emissions and the end use demand (EUD), which corresponds to the energy needs of a country. To do so, the model can install energy production and transformation technologies (TECH), which consume and transform resources (RES). GHGs and
2.1.2 Economic modeling
The objective function of the model is to minimize the total cost of the system (Eq. 1), with
2.1.3 End use demand and energy modeling
Each EUD can correspond to the industry, the transport, the households, or the service sectors. The EUD for households and services is separated into electricity and heat, where electricity is separated into a base load and a variable curve to take into account the demand variation over time. Heating is separated into space heating and hot water requirements, where space heating also varies over time. Heating requirements can be met using district heating or decentralized heating. The variations in electricity and heating are generated by the TD algorithm based on electricity and heating time series. The industry uses electricity, low-temperature heat, and high-temperature heat as a base load. All the previous EUD requirements are expressed as energy requirements in GWh. For passenger transport, which encompasses the public (train, bus, and trolley), private mobility (cars), and aviation, the EUD requirements are expressed in millions of passenger kilometers (M.pax.km), and
Equation 5 represents the constraint that at any given moment, demand must be balanced by supply. With
Further details on the modelization of storage and system operation are given in the study by Limpens et al. (2019).
2.1.4 Carbon flow modeling
The addition of carbon flow modeling in EnergyScope TD is inspired by a previous addition of carbon flows in the monthly version of EnergyScope, given in the study by Li et al. (2020). It is based on the addition to the precedent version of EnergyScope TD of layers and technologies that aim to model carbon and GHG flows in the system. These layers are referred to as
One of the main constraints of the system is the maximum emission of GHGs (
Indeed, some technology emits
The combustion of the molecule can be either centralized, i.e., a consequent quantity of carbon is emitted in a single point that does not move (for example, in a coal power plant or a cement production plant), or it can be decentralized, i.e., the production of
The biogeochemical carbon cycle is a very complex system that is influenced by plenty of parameters, but it can be simplified as a net carbon removal because of the sequestration of
Every technology on installation emits GHGs because of the materials required to produce it; the emission from these technologies is taken into account for electricity and heat production technologies, assuming that emission to produce cars, for example, is already taken into account by the industry sector. In addition, some sectors emit non-
The captured
The non-energy demand sector uses carbonaceous vectors as material for the production of chemicals, and it is assumed that the carbon in these vectors is sequestrated. The final use of the molecule can be a definite use, in which case the carbon is definitely stored, or a use that results in the molecule being in waste. The waste treatment is such that if the molecule is recycled, then carbon is not emitted; if it ends in a landfill, carbon is stored (not taking into account other environmental impacts of the landfill); and if it is burned to produce energy, then the
2.1.5 Data and assumptions
Many assumptions are made when hypothesizing the future of an energy system, especially on a long-term basis. Most of the data on technology cost and yields can be found online on the EnergyScope documentation website. Details on the source of data for French-specific EUDs are given in Supplementary Table S1. Specific technology additions to the EnergyScope TD model for this study are given in Supplementary Material Section 1.2. In this model, the possibility of using energy crops as a biomass source is not considered because of the concurrence between energy and food production and the non-negligible impact of the process on GHG emissions. The system is built from Greenfield with the assumption of no previously made investment. The Greenfield assumption is not very impactful in this study because the focus is on the sustainable fuel production system, which is a system with no previously existing infrastructure. The system studied in this paper is the global energy system of metropolitan France with the constraint of climate neutrality, i.e., net-zero emission of GHGs. The following major assumptions are made for every result in the paper.
The following assumptions are only made for the base case. The composition of the blend coming out of the FT refinery can be adjusted to boost the production of one of the three vectors, namely, gasoline, diesel, and jet fuel, but this production reaches a maximum ratio because of chemical constraints. The maximum share of fuel that can be reached at the output is 37% for gasoline, 63% for diesel, and 50% for jet fuel. It is assumed that it is possible to import 30% of jet fuel demand; this fuel is fossil and, so, is associated with non-
2.2 Scenarization
According to the law named ReFuelEU passed by the European Parliament (2023), European aviation should be powered at a minimum of 70% by SAF in 2050, of which a minimum of 35% of the total demand is by e-SAF. This legislation places an important constraint on the system and massive requirements for the production of SAF. It is then important to not only quantify the differences between different policy configurations but also the impact of adding aviation on a climate-neutral system and the requirement behind the production of SAF. Different scenarios are defined to study how requirements on jet fuel production influence relevant parameters. The scenarios are described as follows.
1.0-AV: No demand for aviation.
2.100-FO: Possible import of fossil jet fuel at 100% of demand.
3.100-OP: 100% of demand from optimal processes according to the system.
4.70-OP: 30% of demand from fossil fuel and 70% of demand from optimal processes.
5.70-BI: 30% of demand from fossil fuel and 70% of demand from biofuel processes.
6.70-EF: 30% of demand from fossil fuel and 70% of demand from e-fuel processes.
7. RF-EU: 30% of demand from fossil fuel and a minimum of 35% of demand from e-fuel processes.
2.3 Variation in the cost of import
Previously, in the RF-EU scenario, there was an assumption that 30% of the demand for jet fuel was met by the import of energy. When there is no import, the system produces each vector with a price implicitly calculated, and this price is the sum of the cost of every technology used to produce this vector divided by the quantity produced. When the import is available, the only parameters the modeler controls are the quantity of import available and the cost at which the system will import a vector. So, if the system can import a vector at a cost inferior to the system production cost, it will be optimal for the system to import this vector. Then, by running the model within a range of costs of import for the same vector, it is possible to compute the production cost of this vector. The production cost is the integral of the quantity imported over the variation in the cost of import.
To be produced sustainably, the carbon used in a fuel must come from a renewable source. If 100% of the carbon contained in fuel comes from a renewable source, then the carbon offsets its
To study this, the import of jet fuel is set to be possible at 100% of demand. EnergyScope TD is run for different costs of import of jet fuel varying between 50 EUR/MWh and 350 EUR/MWh, with a step of 5 EUR/MWh. This is done for different values of reduction in the emission of jet fuel relative to the
2.4 Share of jet fuel produced from Fischer–Tropsch technology
The FT technology produces a blend of molecules with different lengths of carbonaceous chains. The most common way to forecast the composition of the fuel produced by the FT process is based on the Anderson–Schulz–Flory distribution. This distribution yields a maximum ratio of production of jet fuel of 42%. However, this can be changed by using different catalysts, adjusting the process to recycle longer carbon chains, and reforming shorter ones. This is what was considered in this study, giving a maximum ratio of 50%. In Section 3.4, the effect on the system of the share of jet fuel at the output of the FT process is investigated.
3 Results
3.1 Climate neutrality of the French energy system
3.1.1 Energy and carbon flows in the system
The results given in this section refer to the base case described in Section 2.1.5. In Figure 2, the annual energy and carbon flows of the energy systems are represented with Sankey diagrams. In these diagrams, the width of the arrows is proportional to the energy and carbon flows. Energy content is quantified in TWh, and the content of carbon is quantified in
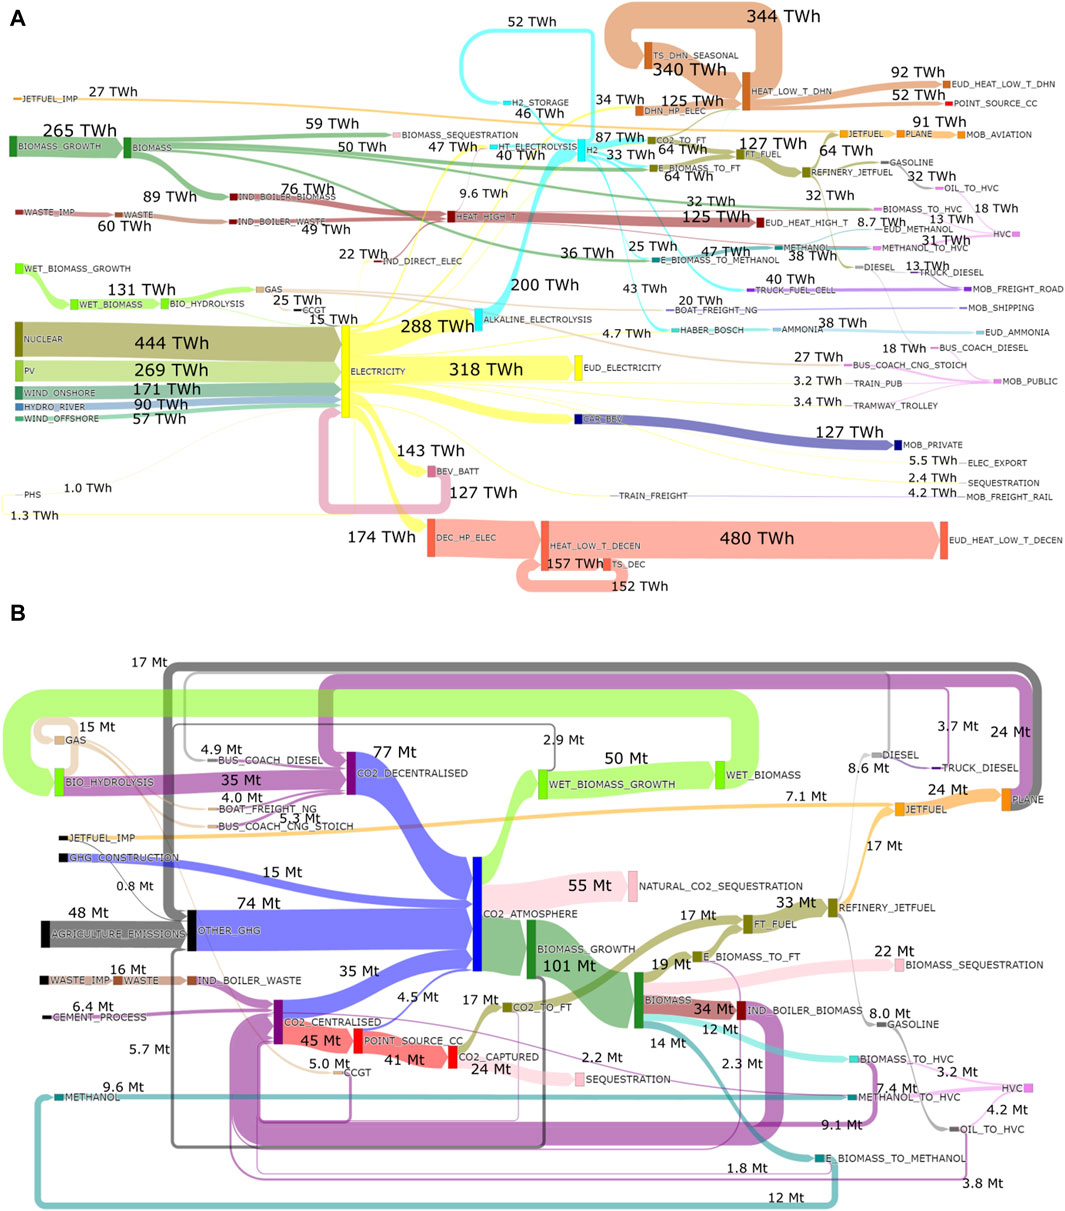
Figure 2. (A) Energy and (B) carbon Sankey diagram for the scenario RF-EU. For carbon Sankey, quantities are expressed in
The results show that the main energy carrier is electricity produced from diverse low-carbon sources of energy, reaching a total production of 1,081 TWh. Nuclear, PV, hydroelectricity, and onshore wind reach their maximum capacity potential. An important part of electricity is stored during the peak of production of PV panels and is used during the night. This energy is stored mainly using the electric private car battery (127 TWh), specifically using the vehicle-to-grid (V2G) technology and for 1 TWh part using Pumped-Hydro storage (PHS). In addition, 25 TWh of gas is used in a combined cycle gas turbine (CCGT) for the production of 15 TWh of electricity during cold winter days with low production from PV and wind (see Section 3.1.2). A consequent part of electricity is used to produce 240 TWh of hydrogen, the third most important energy carrier. This production is made at 83% using alkaline electrolysis and 17% by high-temperature (HT) electrolysis. The hydrogen is a way to store energy (see Supplementary Figure S4) and is used to produce ammonia, which is a non-energy EUD. Hydrogen is also used in e-bio-fuel and e-fuel processes producing FT and methanol. Methanol is a non-energy EUD and used also as a precursor for the production of HVCs, and methanol is produced with carbon coming only from biomass. Gas is produced with wet biomass using bio-hydrolysis. Gas use is separated into maritime shipping, electricity production, and buses.
Half of the FT fuel is produced using hydrogen and biomass, and the other half is produced using
The results also show that in the base case, decentralized heat is produced in totality using heat pumps. DHNs are powered with heat pumps and, for a part, through integration with the hydrogen and fuel industrial sectors and by a cogeneration process (approximately 19%); part of the DHN heat is stored during summer to be used in winter. High-temperature heat for the industry is provided by industrial wood boilers (52%), waste boilers (33%), and direct electric industrial heating (15%). This production of high-temperature heat consumes all the available waste.
Concerning mobility, the maximum share of public transport is reached (for passenger transport and freight). Private mobility is filled only by BEVs and public transport from a share of trains, trollys, and hydrogen buses. Road haulage uses a majority of hydrogen trucks (75%) with a share of diesel trucks (25%). Maritime shipping is powered only by gas. Carbon capture from a point source consumes 48 TWh of heat.
The carbon Sankey diagram shows that under climate neutrality, there remains 205
Other GHGs are made up of emissions from planes (23%), agriculture (65%), and biomass harvest (12%). A majority of centralized emissions (56%) are captured. The captured carbon is used in part to produce FT fuel and in part is sequestrated, reaching the maximum availability of sequestration. Furthermore, 67% (53.5
3.1.2 Electricity production and consumption balance
Figure 3 shows the hourly evolution of the production and consumption of electricity during each of the 12 typical days. The differences between the 12 typical days are due to different meteorological conditions associated with each typical day. Some days can be characterized as summer days (TDs 6, 7, 8, and 9) because during these days, there is a low demand for heat and high production by PV panels. TDs 4, 5, 10, and 11 can be classified as mid-season (medium heat demand, medium PV, and wind production), and TDs 1, 2, 3, and 12 can be classified as winter days (high heat demand, low PV production, and variable wind production). There is a consequent load variation due to the PV production peak at the intra-day time scale. BEVs are loaded during the peak of PV production, and additionally, BEVs provide a way to store energy. An important power generation is dedicated to hydrogen production during the typical days corresponding to summer days, and this stored hydrogen is used during winter. This hydrogen production also varies within the day because of the hourly variation in PV production. The overall load factor of electrolyzers is 47.7%. Gas is used in the CCGT to produce electricity during winter days, especially days with low production by intermittent renewables. A more detailed explanation about energy storage and the use of non-electricity energy carriers during different TDs is given in Supplementary Figures S1–S3.
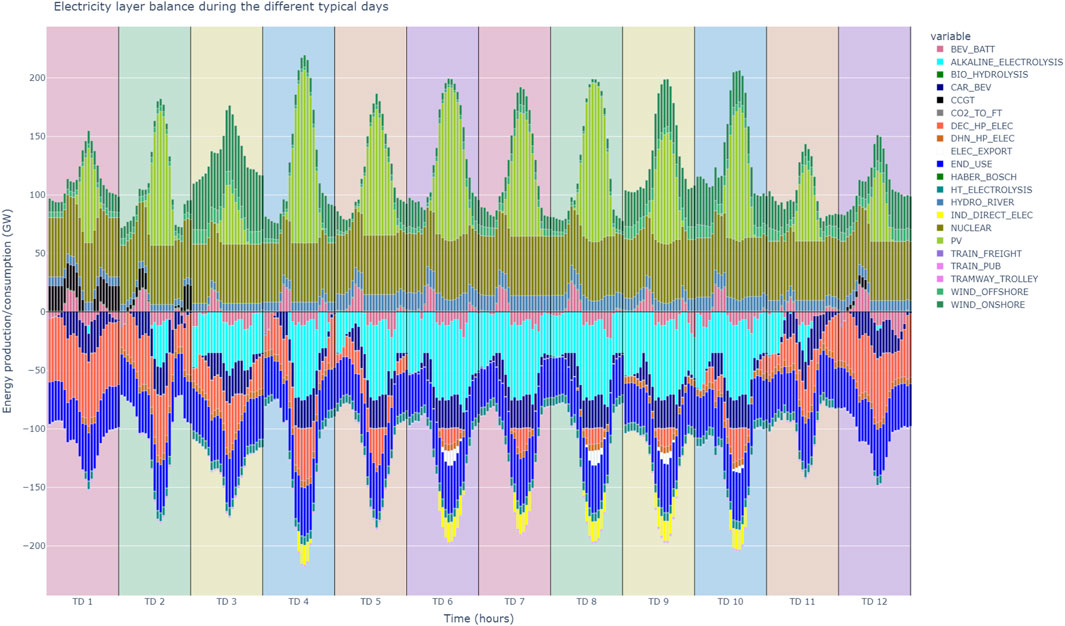
Figure 3. Production (positive values) and consumption (negative values) of electricity during 24 h of each of the 12 typical days for the scenario RF-EU.
3.2 Analysis of different strategies for the production of jet fuel
The assumptions behind the different strategies are described in Section 2.2. The results for these strategies are summarized in Table 1. The additional demand for aviation is associated with an important increase in the cost of the system, electricity production, and biomass sequestration. The increase in production due to a decrease in the import of fossil jet fuel leads to the same pattern. SAF in the 70-OP scenario is produced at 100.0% by PBtL processes. In the 100-OP scenario, 100.0% of SAF is produced via PBtL processes. In the RF-EU scenario, as expected, half of the SAF is produced via power-to-liquid (PtL) processes (as required) and the other half with PBtL processes. It is important to note that in the 70-BI scenario, 64 TWh of gas is permanently stored, which corresponds to a carbon content of 12.8
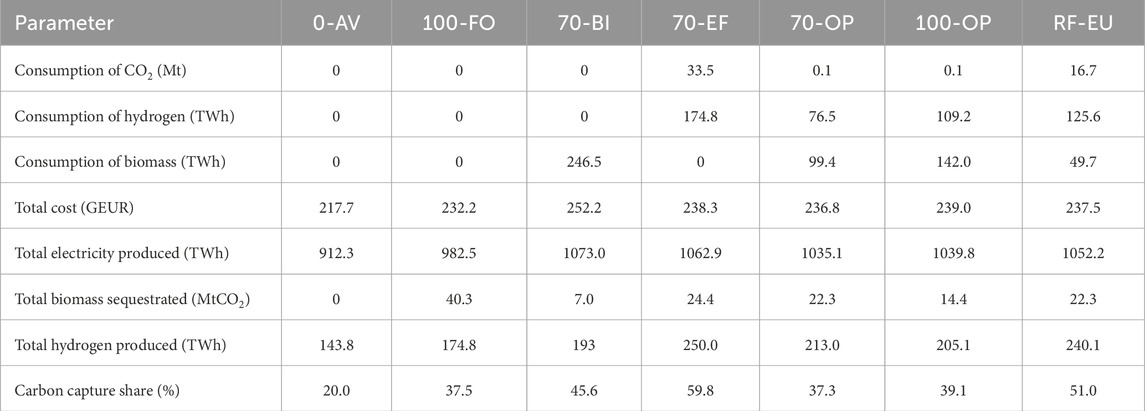
Table 1. Consumption of biomass, hydrogen, and
3.3 Import price of renewable and fossil fuel
Figure 4 shows the evolution of several key parameters of the system upon the variation in jet fuel import price and emission reduction of this jet fuel. The import price and emission reduction associated with it have primarily an impact on the quantity of jet fuel imported. As expected, an increase in the cost of imported jet fuel leads to a decrease in the quantity imported. Under a certain cost, all the jet fuel used in the system is imported, and over a certain cost, no jet fuel is imported by the system. The values for these two costs depend on the emission reduction associated with the import of jet fuel. The higher the emission reduction, the higher the cost at which the system both stops to import jet fuel and stops to only import jet fuel. For example, for 90% emission reduction, the system only stops importing jet fuel at 200 EUR/MWh and stops importing jet fuel at 230 EUR/MWh. The quantity of jet fuel that is not imported must be produced, which is why these quantities influence electricity and hydrogen production. However, it also influences the necessary sequestration of biomass. Biomass sequestration is also highly correlated with emission reduction because there is less need for sequestration when there are fewer emissions of non-
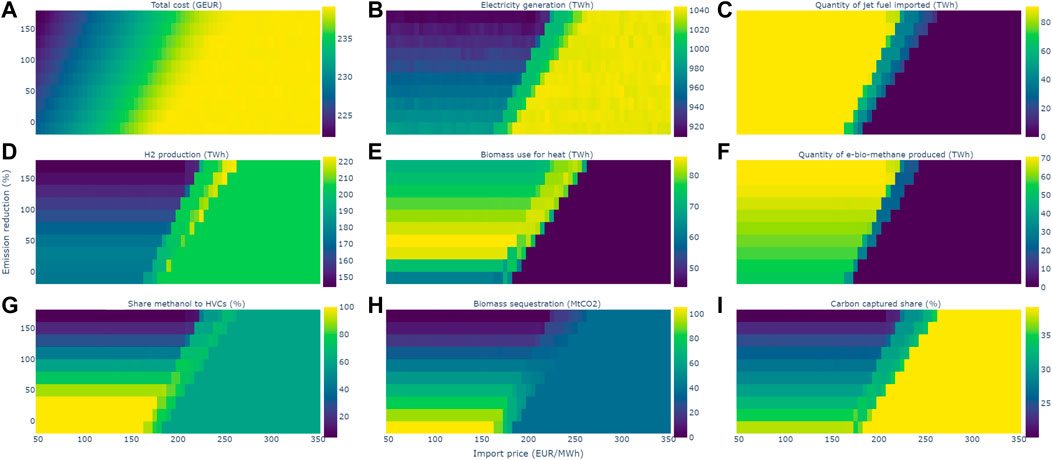
Figure 4. Sensibility analysis of the response of the system with different prices for import of jet fuel and different shares of emission reduction associated. This figure displays the heatmap of different parameters of the system: (A) total cost, (B) total electricity produced, (C) quantity of jet fuel imported, (D) hydrogen production, (E) total biomass used for heat production in the system, and (F) quantity of e-bio-methane produced. (G) Share of HVCs produced with methanol as an intermediary, (H) quantity of carbon sequestrated via the reduction of biomass as a source of energy, and (I) share of centralized emission captured.
The consequences of the quantity of jet fuel imported influence the total cost of the system.The curve of the quantity of jet fuel over the different prices for jet fuel import enables the calculation of a unique average cost for the production of jet fuel by the system. This cost varies with the different emission reductions associated with the jet fuel import. For example, it is possible to compute the cost of producing a fuel with emissions of fossil fuel yielding a production cost of 177 EUR/MWh for a synthetic jet fuel with the same emissions as a fossil jet fuel. For a fuel that can be qualified as a SAF (90% reduction of
3.4 Impact of Fischer–Tropsch selectivity on the system
Figure 5 displays the result following the methodology described in Section 2.4. This figure shows the impact of the FT selectivity on different relevant parameters of the system for different scenarios and climate metrics (GWP over 20, 50, or 100 years). This climate metric has an impact on the non-
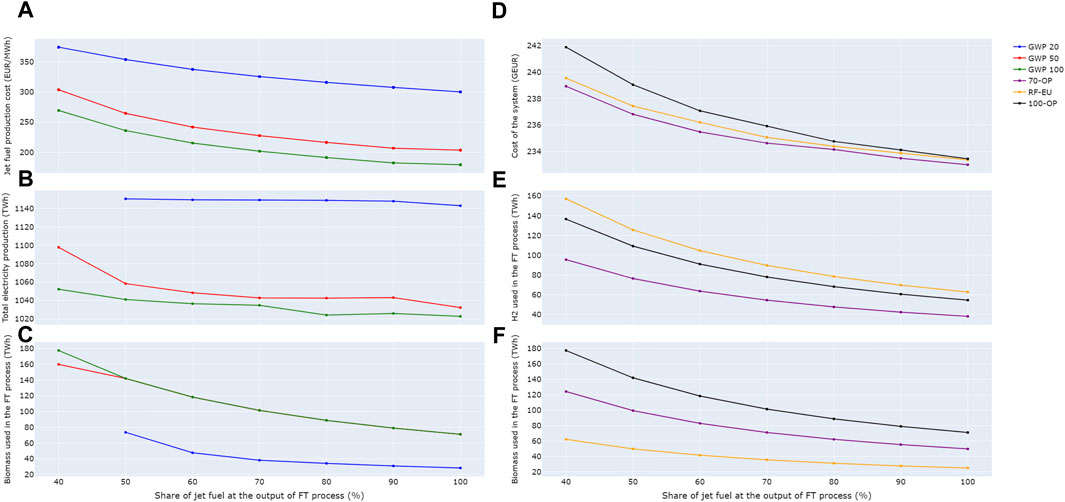
Figure 5. Evolution of different parameters over different shares of jet fuel produced at the output of the FT process, (A–C) with different climate metrics. (A) Computed cost of the production of jet fuel by the system. (B) Quantity of electricity required with no import of jet fuel. (C) Quantity of biomass used by the FT process with no import of jet fuel. (D–F) For different scenarios: (D) total cost of the system, (E) quantity of hydrogen used for the production of FT fuel, and (F) quantity of biomass used for the production of FT fuel.
4 Discussion
4.1 Climate neutrality and energy requirements
Section 3.1.1 shows that reaching climate neutrality for France is achievable even with no import of green energy and while considering every sector. However, this comes at a very high financial and technical cost for the system. Reaching neutrality requires important investments in low-carbon electricity production, sustainable fuel production, and CDR. Concerning CDR, 22% of the available lignocellulosic biomass is used to sequestrate carbon definitely outside of the system. This deprives the system of a cheap and renewable resource. Such a method could be seen as the use of biomass as a construction material or as an increased natural carbon sequestration due to reduced pressure on forests by the reduction in the production of biomass energy. The system also uses all the geological sequestration potential available. The sequestration potential is then an important parameter of the model, and this emphasizes the need to take into account the technical characteristics of sequestration in models. It is primordial to enhance systemic research on the quantification of required quantities of CDR, and the optimal strategies to achieve this removal. The ReFuelEU scenario reaches climate neutrality, but this scenario relies on a profusion of non-fossil energy. The production of electricity to reach this neutrality (1,052 TWh) is significantly higher than expected by the reference documents from the French electricity transmission system operator Réseau de Transport d’Electricité (RTE) (2022) (645 TWh) and the French minister of sustainable development Ministère de la transition écologique et solidaire (2020) (580 TWh). This is partly due to the consideration of international transport and non-energy sector loss, which is not considered thoroughly in these documents. Another reason is the absence of modelization of energy efficiency in buildings. Finally, the hypothesis of no import of energy (other than “other refinery fuel” and jet fuel) is not probable, particularly for the electricity vector. However, this hypothesis is valid, especially considering that studies on the feasibility and impacts of exporting massive quantities of green energy are scarce.
The important differences in energy production raise questions about the relevance of not taking into account the requirement for international transport and the non-energy demand of molecules in national strategies. Indeed, the differences due to the inclusion of these aspects are important. Then, the future energy mix will not be accurately forecasted without the consideration of international transport and non-energy demand. Hence, future national strategies should carefully consider the demand for these sectors.
Temporal electricity generation and consumption, within and among the TDs, is very high. The peak of electricity production reaches 219.6 GW on TD 4, which is more than double the all-time record for 102.1 GW in France on 8 February 2012. Such an increase in the mean and peak load will come at a high technical cost for the development of the grid and flexibility options. Indeed, the flexible operations of electrolyzers described in Section 3.1.2 would put the electrolyzers under important constraints and need to be demonstrated at the scale of the gigawatt. This flexible operation implies a maximum storage of 38 TWh of hydrogen. The use of car batteries as a way to store energy that can be re-injected on the grid called V2G is not yet considered at the scale of 10 GW. However, such an operation is important for the flexibility of the system and enables important economic optimization. Studies on the flexibility of the power system and its coupling with other vectors such as heat, hydrogen, and gas are necessary to understand the scale at which the hypotheses made in this study are valid.
4.2 Optimal use of resource in the system
The 70-OP scenario shows that it is not optimal to use biomass to produce decentralized heat. It also shows that to value biomass efficiently, it is important to understand the crucial role of the carbonaceous vector in the system. This explains that the most optimal pathway for the production of fuels is using the PBtL process. Indeed, this process has a better carbon and energy yield than the biomass-to-liquid (BtL) process and a better energy yield than PtL processes by avoiding carbon capture need and additional hydrogen production. As shown in the reviewed literature, taking into account the coupling of biomass and hydrogen in processes is not systematic. This work highlights that the consideration of the PBtL process is a crucial aspect of the energy transition.
The comparison between the different scenarios in Table 1 shows that important gains can be made from the consideration of every process for the production of jet fuel. That is, producing SAF from only the BtL process considerably increases the total cost of the system compared to the optimal case (+15.4 GEUR and +38 TWh of electricity production). The same goes for only considering PtL processes (+1.5 GEUR and +28 TWh of electricity production). Optimality relies only on e-bio-fuel in the French case, but e-fuel could play an important role in a country with less biomass available. Those two pathways come within the scope of the European law ReFuelEU. This law sets a minimum share of SAF coming from the PtL process without any justification of the figures used. Under the assumptions of the law, the system cost increases by 700 MEUR and power generation by 8.1 TWh from the optimal case. This highlights the need for further research on the optimal share of fuel from the three different processes to advise on the best policy strategy. It is also important to value the carbon resources, which are centralized
Furthermore, the law set that after 2041, the
4.3 Inclusion of aviation
The total impact on the climate of fossil aviation is 41
Replacing fossil jet fuel with SAF at 70% induces a decrease of 15.9
4.4 Production cost and import
The results given in Section 3.3 show that the production cost of SAF varies with the emission reduction associated with this production. These results highlight that it is possible to reach climate neutrality even with the remaining fossil fuel in the system. However, this requires the use of an important part of available biomass to sequestrate carbon. The import of fossil fuel reduces the need for electricity production and carbon capture because there is less need for hydrogen production and the combination with captured
The increase in jet fuel cost will lead to an increase in the future cost of flying. Based on the share of jet fuel in the cost of flying an airplane (18.7% in the United States) from Argus Media, it is possible to compute the increase in the cost of a plane ticket due to the replacement of fossil fuel by SAF. This is based on the historical prices of fossil jet fuel from Argus Media and the calculated price of SAF. Then, for 100-OP, the increase in the total price of a plane ticket would be 60% with current technology. However, the future share of jet fuel in the cost of flying an airplane should decrease in the future with the improvement of airplane motor technology. So, with a 1% improvement in motor yield per year, the total cost increase in a plane ticket would only reach 48%. This increase would only reach 33% in the scenario RF-EU due to the inclusion of 30% of cheap fossil fuel in the supply. An increase in this magnitude could lead to a change in demand, but such effects are not assessed in this work. It should also be noted that this calculation is based on the market price of airline tickets for the United States, which includes factors other than airline costs (reduction or absence of taxes, tax exemptions, etc.). The results are therefore indicative and may change if the air transport market changes.
4.5 Integration of the Fischer–Tropsch process in the system
Section 3.4 highlights that the quantity of jet fuel at the output of the FT process is a key parameter of the system. The price of SAFs increases with the low conversion of FT to jet fuel. When the share of jet fuel at the output increases from 40% to 100%, the quantity of electricity required decreases by 30 TWh. Consequently, SAF production cost decreases by 33%, reaching a cost of 179 MEUR/MWh for
This is due to the inefficiency of the co-products of jet fuel in the FT process. Indeed, even though there is always the same quantity of energy in the output, the sole determinant of the quantity of fuel produced is the aviation sector. Hence, the quantity of gasoline and diesel produced depends on the selectivity of the FT process. The results highlight that the value of gasoline and diesel by the system is only due to the “necessary” production of jet fuel. The sub-optimality of co-products impacts jet fuel production cost. That is, the use of diesel is less efficient than hydrogen for trucks, and the production of HVCs from gasoline is less efficient than the production from methanol. Hence, this additional charge due to the sub-optimality is transferred to the cost of jet fuel, increasing jet fuel cost with decreasing jet fuel share in the output.
Then, it should be advised to seek the maximum conversion of FT into jet fuel. This can be done by favoring process configurations that maximize the output of jet fuel by using good catalysts and recycling longer carbon chains in the process. Clarification on the maximal conversion of FT to jet fuel that can be attained physically could be beneficial. This conversion depends on the physical requirement behind the blend of molecules identified as jet fuel. Indeed, there is no consensus in the literature on the maximal conversion rate that can be achieved, and Lin et al. (2022) gave 42% with basic theory and 72% with the right catalyst. An internal source gave 50%, Eilers et al. (1990) gave 60%, and Klerk (2011) gave 63%. So, the value taken in this study (50%) falls in the lower range of the values given by the literature.
Future energy system studies should take into account this aspect of the FT process, especially when focusing on aviation. As highlighted, the literature review studies found in the literature (Dray et al., 2022; Bergero et al., 2023; Sacchi et al., 2023) use 100%, 100%, and 18%, respectively, as the efficiency conversion of FT fuel into jet fuel. These values are not within the range found in the process literature; hence, the implications of such hypotheses should be discussed.
4.6 Limitations
There are several limitations to this study.
These limitations are perspectives for the improvement of the model used in this study.
5 Conclusion
This paper describes the integration of carbon flow quantification into the EnergyScope TD energy system model. A quantification of the energy required to achieve climate neutrality in France is given. It shows that a significant amount of electricity (1,081 TWh/year) is required to achieve climate neutrality. The quantity of primary energy needed is higher than that in the reference documents on France’s energy transition. This is because the present study takes into account the bunkers of international sea and air transport and the demand for non-energetically used molecules. The results show that neutrality can be achieved, without assessing the feasibility of the evolution of the production system and infrastructure.
The optimal use of carbon resources should be a greater concern in the energy systems community than it currently is because of the massive changes that will result from the absence of fossil fuels. The combination of biomass and hydrogen is rarely considered in other studies, although the findings of this study show that this is a fundamental pillar of the energy transition and particularly one the most optimal processes for jet fuel and methanol production.
The impact of aviation on this carbon-neutral energy system is then analyzed in more detail. In particular, the different resources required in different policy scenarios are quantified. The cost of producing SAF in the system is calculated, as well as the impact on the system of the proportion of jet fuel as a product of the FT process.Eliminating all fossil fuels from aviation increases the cost of the system by 6,800 MEUR per year and electricity production by 57 TWh, compared to a fossil case. This shows that the defossilization of aviation will have a high technological and financial cost impact on society due to the need for sustainable carbon-based energy carriers. This work highlights that the proportion of SAF produced by the FT process is a key parameter in the system, even if it is not often considered in studies. Total neutrality of the aviation sector can be achieved through technological change at the expense of a major transformation of the infrastructure, but other options such as reducing the demand for aviation should also be considered.
Building on the work carried out and especially on the carbon flow quantification, it would be interesting to improve the modelization of biomass resources; such an improvement could lead to a study on the optimal use of biomass in the system. Indeed, as already shown in several studies, there is a relationship between the optimal pathway for the production of fuel and parameters, such as biomass potential, biomass use, and carbon sequestration availability. Similarly, the results could be improved by including a study of the impact of land-use changes on the
Data availability statement
The raw data supporting the conclusion of this article will be made available by the authors, without undue reservation. Part of the data used is available on https://energyscope.readthedocs.io/en/master/ the model used is available on https://github.com/energyscope/EnergyScope/tree/EnergyScopeFR.
Author contributions
LM: conceptualization, data curation, formal analysis, investigation, methodology, validation, visualization, writing–original draft, and writing–review and editing. GB: conceptualization, funding acquisition, investigation, methodology, supervision, and writing–review and editing. FM: conceptualization, funding acquisition, investigation, methodology, writing–review and editing, and supervision.
Funding
The author(s) declare that financial support was received for the research, authorship, and/or publication of this article. Open access funding by Swiss Federal Institute of Technology in Lausanne (EPFL).
Acknowledgments
The authors acknowledge the kind reviews and advice of Fabian Scheller and Lucas de la Fuente during the Young Energy Economist and Engineer Seminar 32.
Conflict of interest
The authors declare that the research was conducted in the absence of any commercial or financial relationships that could be construed as a potential conflict of interest.
The author(s) declared that they were an editorial board member of Frontiers, at the time of submission. This had no impact on the peer review process and the final decision.
Publisher’s note
All claims expressed in this article are solely those of the authors and do not necessarily represent those of their affiliated organizations, or those of the publisher, the editors, and the reviewers. Any product that may be evaluated in this article, or claim that may be made by its manufacturer, is not guaranteed or endorsed by the publisher.
Supplementary material
The Supplementary Material for this article can be found online at: https://www.frontiersin.org/articles/10.3389/fenrg.2024.1359641/full#supplementary-material
Abbreviations
BtL, biomass to liquid; BEV, battery electric vehicle; CCGT, combined cycle gas turbine; CDR, carbon dioxide removal; DAC, direct air capture; DHN, district heating network; EUD, end-use demand; FT, Fischer–Tropsch; GHGs, greenhouse gases; HT, high temperature; HVCs, high-value chemicals; SAF, sustainable aviation fuel; PBtL, power and biomass to liquid; PtL, power to liquid; PV, photovoltaic; TD, typical day.
References
Académie des Technologies (2023). La décarbonation du secteur aérien par la production de carburants durables. Tech. Rep.
Bergero, C., Gosnell, G., Gielen, D., Kang, S., Bazilian, M., and Davis, S. J. (2023). Pathways to net-zero emissions from aviation. Nat. Sustain. 6, 404–414. doi:10.1038/s41893-022-01046-9
Bigo, A. (2020). Les transports face au défi de la transition énergétique. Explorations entre passé et avenir, technologie et sobriété, accélération et ralentissement. Paris: Institut Polytechnique de. Ph.D. thesis, Economies et finances.
Blanco, H., Nijs, W., Ruf, J., and Faaij, A. (2018). Potential for hydrogen and Power-to-Liquid in a low-carbon EU energy system using cost optimization. Appl. Energy 232, 617–639. doi:10.1016/j.apenergy.2018.09.216
Carton, W., Asiyanbi, A., Beck, S., Buck, H. J., and Lund, J. F. (2020). Negative emissions and the long history of carbon removal. Wiley Interdiscip. Rev. Clim. Change 11, 1–25. doi:10.1002/wcc.671
Cormos, A.-M., Dragan, S., Petrescu, L., Sandu, V., and Cormos, C.-C. (2020). Techno-economic and environmental evaluations of decarbonized fossil-intensive industrial processes by reactive absorption and adsorption CO2 capture systems. Energies 13, 1268. doi:10.3390/en13051268
Daioglou, V., Doelman, J. C., Stehfest, E., Müller, C., Wicke, B., Faaij, A., et al. (2017). Greenhouse gas emission curves for advanced biofuel supply chains. Nat. Clim. Change 7, 920–924. doi:10.1038/s41558-017-0006-8
Daioglou, V., Faaij, A. P., Saygin, D., Patel, M. K., Wicke, B., and Van Vuuren, D. P. (2014). Energy demand and emissions of the non-energy sector. Energy Environ. Sci. 7, 482–498. doi:10.1039/c3ee42667j
Dray, L., Schäfer, A. W., Grobler, C., Falter, C., Allroggen, F., Stettler, M. E., et al. (2022). Cost and emissions pathways towards net-zero climate impacts in aviation. Nat. Clim. Change 12, 956–962. doi:10.1038/s41558-022-01485-4
Eilers, J., Posthuma, S., and Sie, S. (1990). The shell middle distillate synthesis process (smds). Catal. Lett. 7, 253–269. doi:10.1007/bf00764507
European Parliament (2018). Directive (EU) 2018/2001 of the European Parliament and of the Council of 11 December 2018 on the promotion of the use of energy from renewable sources (recast). Official J. Eur. Union 2018, 82–209. Available at: http://data.europa.eu/eli/reg/2023/2405/oj.
European Parliament (2023). Regulation of the European Parliament and of the Council on ensuring a level playing field for sustainable air transport (ReFuelEU Aviation). Official Journal of the European Union.
Gray, N., McDonagh, S., O’Shea, R., Smyth, B., and Murphy, J. D. (2021). Decarbonising ships, planes and trucks: an analysis of suitable low-carbon fuels for the maritime, aviation and haulage sectors. Adv. Appl. Energy 1, 100008. doi:10.1016/j.adapen.2021.100008
Habermeyer, F., Papantoni, V., Brand-Daniels, U., and Dietrich, R. U. (2023). Sustainable aviation fuel from forestry residue and hydrogen - a techno-economic and environmental analysis for an immediate deployment of the PBtL process in Europe. Sustain. Energy Fuels 7, 4229–4246doi. doi:10.1039/d3se00358b
Huang, Z., Grim, R. G., Schaidle, J. A., and Tao, L. (2021). The economic outlook for converting CO2and electrons to molecules. Energy Environ. Sci. 14, 3664–3678. doi:10.1039/d0ee03525d
Klerk, A. D. (2011). Fischer-Tropsch fuels refinery design. Energy Environ. Sci. 4, 1177–1205. doi:10.1039/c0ee00692k
Korberg, A. D., Mathiesen, B. V., Clausen, L. R., and Skov, I. R. (2021). The role of biomass gasification in low-carbon energy and transport systems. Smart Energy 1, 100006. doi:10.1016/j.segy.2021.100006
Lee, D. S., Fahey, D. W., Skowron, A., Allen, M. R., Burkhardt, U., Chen, Q., et al. (2021). The contribution of global aviation to anthropogenic climate forcing for 2000 to 2018. Atmos. Environ. 244, 117834. doi:10.1016/j.atmosenv.2020.117834
Leurent, M. (2019). Analysis of the district heating potential in French regions using a geographic information system. Appl. Energy 252, 113460. doi:10.1016/j.apenergy.2019.113460
Li, X., Damartzis, T., Stadler, Z., Moret, S., Meier, B., Friedl, M., et al. (2020). Decarbonization in complex energy systems: a study on the feasibility of carbon neutrality for Switzerland in 2050. Front. Energy Res. 8, 1–17. doi:10.3389/fenrg.2020.549615
Limpens, G., Moret, S., Jeanmart, H., and Maréchal, F. (2019). EnergyScope TD: a novel open-source model for regional energy systems. Appl. Energy 255, 113729. doi:10.1016/j.apenergy.2019.113729
Lin, T., An, Y., Yu, F., Gong, K., Yu, H., Wang, C., et al. (2022). Advances in selectivity control for fischer-tropsch synthesis to fuels and chemicals with high carbon efficiency. ACS Catal. 12, 12092–12112. doi:10.1021/acscatal.2c03404
Lindner, R. (2023). Green hydrogen partnerships with the Global South. Advancing an energy justice perspective on “tomorrow’s oil”. Sustain. Dev. 31, 1038–1053. doi:10.1002/sd.2439
Moret, S. (2017). Strategic energy planning under uncertainty. Ecole Polytechnique Fédérale de Lausanne. Ph.D. thesis. Available at: https://infoscience.epfl.ch/handle/20.500.14299/141466.
Rixhon, X., Tonelli, D., Colla, M., Verleysen, K., Limpens, G., Jeanmart, H., et al. (2022). Integration of non-energy among the end-use demands of bottom-up whole-energy system models. Front. Energy Res. 10, 1–9. doi:10.3389/fenrg.2022.904777
Sacchi, R., Becattini, V., Gabrielli, P., Cox, B., Dirnaichner, A., Bauer, C., et al. (2023). How to make climate-neutral aviation fly. Nat. Commun. 14, 3989. doi:10.1038/s41467-023-39749-y
Shukla, P. R., and Skea, J. (2022). Climate change 2022: mitigation of climate change. contribution of working group iii to the sixth assessment report of the intergovernmental panel on climate change.
Ueckerdt, F., Bauer, C., Dirnaichner, A., Everall, J., Sacchi, R., and Luderer, G. (2021). Potential and risks of hydrogen-based e-fuels in climate change mitigation. Nat. Clim. Change 11, 384–393. doi:10.1038/s41558-021-01032-7
Keywords: sustainable aviation fuel, carbon flows, e-bio-fuel, carbon neutrality, Fischer–Tropsch, energy system model
Citation: Merceron L, Boissonnet G and Maréchal F (2024) Climate neutrality of the French energy system: overview and impacts of sustainable aviation fuel production. Front. Energy Res. 12:1359641. doi: 10.3389/fenrg.2024.1359641
Received: 21 December 2023; Accepted: 08 July 2024;
Published: 28 August 2024.
Edited by:
Biagio Fernando Giannetti, Paulista University, BrazilReviewed by:
Hakan Aygun, Firat University, TürkiyeSelcuk Ekici, Iğdır Üniversitesi, Türkiye
Derviş Erol, Kırıkkale University, Türkiye
Copyright © 2024 Merceron, Boissonnet and Maréchal. This is an open-access article distributed under the terms of the Creative Commons Attribution License (CC BY). The use, distribution or reproduction in other forums is permitted, provided the original author(s) and the copyright owner(s) are credited and that the original publication in this journal is cited, in accordance with accepted academic practice. No use, distribution or reproduction is permitted which does not comply with these terms.
*Correspondence: Louis Merceron, bG91aXMubWVyY2Vyb25AY2VhLmZy