
94% of researchers rate our articles as excellent or good
Learn more about the work of our research integrity team to safeguard the quality of each article we publish.
Find out more
ORIGINAL RESEARCH article
Front. Energy Res., 03 April 2024
Sec. Smart Grids
Volume 12 - 2024 | https://doi.org/10.3389/fenrg.2024.1359596
This article is part of the Research TopicAI-based Energy Storage SystemsView all 11 articles
 A. Rammohan1*
 Yong Wang2Subbu Kannappan S3Suresh Kumar P1Bragadeshwaran Ashok4
 Hossam Kotb5
 Kareem M. AboRas5*
 Amr Yousef6,7*
Durability is a desired characteristic for all battery packs in Electric Vehicles. In this study, the service life of the EV battery pack under real-world operating conditions is projected using an Arrhenius mathematical simulation model. The model comprises a 39.2 kWh EV Lithium-Ion battery pack integrated with a three-phase inverter to convert the battery pack’s Direct Current output to Alternating Current. In addition, the Alternating Current output is coupled to a 100 kW permanent magnet synchronous motor, which is regarded as the load. A field-oriented controller provides pulse width-modulated output signals that are supplied back to the inverter to generate the correct driving current. Variable conditions of charge rate (C-rate: 1.25C − 4C), discharge rate (C-rate: 0.5C − 4C), temperature (25°C–60°C), and depth of discharge (30%–90%) are evaluated to determine the battery pack’s service life. Under a 4C charge rate/0.5C discharge rate and 50% depth of discharge, the modeling results indicate the battery pack has a service life of approximately 6,000 h at low temperatures (25°C) and roughly 3,000 h at high temperatures (60°C). The model has been validated by comparing the results with experimental data from the literature.
Internal combustion (IC) engine-powered vehicles have been extensively used for transportation for over a century. The emissions from vehicles have significantly polluted the environment and thereby caused atmospheric changes. Also, the limited availability of petroleum resources, stringent emission norms, and ever-increasing prices have encouraged research into various clean and green energy transportation technologies. One such technology is Electric Vehicles (EVs), which have various advantages such as zero-emission and potential for energy-saving (Hill et al., 2019), less running cost (Weldon et al., 2018), and higher efficiency (Wang and Li, 2016; Somakettarin and Pichetjamroen, 2019; Somakettarin et al., 2023) as compared to IC engine vehicles. A 1% increase in the number of electric vehicles sold in a city can lower CO2 emissions by 0.096% locally and 0.087% in a neighboring city. Second, EVs have an indirect impact on CO2 emissions via substitution, energy consumption, and technological effects. Increasing renewable energy generation by 1% leads to a 0.036% reduction in EV carbon footprint (Wang et al., 2018). Lithium-ion batteries (LIBs) are compact compared to other battery technologies. LIBs also possess higher specific energy, high discharge current, low self-discharge rate, and long life. These characteristics help to achieve higher power efficiency because the cell can retain the charge for a longer time.
The LIB self-discharge rate is 0.5% monthly when not in use under normal conditions (Wang et al., 2018). Recent EVs have a battery service contract that promises the battery for a particular duration, typically 5–8 years, or a distance such as nearly 100,000 km. When driving, an EV generally consumes one kWh of energy to travel about 4.5–6.5 km (3–four miles). In adverse conditions, the performance of the battery is greatly affected due to its temperature and depth of discharge (DOD), and the service life is reduced (Tufail et al., 2023). The service life of the battery can be estimated through electrical equivalent circuit modeling, which helps to determine the open-circuit voltage, terminal voltage, current, State of Health (SOH), and State of Charge (SOC). Among these parameters, SOC is an important factor being investigated to determine the amount of energy inside a battery to drive an EV. The other prominent models in the involved literature are the electrochemical model (Rahman et al., 2016; Wang et al., 2023), the equivalent circuit model (Kunwar et al., 2023), and the data-driven model (Li et al., 2020; Zhang R. et al., 2023).
Many research works on battery life estimation focus only on electrochemical mathematical models, thermal models, and a few data-driven models (Zhang X. et al., 2023). For example, Rahman et al. (Rahman et al., 2016) utilized particle swarm optimization (PSO) to identify electrochemical model parameters such as solid-phase diffusion coefficient at the positive and negative electrodes and intercalation/de-intercalation at the anode and the cathode. According to Sung’s experimental results, the battery model developed considering these parameters was reasonably accurate. Wang et al. (Wang et al., 2023) demonstrated the high-accuracy prediction of the electrochemical model, but the simulation of the model required substantial computational effort. The reason behind preferring the electrochemical model is its ability to obtain an accurate evaluation within LIB. Still, it is difficult to identify the parameters of battery electrochemistry in real-time applications. Besides these models, the equivalent circuit model has been adopted extensively in real-time applications due to its highly simplified structure and relatively fewer model parameters (Zhang et al., 2021). The typical framework of the equivalent circuit model consists of several resistor-capacitor networks where the number of networks is the order of the model. The key is whether the electric energy used to charge the EV battery is produced using renewable energy. If the battery is charged using typical thermal power generation, EVs do not significantly contribute to carbon emission reductions. However, most renewable energy sources are intermittent, creating spatial and temporal gaps between energy availability and use by end users (Lu et al., 2022). To address these difficulties, adequate energy storage devices, such as batteries for the power grid, and full usage of renewable energy are required (Sun et al., 2019). In comparison to these models, data-driven models, such as support vector machines (Chen et al., 2019) and neural networks (Wang et al., 2017), describe the electrical behavior of the LIB without prior knowledge. However, the performance of the data-driven models depends on the possibility of capturing the data for the entire operational range of the battery (Sha et al., 2024).
As there is a considerable possibility of LIBs being subjected to fast charging and discharging at extreme cycling conditions more often, the study of thermal behaviour becomes crucial because it has a direct effect on performance and service life. Also, it is seen that the heat generation in the battery pack has a notable impact on the fading of the capacity (Richter et al., 2017). Charging the LIB at 0–45°C and discharge at 0–55°C is generally safe. Numerous models such as heat transfer, data-driven, and heat generation models have been investigated and established for capturing thermal behaviour for service life estimation (Shen et al., 2024). Guo et al. (Wali et al., 2021) developed a multi-physics heat transfer model capable of accurately predicting electrical and thermal behaviour. The model is also flexible enough to be coupled with other multi-physics equations to carry out system analysis effectively. Also, the three-dimensional heat transfer models can effectively obtain the distribution of the temperature inside the LIB, which helps to detect hot spots. The developed heat generation model uses the internal resistance of the battery and heat generation as a result of Joule’s heating and entropy change (Liu et al., 2019).
The various studies show that the electrical and thermal effects significantly affect the LIB. The electrical and thermal behaviour are coupled as electro-thermal models to capture the above-said variations efficiently and simultaneously (Zhang et al., 2016). Yang et al. proposed an electro-thermal model that considers the relationship between the electrochemical and thermal behaviour of the cell to predict the behaviour of the battery under different drive cycles (Yang et al., 2019). While battery technologies are constantly improving to increase reliability and efficiency, the estimation of the actual SOC and SOH is extremely crucial. Li-ion cells degrade over time due to the growth of solid electrolyte interface and electrolyte decomposition (Wang et al., 2017). The SOC and SOH degradation of the cell is affected directly (Li et al., 2022; Xu et al., 2023).
LIB SOH is estimated using its voltage, current, and discharge-charge cycles to indicate its lifespan. Although all these parameters indicate the SOH, capacity is used for simplicity to estimate the lifetime under different cycling conditions (Marques et al., 2019). However, because the capacity cannot be directly measured online, there is a requirement to establish a quantitative relation between various measurable parameters of the battery and the capacity for SOH estimation (Li et al., 2019). It was found in the literature that the resistances (ohmic and polarization resistance) are the major contributing factors to capacity loss and can be useful in predicting battery life (Zhu et al., 2023).
The real-time life estimation of solid-state electronics based on the Arrhenius model is used to detect the failure of any device that is experimented with and projected to estimate the lifetime in hours concerning the change in temperature at its junction (R et al., 2021), which is an intuitive idea for this research. The accuracy of the battery lifetime estimation greatly depends on aging effects and capacity fade. Ashwin et al. (Ashwin et al., 2016) developed a P2D model that considers electrochemical processes to study the aging of the batteries under repeated loading conditions. This model integrates all the essential electrical and chemical processes under a valuable algorithm for the battery monitoring system (Huang et al., 2022).
Yonemoto et al. (Yonemoto YKTIKO, 2020) invented a capacity prognostic device that determines a prediction function coefficient using capacity degradation of the battery (capacity fade). Also, García et al. (García et al., 2023) proposed a novel test methodology that is useful for predicting the remaining capacity of the cell after every cycle of discharge and charge. The parameters are considered for investigating the battery charge and discharge cycling effect due to the varying DOD between 20% and 100% DOD, discharge rates, charge rates, and operating temperatures −18°C to 40°C. The results indicate that the negative effect of higher temperatures can affect lifetime and performance. Wang et al. (Wang et al., 2011) indicated the effect of cycling on the capacity fade of LiFePO4 cells. The test conditions include the DOD that varies from 90% to 10%, operating temperature ranging from −30°C to 60°C, and discharge current varying from 1 A to 20 A. The experimental results indicate a larger impact of temperature and time on capacity loss than the DOD (Zhou et al., 2024).
While determining battery health is vital, it is equally important to predict the end of life for LIB, as it helps to take preventive and corrective measures to avoid unintended problems (Zhang et al., 2022). Berecibar (Berecibar et al., 2016) discussed the testing procedures and developed an estimation model for the SOH of the battery, which is useful for forecasting its life. The cells were subjected to extensive cycling and operating conditions such as operating temperatures, discharge-charge rate, and DOD, with results indicating the greater accuracy of the proposed model. Hoyul et al. (Yul Yongin-si et al., 2013) patented a prediction system that comprises a learning data input unit, target data input, and machine learning to assign the weights to battery factors in data input. The prediction system consists of a lifetime prediction unit for indicating the lifetime of a battery cell. Energy Storage Systems (ESS) are subdivided into four major categories such as chemical, mechanical, thermal, and electromechanical systems (Hannan et al., 2021). Hossain Lipu et al. stated that SOC assessment under hundreds of lithium-ion battery cells in EV operation remains unresolved (Hossain Lipu et al., 2020). Yu et al. estimated SOC for a series-parallel LIB equivalent circuit through an OCV-SOC-temperature relationship (Yu et al., 2023).
Table 1 shows the types of batteries considered for investigation and its algorithm and research outcome in a nutshell related to battery lifetime estimation along with the current proposed work. Considering various models discussed in this section, our method has the advantage of using PMSM as load whereas other models considered only RC or RLC load. Another advantage of our method is that it considers all critical parameters of the battery pack such as temperature, charge-discharge rate, and DOD which estimates the lifetime precisely (Mu et al., 2021). The novelty or contribution of the current proposed work is summarized as follows. The study of the existing literature indicates that most of the work regarding the modeling and estimation of the SOH was carried out on the Li-ion cells. It has been observed from the various models discussed in the literature that real-time pack-level battery capacity models were absent for EVs. In addition, a literature gap was found, indicating that no model considered the PMSM load. Most of the authors considered resistive load or RLC load in their simulation work. It was also found from the literature that parameters such as temperature, discharge rate, or DOD have been considered individually in the previous work (Lü et al., 2024). Considering the research gaps, the contribution or novelty of this proposed work uses a mathematical model of PMSM drive that comprises a LIB battery-pack and PMSM in MATLAB-Simulink environment for the lifetime estimation of the pack considered, which considers various operating working conditions such as operating temperature, discharge–charge rates, and DOD. It is assumed that the internal resistance of the battery cell is constant during the charging and discharging cycle and will not change with the current. In this paper, for example, 4C/4C, which is intended as the discharge/charge rate, is considered.
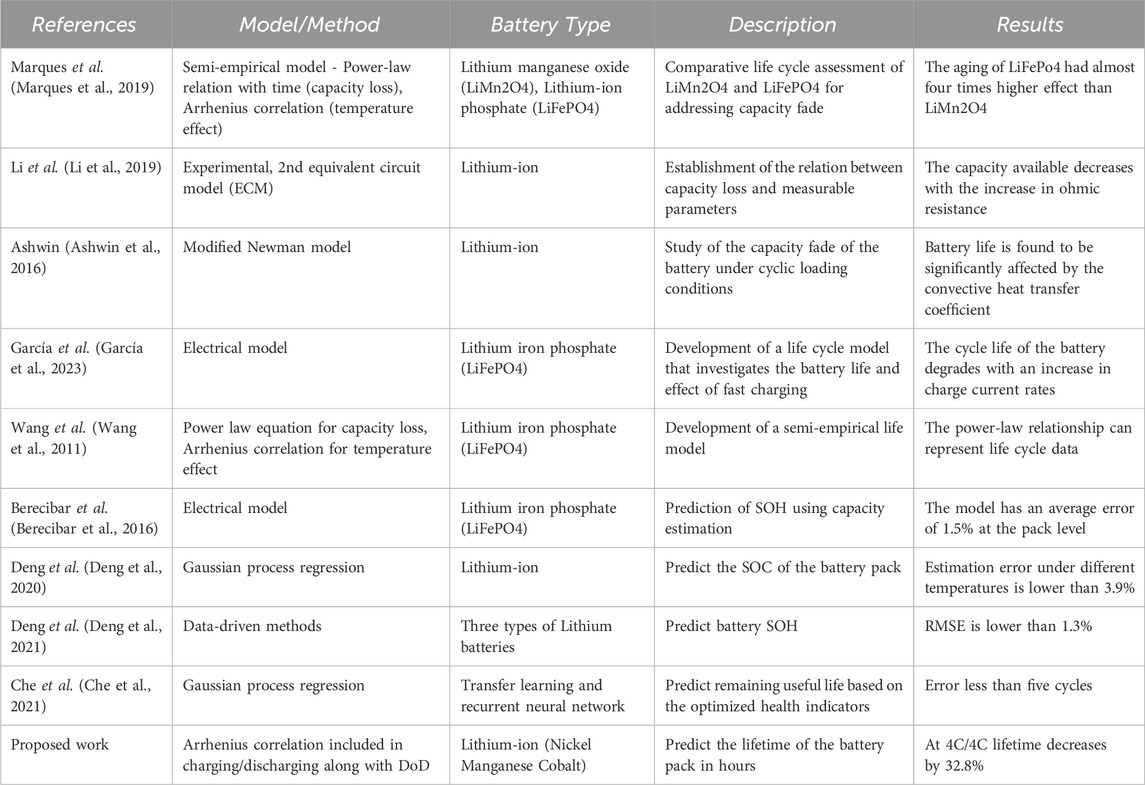
Table 1. Summary of representative battery life estimation models.
This work considers the battery pack voltage of 327 V and the current of 119.87 Ah. The entire battery pack is charged at rates of 1.25C, 2C, 3C, and 4C and discharged at 0.5C, 1C, 2C, and 4C, respectively. During the operation, the temperature, SOC, and depth of charge are considered inputs to the model. The battery pack is cycled continuously at various charge-discharge rates that depend on the required motor power. The complete system is controlled by a field-oriented controller that uses pulse width modulation to control the motor voltage. Finally, the capacity degradation of the entire pack is analyzed using the data obtained through simulation to predict the useful lifetime.
The rest of this paper is organized as follows: Section 2 describes a model-based design for PMSM along with a battery pack, inverter and discharge model. It is followed by Section 3, which deals with the overall model along with results and discusses the proposed system. Finally, Section 4 concludes the work.
The lifetime estimation model proposed in this work primarily consists of a battery pack, a three-phase inverter, a Permanent Magnet Synchronous Motor (PMSM), and a field-oriented controller (FOC) along with position sensors. The specifications are similar to the commercially available EV battery pack as given in Table 2 and are taken as a benchmark to model the PMSM Drive shown in Figure 1.

Table 2. Model specifications.
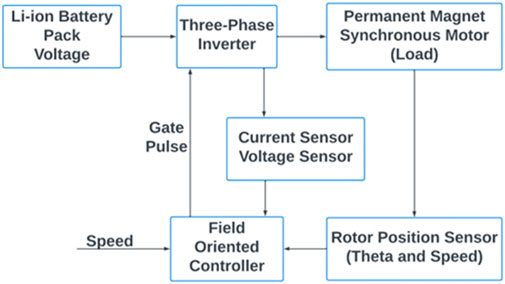
Figure 1. PMSM drive powered by the battery pack.
The LIB pack generates power to the PMSM (acts as the load) through a three-phase inverter that converts the DC voltage to a three-phase AC supply. The voltage and current are monitored by voltage and current sensors, respectively. The field-oriented controller is used to control and drive the motor using a sensor feedback loop to produce gate pulses. The primary function of a field-oriented control algorithm is to take a user-defined voltage uq and, by continually reading the relative position of the motor rotor, determine the proper phase voltages ua, ub, and uc. The FOC algorithm generates phase voltages that form a magnetic field in the motor’s stator that is 90° “behind” the permanent magnets of the rotor, resulting in a pushing effect. The Rotor Position Sensor is used to determine the rotating angle of any rotary application, especially PMSM. Rotor position sensors are mandatory for effective and trustworthy control of PMSM (Bhardwaj, 2013). The elaborate model of Figure 1 block diagram is shown in Figure 4.
The LIB pack model developed using MATLAB SIMULINK is shown in Figure 2. The battery pack is subdivided into sub-battery packs, and each pack is connected into a series of parallel combinations. The full battery pack is attached to the main model, as shown in Figure 4. The phosphate LIB is considered a potential battery technology that could be utilized in automotive applications due to its thermal and electrical stability. This battery type also offers good electrical performance with low resistance.
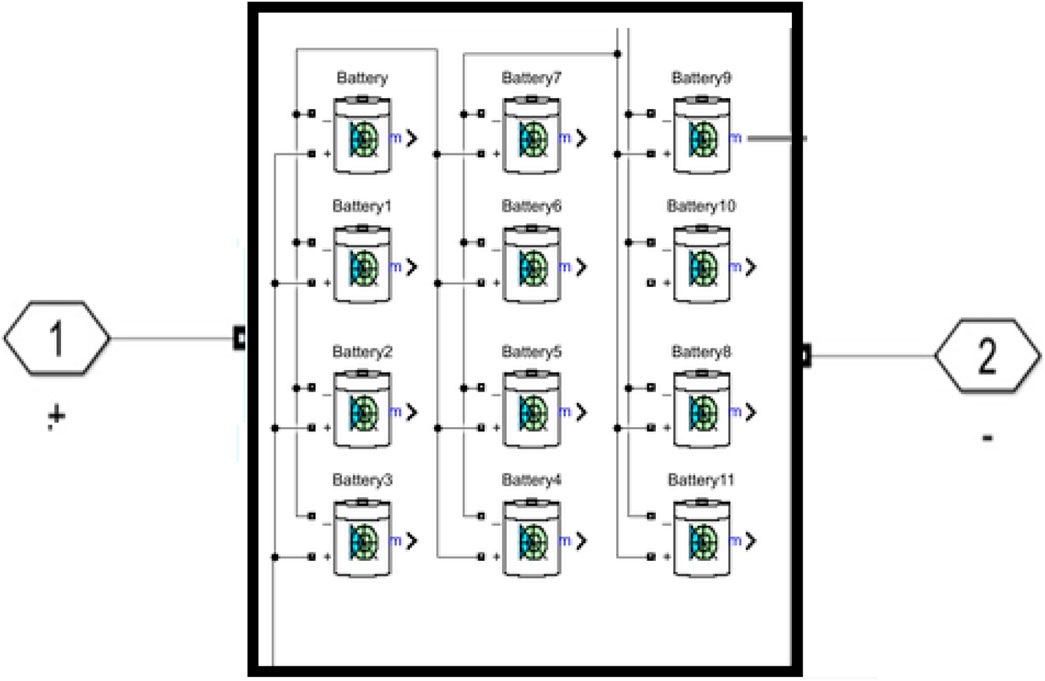
Figure 2. Battery pack model.
The capacity of the modeled battery pack is 39.2 kWh. The cells are LFP - A123 ANR 26650. More specifications of the battery cell are given in Table 3.
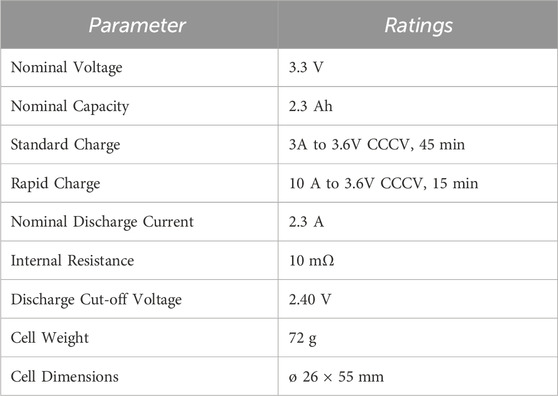
Table 3. Specifications of the battery cell.
The number of cells calculated using Eq. 1 and 2 (Buchmann, 2017) indicates approximately 102 cells in series combination as a single pack, and a 53 - single pack is connected in parallel combinations to deliver 39.2 kWh. Overall, the battery pack consists of 5,406 cells with a weight of approximately 389.2 kg.
A modified Shepherd’s model is used to describe the voltage dynamics of the Li-ion battery pack (Wang et al., 2023). The equivalent discharge-charge model of the Li-ion battery shown in Figure 3 consists of an internal resistance of approximately 10 mΩ, which leads to a voltage drop based on the battery chemistry. The temperature is an important factor that affects the performance of the LIB in terms of pack voltage, discharge capacity, charge-discharge characteristics, and power capability. The variation in the battery voltage that considers the impact of temperature in the case of discharge and charge conditions is represented by Eq. 3 and 4, respectively. It is assumed that the internal resistance, R, is dependent on the operating temperature of the battery (An et al., 2023). The remaining useful time ‘t’ in hours in the Arrhenius model included in the charging and discharging Eq. 3 and 4 is acquired through the SIMULINK model for each second.
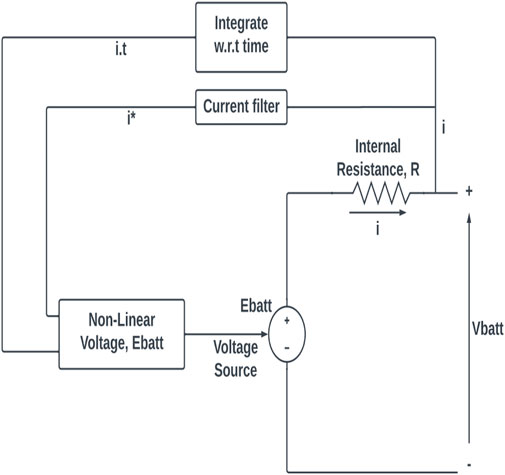
Figure 3. Discharge-charge battery model.
In Eq. 3 and 4, the terms are
The overall heat generated PL during the process of discharging and charging is expressed with the help of Eq. 9 (An et al., 2023).
The aging of the battery pack is one of the major issues in EV technology and has considerable effects, such as an increase in charging losses, which results in reduced efficiency, a decrease in driving range, and a reduction in acceleration. The available energy inside the pack is lost gradually as the active material inside transforms into an inactive phase. This energy reduction is represented by a factor called the aging factor that is dependent on the percentage of the battery that has been discharged (DOD) as defined in Eq. 10. The impact of the constant discharging and charging process on the battery capacity is indicated by Eq. 11 (An et al., 2023).
Here,
The three-phase inverter is used to convert direct current from LIB (327 V and 39.2 kWh) into AC for powering variable speed PMSM that acts as the load. The model developed is a 180° conduction mode type in which three switches are ‘on’ at any instant and the gate pulses switch the device to an ‘on’ or ‘off’ position based on the signals from the motor controller. Table 4 indicates the PMSM phase voltages Va, Vb, and Vc based on the variation of the load. A capacitor is connected in parallel to the RL circuit (equivalent stator winding circuit) to reduce voltage fluctuations. This ensures that sinusoidal current is generated from the inverter, as explained in Eq. 12 is generated from the inverter (Buchmann, 2017).
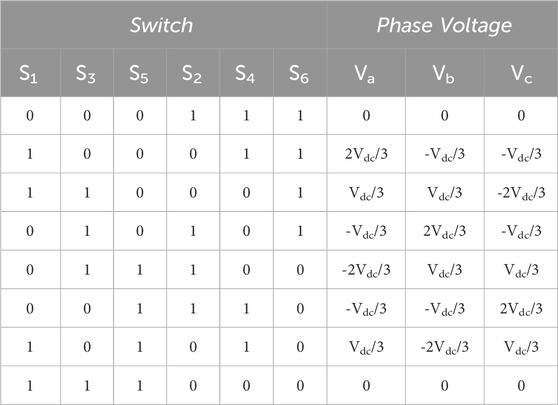
Table 4. Phase Voltages of the Three-Phase Inverter (1 indicates ON and 0 indicates OFF).
A permanent magnet synchronous motor (PMSM) is modeled and integrated with the drive system as a load that acts on the battery pack. It consists of three-phase windings in the stator and permanent magnets in the rotor. Each stator winding consists of inductance and resistance connected in series with the input being the voltage applied to the armature of the motor and the output is the angular motion (position) of the shaft. The electromagnetic current flowing across each of the stator windings (iA, iB, iC) is calculated using Eq. 13, which considers the back emf and the motor torque constant (Buchmann, 2017).
The angular acceleration of the shaft and the speed during rotation are found using Eq. 14 and 15 (Krishnan, 2017).
In a balanced three-phase machine, the summation of the three-phase currents is zero as given by Eq. 16. However, this equation does not hold if there is an imbalance in voltage or current.
To calculate torque, Park’s transform is used, which transforms the stator winding currents to id’, iq’, i0’ frame (independent of rotor angle) as represented in Eq. (17)-19) (Krishnan, 2017).
where,
The current i0 represents the imbalance in A, B, and C phase currents and can be taken as the zero-sequence component of the current. The mathematical models of the Li-ion battery pack, inverter and the developed PMSM are integrated with a Field Oriented Controller to construct an electric drive system, which is shown in Figure 4. Based on battery configuration the total voltage is 327 V and the current is 119.87 Ah, which is considered for vehicle operation. The entire battery pack is charged at charge rates of 1.25C, 2C, 3C, 4C and discharged at 0.5C, 1C, 2C, 4C, respectively. During the operation, the temperature, SOC, and depth of charge are considered as input to the model. Based on these inputs, the pack is cycled continuously at various charge-discharge rates that depend on the power required by the motor. The entire drive system is controlled by a field-oriented controller, which uses pulse width modulation to control the load voltage. Finally, the capacity degradation of the entire pack is analyzed to predict the useful lifetime.
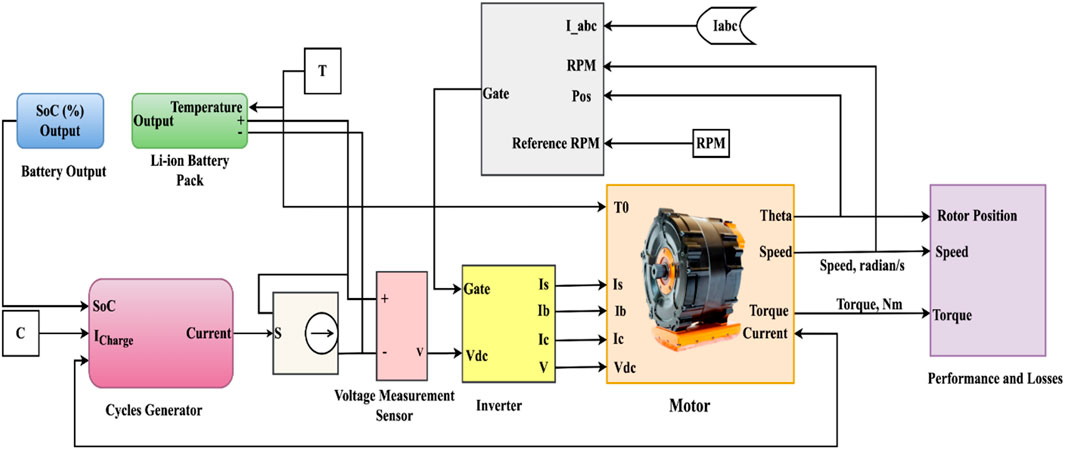
Figure 4. EV drive system.
The drive model shown in Figure 4 is developed using MATLAB-Simulink (R2019a) with mathematical equations to carry out cycling of the battery pack under varying conditions of discharge rate (0.5C, 1C, 2C, 4C) and charge rate (1.25C, 2C, 3C, 4C).
Here, C indicates the charge capacity of the pack. For example, if the capacity of the battery is 2.3Ah for a cell, then 0.5C denotes 1.15A. The battery temperature considered in this work is 25°C, 40°C, 50°C and 60°C with the DOD as 80%, 70%, 60%, 50%, 40%, and 30%, respectively. In addition, the pack is considered to have reached its end of life when the available capacity reduces to 80% of the actual capacity. The methodological validation of the proposed model is compared with Wang et al. experimental results. As shown in Figures 5A,B, the capacity loss results of a cell model are validated for a 0.5C discharge rate at a battery temperature of 60°C. The analysis of the results obtained in Figure 5A indicates a maximum variation of approximately 9.7% at 0.5C discharge rate, operating temperature of 60°C and 80% DOD, whereas a variation of 6.5% is observed at 50% DOD (Figure 5B) with the rest of the conditions remaining the same. Therefore, the mathematical model developed to estimate lifetime produces results that are closer to the experimental outcome (Wang et al., 2011). The battery pack, which is modeled using the validated LiFePO4 cell, is tested under varying conditions of C-rate, operating temperature, and DOD as described earlier, with the PMSM acting as the load. The life of a battery pack can be estimated using various methods and parameters. In this work, the lifetime of battery packs is estimated in hours using Eq. 3 and 4, which involve battery pack capacity, charging, discharging, and battery temperature.
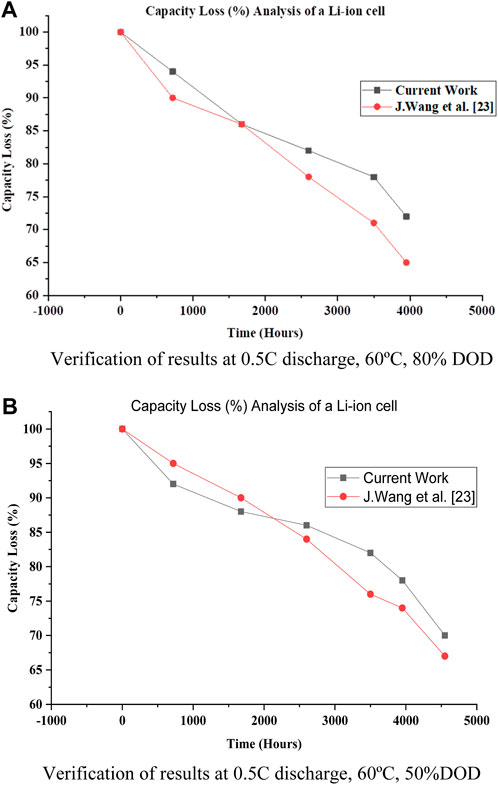
Figure 5. Capacity loss comparison at 50% and 80% DOD. (A): Verification of results at 0.5C discharge, 60°C, 80% DOD. (B): Verification of results at 0.5C discharge, 60°C, 50% DOD.
Figure 6A indicates the degradation of battery pack capacity when it is subjected to varying C-rates (both discharging and charging) at the conditions of 40% DOD and the battery operating temperature at 25°C. From the analysis that considers the 4C constant discharge rate, it is seen that the lifetime reduces from 1,463 h–867 h as the charge rate increases from 1.25C to 4C. Similarly, when the charging rate is kept constant at 4C, the lifetime is seen to reduce drastically from 6,675 h–867 h as the discharge rate increases to 4C. As the battery operating temperature is increased to 40°C (Figure 6B) at a discharge rate of 4C, it is seen that lifetime reduces from 1,093 h–648 h as the charge rate increases from 1.25C to 4C. Similarly, when the charging rate is kept constant at 4C, the lifetime is seen to reduce drastically from 4,988 h–648 h as the discharge rate increases to 4C. In the case of 50°C (Figure 6C) with the same conditions, at a 4C constant discharge rate, the lifetime is seen to drop from 913 h to 542 h as the charge varies from 1.25C to 4C; at the 4C constant charge rate, the lifetime drops from 4,169 h–542 h as the discharge rate increases to 4C.
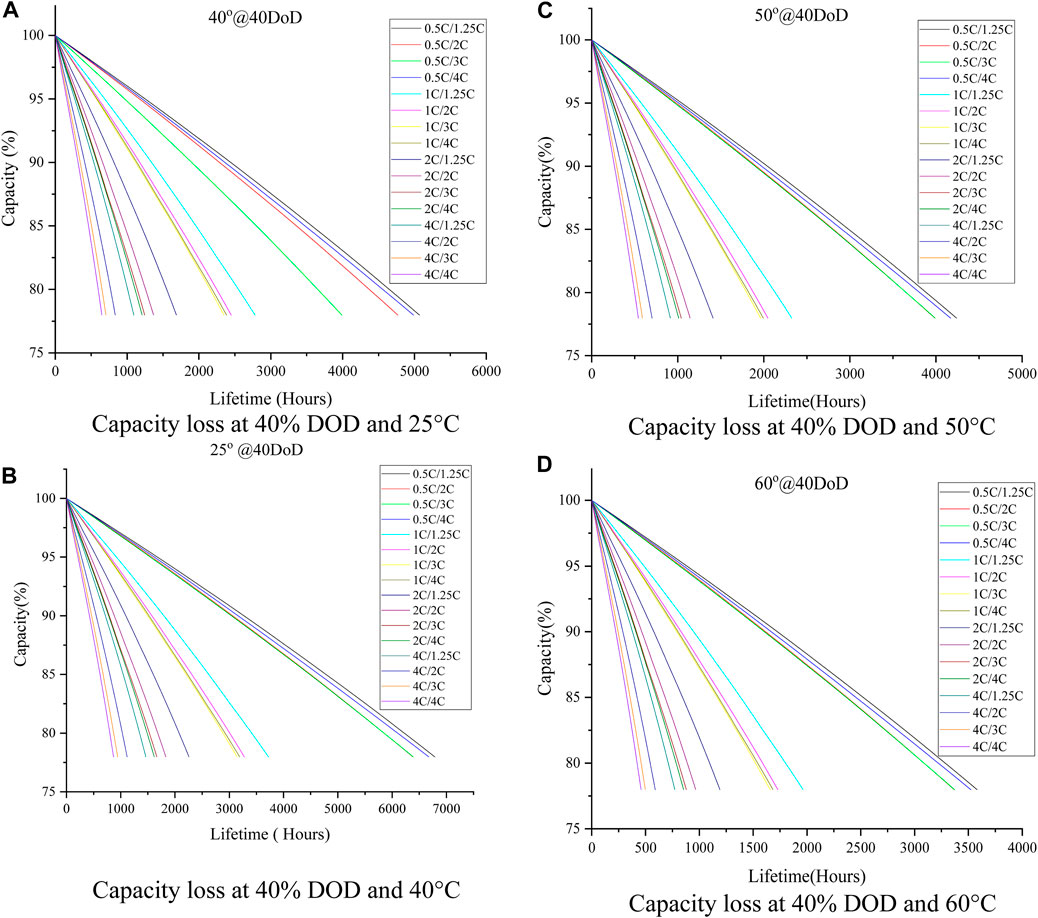
Figure 6. Capacity loss at 40% DOD. (A): Capacity loss at 40% DOD and 25°C (B): Capacity loss at 40% DOD and 40°C (C): Capacity loss at 40% DOD and 50°C (D): Capacity loss at 40% DOD and 60°C.
Correspondingly, at 60°C (Figure 6D), the lifetime is observed to drop from 772 h to 458 h as the charge rate varies from 1.25C to 4C at a discharge rate of 4C and from 3,522 h–458 h as the discharge rate increases to 4C that considers 4C charge rate. Also, it is noticed that with the increase in temperature to 60°C at constant discharge and charge rate of 0.5C/1.25C, the lifetime reduces from 6,786 h (at 25°C) to 3,580 h (at 60°C). At the same time, at a constant discharge and charge rate of 4C/4C, the lifetime is reduced from 867 h (at 25°C) to 458 h (at 60°C).
On carrying out the analysis at 80% DOD (Figure 7) under the same conditions of discharge-charge rates and operating temperatures, the trend remains the same. However, with the rise in DOD, the lifetime is seen to be reduced significantly. Considering the 4C discharge rate at 25°C (Figure 7A), the lifetime of the pack reduces from 1,094 h–583 h as the charge rate increases to 4C, whereas, at 4C charge rates, there is a drastic reduction from 4,253 h–583 h as the discharge rate increases. As the battery operating temperature is increased to 40°C (Figure 7B) at a discharge rate of 4C, it is seen that lifetime reduces from 817 h to 435 h as the charge rate increases from 1.25C to 4C. Similarly, when the charging rate is kept constant at 4C, the lifetime is seen to reduce drastically from 3,178 h–583 h as the discharge rate increases to 4C. In the case of 50°C (Figure 7C) with the same conditions, at the 4C constant discharge rate, the lifetime is seen to drop from 683 h to 364 h as the charge varies from 1.25C to 4C; at the 4C constant charge rate, the lifetime drops from 2,655 h–364 h as the discharge rate increases to 4C. Correspondingly, at 60°C (Figure 7D), the lifetime is observed to drop from 577 h to 307 h as the charge rate varies from 1.25C to 4C at a discharge rate of 4C and from 2,244 h–307 h as the discharge rate increases to 4C that considers 4C charge rate. However, it is noticed that with the increase in temperature to 60°C at a constant discharge and charge rate of 0.5C/1.25C, the lifetime is reduced from 4,865 h (at 25°C) to 2,567 h (at 60°C). At the same time, at a constant discharge and charge rate of 4C/4C, the lifetime is reduced from 583 h (at 25°C) to 307 h (at 60°C).
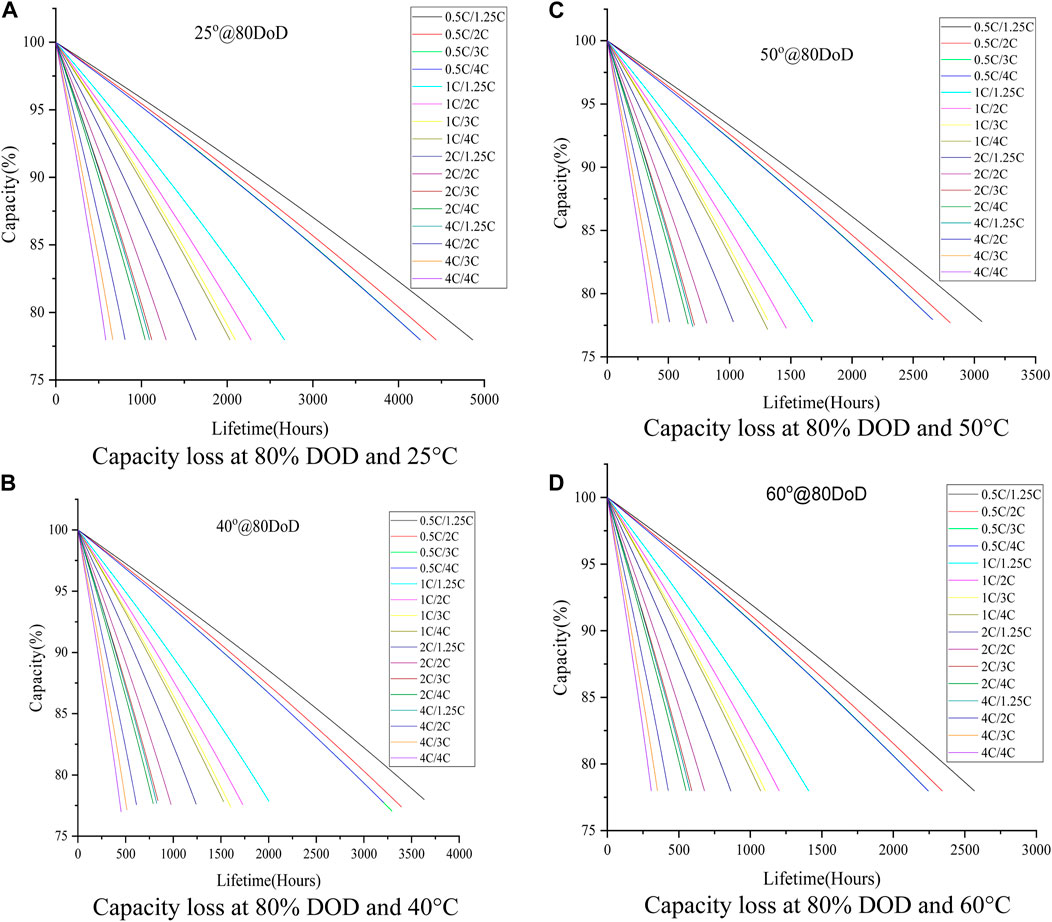
Figure 7. Capacity loss at 80% DOD. (A): Capacity loss at 80% DOD and 25°C (B): Capacity loss at 80% DOD and 40°C (C): Capacity loss at 80% DOD and 50°C (D): Capacity loss at 80% DOD and 60°C.
At a given discharge-charge rate, the battery pack cycled at DOD greater than 50% was observed to reach the end of life early as compared to 40% of DOD. Also, as the operating temperature and DOD increase, the estimated lifetime of the pack decreases due to the degradation in capacity. For instance, considering the 2C discharge and 4C charge rate, the remaining life is approximately 2,000 h at the operating temperature of 25°C and 30% DOD. However, as the temperature increases to 60°C, which keeps the DOD at 30%, the remaining life drops to 1,056 h. Because the battery is continuously cycled at the represented charge-discharge rates, the life (in hours) is low. Here, the remaining life is analyzed for the 4C charge rate condition because this analysis indicates the worst-case scenario clearly as compared to lower charge rates. The results are tabulated in Table 5, which indicates the best case and worst case for the operation of the battery pack, along with the travel range in kilometers (km). With a 1C discharge rate, the optimum distance range is 205,010 km, and the worst condition is 65,105 km. The kilometer range is calculated by multiplying the life (hours) with the average economy speed of the EV, 50 km/h (Iclodean et al., 2017).
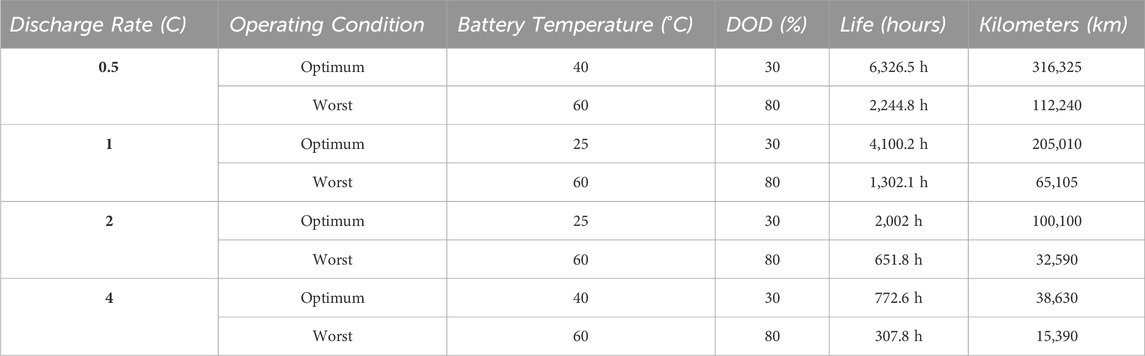
Table 5. Effect of temperature and DOD on life (in hours) at 4C rate.
The numerical calculation of the kilometer travelled at 1C discharge rate, which is calculated by Eq. (19).
205,010 km = 50 × 4,100.2 h.
At a particular C-rate, it is observed that the pack cycled at greater DOD reaches the 80% end-of-life condition sooner as compared to the condition at lower DOD. This observation is clearly shown in Figure 8 using two cases: 0.5C discharge/1.25C charge rate and 4C discharge/4C charge rate to show the effect at lower C-rate and higher C-rate conditions. Also, it is evident that with the rise in operating temperature, the expected lifetime decreases drastically in both cases. Therefore, the graph in Figure 8 shows the range within which the lifetime (in hours) of the pack may vary due to changes in the operating conditions.
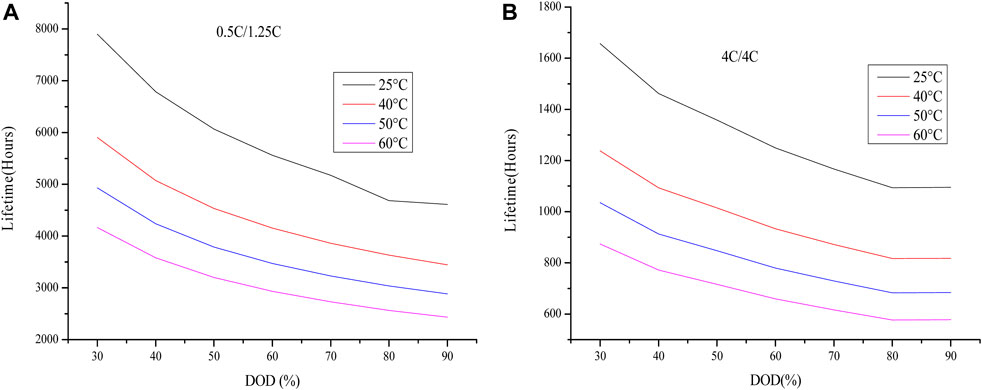
Figure 8. Capacity loss at different C-rate. (A) Lifetime loss at 0.5 C/1.25 C (B) Lifetime loss at 4C.
The remaining useful life of the battery pack in the Permanent magnet synchronous motor drive is analyzed through mathematical modeling of the Lithium ion pack, three-phase inverter, and Permanent magnet synchronous motor. A 327 V, 119.87 Ah battery pack, 180⁰ conduction mode inverter, and 100 kW, 395 Nm permanent magnet synchronous motor available in the market are considered. The battery is modeled considering the operating temperature and aging effects (cycling). The effect of the parameters -- discharge-charge rate, operating temperature, and Depth of Discharge on the battery pack is investigated considering the Permanent magnet synchronous motor as the current drawing load. The results indicate that the lifetime of the Li-ion battery pack is largely dependent on the discharge rate and operating temperature, and the effect of the charge rate and the Depth of Discharge is comparatively less.
The self-discharge phenomenon that affects calendar aging is not considered for this modeling. Consideration of these parameters for estimating the lifetime of the Li-ion battery pack that powers the Permanent magnet synchronous motor drive will yield more accurate results in comparison. However, the results obtained from the work attempt to estimate the lifetime under critical conditions that the battery pack may be subjected to during its service life. The results of the proposed work are summarised as follows:
• At 40% Depth of Discharge, as the operating temperature of the pack is maintained at 25°C, the lifetime predicted is in the range of 6,786 h–867 h. However, when its operating temperature reaches 60°C, the predicted lifetime is in the range of 3,580 h–458 h.
• At severe conditions, about 80% Depth of Discharge when the operating temperature is maintained at 25°C, the lifetime is in the range of 4,865 h–583 h. As the operating temperature is close to 60°C, the lifetime is expected to range from 2,567 h–307 h.
• Upon analysis of the effect on lifetime predicted by the increase in DOD from 40% to 80%: At a 0.5C/1.25C rate, it is seen that the lifetime decreases by 28.3%. At the 4C/4C rate, it is seen that the lifetime decreases by 32.8%
The results obtained can be used along with machine learning algorithms to predict the lifetime for additional conditions. Also, the real-time experimental work leads to accurate data that is helpful for precise battery life estimation. However, the cost of the battery pack is too high to carry out the experimental work.
The original contributions presented in the study are included in the article/Supplementary Material, further inquiries can be directed to the corresponding authors.
RA: Conceptualization, Data curation, Formal Analysis, Funding acquisition, Investigation, Methodology, Project administration, Resources, Software, Supervision, Validation, Visualization, Writing–original draft, Writing–review and editing. YW: Conceptualization, Data curation, Formal Analysis, Funding acquisition, Investigation, Methodology, Project administration, Resources, Software, Supervision, Validation, Visualization, Writing–original draft, Writing–review and editing. SK: Conceptualization, Data curation, Formal Analysis, Funding acquisition, Investigation, Methodology, Project administration, Resources, Software, Supervision, Validation, Visualization, Writing–original draft, Writing–review and editing. SK: Project administration, Resources, Software, Supervision, Validation, Visualization, Writing–original draft, Writing–review and editing, Conceptualization, Data curation, Formal Analysis, Funding acquisition, Investigation, Methodology. BA: Conceptualization, Data curation, Formal Analysis, Funding acquisition, Investigation, Methodology, Project administration, Resources, Software, Supervision, Validation, Visualization, Writing–original draft, Writing–review and editing. HK: Conceptualization, Data curation, Formal Analysis, Funding acquisition, Investigation, Methodology, Project administration, Resources, Software, Supervision, Validation, Visualization, Writing–original draft, Writing–review and editing. KA: Conceptualization, Data curation, Formal Analysis, Funding acquisition, Investigation, Methodology, Project administration, Resources, Software, Supervision, Validation, Visualization, Writing–original draft, Writing–review and editing. AY: Conceptualization, Data curation, Formal Analysis, Funding acquisition, Investigation, Methodology, Project administration, Resources, Software, Supervision, Validation, Visualization, Writing–original draft, Writing–review and editing.
The author(s) declare that no financial support was received for the research, authorship, and/or publication of this article.
We thank the Vellore Institute of Technology (VIT) and State University of New York (SUNY)-Binghamton University for providing licensed tools for this research.
Author SK was employed by Hyundai Motor India Limited.
The remaining authors declare that the research was conducted in the absence of any commercial or financial relationships that could be construed as a potential conflict of interest.
All claims expressed in this article are solely those of the authors and do not necessarily represent those of their affiliated organizations, or those of the publisher, the editors and the reviewers. Any product that may be evaluated in this article, or claim that may be made by its manufacturer, is not guaranteed or endorsed by the publisher.
An, Z., Zhao, Y., Du, X., Shi, T., and Zhang, D. (2023). Experimental research on thermal-electrical behavior and mechanism during external short circuit for LiFePO4 Li-ion battery. Appl. Energy 332, 120519. doi:10.1016/j.apenergy.2022.120519
Ashwin, T. R., Chung, Y. M., and Wang, J. (2016). Capacity fade modelling of lithium-ion battery under cyclic loading conditions. J. Power Sources 328, 586–598. doi:10.1016/j.jpowsour.2016.08.054
Berecibar, M., Garmendia, M., Gandiaga, I., Crego, J., and Villarreal, I. (2016). State of health estimation algorithm of LiFePO4 battery packs based on differential voltage curves for battery management system application. Energy 103, 784–796. doi:10.1016/j.energy.2016.02.163
Bhardwaj, M. (2013). Application report sensored field oriented control of 3-phase permanent magnet synchronous motors.
Buchmann, I. (2017). Batteries in a portable world - a handbook on rechargeable batteries for non-engineers. 4th. Richmond, Canada: Cadex Electronics.
Che, Y., Deng, Z., Lin, X., Hu, L., and Hu, X. (2021). Predictive battery health management with transfer learning and online model correction. IEEE Trans. Veh. Technol. 70, 1269–1277. doi:10.1109/TVT.2021.3055811
Chen, X., Lei, H., Xiong, R., Shen, W., and Yang, R. (2019). A novel approach to reconstruct open circuit voltage for state of charge estimation of lithium ion batteries in electric vehicles. Appl. Energy 255, 113758. doi:10.1016/j.apenergy.2019.113758
Deng, Z., Hu, X., Lin, X., Che, Y., Xu, L., and Guo, W. (2020). Data-driven state of charge estimation for lithium-ion battery packs based on Gaussian process regression. Energy 205, 118000. doi:10.1016/j.energy.2020.118000
Deng, Z., Hu, X., Lin, X., Xu, L., Che, Y., and Hu, L. (2021). General discharge voltage information enabled health evaluation for lithium-ion batteries. IEEE/ASME Trans. Mechatronics 26, 1295–1306. doi:10.1109/TMECH.2020.3040010
García, A., Monsalve-Serrano, J., Martinez-Boggio, S., and Golke, D. (2023). Energy assessment of the ageing phenomenon in Li-Ion batteries and its impact on the vehicle range efficiency. Energy Convers. Manag. 276, 116530. doi:10.1016/j.enconman.2022.116530
Hannan, M. A., Wali, S. B., Ker, P. J., Rahman, M. A., Mansor, M., Ramachandaramurthy, V., et al. (2021). Battery energy-storage system: a review of technologies, optimization objectives, constraints, approaches, and outstanding issues. J. Energy Storage 42, 103023. doi:10.1016/j.est.2021.103023
Hill, G., Heidrich, O., Creutzig, F., and Blythe, P. (2019). The role of electric vehicles in near-term mitigation pathways and achieving the UK’s carbon budget. Appl. Energy 251, 113111. doi:10.1016/j.apenergy.2019.04.107
Hossain Lipu, M. S., Hannan, M. A., Hussain, A., Ayob, A., Saad, M. H., Karim, T. F., et al. (2020). Data-driven state of charge estimation of lithium-ion batteries: algorithms, implementation factors, limitations and future trends. J. Clean. Prod. 277, 124110. doi:10.1016/j.jclepro.2020.124110
Huang, Z., Luo, P., Jia, S., Zheng, H., and Lyu, Z. (2022). A sulfur-doped carbon-enhanced Na3V2(PO4)3 nanocomposite for sodium-ion storage. J. Phys. Chem. Solids 167, 110746. doi:10.1016/j.jpcs.2022.110746
Iclodean, C., Varga, B., Burnete, N., Cimerdean, D., and Jurchiş, B. (2017). Comparison of different battery types for electric vehicles. IOP Conf. Ser. Mater Sci. Eng. 252, 012058. doi:10.1088/1757-899X/252/1/012058
Krishnan, R. (2017). Permanent magnet synchronous and brushless DC motor drives. Boca Raton, FL, USA: CRC Press.
Kunwar, R., Pal, B., Izwan, M. I., Daniyal, H., Zabihi, F., Yang, S., et al. (2023). Characterization of electrochemical double layer capacitor electrode using self-discharge measurements and modeling. Appl. Energy 334, 120658. doi:10.1016/j.apenergy.2023.120658
Li, S., He, H., Su, C., and Zhao, P. (2020). Data driven battery modeling and management method with aging phenomenon considered. Appl. Energy 275, 115340. doi:10.1016/j.apenergy.2020.115340
Li, X., Wang, Q., Yang, Y., and Kang, J. (2019). Correlation between capacity loss and measurable parameters of lithium-ion batteries. Int. J. Electr. Power and Energy Syst. 110, 819–826. doi:10.1016/j.ijepes.2019.03.046
Li, Y., Li, K., Liu, X., Li, X., Zhang, L., Rente, B., et al. (2022). A hybrid machine learning framework for joint SOC and SOH estimation of lithium-ion batteries assisted with fiber sensor measurements. Appl. Energy 325, 119787. doi:10.1016/j.apenergy.2022.119787
Liu, K., Li, K., Peng, Q., and Zhang, C. (2019). A brief review on key technologies in the battery management system of electric vehicles. Front. Mech. Eng. 14, 47–64. doi:10.1007/s11465-018-0516-8
Lü, H., Chen, X., Sun, Q., Zhao, N., and Guo, X. (2024). Uniform garnet nanoparticle dispersion in composite polymer electrolytes. Wuli Huaxue Xuebao/Acta Phys. - Chim. Sin. 40, 2305016. doi:10.3866/PKU.WHXB202305016
Lu, Y., Tan, C., Ge, W., Zhao, Y., and Wang, G. (2022). Adaptive disturbance observer-based improved super-twisting sliding mode control for electromagnetic direct-drive pump. Smart Mater Struct. 32, 017001. doi:10.1088/1361-665X/aca84e
Marques, P., Garcia, R., Kulay, L., and Freire, F. (2019). Comparative life cycle assessment of lithium-ion batteries for electric vehicles addressing capacity fade. J. Clean. Prod. 229, 787–794. doi:10.1016/j.jclepro.2019.05.026
Mu, S., Liu, Q., Kidkhunthod, P., Zhou, X., Wang, W., and Tang, Y. (2021). Molecular grafting towards high-fraction active nanodots implanted in N-doped carbon for sodium dual-ion batteries. Natl. Sci. Rev. 8, nwaa178. doi:10.1093/nsr/nwaa178
R, A., Rk, C., and Vp, C. (2021). Experimental analysis on estimating junction temperature and service life of high power LED array. Microelectron. Reliab. 120, 114121. doi:10.1016/j.microrel.2021.114121
Rahman, M. A., Anwar, S., and Izadian, A. (2016). Electrochemical model parameter identification of a lithium-ion battery using particle swarm optimization method. J. Power Sources 307, 86–97. doi:10.1016/j.jpowsour.2015.12.083
Richter, F., Kjelstrup, S., Vie, P. J. S., and Burheim, O. S. (2017). Thermal conductivity and internal temperature profiles of Li-ion secondary batteries. J. Power Sources 359, 592–600. doi:10.1016/j.jpowsour.2017.05.045
Sha, L., Sui, B.-B., Wang, P.-F., Gong, Z., Zhang, Y. H., Wu, Y. H., et al. (2024). 3D network of zinc powder woven into fibre filaments for dendrite-free zinc battery anodes. Chem. Eng. J. 481, 148393. doi:10.1016/j.cej.2023.148393
Shen, Y., Xie, J., He, T., Yao, L., and Xiao, Y. (2024). CEEMD-fuzzy control energy management of hybrid energy storage systems in electric vehicles. IEEE Trans. Energy Convers. 39, 555–566. doi:10.1109/TEC.2023.3306804
Somakettarin, N., and Pichetjamroen, A. (2019). Characterization of a practical-based ohmic series resistance model under life-cycle changes for a lithium-ion battery. Energies (Basel) 12, 3888. doi:10.3390/en12203888
Somakettarin, N., Pichetjamroen, A., Teerakawanich, N., Chindamanee, P., Chupong, C., and Suppitaksakul, C. (2023). An evaluation of battery energy efficiency with multi-step sampling rate recording for DC data loggers. Energy Rep. 9, 866–872. doi:10.1016/j.egyr.2022.11.103
Sun, C., Negro, E., Vezzù, K., Pagot, G., Cavinato, G., Nale, A., et al. (2019). Hybrid inorganic-organic proton-conducting membranes based on SPEEK doped with WO3 nanoparticles for application in vanadium redox flow batteries. Electrochim Acta 309, 311–325. doi:10.1016/j.electacta.2019.03.056
Tufail, M. K., Zhai, P., Jia, M., Zhao, N., and Guo, X. (2023). Design of solid electrolytes with fast ion transport: computation-driven and practical approaches. Energy Mater. Adv. 4, 15. doi:10.34133/energymatadv.0015
Wali, S. B., Hannan, M. A., Reza, M. S., Ker, P. J., Begum, R., Rahman, M. A., et al. (2021). Battery storage systems integrated renewable energy sources: a biblio metric analysis towards future directions. J. Energy Storage 35, 102296. doi:10.1016/j.est.2021.102296
Wang, J., Liu, P., Hicks-Garner, J., Sherman, E., Soukiazian, S., Verbrugge, M., et al. (2011). Cycle-life model for graphite-LiFePO4 cells. J. Power Sources 196, 3942–3948. doi:10.1016/j.jpowsour.2010.11.134
Wang, L., Zhao, X., Deng, Z., and Yang, L. (2023). Application of electrochemical impedance spectroscopy in battery management system: state of charge estimation for aging batteries. J. Energy Storage 57, 106275. doi:10.1016/j.est.2022.106275
Wang, M., Jiang, C., Zhang, S., Song, X., Tang, Y., and Cheng, H. M. (2018). Reversible calcium alloying enables a practical room-temperature rechargeable calcium-ion battery with a high discharge voltage. Nat. Chem. 10, 667–672. doi:10.1038/s41557-018-0045-4
Wang, Q.-K., He, Y.-J., Shen, J.-N., Ma, Z. F., and Zhong, G. B. (2017). A unified modeling framework for lithium-ion batteries: an artificial neural network based thermal coupled equivalent circuit model approach. Energy 138, 118–132. doi:10.1016/j.energy.2017.07.035
Wang, Y., and Li, L. (2016). Li-ion battery dynamics model parameter estimation using datasheets and particle swarm optimization. Int. J. Energy Res. 40, 1050–1061. doi:10.1002/er.3497
Weldon, P., Morrissey, P., and O’Mahony, M. (2018). Long-term cost of ownership comparative analysis between electric vehicles and internal combustion engine vehicles. Sustain Cities Soc. 39, 578–591. doi:10.1016/j.scs.2018.02.024
Xu, J., Sun, C., Ni, Y., Lyu, C., Wu, C., Zhang, H., et al. (2023). Fast identification of micro-health parameters for retired batteries based on a simplified P2D model by using padé approximation. Batteries 9, 64. doi:10.3390/batteries9010064
Yang, Z., Patil, D., and Fahimi, B. (2019). Electrothermal modeling of lithium-ion batteries for electric vehicles. IEEE Trans. Veh. Technol. 68, 170–179. doi:10.1109/TVT.2018.2880138
Yonemoto Yktiko, M. (2020). Secondary-battery monitoring device and prediction method of battery capacity of secondary battery.
Yu, Q., Huang, Y., Tang, A., Wang, C., and Shen, W. (2023). OCV-SOC-temperature relationship construction and state of charge estimation for a series– parallel lithium-ion battery pack. IEEE Trans. Intelligent Transp. Syst. 24, 6362–6371. doi:10.1109/TITS.2023.3252164
Yul Yongin-si, H., Yongin-si, J., Ho Yongin-si, C., Yongin-si, H., Yongin-si, Y., Bum Yongin-si, S., et al. (2013). System for predicting lifetime of battery.
Zhang, R., Li, X., Sun, C., Yang, S., Tian, Y., and Tian, J. (2023a). State of charge and temperature joint estimation based on ultrasonic reflection waves for lithium-ion battery applications. Batteries 9, 335. doi:10.3390/batteries9060335
Zhang, X., Lu, Z., Yuan, X., Wang, Y., and Shen, X. (2021). L2-Gain adaptive robust control for hybrid energy storage system in electric vehicles. IEEE Trans. Power Electron 36, 7319–7332. doi:10.1109/TPEL.2020.3041653
Zhang, X., Tang, Y., Zhang, F., and Lee, C.-S. (2016). A novel aluminum–graphite dual-ion battery. Adv. Energy Mater 6, 1502588. doi:10.1002/aenm.201502588
Zhang, X., Wang, Y., Yuan, X., Shen, Y., and Lu, Z. (2023b). Adaptive dynamic surface control with disturbance observers for battery/supercapacitor-based hybrid energy sources in electric vehicles. IEEE Trans. Transp. Electrification 9, 5165–5181. doi:10.1109/TTE.2022.3194034
Zhang, X., Wang, Z., and Lu, Z. (2022). Multi-objective load dispatch for microgrid with electric vehicles using modified gravitational search and particle swarm optimization algorithm. Appl. Energy 306, 118018. doi:10.1016/j.apenergy.2021.118018
Zhou, Y., Wang, B., Ling, Z., Liu, Q., Fu, X., Zhang, Y., et al. (2024). Advances in ionogels for proton-exchange membranes. Sci. Total Environ. 921, 171099. doi:10.1016/j.scitotenv.2024.171099
Zhu, L., Li, Z., and Hou, K. (2023). Effect of radical scavenger on electrical tree in cross-linked polyethylene with large harmonic superimposed DC voltage. High. Volt. 8, 739–748. doi:10.1049/hve2.12302
Keywords: energy storage, battery temperature, Li-ion battery, Arrhenius mathematical model, PMSM, service-life estimation, state of charge, durability
Citation: Rammohan A, Wang Y, Kannappan S S, Kumar P S, Ashok B, Kotb H, AboRas KM and Yousef A (2024) Service life estimation of electric vehicle lithium-ion battery pack using arrhenius mathematical model. Front. Energy Res. 12:1359596. doi: 10.3389/fenrg.2024.1359596
Received: 21 December 2023; Accepted: 18 March 2024;
Published: 03 April 2024.
Edited by:
Flah Aymen, École Nationale d'Ingénieurs de Gabès, TunisiaCopyright © 2024 Rammohan, Wang, Kannappan S, Kumar P, Ashok, Kotb, AboRas and Yousef. This is an open-access article distributed under the terms of the Creative Commons Attribution License (CC BY). The use, distribution or reproduction in other forums is permitted, provided the original author(s) and the copyright owner(s) are credited and that the original publication in this journal is cited, in accordance with accepted academic practice. No use, distribution or reproduction is permitted which does not comply with these terms.
*Correspondence: A. Rammohan, cmFtbW9oYW4uYUB2aXQuYWMuaW4=; Kareem M. AboRas, a2FyZWVtLmFib3Jhc0BhbGV4dS5lZHUuZWc=; Amr Yousef, YS55b3VzZWZAdWJ0LmVkdS5zYQ==
Disclaimer: All claims expressed in this article are solely those of the authors and do not necessarily represent those of their affiliated organizations, or those of the publisher, the editors and the reviewers. Any product that may be evaluated in this article or claim that may be made by its manufacturer is not guaranteed or endorsed by the publisher.
Research integrity at Frontiers
Learn more about the work of our research integrity team to safeguard the quality of each article we publish.