 Alex J. K. Newman
 Rachael H. Rothman
 Peter Styring
- Department of Chemical and Biological Engineering, Faculty of Engineering, The University of Sheffield, Sheffield, England, United Kingdom
As the youngest of the three sub-fields within sustainability assessment, development of social impact assessment lags behind life cycle and techno-economic assessments. This is manifested in comparatively lacking methodological maturity. The calculation of impact indicator results, achieved through the use of characterisation models, is a prime example of the field’s immaturity. This research initially identifies current methodologies observed within social impact assessment. This reveals that impact pathway characterisation models, analogous to those seen in life cycle assessment, have primarily been neglected; instead, research has been focused on less reproducible and more subjective reference scale approaches. Redressing this balance, a set of seven UNEP and SETAC indicators are evaluated, developing novel impact pathway-based characterisation models. Focussing on the effects of stimulating and de-stimulating factors on indicators, identifying hotspots where negative social impacts are likely to arise. The presented methodologies are tailored to applications involving the assessment of potential carbon dioxide utilisation (CDU) value chains. This focus results in open access characterisation models that are indiscriminate of technology readiness level, requiring no primary process data. Data from the World Bank and its partner organisations are utilised, generating complete results across all indicators for 129 countries. Development of these quantifiable characterisation models delivers significant value in the standardisation of assessment procedure and facilitates inter-assessment comparability, a benefit to stakeholders ranging from practitioners to commissioners.
1 Introduction
First attempted in 1996 by O’Brien, et al., social impact assessment (SIA) aims to systematically and repeatably evaluate the social effects of activities, policies, or legislation (Huarachi, et al., 2020). Alternatively, it can be defined as; “the process of identifying the future consequences of current or proposed actions, which are related to individuals, organisations and social macro-systems” (Becker, 2001; McCord, et al., 2021; Newman and Styring, 2023). This is typically achieved by considering a diverse stakeholder portfolio containing relevant impact categories and indicators. The idealised outcome of a well-conducted SIA is the safeguarding, monitoring, and (in many cases) mitigation of social pressures associated with sustainable development. Many assessment frameworks for social performance have been proposed, the most notable being the United Nations’ Sustainability Development Goals (UN SDGs) (United Nations, 2015a). However, owing to the complexity of societal structures and human behaviour, accurate characterisation remains a field-wide challenge. Consequently, methodologies often incorporate practitioner judgement or other sources of subjectivity, delivering qualitative or pseudo-quantitative results. In addition, most work focuses on the assessment of deployed activities, neglecting the pre-emptive assessment of proposed projects.
In a broader sense, SIA can be seen to represent one of three ‘strands’ within a holistic view of sustainability. Environmental, economic, and social factors must all be managed responsibly to deliver long-term sustainable practices. While environmental-focused lifecycle assessments (LCA) and techno-economic assessments (TEA) are mature and standardised, social impact assessment (SIA) is still a relatively underdeveloped field. Attempts have been made to integrate the three strands, making significant headway in the form of the Global CO2 Initiative’s (GCI) combined LCA and TEA guidelines (McCord, et al., 2018), and McCord et al.‘s Triple Helix Framework (McCord, et al., 2021). Despite this progress, the lack of consistent, quantitative methodologies for SIA hinders the meaningful integration of otherwise parallel assessment strands. SIA’s most notable shortcoming is a failure to provide transparent and repeatable characterisation models (CMs) to underpin impact indicator reporting. This issue has long been solved for LCA (and TEA), offering numerous robust and broadly accepted CMs such as CML 2002, ReCiPe, TRACI, etc., each with specific use cases. SIA’s lack of such quantitative impact characterisation prevents comparison between studies of competing technologies. Such an approach would also deliver increased transparency and reliability, aspects that are often dismissed within practitioner judgement-based scoring scales.
Procedural and methodological divergence within SIA, based on assessment focus (i.e., technology type or field), is necessary to accurately refine SIA practices; an observation mirrored in LCA via the ISO derived, and sector-specific, ILCD Handbook (European Commission - Joint Research Centre - Institute for Environment and Sustainability, 2010). For instance, the assessment of deployed activities can be defined and supported by primary data, resulting in more straightforward impact pathway characterisation. In contrast, assessments of proposed future value chains, or low TRL technologies, cannot rely on such data and instead requires a risk-based approach that utilises only open-source data. In theory, this would identify red flags, allowing for the subsequent implementation of mitigation or monitoring procedures. SIA’s current focus on deployed activities inherently contrasts its aim of supporting sustainable development, only quantifying impacts after capital investment and roll-out. However, if the activity or process is not intrinsically socially sustainable, deployment should be deferred until the root issues are resolved. Social sustainability should be attained, or projected, in the design phase, not retrospectively (Newman, et al., 2023). This philosophy requires a novel approach that does not rely on the primary data of a deployed technology or value chain.
Having identified this major gap in assessment capabilities, this paper focusses on the development of SIA impact characterisation in the context of carbon dioxide utilisation (CDU). With increasing cultural and societal relevance, and offering a partial answer to the climate crisis, CDU is a field in urgent need of such pre-deployment SIAs. Pieri, et al. conducted a review of CDU focussed sustainability assessments, concluding that none considered social impacts (Pieri, et al., 2018). Following this, Chauvy, et al. approach meaningful consideration of SIA through examination of health and safety within CDU (Chauvy, et al., 2019). However, the consideration of social impacts in the field remains lacking. Early assessment would facilitate the minimisation or avoidance of negative social impacts prior to occurrence. After all, how efficacious can an environmentally sustainable technology be if it simultaneously generates negative social impacts?
The broad catalogue of CDU technologies seen in current literature, ranging from concrete manufacturing (Li, et al., 2022) to synthetic fuel production (Dimitriou, et al., 2015), harbour a diverse range of technology readiness levels (TRLs) and process types. This diversity demonstrates CDU’s character as a rapidly developing and forward-looking field. However, it also makes the derivation and application of social impact characterisation methods a complex challenge. Even in cases where primary data is available, a rare scenario for low TRL CDU processes, it cannot be effectively used in comparative studies. Higher TRL processes will have benefited disproportionately from optimisation and scale-up efficiency gains when compared to theorised or bench scale alternatives at early R&D phases. Consequently, the development of flexibly applicable, non-TRL specific, CMs offers significant value to both CDU researchers and SIA practitioners. Furthermore, this high-level approach supports application to the full suite of CDU related technologies, circumnavigating the nuances related to specific technologies.
In addition, many CDU projects, particularly those at pre-deployment or low TRL phases, typically suffer from a lack of geographic specificity regarding operating location (McCord, et al., 2018). Often, only a vague targeted deployment region can be defined, informed by investment conditions, market forces, and labour requirements. However, macro level studies at continental or sub-continental resolution offer only vague insights. Consequently, the potential for negative societal impacts must be evaluated on a geographically meso-level, incentivising the development of methods adopting a national level scope.
The outlined issues demonstrate that CDU has sector specific needs that are currently neglected by broader, more general, social impact characterisation approaches. These can be succinctly summarised within six methodological requirements, or objectives;
1. Applicability to a broad range of technology types.
2. Pre-emptive identification of likely negative impacts associated with projects
3. A levelized and comparative consideration of diverse TRL ranges
4. Reliance on open source (non-primary) data
5. National (meso) level reporting resolution
6. Transparency and repeatability
The proposed national level red-flag philosophy, while less granular than approaches based on primary data, adds significant value at project inception or upgrade lifecycle phases. For instance, many CDU processes are highly energy intensive, a consequence of CO2’s inherent thermodynamic stability (Creutz and Fujita, 2001). A SIA CM focussing on communities’ access to electricity would augment an organisation’s ability to determine whether existing energy infrastructure can be utilised, or, if on-site generation is required to safeguard local communities’ energy needs. A plant requiring large amounts of grid electricity may not be socially sustainable if deployed in a country with a scarce or intermittent energy supply. However, if the project scope was expanded to include combined heat and power (CHP), photovoltaics, etc., sustainability may be realised. Through this approach, SIA does not exclude countries from consideration, but instead informs the targeting of remedial action. Furthermore, incorporating this philosophy within holistic assessments would allow detailed identification of burden shifting. In the previous example case, the abatement of social issues around electricity access would likely be reflected in elevated capital costs associated with CHP.
While not granting the same level of granular insight as LCA CMs, adherence to these six objectives delivers a value addition to organisations during the transition towards sustainable industrial ecosystems. Early identification of potential negative social impacts leaves time to remedy the causal factors, improving both long- and short-term sustainability profiles while removing the compromises associated with post-deployment optimisation. If conveyed effectively to key stakeholders, the results of such a red-flag assessment would support strategic industrial decision-making around CDU process deployment.
2 Review of literature
Previous reviews spanning a broad period reveal that SIA, constitutes the least standardised strand within sustainability assessment (Klöpffer, 2003; Jørgensen, et al., 2007; Pollok, et al., 2021). Impacts are most commonly reported relative to the UN SDGs (Sustainable Development Goals) (United Nations, 2015b) or GRI (Global Reporting Initiative) (Stiching Global Reporting Initiative, 2021). Assessments are typically carried out around deployed operations, generally neglecting processes residing in low TRL or R&D lifecycle phases (McCord, et al., 2021), an issue realised to a lesser but still present extent in LCA. Beyond the UN and GRI approaches, Kühnen and Hahn (2017) identify the UNEP (United Nations Environment Programme) and SETAC (Society of Environmental Toxicology and Chemistry) S-LCA guidelines, SAI (Social Accountability International) SA 8000, and ISO 26000 as alternate methodological options. However, the focus on deployed activities remains a common limitation (Zimmermann and Schomäcker, 2017).
A small number of sector-specific SIA approaches have been identified in previous literature (Newman and Styring, 2023), primarily focusing on the mineral (Azapagic, 2004) and mining (Mancini and Sala, 2018) industries. Despite this specialisation, characterisation models analogous to those observed in LCA remain elusive. Furthermore, in the case of CDU-oriented SIA, there is no practitioner guidance around the quantitative handling of impact reporting. McCord, et al., instead, propose practitioner-led reference scale approaches when aligning CDU-based LCAs, TEAs and SIAs (McCord, et al., 2021). While superficially aligning the three strands, the SIA ‘scoring’ methods introduce a much greater degree of subjectivity than their LCA and TEA counterparts. These shortcomings are due to both a lack of available data and an imperfect understanding of the macro societal systems through which impacts propagate. Where environmental impact pathways transcend national and cultural borders, social impact pathways are dynamic, complex, and opaque. At this point, the field appears to have reached an impasse with respect to assessment specificity. Stakeholders desire more accurate and granular SIA results, with practitioners contemporaneously lacking the methodologies through which these must be generated.
UNEP and SETAC clearly define two typologies of impact characterisation: the reference scale (formerly called Type I or RS S-LCA) and impact pathway approaches (formerly Type II or IP S-LCA). Each have their merits and limitations, reflecting fundamentally different schools of thought and delivering a significant methodological bifurcation. Reference scale approaches aim to “assess social performance or risk”, whereas the impact pathway approach assesses “consequential social impacts through characterising the cause-and-effect chain” (UNEP, 2020). Reference scales usually utilise a five-point scale against which practitioners score the performance of evaluated alternatives. However, these scales incorporate several sources of fuzziness and subjectivity. Examples include the assignment of criteria for each scoring level, the use of linear versus non-linear scales, and the qualitative nature of performance ranking against (usually un-quantified) statements. Furthermore, the approach generates very coarse results due to the five-point non-continuous scale. In contrast, the impact pathway approach is more analogous to methods seen in LCA, allowing for more seamless integration of the strands within holistic assessments. However, the previously noted complexities associated with impact pathway modelling result in broader adoption of the reference scale approach, a conclusion mirrored in all major practitioner guidelines, including the latest CDU-focused framework, the triple helix framework (McCord, et al., 2021).
Reference scale-based tools, such as the Social Hotspot Database (SHDB) (SHDB, 2022), have been developed to aid practitioners in the conduction of SIAs. Indeed, the SHDB facilitates national level assessments scopes such as those targeted in this work. However, while valuable in many applications, the adoption of reference scale approaches to impact characterisation falls short of the methodological counterparts seen in LCA and TEA; inherently facilitating the introduction of practitioner subjectivity or bias. If the complete and meaningful harmonisation of environmental, economic, and social assessment strands is to be realised, an impact pathway-based approach must be presented for use by practitioner, transcending the SHDB’s offering.
Compounding this divergence in characterisation approach, the SHDB is pay wall protected. This puts it in direct conflict with LCA and TEA characterisation methods, provided free of charge in all examined cases (CML 2002, ReCiPe, TRACI, etc.). If SIA is to be adopted on an equivalent basis, freely accessible impact pathway characterisation methods must be available to practioners who lack the backing of well-funded organisations. Failure to provide this may result in SIA’s stagnation within a second strata of assessments, requiring database licences that exclude small businesses and independent practioners.
GreenDelta’s PSILCA database (GreenDelta, 2022) represents what is deemed to be the closest analogue to the CMs targeted within this work. However, despite being based on the UNEP and SETAC guidelines, and examining a comprehensive 15,000 sectors (excluding CDU) across a mixture of 69 qualitative and quantitative risk-based indicators, it is designed to assess deployed processes and value chains. Therefore, the most pertinent gap in capability with respect to CDU related SIA, pre-deployment assessments, remains un-tackled. Furthermore, the indicator results are reported against a discrete qualitative scale (based on quantitative background calculations). This consequently fails to communicate social impact risks on a continuous basis, instead utilising reference-scale-like scoring points (low risk, medium risk, high risk, etc.). In addition to these factors, and similarly to the SHDB, PSILCA is also a paid product, resulting in the same accessibility issues as previously noted. Finally, the examination on a sector specific basis adds little value to CDU projects as it is not currently recognised as an independent industrial sector within PSILCAs methodology (GreenDelta, 2022). Owing to their surface level similarities, the PSILCA CMs will be compared to those developed in this paper within the discussion.
A secondary methodological divergence within SIA thinking can be observed in the handling and characterisation of positive social impacts. UNEP and SETAC propose their classification under three categories (UNEP, 2020): positive social performance going beyond business as usual (Goedkoop, et al., 2018), positive social impact through presence (Norris, 2006), and positive social impact through product utility (Kuhnen and Hahn, 2019). These classifications again focus on deployed technologies, requiring detailed knowledge of the local communities. In contrast, a majority of SIA methodologies focus only on negative impacts (UNEP, 2020). While the argument can be made for the need to include positive impacts, the decision should be handled on a case-specific basis; their inclusion should enhance the insights delivered by a given assessment, not dilute the resolution at which potential negative impacts are examined.
The literature review’s findings show that no CDU or value chain-oriented SIA guidelines further the development of impact pathway approaches. This paper therefore proposes that more emphasis should be placed on the impact pathway approach, aligning its development phase with reference scales to deliver more quantitative results. Additionally, impact characterisation through mathematical methods offers a remedy to currently observed subjectivity and repeatability issues.
3 Methodology
As identified through the literature review, impact pathway-based SIA lags behind its reference scale counterpart, both in terms of research effort and maturity. Consequently, herein we target the generation of initial open-source impact pathway CMs. The approaches developed primarily focus on applications concerning comparative assessments of CDU value chains, tackling the specific challenges identified through the literature review and building upon McCord, et al.‘s triple helix framework. However, where McCord, et al. deploy a “qualitative scoring methodology based on quantitative and semi-quantitative data” (McCord, et al., 2021), this approach targets purely quantitative assessment. The methodology aims to highlight elevated social impact risks based on deployment country. Generated results subsequently support the efficient allocation of resources for the pre-deployment prevention and mitigation of impacts through elevated due diligence and monitoring by the operating organisation.
Assessment indicators, clustered within stakeholder categories, are typically selected by the SIA practitioner from a broad pool, with 36 identified by Rafiaani, et al. (2019); this process draws on the assessment’s goal and scope. Despite omitting impact pathway approaches, the triple helix framework offers significant advances in CDU SIA methodology in this respect. McCord, et al., building upon Rafiaani, et al.‘s adaptation of UNEP and SETAC’s guidelines to CDU technologies (Rafiaani, et al., 2019), streamline the stakeholder categories considered within assessments. UNEP and SETAC originally recommend a base set of five stakeholder categories (UNEP, 2020);
1. Workers/employees
2. Local community
3. Society
4. Consumers
5. Value chain actors
These categories are subdivided into impact categories, subcategories, and associated impact indicators. The triple helix framework subsequently reduces this set to the consideration of only workers, local communities, and consumers (McCord, et al., 2021), citing the irrelevance of other categories to CDU projects.
Owing to the scope of this work, the reduced set of stakeholder categories defined within the triple helix framework is adopted as a basis (McCord, et al., 2021). However, the consumer category can also be discarded when targeting comparative studies, providing an assessment scope aligned with cradle-to-gate LCA’s; any products manufactured by competing CDU value chains should be identical, resulting in identical social impacts for consumers and reduced insights. This leaves consideration of only the worker (W) and local community (LC) stakeholder categories. Within these, seven indicators are selected for this proof-of-concept exercise. These reflect both a broad range of social issues, and typical difficulties experienced in the field (primarily data availability and reporting quality).
• Risk of Forced Labour (W)
• Risk of Child Labour (W)
• Occupational Health and Safety (W)
• Risk of Change in Access to Electricity (LC)
• Risk of Change in Access to Water (LC)
• Risk of Land Use Change (LC)
• Utilisation of Hazardous Materials (LC)
Due to the targeting of pre-deployment CM applicability, some common indicators such a fair wages or job creation cannot be evaluated. Without the specification of an operating location, their evaluation would result in a degree of uncertainty that negates any benefit of their assessment. Such gaps in impact coverage represent the first limitation of the proposed methodology. However, this is necessary in scenarios where the exact deployment region is unknown.
To facilitate an impact pathway-based methodology, stimulating and de-stimulating factors are identified for each indicator and systematically aggregated, delivering overall risk scores that highlight potential impact hotspots. The result is an approach closely aligned with the more thoroughly developed LCA CMs. Additionally, dependence on detailed process-specific data is avoided, aiding with technology comparisons over the diverse TRL range observed within CDU.
In the interest of transparency and reproducibility, only open-source data is utilised in the developed CMs. However, SIA-focused databases lag significantly behind their LCA counterparts, such as Ecoinvent (Newman and Styring, 2023). Several characteristics were targeted within the data source selection: coverage, currency, reliability, and consistency. After consideration of multiple options, including ad-hoc collection, the World Bank is selected as the primary data source for CM development (also heavily utilised within PSILCA’s methodology). With 189 participating countries and 12,000 social development projects (The World Bank, 2023a), coverage is broad and reliable. Furthermore, constituent national-level data sets are updated regularly, with a majority reported annually. Reliability is safeguarded through the use of transparently audited data from partner organisations and governments. Finally, consistency is achieved inherently through the convergence of these prior factors. In some cases, secondary sources must be used to supplement the World Bank data; however, as discussed later, these often originate from partner organisations or constituent data sets. Once national level data for the stimulating and de-stimulating factors is collated, normalisation procedures are applied, delivering scores between zero and one through which the assessed CDU value chain alternatives’ risk levels can be directly compared. This is a significant departure from the PSILCA methodology which utilises conversion to reference scales (discrete) in favour of normalisation (continuous).
Adhering to the red-flag approach, necessitated by the complexity of impact pathways, only negative social impacts will be considered. As previously identified, the evaluation and inclusion of positive impacts is a divisive issue within SIA. The developed CMs aim to highlight supply chain components with an elevated risk of negative social impacts, stimulating greater due diligence and monitoring efforts from the responsible organisation. Furthermore, positive social impacts should not be compensatory, as seen in LCA and TEA. That is, positive impacts on one indicator or stakeholder group cannot be allowed to offset negative performance in another. From a moral stance, no stakeholder should wield the power to benefit one community at the detriment of another. Avoiding positive impact reporting removes such complications while simultaneously achieving the specified objectives.
Scoring directionality within SIA is also acknowledged by McCord, et al. as an important methodological decision (McCord, et al., 2021). That is, should negative social impacts be reflected through a high or low score? Directionality should be uniform across all indicators within an assessment, allowing for easily interpreted parallel reporting. In this methodology, countries with a high risk of negative social impacts are indicated by low scores, perceivedly the most intuitive approach.
Note to readers: ESI containing all utilised data and intermediate handing steps is available for simultaneous reference and the support of replication studies.
4 Methods development
In this section, the developed SIA CMs are laid out. The respective stimulating and de-stimulating factors, normalisation procedures, and attained geographic coverage are detailed. In the interest of conciseness, the complete datasets generated through these methods are not fully detailed in this paper, instead focussing on the G20 nations; however, the full results and utilised data sets for the 239 examined countries are provided within the Supplementary Material.
4.1 Risk of forced labour
The risk of forced labour can be summarised as “work that is performed involuntarily and under the menace of any penalty. It refers to situations in which persons are coerced to work through the use of violence or intimidation, or by more subtle means such as manipulated debt, retention of identity papers or threats of denunciation to immigration authorities” (International Labour Conference Protocol to Convention No. 29, 2014).
The proposed CM evaluates the stimulating factors of current prevalence (per 1,000 population), and future vulnerability. This delivers keener insights than the sole consideration of prevalence, incorporating future exposure risk through the evaluation of additional aggravating factors. This national prevalence and vulnerability data is collected from a Walk Free Foundation report (WFF) (Walk Free Foundation, 2018), a partner and contributor to the World Bank database. Additional contributions were made by the International Labour Organization (ILO) and the International Organisation for Migration (IMO).
The estimated prevalence is evaluated using data collected by WFF through the Gallup World Poll. Complete reporting is observed for 167 of the World Bank’s 189 participating nations, providing a high degree of completeness. Estimated values range from 104.6 people in forced labour per 1,000 population (N. Korea) to people in forced labour per 1,000 population (Japan), full datasets are available in the ESI (Walk Free Foundation, 2018).
The prevalence values for each country (collected from the WFF report)are normalised within the set on a max-zero basis. This approach is selected to avoid assigning a score of one (indicating perfect performance) to a country with an estimated prevalence greater than zero. While this could conceivably cause the artificial grouping of countries’ scores at the lower end of the scale, it is deemed essential to anchor the perfect score at zero prevalence. This decision only changes the highest normalised prevalence of forced labour (NPFL) score (for Japan) by 0.288% (from one to 0.997). The lower end of the scale moves dynamically with the highest (i.e., worst) national prevalence value. As a result, a global reduction in forced labour prevalence makes attainment of a positive score more challenging, incentivising continued improvement.
Equation 1 – Calculation of normalised prevalence of forced labour (NPFL). Where, PFLMax indicates the highest national prevalence, and PFLi indicates prevalence in country i.
Equation 1 converts the full range of theoretical prevalence values to scores between 0 and one while correcting for desired directionality. The resulting upper and lower bounds for this normalised prevalence of forced labour (NPFL) are 0 and 0.99727 for N. Korea and Japan, respectively.
The second stimulating factor within the CM considers vulnerability to forced labour. This is a complex metric to quantify as unlike prevalence it cannot be directly measured. Consequently, the WFF’s method evaluates several constituent risk stimulators, utilising procedures verified through an audit by Ernst and Young (Walk Free Foundation, 2018).
The full methodology behind WFF’s quantification of vulnerability can be found in the referenced report (Walk Free Foundation, 2018). In summary, an initial group of 35 risk stimulators were checked for collinearity, removing those with a significant correlation, defined as those with variance inflation factors (VIF) greater than 10 and tolerance below 1. 12 factors are removed in this process, eliminating the compounding effects and reduced sensitivity observed through the inclusion of multiple co-linear factors. The remaining 23 stimulators are grouped into clustered ‘factors’ through principal component analysis (PCA). The result is five overarching factors (listed below) that more approachably characterise a population’s vulnerability to forced labour. An expert working group, selected by the WFF, was then consulted to assign weights to the five factors. This utilises the eigenvalues as weightings, indicating the amount of variance explained by each particular factor (Walk Free Foundation, 2018). Those possessing greater eigenvalues, and therefore variance, explain a more significant proportion of the overall model and, thus, command greater weights. This process delivers the following factors and weights (detailed in brackets):
1. Governance Issues (5.76)
2. Lack of Basic Needs (3.422)
3. Inequality (2.233)
4. Disenfranchised Groups (2.092)
5. Effects of Conflict (1.938)
With the five constituent factors fully defined, weighted, and evaluated for each of the 167 countries considered, the raw national vulnerability scores can be calculated. This yields country-specific eigenvalue weighted values (EWVi) through Equation 2.
Equation 2 – Calculation of the eigenvalue weighted value for country i. Where,
This EWV represents an overall vulnerability score for each country, incorporating the 23 identified stimulating factors. However, this must be normalised, using Equation 3, to facilitate further use in conjunction with the national prevalence scores. This is defined as the Normalised Vulnerability to Forced Labour (NVFLi).
Equation 3 – Calculation of the normalised vulnerability to forced labour for country i. Where EWVMin and EWVMax are the lowest and highest observed EVW across the assessed countries.
Having now defined and calculated the normalised national scores for prevalence and vulnerability, the overall indicator scores can be obtained through a simple average of the two values (Equation 4). This approach was adopted to assign equal importance of current prevalence and vulnerability; although, with time this weighting strategy can be revisited if supported by the results obtained through application cases. The national scores generated by Equation 4 provide a relative ranking of all considered countries between values of zero and one. Result of this calculation for the G20 countries gives the national risk profile detailed in Figure 3.
Equation 4 – Calculation of final risk of forced labour indicator score for country i.
4.2 Risk of child labour
As with the previous forced labour CM, prevalence and vulnerability are identified as stimulating factors. In order to clearly and consistently evaluate the prevalence of child labour, the classification requirements laid out by the United Nations Children’s Fund (UNICEF) and the ILO are adopted (shown by Figure 1). This considers varied factors such as industry sectors, hazard, age, and duration, providing a widely accepted framework.
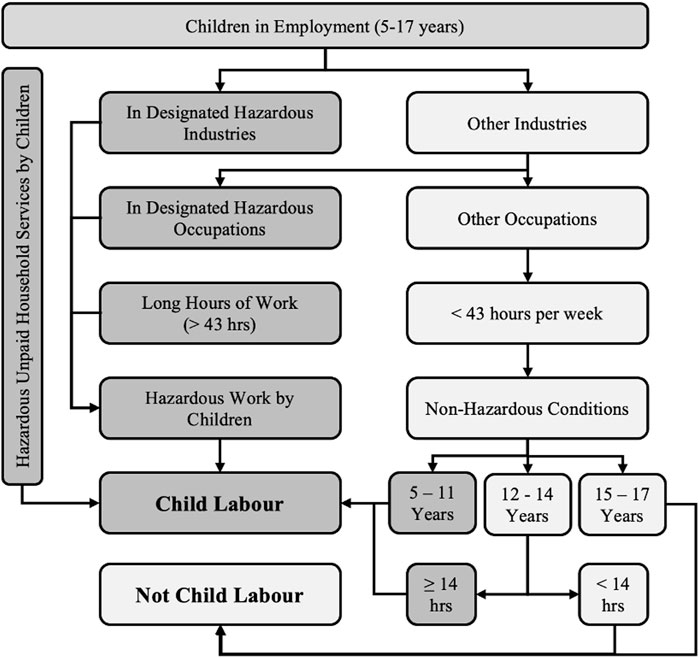
Figure 1. Flow diagram showing the classification of what constitutes child labour. Adapted from UNICEF and ILO (International Labour Organization and United Nations Children’s Fund, 2021).
With a clear definition achieved, the quantification of national child labour prevalence is approached. However, data availability proves a challenge due to lacking geographic resolution. Rather than at the national level, data is presented in terms of the UN SDG regions listed below. This clearly reduces the granularity attained. However, the incorporation of vulnerability as a second stimulating factor augments the indicator’s overall geographic resolution.
• Sub-Saharan Africa
• Central and Southern Asia
• Eastern and South-Eastern Asia
• Northern Africa and Western Asia
• Latin America and the Caribbean
• Europe and North America
Examining the reported prevalence data, all identified child labour between the ages of 5–17 is included. UNICEF independently report the prevalence of both hazardous and non-hazardous child labour as a percentage of the nation’s population. For SIA CM development, both of these types are of significance. Additionally, the reported values are mutually exclusive, permitting their additive aggregation through Equation 5 without the risk of double counting.
Equation 5 – Aggregation of child labour prevalence data for UN SDG regions. Where, NCLi is the % of children in non-hazardous labour in country i, HCLi is the % of children in hazardous labour in country i, and OPCLi is the country’s overall prevalence of child labour.
The generated overall child labour prevalence (OCLPi) values are subsequently normalised using Equation 6. As seen with forced labour prevalence, this occurs on a max zero basis, both reversing directionality and ensuring a requirement of 0% child labour prevalence for a perfect score of 1.
Equation 6 – Normalisation of overall child labour prevalence (OPCL). Where, OPCLMax is the highest observed prevalence, OPCLi is the overall prevalence in country i, and NCLPi is the normalised prevalence of child labour for country i.
With the normalised child labour prevalence (NCLPi) determined for each UN SDG region, and thus their constituent countries, vulnerability can be incorporated. Vulnerability to child labour is not examined by the World Bank directly, necessitating a secondary data source. Consequently, the national vulnerability scores utilised within the forced labour CM (extracted from a WFF report (Walk Free Foundation, 2018)) are used as a proxy. Given a clear commonality in stimulating factors between forced and child labour (International Labour Organization and United Nations Children’s Fund, 2021), this is deemed a reasonable assumption. Incorporation of national level vulnerability as the second stimulating factor allows for upward or downward adjustment of the UN SDG region-oriented prevalence data, accounting for intra-region risk variations. The overall effect of this strategy is greatly improved geographic resolution. Using the previously processed WFF vulnerability data (NVFLi), the final indicator value can be determined using Equation 7, delivering the national scoring profile for the G20 seen in Figure 4.
Equation 7 – Final indicator calculation for the risk of child labour. Where, NPCLi is the normalised prevalence of child labour in country i, and NVFLi is the normalised vulnerability to forced labour in country i.
4.3 Risk of change in access to electricity
In adherence to the methodological approach laid out earlier, literature was consulted to identify stimulating and de-stimulating factors with respect to energy access and security. Stavytskyy, et al. present the only identified list of factors with a relevant scope, all of which are present within the World Bank database (Stavytskyy, et al., 2021; The World Bank, 2023b). This includes;
• Renewable energy consumption (% of total final energy consumption) (De-stimulating factor)
• Energy Imports, net (% of energy use) (Stimulating factor)
• Electric power consumption (kWh per capita) (De-stimulating factor)
• Fossil fuel energy consumption (% of total) (Stimulating)
With the factors identified, their respective data sets are extracted directly from the World Bank. However, issues around data completeness are again encountered. Many countries show patchy reporting with no single year containing all required data across an acceptable number of countries. To circumvent this issue, the most recently available data is utilised in each case, generating a super-set (provided in the Supplementary Material). A hard limit on data age is implemented, backdating no more than 10 years, preventing the incorporation of significantly aged data. This strategy results in complete data coverage for 142 countries, or 65% of those present in the database. Additional gaps cannot be filled without imputation.
Before normalisation of each factor, skewness is examined (using Equation 8) to identify any unintended implications of the temporally diverse data aggregation strategy. Through this, the skewness of electric power consumption data is revealed to be 4.74 (the only factor with a skewness <1). When using standard normalisation techniques, this significantly reduced the utility of collected data, tightly grouping a majority of countries with a few distant outliers. Furthermore, the raw energy consumption rate gives little insight to the more relevant per captia availability. Electric power consumption was therefore removed from further CM development.
Equation 8 – Method used for the calculation of data skewness. Where n is the sample size, xi is the ith value in the sample,
Renewable energy consumption (RECi) is normalised on a zero to one basis (Equation 9) to deliver national scores reflecting their renewable grid shares (NRECi), only awarding a perfect score to a 100% renewable grid mix. The upper bound observed within the data set is the Democratic Republic of the Congo, exhibiting a 96.24% renewable grid mix, a direct consequence of large hydroelectric and biogas capacities (International Energy Agency, 2023).
Equation 9 – Normalisation of national renewable energy consumption. Where, RECi is the renewable energy consumption of country i (% of grid mix), and NRECi is the normalised renewable energy consumption of country i.
Normalisation of net energy imports is a more complex task, ultimately being handled by utility function (Equation 10). Many exporting countries exhibit highly negative values within this risk stimulating factor (e.g., Norway). These large-scale exporters introduce significant skew. Additionally, the export capacity of a country does not affect its own population’s access to electricity, rendering it is consideration moot. Consequently, any countries exhibiting negative percentage import values (NEIi) are assigned a value of zero, attaining the highest possible normalised value (NNEIi = 1), signalling ideal performance. Conversely, a value of 100% import will receive a normalised score of zero, reflecting total dependence on non-domestic sources.
Equation 10 – Normalisation of net energy import (% of domestic use). Where, NNEIi is the normalised net energy import for country i, and NEIi is the net energy import of country i.
The next stimulating factor identified is fossil fuel dependence (FERi). The simplest of the normalisation cases, it is tackled on a max zero basis (Equation 11). Normalised scores fossil energy reliance (NFERi) therefore delivers low scores for nations with high reliance, with high scores awarded for low reliance. This rationale, derived in conjunction with the work by Stavytskyy, et al. (Stavytskyy, et al., 2021), reflects the uncertain energy futures of fossil reliant nations, owing to increasing fossil energy scarcity and tariffs.
Equation 11 – Calculation of normalised fossil energy reliance of country I (NFERi). Where FERi is the fossil energy reliance of country i.
With the three contributing factors’ scores normalised for all 142 available countries, aggregation into a final score is approached. Weightings are used, derived through practitioner judgement, delivering Equation 12. Normalised fossil energy reliance (NFER) is assigned the highest weighting (0.5), reflecting its notable influence on energy security in a world where fossil-based generation is being phased out. The resulting national scoring profile for the G20 is shown in Figure 5.
Equation 12 – Final indicator calculation for risk of change in access to electricity.
4.4 Risk of change in access to water
Access to water in the context of this work does not solely consider drinking water, instead examining access more broadly in a divergence from existing methodologies including PSILCA. This constitutes a challenge when identifying stimulating and de-stimulating factors, with a majority of literature focussing on rural access to drinking water (Mahama, et al., 2014; Ojuka and Tumwebaze, 2022) (Abubakar, 2019). Very little has been published concerning national-level water access. Consequently, an analogous approach is taken to that used for the risk of change in access to electricity. Selected factors, listed below, are chosen based on their alignment with the UN SDGs (goal 6) and their focus on use as a function of national availability. Data is supplied to the World Bank by partner FAO AQUASTAT (Food and Agriculture Organization of the United States, 2023), and is extracted directly from the database.
• Freshwater withdrawal as % of total domestic renewable water resources (Stimulating)
• Water Stress (%) (Stimulating)
Minor issues around skew were identified within the two factors; however, they are eliminated through utility function comparable to that used for NNEIi. Therefore, any nation withdrawing more than 100% of its renewable water reserves is automatically considered to be at a maximum value of 100% (normalised value of zero to reflect detrimental national performance in the factor); the dataset’s skew is consequently reduced from an unacceptably high value of 9.71 to a more acceptable 1.86 (calculated using Equation 8). This strategy quantifiably scores normalised renewable freshwater withdrawal (NRFRi) through Equation 13.
Equation 13 - Normalisation of freshwater withdrawals as % of total domestic renewable water resources. Where, NRFWi is the normalised renewable freshwater withdrawals for country i, and RFWi is the renewable freshwater withdrawal of country i.
The same approach is taken to calculation of normalised national water stress (NNWSi), capping reporting to a maximum raw national water stress value (NWSi) of 100%, reducing the skew from 9.68 to an acceptable 1.45. Having resolved the problematic skewness and bounds, normalisation between limits of 0–100 is carried out using Equation 14.
Equation 14 - Normalisation of water stress. Where, NNWSi is the normalised national water stress for country i, and NWSi is the water stress of country i.
With these normalised values for the two stimulating factors generated over the 177 considered countries, their aggregation is approached through an average using equal weights (Equation 15). This gives the final national indicator scores for the risk of change in access to water.
Equation 15 – Final indicator score calculation for the risk of change in access to water.
It should be noted that the small number of countries data points that are artificially capped represent only 6.7% and 9.6% of the 177 considered countries for NRFWi and NNWSi respectively.
4.5 Risk of land use change
The potential risk of land use change was approached through the consideration of current land use proportions and the associated classifications. As per the overarching methodology, World Bank data is utilised directly to populate the inventory. National data was extracted directly from the World Bank database to quantify the percentage of land mass occupied by;
• Agriculture
• Forest
• Protected land
These areas are determined to be of both the highest societal value and risk of repurposing, giving rise to the greatest potential for negative impact. It is considered that these areas are not necessarily mutually exclusive, instead harbouring potential overlaps, as indicated by Figure 2.
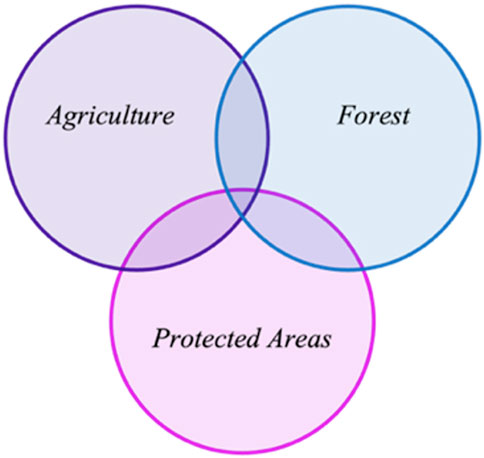
Figure 2. Visualisation of the overlap of land area World Bank data within the categories of agricultural land, forest, and protected areas.
The inclusion of protected areas introduces the risk of double counting, potentially also being classified as areas of forest, or in current agricultural use. Examples of this can be seen within the U.K.‘s New Forest National Park under the ‘Farming in Protected Landscapes’ grant programme (Department for Environment, Food & Rural Affairs, 2023), or the Wood Buffalo Protected Forest in Canada (World Resources Institute, 2022). However, due to a lack of more granular and openly available data, these categories must be utilised in the most effective manner possible. In an idealised scenario, or future revisions, factors such as the availability of brownfield sites would also be incorporated into the CM.
When considering the sum of the three land classifications, the double counting becomes apparent, with four countries’ values exceeding 100% of their land area: Micronesia (123%), Marshall Islands (119%), American Samoa (110%), and Sao Tome and Principe (105%). A further seven exhibit precisely 100%. A solution to the double counting issue is attained through the use of the larger value of either:
• Agriculture + Forest
• Protected areas
This method (expressed via Equation 16) is deemed acceptable in the absence of more robust and openly available data, delivering a lower bound for the nations denied land fraction (DLFi).
Equation 16 – Calculation of denied land fraction (%) of country i (ALFi).
With this lower bound of the denied land fraction quantified (DLFi), the upper bound of each country’s available land fraction (ALFi) can be determined via Equation 17
Equation 17 – Determination of available land fraction of nation i (ALFi) via the previously calculated denied land fraction of nation i (DLFi)
To account for disparities in population density, Equation 18 is employed. The result is an estimated upper bound for the available land per capita (ALPCi) suitable for responsible development, offering a fair and comparable ranking metric.
Equation 18 – Calculation of available land area per capita for country i (ALCi). Where, ALFi is the assigned land fraction (%) of country i, NLAi is the total national land area of country i, and pi is the population of country i.
Having estimated the available land area per capita for the 204 countries with suitable World Bank data coverage, max zero normalisation is applied (Equation 19), revealing the normalised available land area per capita (NALPCi). However, Greenland presents an outlier, returning an available land area per capita 18.36 times that of the second-highest score (Namibia); it is consequential exclusion reduces the dataset’s skew from 14.07 to a more acceptable but still highly significant 5.06 (using Equation 8).
Equation 19 – Calculation of the normalised available land area per capita for country i (NALPCi). Where, ALPCi is the available land area per capita, and ALPCMax is the largest national available land area per capita.
While achieving normalised national scores, the observed skew of 5.06 is still significant, with a majority of values residing at the lower end of the range. To combat this, a utility curve is employed. After consideration of multiple exponents, 0.25 was ultimately selected (Equation 20). This is owing to the balance observed between additional resolution achieved at the lower values, while maintaining a slight skew to reflect the original data character. It is recognised that the selection of the exponent is, to some extent, subjective. However, when communicated transparently, this is deemed acceptable in the interest of heightened utility to practitioners and assessments. The results of the CM for the G20 countries can be seen in Figure 7.
Equation 20 – Calculation of the risk of land use change indicator score. Where (NALCi) is the normalised available land area per capita for country i
4.6 Occupational safety and health
Occupational safety and health (OSH) represents a common impact category within SIA. Typically, this is assessed using primary data from the process of interest. However, in the pre-deployment setting of this research, no primary data will be available. Additional complexity is encountered in the lack of OSH data available through the World Bank. Several alternative data sources were considered, with many offering poor coverage (e.g., only 96 countries from ILOSTAT) (World Health Organisation, 2016; International Labour Organization, 2023). Suitable alternative data was identified, through a World Bank partner; ILO’s summary of work-related mortality (International Labour Organization, 2003).
This ILO data exhibits excellent coverage with 216 countries fully defined. However, its age is less than optimal, hailing from 2003. With the search for more recent literature returning nothing of note, progression based on legacy data must be accepted. This requires the assumption that the proportion of workplace injuries and illnesses have remained largely proportional across the examined countries and temporal shift, constituting a current limitation and opportunity for future development.
Through this ILO data, the following stimulating factors are extracted at the national level (International Labour Organization, 2003; International Labour Organization, 2003);
• Accidents causing 4 days of absence (Stimulating)
• Work-related disease (Stimulating)
• Work-related mortality (Stimulating)
Data manipulation is required to allow for fair comparison between countries for each factor. To this end, accidents causing 4 days of absence, work-related disease, and work-related mortality are converted to occurrence rates by dividing by the national economically active population as provided within ILO’s data (per 10,000 workers). These occurrence rates are then normalised (max zero) and corrected for directionality using Equation 21) and (22), and Equation 23.
Equation 21 – Calculation of normalised occurance rate of accident related absence per capita (
Equation 22 – Calculation of normalised occurance rate of work related disease per capita (
Equation 23 – Calculation of normalised occurance rate of fatal accidents per capita (
This delivers normalised national scores between 0–1 (higher scores being preferable) for each stimulating factor. For the characterisation of each country’s OSH performance, the three factors are assigned equal weightings, resulting in Equation 24. The final national scores for the G20 countries can be seen in Figure 8.
Equation 24 – Aggregation of the stimulating factors contributing to OSH indicator scoring.
4.7 Risk from utilisation of hazardous materials
Characterisation of risk from the use of hazardous materials is challenging as a consequence of its heavier dependence on the industrial sector than the country of deployment. Aggravating this, data is severely lacking. It is proposed that the risk from the use of hazardous material should be represented through its impacts rather than raw prevalence in a supply chain. Where these materials are handled well, under properly enforced and effective regulations that result in no negative impact, the value chain should not be penalised.
An idealised characterisation approach would include a breakdown of fatal and non-fatal incidents caused by the industrial use of hazardous materials within each sector and country. However, this scenario is far from being realised. Furthermore, the World Bank does not provide any datasets suitable for use as stimulating or de-stimulating factors. In the absence of such data, an alternate approach is required. The ILO provides data on the number of work-related deaths from exposure to hazardous materials (WDHS) in each nation’s economically active population (EAP) (International Labour Organization, 2003). Equation 25 delivers a national-level value for work-related deaths from exposure to hazardous materials per 10,000 workers.
Equation 25 – Calculation of the risk of death from exposure to hazardous substances for country i (RDHSi), Where, WDHSi is the workplace deaths from exposure to hazardous substances for country i, and EAPi is the economically active population of country i.
With these risk values determined, normalisation can be carried out (Equation 26) relative to the set’s maximum value. Directionality is also reversed to deliver a higher score for lower risk. The resulting national scores for the G20 (excluding the African and European Unions) can be seen in Figure 9 (full list of national scores available in ESI).
Equation 26 – Calculation of the risk from the utilisation of hazardous materials in country i (RUHMi). Where, RDHSi is the risk of death from exposure to hazardous substances for country i, and RDHSMax is the highest observed risk of death from exposure to hazardous substances.
5 Results
Overall, the seven indicators examined within this study show that it is possible to derive impact pathway-based SIA CMs analogous to those observed in LCA. However, data reporting and, therefore, availability is easily identified as the limiting factor. The results of the CMs developed can be seen in Figures 3–9; for ease of interpretation, only the G20 countries are shown (excluding the African and European Unions), and the full data set, including all 239 examined countries, and the underpinning literature data, is available in the electronic Supplementary Material (ESI).
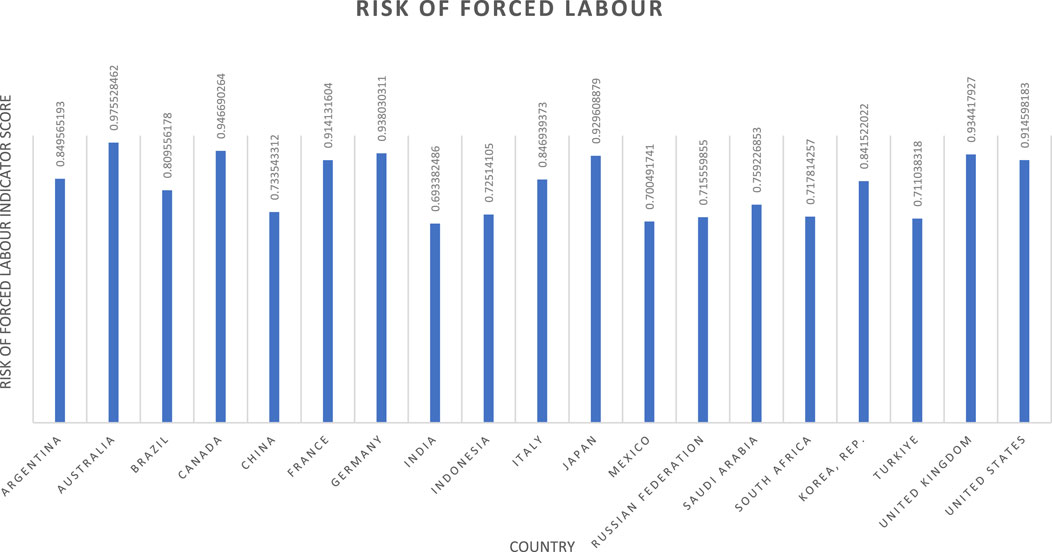
Figure 3. Forced labour indicator results.
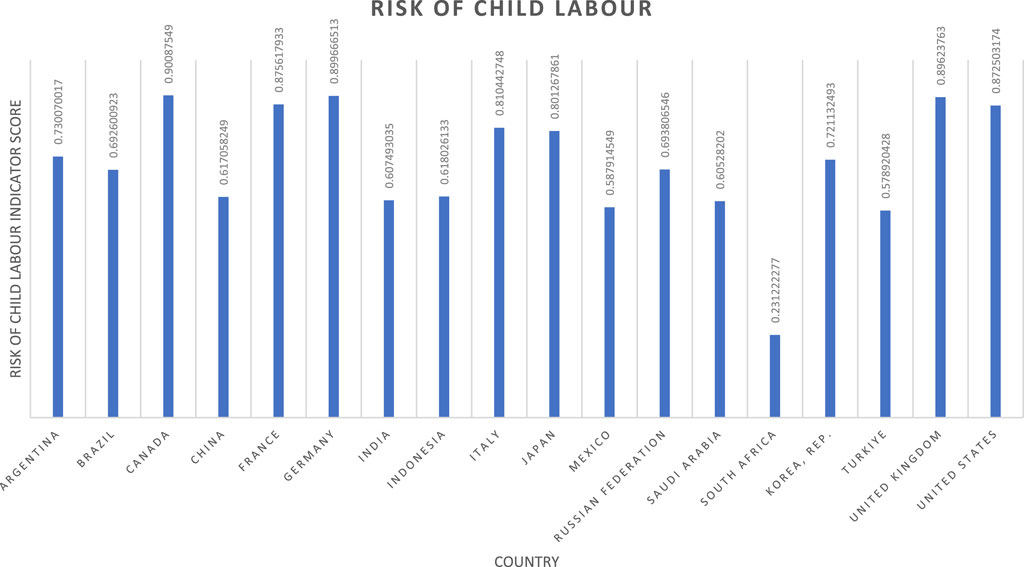
Figure 4. Child labour indicator results.
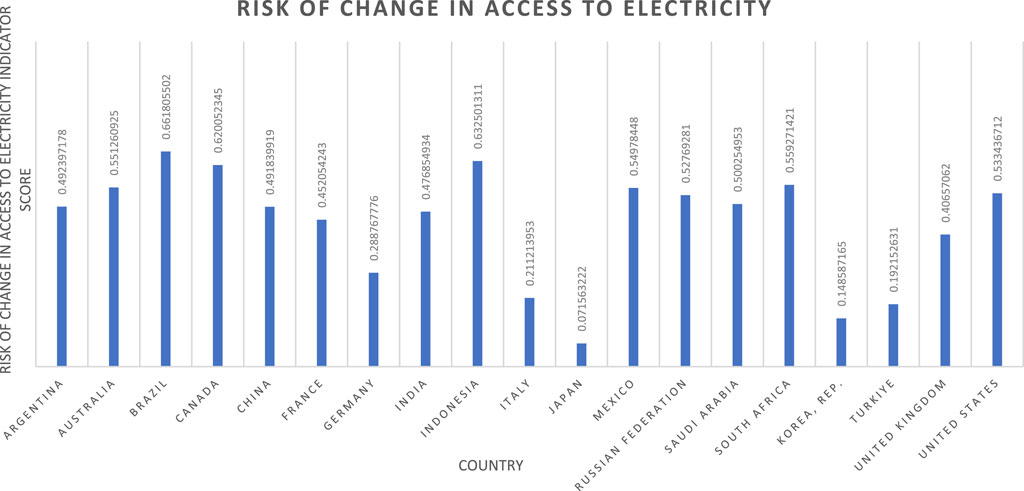
Figure 5. Access to electricity indicator results.
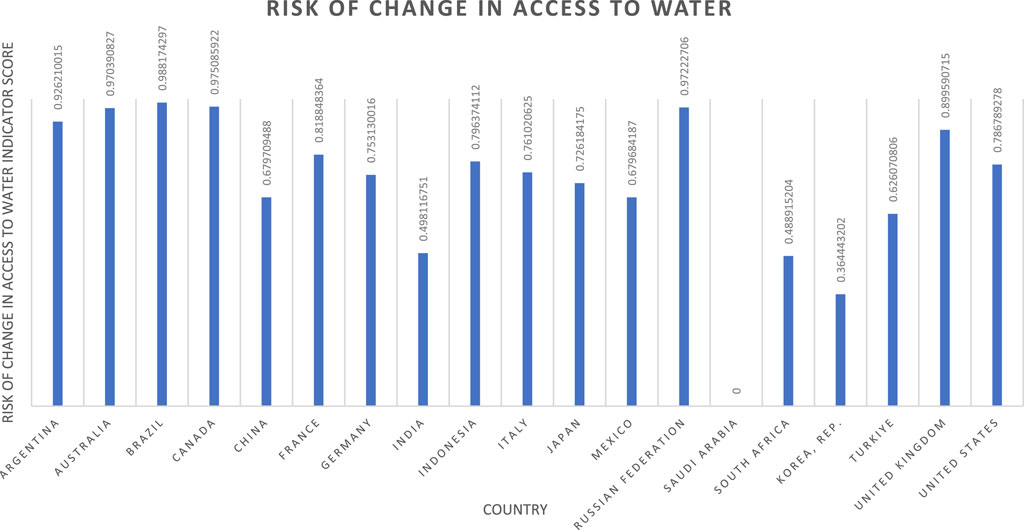
Figure 6. Access to water indicator results.
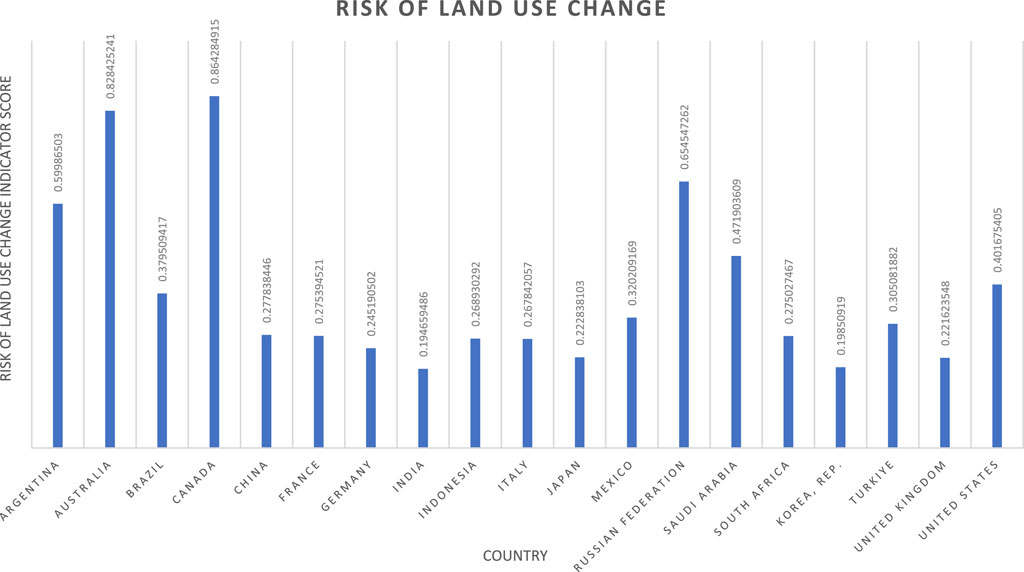
Figure 7. Land use change indicator results.
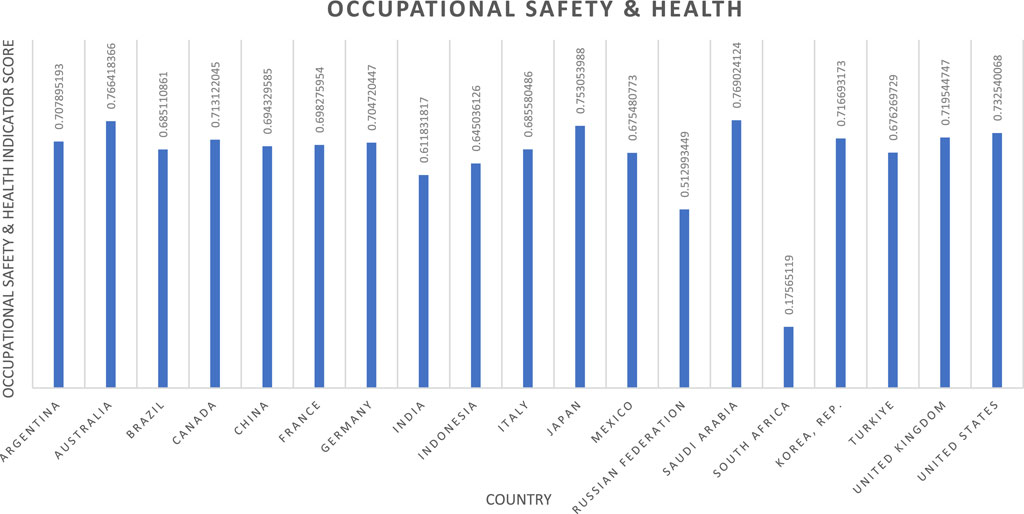
Figure 8. Occupational health and safety indicator results.
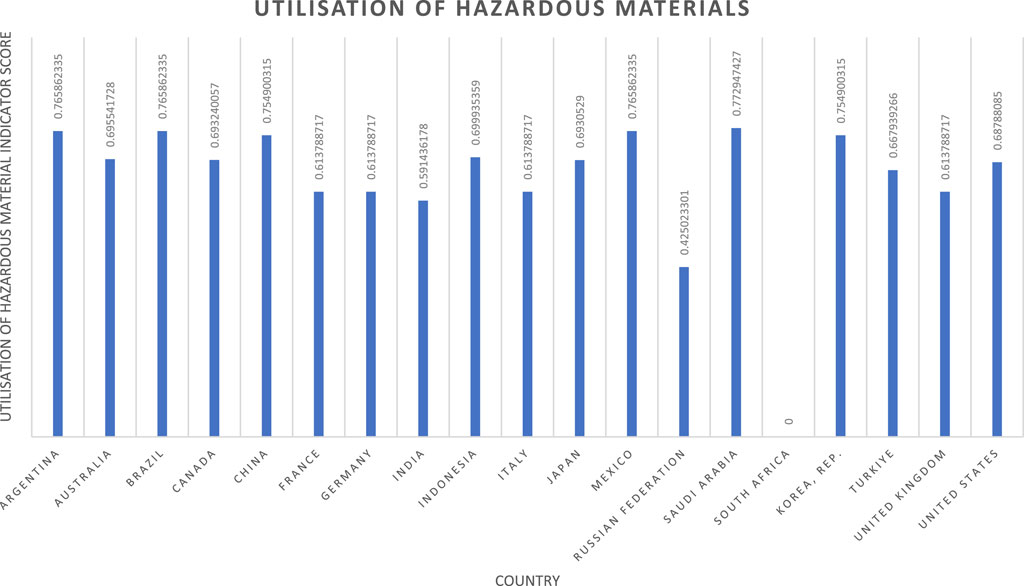
Figure 9. Utilisation of hazardous material indicator results.
The developed SIA CMs exceeded initial ambitions concerning coverage. However, this coverage was, in places, achieved through slight methodological compromise (e.g., risk of land use change and risk from utilisation of hazardous materials). Good geographical coverage is essential to the development of SIA CMs; a perfectly defined impact pathway model is of no practical use if it relies on unavailable input data. In total, 239 countries are listed by the World Bank data sets (The World Bank, 2023c). Of these, 129 countries are fully defined (∼54%), with a further 32 (∼13%) missing only one single data point. Completeness of coverage is detailed in Table 1, Figure 10.
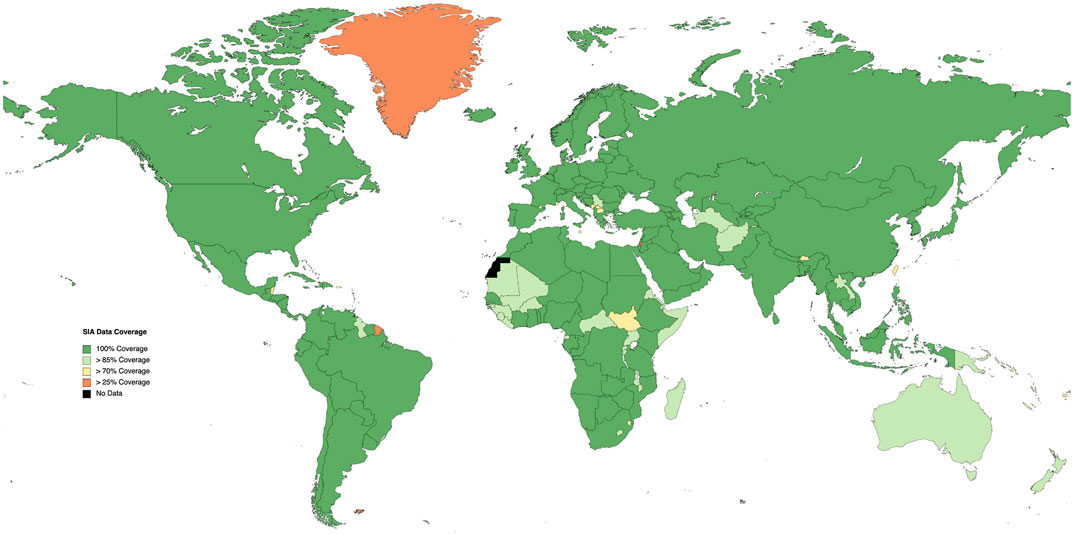
Figure 10. SIA characterisation model coverage map.
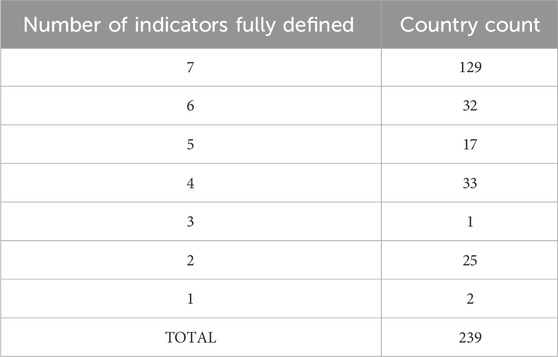
Table 1. Model coverage based on the number of indicators fully characterised per nation.
These calculations reveal that most indicator scoring profiles (four of seven) exhibit a mean value of 0.5 ± 0.1, the midpoint of the normalisation scale. These are: the risk of child labour, risk of change in access to electricity, occupational safety and health, and utilisation of hazardous materials.
Further examination shows that of these four indicators, occupational safety and health, and utilisation of hazardous materials exhibit significant skew (−1.3934 and −1.8647, respectively). In both cases, this can be attributed to very low scores for African nations. While a statistically significant skew, this is not considered a methodological shortcoming. Instead, it reveals markedly poor national performance relative to the global averages. Compopunding this, a correlation between these indicators is expected. When these final indicator scores are paired for each country, a correlation of 0.9229 is observed (ref. Table 3), verifying the previous assumption.
In contrast, three indicators show mean scores with significant deviation from the midpoint: risk of forced labour (0.7408), risk of change in access to water (0.7699), and risk of land use change (0.3444). Of these, only the risk of forced labour has an insignificant skew, indicating generally high scores for most nations. This is attributed to two factors: relatively low average national prevalence, and significantly elevated national prevalence in the DPRK (resulting in a slightly outlying lower bound for normalisation). The other two cases of deviated means (risk of change in access to water and risk of land use change) can be explained by regional concentrations of risk and security respectively, producing sets of geographically related outlying nations. In the case of risk of change in access to water, this is attributed to elevated water supply risk in the Middle East, confirmed by the CM results in Figure 6 and the ESI. The deviated mean value for land use change, delivering typically low national scores, is attributed to very low risk in countries with sparse populations (e.g., Greenland, Iceland, and Australia).
Collinearity of national indicator rankings is characterised within Table 3, allowing for the identification of potentially related social impacts. Where high collinearity is identified, the utility of assessing both indicators may be reduced, helping practitioners and stakeholders to streamline an assessment’s goal and scope. Several indicator pairs exhibit a strong correlation: risk of forced labour and risk of child labour (0.7259), risk of child labour and OSH (0.7609), and OSH and utilisation of hazardous materials (0.9229). While an interesting insight into inter-indicator causal relationships, this alone should not independently drive the omission of an indicator if it is highly relevant to the scope of the SIA. However, it may aid the selection of indicators in time-constrained or screening assessments.
Examining the national scores across the CMs developed, some intriguing findings are revealed. For example, the CM for risk of access to electricity prescribes the highest overall score to the Democratic People’s Republic of the Congo (0.9674). Since 2012, the country has had a relatively stable, forward-looking, 99% renewable electricity mix, with 96% of this being hydroelectric (Inga I and Inga II dams) (U.S. Department of Commerce, 2022; International Renewable Energy Agency, 2023), supporting the result.
When examining OSH, many of the highest-scoring nations are micronations, such as Nauru, Tokelau and Turks and Caicos (scores detailed within the Supplementary Material). These high scores are explained by their import of many goods produced through hazardous industries, themselves lacking the resources or demand to support domestic operations. However, the scope of this assessment focuses on value chains. Consequently, any assessment of goods derived through hazardous industry would include the producing country, not simply the country in which end-use resides. For this reason, the highly positive scores for micronations are deemed accurate, however, do not impact assessment validity.
6 Discussion
This work represents a first step towards value chain-oriented impact pathway SIA CMs, delivering a novel development in the pursuit of harmonised holistic sustainability assessment. Previously, reference scale approaches have dominated within parallel lifecycle, techno-economic and social sustainability assessments (McCord, et al., 2021). This bifurcation in impact characterisation methods has been identified in previous literature as a barrier to fully integrated studies (Newman and Styring, 2023). Through the this set of initial impact pathway SIA CMs, the difficulties surrounding the integration of SIAs to holistic assessments are rectified, most notably the subjectivity and reliance on practitioner judgment observed within previous reference scale approaches.
Methodologically, the seven selected indicators follow similar approaches, each utilising open literature to examine appropriate stimulating and de-stimulating factors. They are then aggregated using specified formulae. These are derived to both effectively utilise the collected data, and to normalise the national scores. However, in the cases of risk of change in access to electricity and risk of change in access to water, significant skew (up to a magnitude of 14.07) can be seen in the data sets of the stimulating and de-stimulating factors. Causation can be traced to the presence of extreme outlier countries. These are systematically removed by the specification of artificial normalisation boundaries. Through this, outlier scores are assigned a normalised value of either one or zero, depending on the direction in which they exceed the boundaries. Failure to remedy such extreme skews would lead to either a dampened or amplified contribution of the factor to the overall aggregated indicator scores. Positive skews lead to dominant factor behaviour, whereas negative skews deliver recessive behaviour. Through the use of the mentioned artificial normalisation boundaries, all indicators exhibit final skews of
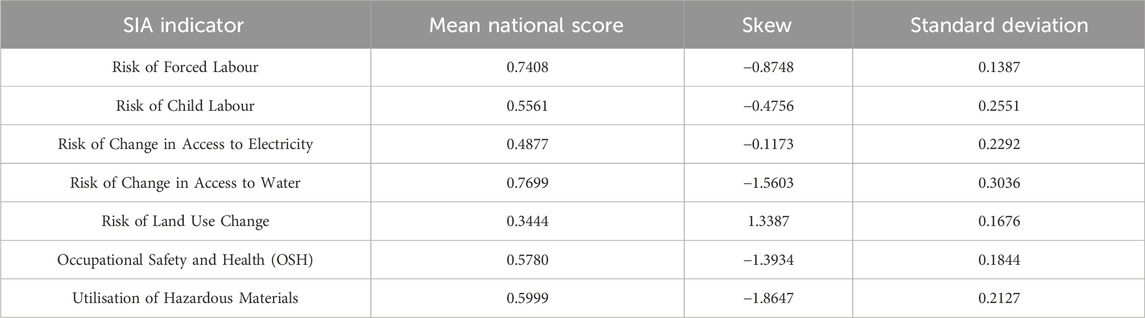
Table 2. Mean and skewness values for the derived SIA indicator CM data sets.
Examination of collinearity between indicators (Table 3) shows some strong links; for example, a correlation coefficient of 0.9229 for OSH and utilisation of hazardous materials. While these are not unexpected, it does raise interesting questions around the selection of indicators. Should strongly colinear indicators be assessed within the same study, or can their correlations be used to evaluate factors vicariously? Ultimately, this should depend on the goal and scopes of specific CM applications.
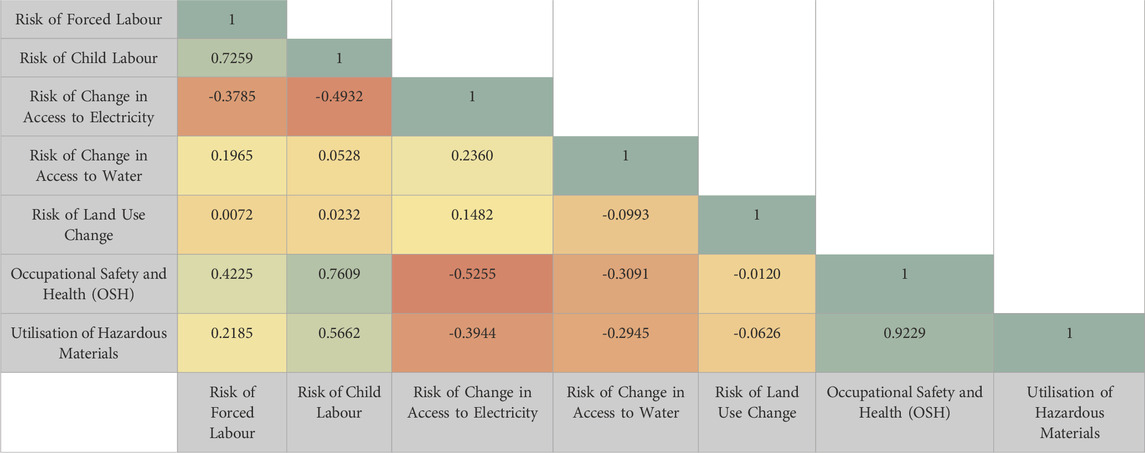
Table 3. Collinearity between national indicator scores. These values only include the 129 countries for which all seven indicators are fully defined. Green denotes high collinearity, with red indicating low collinearity.
Several objectives, or requirements, of the CMs were detailed in the introduction. These were specified to ensure relevance to the development of novel CDU value chains and included; applicability to a wide range of TRLs and technology types, assessment of pre-deployment scenarios, reliance on open-source data, and a national level geographic resolution. Each of these is discussed, determining the degree of attainment realised.
The development of CDU oriented value chains, an unavoidable challenge if such processes are to be commercialised at meaningful scale, must often occur in the absence of primary or deployed data. By adopting a red-flag approach, and removing all reliance on primary process data, the CM procedures are successfully aligned with the evaluation of CDU projects. Simultaneously, this avoidance of primary data delivers the desired applicability to the broad TRL range observed in CDU technologies. Consequently, a ‘level playing field’ is attained, upon which overly cautious or optimistic low TRL CDU processes do not receive an undue data-induced penalty or advantage. Such comparative assessments of CDU projects was previously identified in literature as lacking (McCord, et al., 2018; McCord, et al., 2021), directly highlighting the utility and value addition of the developed CMs.
The requirement to use methodologically prescribed, and open source, databases (primarily the World Bank) delivers greater assessment transparency to all stakeholders. If all assessments were to utilise the same impact pathway reporting methods and metrics, issues around comparability (as mentioned by Zimmermann and Schomäcker (2017) in the context of CDU TEA) would be significantly reduced. The World Bank is also utilised as a primary data source within the PSILCA v.3 methodology (Maister, et al., 2022), aligning this work’s approach to that of methodologies examining deployed systems. Furthermore, the use of the World Bank database facilitates the incorporation of temporal updates, allowing the CMs to reflect ongoing progress or regression at the national level. In effect, the ranking order of countries against a given indicator becomes dynamic, mirroring reality through the incorporated range of real-world stimulating and de-stimulating factors.
Having identified early in the paper that the pre-deployment state of many CDU projects necessitates impact risk characterisation on a national level, data is extracted from the World Bank and applied through the CMs on this basis. Examination of Table 1 shows that 129 countries, a majority of those listed by the World Bank (53%), are fully defined across all seven indicators. Many more (32 countries, or 29% of those not fully defined) require remedial action over only a single data point. In total, only 12% of nations realise coverage in less than half of the indicators. Additionally, most countries exhibiting data gaps are, in terms of land area, very small, or lack unanimous international recognition (e.g., Taiwan). It is proposed that imputation be used to remedy these issues where necessary, manually filling the identified data gaps. However, this practice requires care in order to select meaningful proxy values. Implemented procedures should involve the use of data from an analogous nation, with fitness being based on both the country’s GDP per capita and geographic proximity. A more simplistic approach, such as the use of a neighbouring country’s data, can lead to inaccuracies stemming from factors such as incongruent socioeconomic profiles or the State’s public spending capacity (e.g., PDRK and S. Korea). In addition, where this is carried out, resulting studies should acknowledge the use of proxy data and transparently communicate the nature of any remedial action taken.
The most notable data coverage issues occur where performance metrics are evaluated as an average for large geographic areas, hampering granularity. National-level data is far more valuable to an assessment practitioner than continental. The only encountered example of continent-based reporting can be seen in UNICEF’s child labour prevalence figures; the report also omits Oceania (International Labour Organization and United Nations Children’s Fund, 2021). In this specific case, the strong correlation between causal factors of both forced and child labour permitted the augmentation of scores using the WFF’s vulnerability score. This effectively tunes the national performances within each UN SDG region, delivering a more representative and granular indicator score. Despite the positive impacts of this strategy, ideally, it will be superseded in the future by more detailed child labour specific data.
Through these incorporated attributes the methods developed are seen to be highly applicable in the context of CDU value chains, catering to all of the identified nuances and difficulties. It should be recognised that these CMs are less granular than LCA CMs, and potentially the PSILCA database; however, this is currently unavoidable in the evaluated context (extensive TRL range and pre-deployment). It is proposed that once CDU as a field reaches maturity and widespread deployment, more generically applicable SIA approaches can be taken. However, the application of impact pathway-based methods should be proliferated in favour of reference scales.
As demonstrated, impact pathway assessments offer significantly enhanced repeatability when compared to their reference scale counterparts, circumventing the utilisation of practitioner judgement. Using relevant quantitative data and clearly specified calculation procedures, the delivered CMs are highly comparable to those of LCA and TEA, with the only major deviation being the previously noted geographic granularity. Consequently, any practitioner, irrespective of experience or background, should derive identical indicator results for the same system and assessment boundary. This is one of the cornerstone values of LCA and TEA CMs and should be adopted more comprehensively within SIA. In contrast, the reference scale approach’s reliance on the practitioner’s placement of alternatives on statement or criteria-based incremental scales, invites subjectivity and bias while simultaneously delivering less accountability or justification.
Such benefits to CDU oriented assessments are, however, achieved at the expense of other aspects. These include but are not limited to local reporting completeness and practices, quantifying the effectiveness of remedial actions, and perturbations in geopolitical stability. To fully understand the net scientific value addition delivered by the proposed CMs, these factors must be explored, and their implications clearly communicated.
The utility of, and confidence in, the generated indicator results would benefit significantly from the inclusion of reporting quality metrics. It is a reasonable assumption that less industrially developed nations will have less reliable reporting practices around many indicators, for example, the utilisation of hazardous materials. Quantification of reporting completeness is currently absent from the utilised literature; however, it should be incorporated as a measure of uncertainty if or when it is available.
Some of the assessed indicators also lack valuable stimulating and de-stimulating factors due to their absence from open-source data. Key examples include the percentage of the population with access to reliable water and electricity. While such information is partially available, covering specific countries within isolated assessments, a consistent calculation method and broad coverage remain elusive. Aggregation of data from independent assessments would result in an unreliable and incomparable inventory, even in cases where full geographical coverage can be achieved. If a levelized quantification procedure and results are made available for these factors in literature, their integration would significantly augment the insights generated through the CMs.
Despite the CM’s delivery of quantified indicator results, this does not in itself help organisations to mitigate the risk of negative social impact hotspots. As a red-flag risk-based assessment, this is expected. Direct resolution strategies can realistically only be identified in assessments of deployed activities. While this represents a limit of the study, it is one that will impact all pre-deployment assessment methodologies equally. Instead, it is suggested that maximum utility is extracted from the CMs by using it to focus monitoring and mitigation efforts during the deployment phase on areas identified as high risk. This will allow the operating organisation to plan and optimise CDU value chains around these high-risk areas, hopefully reducing the final realised impacts.
Geopolitical stability, or lack thereof, is another growing source of inaccuracy within SIA. All organisations, including those targeting the deployment of CDU technologies, are facing more frequent and severe geopolitical events (The Economist Imapct, 2022). Such incidents can significantly elevate the risks of negative social impact. While not typically a consequence of the operating organisations actions, the accuracy of results is clearly impacted. Where this issue is observed, it is expected that the organisation would already be suspending deployment, or at the very least exercising additional due diligence. In light of this fact, and the case specific nature of such issues, they are not targeted for resolution.
As noted in the literature review, there are several philosophical commonalities between this work and the PSILCA database approaches. The similarities and differences must therefore be assessed from a methodological stance by consulting the PSILCA database’s documentation (GreenDelta, 2022); a quantified results-based comparison would require conduction of an applied case study and access to the paywall protected database. To this end, the seven developed indicator calculation procedures have been compared to their PSILCA counterparts. Initially, it is noticed that several indicators do not have a PSILCA equivalent and therefore cannot be compared: access to electricity, risk of land use change, and utilisation of hazardous material. Additionally, within PSILCA, reporting is not carried out on a comparable numerical basis. Instead, the indicators have their own quantified scoring approach which is then transposed to a risk-based reference scale (e.g., no risk, very low risk, low risk, etc.). Through this, the methodologies presented in this paper offer more easily interpreted results and, overall, a greater degree of granularity through the avoidance of reference scales.
Beyond these cases, subtle but notable divergences in methods can be observed. The most notable case is seen in the child labour indicator. Where the approach developed in this work examines both prevalence and future vulnerability, the PSILCA database focuses on purely prevalence; inclusion of future vulnerability represents a significant additional insight. Furthermore, the threshold for what constitutes child labour is lower within PSILCA’s offering, including anything above 1 hour of economic activity per week as child labour. In contrast, the proposed methodology uses the UNICEF definition (see Figure 1) with more nuanced categorisation considering aspects such as hazard level.
Forced labour is considered on a broader basis within PSILCA then this paper’s methodology, incorporating debt bondage, forced marriage, and child labour within the impact characterisation. While this expands coverage, there is discussion to be had around whether these impact mechanisms should fall under the umbrella of forced labour, or if they deserve consideration within their own indicator. At their cores, the two methods are procedurally very similar, both utilising the Global Slavery Index as an initial data source.
Access to water is approached from opposing classification ideologies. Where PSILCA evaluates access to drinking water, the methodology developed in this work looks at the more general availability of water as a resource. The PSILCA approach examines the local proximity of potable water sources to domestic dwellings, while generating high resolution insights, the approach conflicts with the lack of geographic specificity often surrounding CDU projects.
Finally, the occupational safety and health indicator (referred to as health and safety within PSILCA) is handled very similarly within the two methodologies. The primary differentiator is aggregation. Within this paper the non-fatal and fatal accidents are normalised, and the two values averaged to deliver a single indicator value. In contrast, PSILCA reports the two scores independently. While granularity is improved through PSILCA’s approach, this brings with it difficulties in balancing trade-offs between the two values. Utilisation of the same data sets ensures highly comparable results between the two methods.
Future work in the area should include the identification of a quantified indicator score threshold, below which a clear red flag is raised, indicating an elevated duty to due diligence. This would allow for clear and consistent communication of results to non-practitioners. Furthermore, such a standardised approach would remove the dependency of hotpot identification on less repeatable practitioner judgment. Remedial approaches may adopt a relative scale, flagging results below an nth percentile of national scores. Alternatively, an absolute threshold may be specified (the more likely solution), removing the potential for misleading results within indicators exhibiting significant data skewness.
Sensitivity analysis around the weighting of each CM’s stimulating and restimulating factors would also add significant value. Furthering understanding around the factors relationships and influence on national rankings. Such work may inform a future revision of weightings.
A final obvious avenue for development is the development of CMs for additional indicators. As an initial proof of concept, this work only tackles a sub-set of UNEP and SETAC’s noted impact sub-categories. To achieve broader applicability to a diverse range of goals and scopes, the current set must be expanded relatively significantly. Once completed, a full foundation will have been constructed for future impact pathway-based screening SIAs.
7 Conclusion
In conclusion, this proof-of-concept exercise has successfully demonstrated the utility of impact pathway SIA CMs in the context of CDU value chain development, while also realising applicability to more general use cases. The nuances of application scenarios, usually including integration with LCA and TEA, significantly reduce the effectiveness of reference scale-based social assessments.
Deployment of the developed methodology can repeatably and transparently assess international value chains, highlighting likely impact hotspots. The result is more efficient resource use concerning impact-related due diligence. Significant value can be seen within the setting of industrial strategic decision-making, expanding the understating of social risk, and accelerating mitigation efforts.
As an example of utility in decision-making support, a process relying on large process water feed rates (e.g., metal surface finishing) would be more sensitive to deployment in regions exhibiting poor performance within the ‘risk of change in access to water’ indicator. With this identified as a potential issue at an early stage, additional precautions can be taken to ensure that the process is relocated, or that water demands are not met at the detriment of social impact stakeholders.
As identified in the literature and earlier sections of this paper, the complexity of social impact pathways represents a significant and recognised challenge. An ideal scenario would incorporate hyper-granular data, detailing every included community, allowing for the accurate tracing of impact propagations. In this, temporally accurate, bespoke models would be required for every constituent community, accurately reflecting cultures, local behaviours, attitudes, and needs. This is a significant and potentially impossible task. Consequently, this paper’s proposal of red-flag-based value chain assessments provides a pragmatic and balanced solution. With risk hotspots identified, more energy and resources can be accurately deployed to formulate bespoke mitigation strategies.
Indicator selection is far from uniform within the SIAs observed in the literature, an unavoidable consequence of highly diverse goal and scope requirements. However, it is recommended that the development of impact pathway-oriented SIA CMs continue to be developed in a manner aligned with the impact categories and sub-categories found within the UNEP and SETAC guidelines. These are selected due to their wide acceptance as the gold standard within SIA practitioner guidance. Furthermore, the development of competing CMs, as seen in LCA, often further fragments the field. If commonality can be achieved in the CMs used by practitioners, more meaningful inter-assessment comparisons can be made, adding significant value to all stakeholders.
A final notable step taken in this work is the delivery of fully quantified impact indicator results, replacing the semi-quantitative values produced via reference scales. In this, a greater degree of granularity is realised through the use of a continuous scoring scale. Differences between competing alternatives can, therefore, be examined in higher resolution, avoiding the (typically) five-point scales seen in existing work.
While significant future work is required to reach the maturity seen in LCA CMs, the concept can be viewed as proven, albeit on a modest scale.
Data availability statement
The original contributions presented in the study are included in the article/Supplementary Material, further inquiries can be directed to the corresponding authors.
Author contributions
AN: Conceptualization, Data curation, Formal Analysis, Investigation, Methodology, Writing–original draft, Writing–review and editing. RR: Supervision, Visualization, Writing–original draft, Writing–review and editing. PS: Supervision, Writing–original draft, Writing–review and editing.
Funding
The author(s) declare that financial support was received for the research, authorship, and/or publication of this article. This study received funding from Unilever PLC. The funder was not involved in the study design, collection, analysis, interpretation of data, the writing of this article or the decision to submit it for publication.
Conflict of interest
The authors declare that the research was conducted in the absence of any commercial or financial relationships that could be construed as a potential conflict of interest.
The author(s) declared that they were an editorial board member of Frontiers, at the time of submission. This had no impact on the peer review process and the final decision.
Publisher’s note
All claims expressed in this article are solely those of the authors and do not necessarily represent those of their affiliated organizations, or those of the publisher, the editors and the reviewers. Any product that may be evaluated in this article, or claim that may be made by its manufacturer, is not guaranteed or endorsed by the publisher.
Supplementary material
The Supplementary Material for this article can be found online at: https://www.frontiersin.org/articles/10.3389/fenrg.2024.1359593/full#supplementary-material
References
Azapagic, A. (2004). Developing a framework for sustainable development indicators for the mining and minerals industry. Journalof Clean. Prod. 12 (6), 639–662. doi:10.1016/s0959-6526(03)00075-1
Becker, H. A. (2001). Socialimpact assessment. Eur. J. Operational Res. 128 (2), 311–321. doi:10.1016/s0377-2217(00)00074-6
Benoît Norris, C., Norris, G., Azuero, L., and Pflueger, J. (2019). Creating social handprints: method and case study in the electronic computer manufacturing industry. Resources 8, 176. doi:10.3390/resources8040176
Chauvy, R., Meunier, N., Thomas, D., and De Weireld, G. (2019). Selecting emerging CO2 utilization products for short-to mid-term deployment. Appl. Energy 236, 662–680. doi:10.1016/j.apenergy.2018.11.096
Creutz, C., and Fujita, E. (2001). “Carbon dioxide as a feedstock,” in Carbon management: implications for R&D in the chemical Sciences and technology: a workshop report to the chemical Sciences roundtable (Washington, D.C.: National Academy Press), 83–92.
Department for Environment, Food and Rural Affairs (2023). Get funding for farming in protected landscapes. Available at: https://www.gov.uk/guidance/funding-for-farmers-in-protected-landscapes (Accessed August 18, 2023).
Di Cesare, S., Silveri, F., Sala, S., and Petti, L. (2018). Positive impacts in social life cycle assessment: state of the art and the way forward. Int. J. Life Cycle Assess. 23, 406–421. doi:10.1007/s11367-016-1169-7
Dimitriou, I., García-Gutiérrez, P., Elder, R. H., Cuéllar-Franca, R. M., Azipagic, A., and Allen, R. W. K. (2015). Carbon dioxide utilisation for production of transport fuels: process and economic analysis. Energy and Environ. Sci. 6. doi:10.1039/C4EE04117H
Ekener, E., Hansson, J., and Gustavsson, M. (2018). Addressing positive impacts in social LCA—discussing current and new approaches exemplified by the case of vehicle fuels. Int. J. Lifecycle Assess. 23, 556–568. doi:10.1007/s11367-016-1058-0
European Commission - Joint Research Centre - Institute for Environment and Sustainability (2010). International reference life cycle data system (ILCD) Handbook - general guide for life cycle assessment - detailed guidance. Luxembourg: Publications Office of the European Union.
Food and Agriculture Organization of the United States (2023). AQUASTAT - FAO's global information system on water and agriculture. Available at: https://www.fao.org/aquastat/en/(Accessed August 18, 2023).
Goedkoop, M., Indrane, D. and I. M., and d, B. (2018). Product social impact assessment Handbook, amersfoort: s.n.
GreenDelta (2022). PSILCA: understanding social impacts. Available at: https://psilca.net (Accessed January 19, 2024).
Huarachi, D. A. R., Piekarski, C. M., Puglieri, F. N., and de Francisco, A. C. (2020). Past and future of social life cycle assessment: historical evolution and research trends. J. Clean. Prod. 264, 121506. doi:10.1016/j.jclepro.2020.121506
International Energy Agency (2023). Democratic republic of the Congo. Available at: https://www.iea.org/countries/democratic-republic-of-the-congo (Accessed August 18, 2023).
International Labour Conference Protocol to Convention (2014). International labour conference Protocol to convention No. 29.
International Labour Organization (2003). The enormous burden of poor working conditions. Available at: https://www.ilo.org/moscow/areas-of-work/occupational-safety-and-health/WCMS_249278/lang--en/index.htm (Accessed August 18, 2023).
International Labour Organization (2023). Data. Available at: https://ilostat.ilo.org/data/(Accessed August 18, 2023).
International Labour Organization and United Nations Children’s Fund (2021). Child Labour: global estimates 2020, trends and the road forward. New York, NY: ILO and UNICEF.
International Renewable Energy Agency (2023). Energy profile: democratic republic of the Congo. Available at: https://www.irena.org/-/media/Files/IRENA/Agency/Statistics/Statistical_Profiles/Africa/Democratic-Republic-of-the-Congo_Africa_RE_SP.pdf (Accessed September 4, 2023).
ISO Technical Committee 207 (2006a). ISO14040:2006 Environmental management - lifecycle assessment - principles and framework. Geneva, Switzerland: International Standards Organisation.
Jørgensen, A., Le Bocq, A., Nazarkina, L., and Hauschild, M. Z. (2007). Methodologies for social life cycle assessment. Int. J. Lifecycle Assess. 13 (2), 96–103. doi:10.1065/lca2007.11.367
Klöpffer, W. (2003). Life-Cycle based methods for sustainable product development. Int. J. Lifecycle Assess. 8, 157–159. doi:10.1007/bf02978462
Kühnen, M., and Hahn, R. (2017). Indicators in Social Life Cycle Assessment - a review of frameworks, theories, and empirical experience. J. Industrial Ecol. 21 (6), 1547–1565. doi:10.1111/jiec.12663
Kuhnen, M., and Hahn, R. (2019). From slca to positive sustainability performance measurement: a two-tier delphi study. J. Industrial Ecol. 23 (3), 615–634. doi:10.1111/jiec.12762
Li, N., Mo, L., and Unluer, C. (2022). Emerging CO2 utilization technologies for construction materials: a review. J. CO2 Util. 65, 102237. doi:10.1016/j.jcou.2022.102237
Mahama, A. M., Anaman, K. A., and Osei-Akoto, I. (2014). Factors influencing householders’ access to improved water in low-income urban areas of Accra, Ghana. J. Water Health 12 (2), 318–331. doi:10.2166/wh.2014.149
Maister, K., Di Noi, C., Ciroth, A., and Srocka, M. (2022). PSILCA v.3 Database documentation. Berlin, Germany: GreenDelta.
Mancini, L., and Sala, S. (2018). Social impact assessment in the mining sector: review and comparison of indicators frameworks. Resour. Policy 57, 98–111. ISSN 0301-4207. doi:10.1016/j.resourpol.2018.02.002
McCord, S., Armstrong, K., and Styring, P. (2021). Developing a triple helix approach for CO2 utilisation assessment. Faraday Discuss. 230, 247–270. doi:10.1039/D1FD00002K
McCord, S., Zaragoza, A. V., Langhorst, T., Strunge, T., Cremonese, L., Schomäcker, R., et al. (2018). “Part E: integrated TEA and LCA guidelines,” in Techno-economic assessment and life cycle assessment guidelines for CO2 utilization (version 2) (Ann Arbor: Global CO2 Initiative), 255–301.
Newman, A. J. K., Dowson, G. R. M., Platt, E. G., Handford-Styring, H. J., and Styring, P. (2023). Custodians of carbon: creating a circular carbon economy. Front. Energy Res. 11. doi:10.3389/fenrg.2023.1124072
Newman, A. J. K., and Styring, P. (2023). The pursuit of methodological harmonization within the holistic sustainability assessment of CCU projects: a history and critical review. Front. Sustain. 3 (1). doi:10.3389/frsus.2022.1057476
Norris, G. (2006). Social impacts in product life cycles towards life cycle attribute assessment. Int. J. Life Cycle Assess. 1, 97–104. doi:10.1065/lca2006.04.017
Ojuka, A. J., and Tumwebaze, I. K. (2022). Under-five diarrhoea prevalence and access to safe drinking water,sanitation and hygiene services in an urban centre, Northern Uganda. Front. Public Health 10. doi:10.3389/fpubh.2022.962108
Pieri, T., Nikitas, A., Castillo-Castillo, A., and Angelis-Dimakis, A. (2018). Holistic assessment of carbon capture and utilization value chains. Environments 5 (10), 108–117. doi:10.3390/environments5100108
Pollok, L., Spierling, S., Endres, H.-J., and Grote, U. (2021). Social life cycle assessments: a review on past development, advances and methodological challenges. Sustainability 3, 10286. doi:10.3390/su131810286
Rafiaani, P., Dikopoulou, Z., Van Dael, M., Kuppens, T., Azadi, H., Lebailly, P., et al. (2019). Identifying social indicators for sustainability assessment of CCU technologies: a modified multi-criteria decision making. Soc. Indic. Res. 147, 15–44. doi:10.1007/s11205-019-02154-4
SHDB (2022). SOCIAL DATA FOR RESPONSIBLE AND INTEGRATED BUSINESS DECISIONS. Available at: http://www.socialhotspot.org (Accessed February 19, 2024).
Stavytskyy, A., Kharlamova, G., Komendant, O., Andrzejczak, J., and Nakonieczny, J. (2021). Methodology for calculating the energy security Index of the state: taking into account modern megatrends. Energies 14, 3621. doi:10.3390/en14123621
Stiching Global Reporting Initiative (2021). Gri 1: foundation 2021, s.l.: global sustainability standards board.
The Economist Imapct (2022). Business in an era of heightened geopolitical instability: briefing report. London, United Kingdom: The Economist Group.
The World Bank (2023a). Explore. Create. Share: development data. Available at: https://databank.worldbank.org/home.aspx# (Accessed August 18, 2023).
The World Bank (2023b). Who we are. Available at: https://www.worldbank.org/en/who-we-are (Accessed August 18, 2023).
The World Bank (2023c). World Bank open data. Available at: https://data.worldbank.org (Accessed August 18, 2023).
UNEP (2020). Guidelines for social life cycle assessment of products and organizations 2020. Nairobi, Kenya: United Nations Environment Programme UNEP.
United Nations (2015a). Transforming our world: the 2030 agenda for sustainable development. New York, NY: United Nations.
United Nations (2015b). Transforming our world: the 2030 agenda for sustainable development. New York, New York: United Nations General Assembly.
U.S. Department of Commerce (2022). Democratic republic of the Congo - country commercial guide. Available at: https://www.trade.gov/country-commercial-guides/democratic-republic-congo-energy#:∼:text=Hydroelectric%20power%20accounts%20for%2096,Inga%20back%20to%20full%20capacity (Accessed August 18, 2023).
Walk Free Foundation (2018). The global Slavery Index 2018, nedlands, Australia: the minderoo foundation.
World Health Organisation (2016). WHO/ILO Joint estimates of the work-related burden of disease and injury. Available at: https://www.who.int/teams/environment-climate-change-and-health/monitoring/who-ilo-joint-estimates (Accessed August 22, 2023).
World Resources Institute (2022). Indicators of forest designation - protected forests. Available at: https://research.wri.org/gfr/forest-designation-indicators/protected-forests (Accessed August 17, 2023).
Keywords: sustainability, carbon capture and utilisation, CDU, social impact assessment (SIA), characterisation methods
Citation: Newman AJK, Rothman RH and Styring P (2024) Characterisation of negative social impact risks within pre-deployment carbon dioxide utilisation projects. Front. Energy Res. 12:1359593. doi: 10.3389/fenrg.2024.1359593
Received: 24 January 2024; Accepted: 12 April 2024;
Published: 04 June 2024.
Edited by:
Carlo Pastore, National Research Council (CNR), ItalyReviewed by:
Ingrid Kaltenegger, Joanneum Research, AustriaGeorge Tsalidis, Brunel University London, United Kingdom
Copyright © 2024 Newman, Rothman and Styring. This is an open-access article distributed under the terms of the Creative Commons Attribution License (CC BY). The use, distribution or reproduction in other forums is permitted, provided the original author(s) and the copyright owner(s) are credited and that the original publication in this journal is cited, in accordance with accepted academic practice. No use, distribution or reproduction is permitted which does not comply with these terms.
*Correspondence: Alex J. K. Newman, YS5uZXdtYW5Ac2hlZmZpZWxkLmFjLnVr; Peter Styring, cC5zdHlyaW5nQHNoZWZmaWVsZC5hYy51aw==