 Hui Liu1
 Rui Su
 Siqi Yu
- 1Electric Power Research Institute, State Grid Jibei Electric Power Company Limited, Beijing, China
- 2International Graduate School at Shenzhen, Tsinghua University, Shenzhen, China
- 3Sichuan Energy Internet Research Institute, Tsinghua University, Chengdu, China
The power-electronics converters are increasingly applied in modern power system, which contains various sub-systems, such as renewable energy power plants and high voltage direct current transmission systems, etc. The electromagnetic transient simulation has been one of the important tools for the study of complex system containing large numbers of power converters. The coordination control of the power converters and corresponding power generation and load units is one of the challenges ensuring stability and obtaining optimal efficiency. However, the detailed modeling of the power converters considering the conduction and switching losses can cost a great number of computation resources, which makes it difficult to simulate a large system. This work proposed a current injection method for converter power loss representation, which can accurately consider the conduction and switching losses of the power-electronics switches with low computation complexity. A look-up table (LUT) of the power loss ratio is calculated before the simulation, and a current source representing the power loss is connected in parallel with the converter to track the reference loss generated by the look-up table. The proposed method can be combined with multiple converter modeling schemes, such as the two-resistance model, the switching-function model, and the average value model, etc. The topologies of the two-level converter and the modular multi-level converter (MMC) were used in the case studies to demonstrate the effectiveness of the proposed method. Compared to the device-level model, the simulation power loss deviation is 0.64% and 4.13% applying the current injection method model in the case studies of the two-level converter and the MMC.
1 Introduction
Power-electronics converters are widely used in modern power system, which contains a large number of wind power plants, solar power plants, micro-grids, high voltage direct current (HVDC) transmission systems, etc (Ansari et al., 2020; Jin et al., 2020; Huang et al., 2021; Jamal et al., 2022). The study of the power-electronics system is not only constrained within the range of single or several converters but also the large power system composed of several tens or even hundreds of converters (Wickramasinghe et al., 2019; Gao et al., 2014). One of the research purposes is to study the coordination control for a large number of converters to obtain secure and efficient operation (Nguyen and Kim, 2021; Tong et al., 2019).
The electromagnetic transient (EMT) simulation is an essential tool for the transient phenomenon study, the control algorithm, and the protection algorithm for power-electronics systems and power systems (Dommel, 1969; Omar Faruque et al., 2015; Subedi et al., 2021). The study of optimal operation efficiency demands the accurate modeling of the major components considering the losses. This work is particularly interested in the modeling schemes of power-electronics converters considering the conduction and switching losses.
In the literature, many researchers focused on the detailed switch model applicable to electromagnetic transient simulation (Rajapakse et al., 2005; Shen and Dinavahi, 2016; Liang and Dinavahi, 2018; Lin and Dinavahi, 2018; Liu et al., 2019; Bai et al., 2020; Rajapakse et al., 2005) proposed the switch model with an accurate representation of switching loss and thermal status using differential equation parameters (Shen and Dinavahi, 2016); developed the device-level electrothermal model using parameters from the manufacturer’s datasheet applied for the modular multi-level converter (MMC) (Lin and Dinavahi, 2018); improved the electrothermal model and applied it to the hybrid HVDC breaker (Liang and Dinavahi, 2018); proposed the power electronics device model via Hammerstein configuration (Liu et al., 2019; Bai et al., 2020). proposed piecewise-based models for insulated gate bipolar transistor (IGBT) modules presenting the switching transient process.
Although the above-mentioned methods can present detailed device characteristics including accurate power loss, they cost high computation effort and some of the methods rely on dedicated computation platforms, such as field programmable gate arrays (FPGAs). The above-mentioned methods can be very time-consuming for offline electromagnetic transient simulation on a PC for a large system. In the system-level study, the overall losses for a converter during various operation conditions are focused on rather than the losses of individual switches. To ensure the accuracy of the converter loss, the characteristics of individual switches shall be considered. This work proposed a current injection method, which can accurately represent power converter conduction and switching losses. The method first prepares the power loss ratio look-up table (LUT) for different switching frequencies and current ratings using the curves from the manufacturers’ datasheet. During the simulation period, a current source is applied at the converter DC side to track the accurate power loss obtained from the LUT with the inputs of instantaneous power and switching frequency. Using the proposed scheme, the power loss of the converter can be adjusted to match the practical system. The proposed method is independent of the converter topology and the modeling scheme of the converter. Therefore, this method can be used for various topologies, such as the two-level converters, which are widely used in wind and solar power plants, the three-level converters, and the modular multi-level converters used in the HVDC transmission system. Besides, the proposed current source branch can be combined with various methods including the two-resistance model, the switching function model, the average value model, and the equivalent circuit method for MMC. The two-level converter and MMC have significant differences in complexity and operation principles, therefore they are taken as examples to demonstrate the effectiveness of the proposed method.
This paper is organized as follows: Section 2 introduces the converter modeling schemes for the two-level converter and MMC. Section 3 describes the proposed method in detail. Section 4 presents the simulation results using the proposed method with the case studies, followed by the conclusions in Section 5.
2 Two-level converter and MMC model
This section briefly introduces the topology and the commonly used modeling schemes for both two-level converter and MMC.
2.1 Two-level converter
2.1.1 Topology
Figure 1 presents the topology of the two-level converter containing 6 IGBT and diode pairs. By controlling the gating signals, the switching devices conduct in-turns and the converters generate pulse-width modulated voltage waveform at the AC terminals. The switching devices have non-ideal characteristics during the control cycles with switch-on and switch-off transients as well as conduction voltage drops, which contribute to the switching loss and the conduction loss correspondingly.
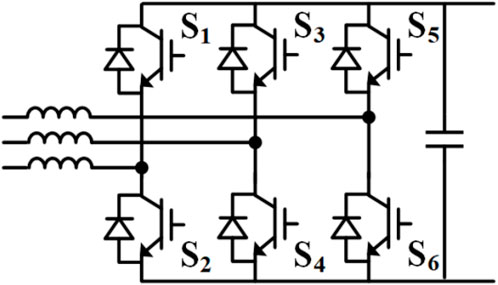
FIGURE 1. The topology of the two-level converter.
2.1.2 Physics and behaviour model
The physics model applies differential equations to represent the internal structure of the power electronics devices, which can accurately simulate the transients of the switching process (Kraus and Mattausch, 1998). The behavior model simplifies the parameters which are not necessarily related to the structure and material of the device (Myaing and Dinavahi, 2011). However, it still uses multiple nodes and non-linear components to model a single switching device. Both models are relatively complex using the typical time-step of several to several tens of nanoseconds. Although these models can accurately take the switching and conduction losses into account, they are not applicable to simulate a large system with many converters due to the enormous computation burden.
2.1.3 Two-resistance model
Two-resistance model uses small resistance for the on-state and large resistance for the off-state, which is one of the most common converter modeling schemes for EMT simulation (Maguire et al., 2018). By adding a voltage source in a series of the resistance representing the threshold voltage and slope resistance during the on-state, the conduction loss can be modeled.
2.1.4 Switching function and average value model
To further reduce the computation effort, the switching function model and the average value model are also commonly used for converter modeling, especially for a large system. These models use controlled sources as the interface, which can avoid the change of conductance matrix and the following complete matrix inversion process (Chiniforoosh et al., 2010). These models can have a one-time step delay in exchanging the voltage and the current values, and it may cause a minor power imbalance between the DC and the AC sides.
2.2 MMC
2.2.1 Topology
Figure 2 shows the topology of the MMC, which is composed of 6 six converter arms. Each arm contains an arm inductor and numerous series-connected sub-modules (SM). The half-bridge (HB) circuit shown in Figure 2 and the full-bridge (FB) circuit are mostly applied, and the sub-module number can be up to several hundred in a typical HVDC transmission system. Due to the relatively complex topology, modeling the MMC using discrete switches are not applicable with thousands of SMs, since the system has too many electrical nodes.
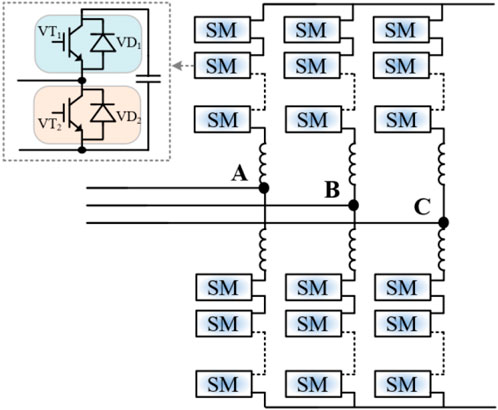
FIGURE 2. The topology of MMC with half-bridge sub-modules.
2.2.2 Equivalent model
Thevenin equivalence based methods were proposed in (Gnanarathna et al., 2011) to simplify the models of SMs. Series connected Thevenin equivalent interfaces are summed together reducing the electrical nodes significantly. In the real-time simulation, the computation of the Thevenin equivalence process can be further reduced by the equivalent circuit method or the surrogate network method (Maguire et al., 2013; Saad et al., 2015). Like the switching function and average value model for a two-level converter, the above equivalent models for MMC use a controlled source as the interface. Spurious power losses may occur due to some modeling equivalent methods or decoupling method introducing one-step delay. The spurious power losses introduced by the converter model scheme are difficult to calculate and are changing according to the time-step, and the operation state of the circuit.
2.2.3 Device-level model
In literature, device-level modeling schemes were proposed for the switching devices in MMC and other converter topologies (Shen and Dinavahi, 2016; Liang and Dinavahi, 2018; Lin and Dinavahi, 2018). It is noted that such models are not based on iterative solvers such as Spice but are developed for electromagnetic transient programs. The device-level model considers the switching characteristics of all individual switching devices using the values of the firing pulses, the current, and the voltage across each device. The characteristics are obtained from the manufacturer’s datasheet. The device-level model can accurately calculate the instantaneous switching loss and conduction loss. However, it requires high computation effort, which restricts the SM number in MMC applicable to these methods.
3 Proposed current injection method for accurate power loss representation
Based on the brief converter modeling schemes review in Section II, the detailed model considering device loss and high simulation speed can hardly be achieved simultaneously. Some models may even introduce spurious power loss.
This work adopts the concept of using the manufacturer’s datasheet of switching devices’ characteristics in EMT simulation and the process of extracting the characteristics from the datasheet (Shen and Dinavahi, 2016; Liang and Dinavahi, 2018; Lin and Dinavahi, 2018). The device-level modeling scheme costs very high computation effort calculating the losses for all the switching devices. This paper proposed a novel current injection method for accurate converter loss representation with low computation consumption. Similar to device-level modeling schemes, it uses the manufacturer’s datasheet to obtain the switching loss and conduction loss characteristics. A LUT with the inputs of the switching frequency and the instantaneous power is prepared before the simulation begins. During the simulation, the LUT is used to generate the reference power loss for a certain operational condition. A current source is added in parallel at the DC side of the converter to generate or absorb the power, therefore the converter’s overall loss can track the reference power loss accurately. To compensate for the spurious power loss during the simulation, a feedback loop is applied to track the reference power loss. The flow chart of the method is illustrated in Figure 3.
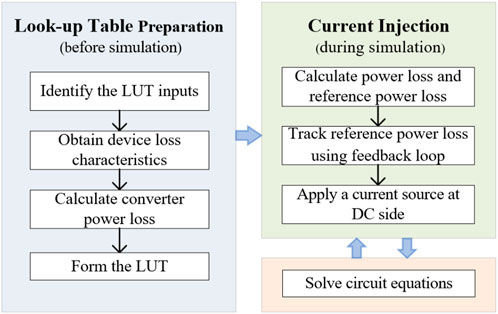
FIGURE 3. The flow chart of the proposed method.
3.1 Look-up table preparation
The converter losses are majorly composed of IGBT conduction loss, IGBT switch-on loss, IGBT switch-off loss, diode conduction loss, and diode reverse-recovery loss. The LUT is formed taking these loss characteristics into account, with the steps of identifying LUT inputs, obtaining device loss characteristics, and calculating converter power loss.
3.1.1 Identifying look-up table inputs
The proposed LUT stores the loss ratios for various power ratings, and the instantaneous power is one of the inputs of the LUT. The power loss ratio is also affected by the switching frequency, therefore the switching frequency is another input of the LUT. More variables, such as environment temperature, can also dynamically influence the loss ratio by introducing the third input, while not considered in this work.
3.1.2 Obtaining device loss characteristics
The output characteristics and switching loss curves of the switching devices can be obtained from the manufacturer’s datasheet. The curves are fitted by third-order polynomials. Figure 4 shows the IGBT conduction characteristics, IGBT switch-on loss, and IGBT switch-off loss of the Infineon FF 1800R23IE7P IGBT module (Infineon IGBT modules, 2023).
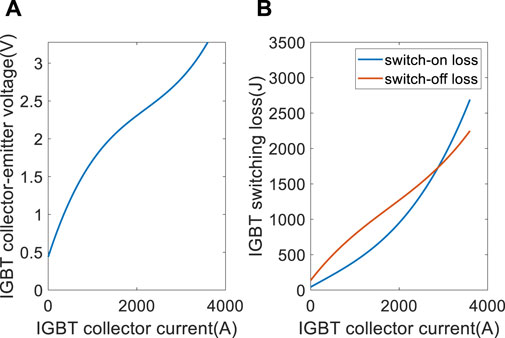
FIGURE 4. IGBT output characteristic curve: (A) IGBT conduction characteristics and (B) IGBT switching loss curve.
3.1.3 Calculating converter power loss
The conduction and switching losses change with the device current, therefore the device current shall be calculated first for certain instantaneous power input. For a two-level converter, the current through each switching device is a portion of the AC side current of each phase. The phase current can be calculated as Eq. 1:
where iph is the phase current; p is the instantaneous power; uph is the phase voltage; fn is the fundamental frequency; t is the simulation time. It is noted that harmonics are neglected in (1) for conduction loss calculation.
For the two-level converter, the phase current either flows through the upper arm or the lower arm. In other words, the conduction current of all devices in the upper and lower arms in the two-level converter is exactly the phase current.
For MMC, the arm current contains both the AC part and the DC part. Without considering the double-frequency circulation current, the bridge arm current for MMC is calculated by the Eqs. 2–4:
where idc is the DC current; udc is the DC voltage; iarm_U_MMC is the upper bridge arm current; iarm_L_MMC is the lower bridge arm current.
The calculation of the device current is based on the assumption that the turn-on time and turn-off time of the IGBT and diode are identical. Taking the upper IGBT and anti-parallel connected diode pair as module V1, and the lower IGBT and anti-parallel connected diode pair as module V2, the current flowing through V1 and V2 can be calculated as Eqs. 5–7:
where iv1 is the V1 current; iv2 is the V2 current; iarm is the arm current of the converter; Sj is the switching function of the jth submodule.
The conduction losses of both V1 and V2 can be calculated as Eqs. 8–10:
where T0 is the time-period of fundamental frequency; PV1 is the conduction loss of V1; PV2 is the conduction loss of V2; uCE is the collector-emitter voltage of IGBT; uF is the on-state voltage of diode; Pcond is the overall conduction loss of IGBT and diode.
By substituting Eqs. 5, 6, 8, 9 into 10, the conduction loss can be calculated as Eq. 11:
For switching loss calculation, the switching time instants are assumed evenly distributed within the period of the fundamental frequency. All the current samples during the cycles are used to calculate the switching energy loss. The average switching power loss of all devices in one phase of a two-level converter or a half-bridge SM in MMC can be calculated as Eq. 12:
where Psw is the overall switching loss of IGBT and diode; Esw_on is the switch-on loss of IGBT; Esw_off is the switch-off loss of IGBT; Esw_rec is reverse-recovery loss of diode; fc is the switching frequency; N is the sample points in a current period. Esw_on and Esw_off can be obtained from Figure 4B. Esw_rec can be obtained from the manufacturer’s datasheet with the same approach of obtaining Esw_on and Esw_off.
Multiplied by the number of repetitive units, the total power loss of the converter can be calculated. The power loss ratio represents the result of dividing power loss by transmission power. The power losses and the power loss ratio of the two-level converter and MMC can be calculated as Eqs. 13–16.
where Ploss_2L is the power loss of the two-level converter; Ploss_MMC is the power loss of MMC; NMMC is the SM number of one arm; Ratio2L is the power loss ratio of the two-level converter; RatioMMC is the power loss ratio of MMC.
The losses and the corresponding loss ratios are calculated for finite combinations of the instantaneous power and switching frequencies to form the LUT. The balance between the accuracy and efficiency of the proposed method is achieved by using appropriate LUT dimension and linear interpolation.
The power loss ratio of arbitrary combinations can be calculated as Eqs. 17–19:
where Ratio is the power loss ratio of the converter; fc, fc1, and fc2 are the switching frequencies; fc is between fc1 and fc2, p is between P1 and P2.
With the datasheet of Infineon FF 1800R23IE7P, the power loss ratio curves for multiple switching frequencies are generated as shown in Figure 5. The loss ratio first decreases with the increment of the transmission power. Then the power loss ratio increases slightly after reaching the optimal point of the loss ratio. As expected, the switching frequency has a significant impact on the overall loss ratio of the converter.
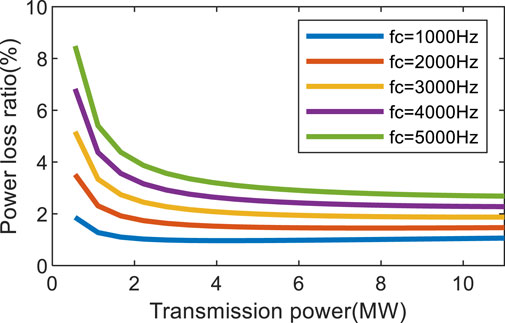
FIGURE 5. The power loss ratio of a two-level converter with multiple switching frequencies.
3.2 Current injection method
Figure 6 illustrates the current injection method for accurate power loss representation. A typical feedback loop with proportional and integral (PI) control is applied to track the reference power loss. The detailed processes are explained as follows.
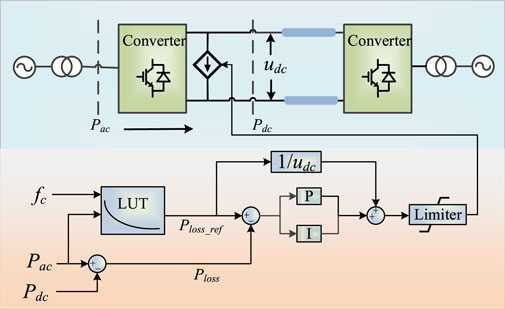
FIGURE 6. The schematic of the current injection method process.
3.2.1 Calculating power loss and reference power loss
The transmission power of the converter AC side and DC side is calculated using the instantaneous voltages and currents. The power loss is the transmission power difference between the AC and DC sides.
The reference power loss is calculated by the LUT which is generated in Section Ⅲ. Reference power loss can be obtained by using the interpolation method with inputs of instantaneous power and switching frequency. The AC side instantaneous power is used as the input of the LUT. The switching frequency can be set as either a constant value or a variable by counting the number of switching pulses during the simulation.
3.2.2 Tracking reference power loss
To compensate for the power loss during the simulation, a feedback loop with PI control is adopted to track the reference power loss. The PI control can dynamically eliminate the deviation between the reference loss and the measured loss.
Furthermore, the feedforward control is used to improve the response speed of the system, when the reference value or the DC voltage changes rapidly.
A limiter is placed at the output of the control module. The limiter parameter is determined by multiplying the power loss of the rated condition with a coefficient before dividing by the DC voltage. When the power system is in a transient state, the limiter may take effect. The proposed method is mainly aimed for the steady-state condition with little change in power loss. The proposed method is not accurate for drastic transients such as fault conditions, while it has a relatively small effect on the transients due to the limiter.
3.2.3 Current injection
To track the reference power loss, a variant resistor or a current source can be used as the interface. However, a varaint resistor will change the conductance matrix and require the full solution of the LU-factorization, which is time-consuming. Therefore, a current source is added to adjust the converter power loss according to the reference. The current source can be placed in parallel to the AC side or the DC side. However, the control of the AC side current source requires the phase-locked loop (PLL), which makes it relatively complex. Therefore, the controlled current source is placed at the DC side in this work.
4 Case studies
Case studies of the two-level converter and the MMC are presented in this section to verify the effectiveness of the proposed method. Infineon FF 1800R23IE7P IGBT modules and 5SNA 2000K452300 StakPak IGBT modules are utilized to generate the LUT for the two-level converter and the MMC, respectively.
4.1 Two-level converter
Figure 7 shows the case study circuit topology for a two-level converter in the full-converter (Type 4) wind turbine system. The DC voltage of the system is 1.1 kV with the rated power of 10 MW. The detailed parameters are shown in Table 1.
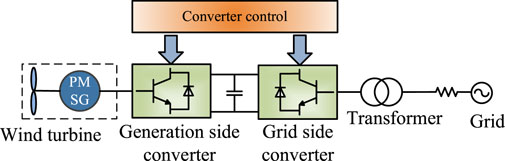
FIGURE 7. The topology of the full-converter wind turbine system.
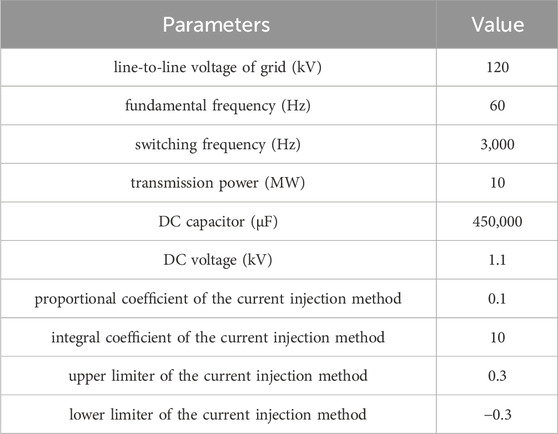
TABLE 1. Major parameters for two-level converter system.
Figure 8 shows the simulation results of power loss curves with the switching frequency of 3000 Hz using a two-resistance model with ideal characteristics, on-state characteristics, and the proposed injection current method, respectively. The power losses are calculated by the difference of the instantaneous power at the DC and the AC terminals of the grid-side converter. For the curve with ideal characteristics, the on-state resistance is set as 1e-6 Ω and the threshold voltage is set as 0; for the curve with the on-state characteristics, the on-state resistance is set as 8.85e-4 ohm, the threshold voltage is set as 0.5 V; for the curve using the proposed method, the values of the on-state resistance and the threshold voltage can be either set as ideal values or the values with on-state characteristics, since loss compensation process is independent of the converter models.
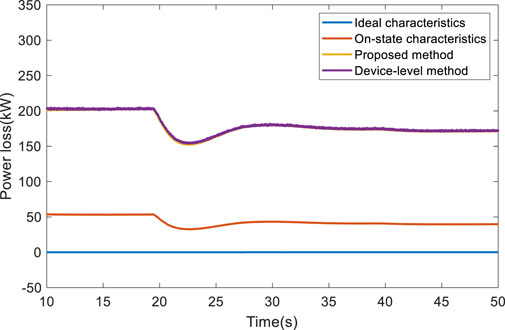
FIGURE 8. The power loss curves using different models in two-level converter.
As shown in Figure 8, the wind speed changes slowly from 15 m/s to 12 m/s, and the system reaches a new steady state. The transmitted power is 9.303 MW when the system reaches the new steady state. The power loss and power loss ratio with ideal characteristics are close to 0.0584 kW and 0.06% respectively. When the on-state characteristics are considered for the two-resistance model, the power loss and power loss ratio are 39.74 kW and 0.43%. Applying the proposed scheme, the averaged switching loss and conduction loss can be accurately represented, the power loss and the power loss ratio are 171.2 kW and 1.84%. When the device-level modeling scheme is adopted, the power loss and the power loss ratio are 172.3 kW and 1.85%.
The proposed method prioritizes the precise calculation of power loss in a steady state, rather than focusing on the specific loss during each switching moment. As a result, the loss curve of the proposed method is much smoother than the device-level model. Compared to the device-level model, the simulation power loss deviation is 0.64% for the current injection method model in the two-level converter. The simulation results show that the current injection method is much closer to the device-level model results than the ideal model and on-state model. It is verified that the method proposed in this paper can improve the accuracy of the converter power loss calculation in the electromagnetic transient simulation.
Figure 9 shows the simulation results of the power loss with various switching frequencies. The losses with the switching frequency of 2000 Hz, 3000 Hz, and 5000 Hz are 132.9 kW, 171.2 kW, and 246.6 kW when the transmission power is 9.303 MW, respectively. It can be seen that the switching frequency can have a significant impact on power loss.
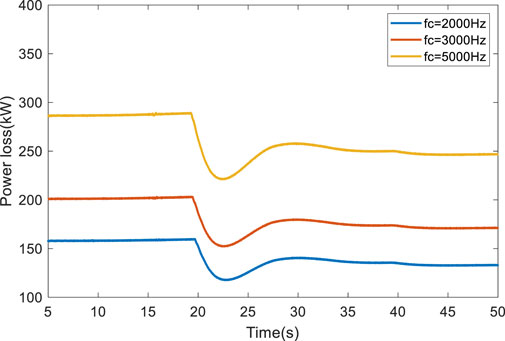
FIGURE 9. The power loss curves with various switching frequencies.
The consumed time of the two-resistance model with on-state characteristics is 817.13 s, whereas the time of the model using the proposed injection current scheme is 877.28 s and the time of the device-level model is 1,396.79 s using Matlab/Simulink for a 6s simulation. The extra burden of including the proposed method is only 10.38% of the one using the device-level model in the case study using the two-level converter. The computation reduction can be larger for the circuit with more converters with complex topologies. It proves that the current injection method proposed in this paper costs low computation effort to consider power loss accurately.
4.2 MMC
Figure 10 shows the structure of a bipolar HVDC transmission system with the MMC topology containing 286 sub-modules in each converter arm. The DC voltage is ±600 kV, with the rated power of 3000 MW. The detailed parameters are shown in Table 2. In the case study, the MMC uses carrier phase-shift modulation combined with the capacitor voltage sorting algorithm, and the Thevenin equivalence method is used for the MMC modeling.
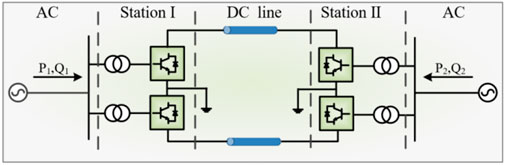
FIGURE 10. The topology of the bipolar MMC-HVDC system.
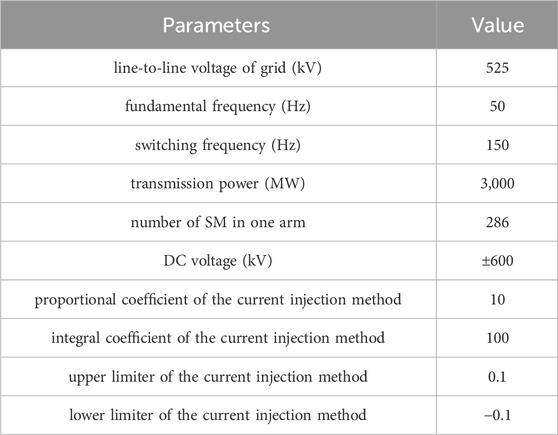
TABLE 2. Major parameters for MMC-Based HVDC system.
Figure 11 shows the reference power loss ratio curve for MMC with a switching frequency of 150 Hz.
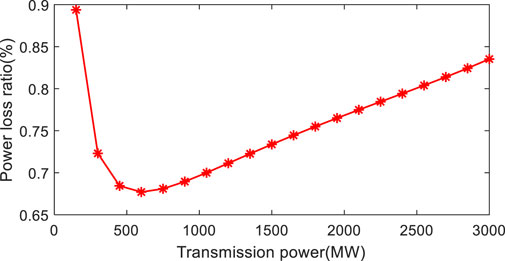
FIGURE 11. The reference power loss ratio curve with the switching frequency of 150 Hz.
Shown in Figure 12, the power losses for the cases using the on-state characteristics and the proposed scheme are 13.37 MW and 63.32 MW when the transmission power is 2400 MW. The difference exists because the proposed method considers the switching loss. It is noted that the power loss is not close to 0 even with the ideal on-state resistance as 1e-6 Ω. It happens due to the one-step latency using the Thevenin equivalence method illustrated in Section II.B.
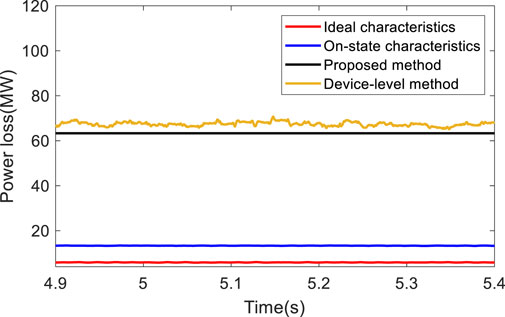
FIGURE 12. The power loss curves using different models in MMC.
The power loss using the device-level method is 66.05 MW. The power loss deviation between the proposed method and the device-level modeling method is 4.13%. By using the current injection method, the power loss simulation result is closer to the device-level model result.
5 Conclusion
This paper proposes a current injection method accurately representing conduction and switching losses with low computation effort. This method first prepares the conduction and switching losses look-up table before the simulation with finite combinations of instantaneous power and switching frequency based on the curve provided by the manufacturers’ datasheet. The interpolation method is used in the simulation to calculate the reference power loss with the inputs of arbitrary instantaneous power and switching frequency. A current source is applied in parallel at the converter DC side to track reference power loss dynamically. In this paper, the two-level converter model and MMC model are used to illustrate the effectiveness of the current injection method. The proposed method can be used for the research when the overall efficiency is interested in a large system with a large number of converters.
Data availability statement
The original contributions presented in the study are included in the article/Supplementary Material, further inquiries can be directed to the corresponding author.
Author contributions
HL: Conceptualization, Methodology, Writing–review and editing. RS: Conceptualization, Methodology, Validation, Writing–original draft. LW: Investigation, Writing–review and editing. YL: Investigation, Writing–review and editing. YZ: Data curation, Writing–review and editing. SY: Data curation, Writing–review and editing.
Funding
The author(s) declare financial support was received for the research, authorship, and/or publication of this article. This research was funded by State Grid Jibei Corporation (52010122001T).
Conflict of interest
Authors HL, LW, YLi, and SY were employed by State Grid Jibei Electric Power Company Limited.
The remaining authors declare that the research was conducted in the absence of any commercial or financial relationships that could be construed as a potential conflict of interest.
Publisher’s note
All claims expressed in this article are solely those of the authors and do not necessarily represent those of their affiliated organizations, or those of the publisher, the editors and the reviewers. Any product that may be evaluated in this article, or claim that may be made by its manufacturer, is not guaranteed or endorsed by the publisher.
References
Ansari, J. A., Liu, C., and Khan, S. A. (2020). MMC based MTDC grids: a detailed review on issues and challenges for operation, control and protection schemes. IEEE Access 8, 168154–168165. doi:10.1109/access.2020.3023544
Bai, H., Luo, H., Liu, C., Paire, D., and Gao, F. (2020). A device-level transient modeling approach for the FPGA-based real-time simulation of power converters. IEEE Trans. Power Electron. 35, 1282–1292. doi:10.1109/tpel.2019.2918590
Chiniforoosh, S., Jatskevich, J., Ramirez, A., Sood, V., Dinavahi, V., Martinez, J. A., et al. (2010). Definitions and applications of dynamic average models for analysis of power systems. IEEE Trans. Power Deliv. 25, 2655–2669. doi:10.1109/tpwrd.2010.2043859
Dommel, H. W. (1969). Digital computer solution of electromagnetic transients in single and multiphase networks. IEEE Trans. Power Apparatus Syst. 88, 388–399. doi:10.1109/tpas.1969.292459
Gao, H., Chen, Y., Xu, Y., Yu, Z., and Chen, L. (2014). “A GPU-based parallel simulation platform for large-scale wind farm integration,” in IEEE PES T&D Conference and Exposition, Chicago, IL, USA, 24 July 2014.
Gnanarathna, U. N., Gole, A. M., and Jayasinghe, R. P. (2011). Efficient modeling of modular multilevel HVDC converters (MMC) on electromagnetic transient simulation programs. IEEE Trans. Power Deliv. 26, 316–324. doi:10.1109/tpwrd.2010.2060737
Huang, C., Zhang, H., Song, Y., Wang, L., Ahmad, T., and Luo, X. (2021). Demand response for industrial micro-grid considering photovoltaic power uncertainty and battery operational cost. IEEE Trans. Smart Grid 12, 3043–3055. doi:10.1109/tsg.2021.3052515
Infineon IGBT modules (2023). Technical information, Infineon IGBT modules FF1800R23IE7P. Available at: https://www.infineon.com/dgdl/Infineon-FF1800R23IE7P-DataSheet-v01_00-CN.pdf?fileId=8ac78c8c8412f8d30184859adb400a21.
Jamal, I., Elmorshedy, M. F., Dabour, S. M., Rashad, E. M., Xu, W., and Almakhles, D. J. (2022). A comprehensive review of grid-connected PV systems based on impedance source inverter. IEEE Access 10, 89101–89123. doi:10.1109/access.2022.3200681
Jin, Y., Wu, D., Ju, P., Rehtanz, C., Wu, F., and Pan, X. (2020). Modeling of wind speeds inside a wind farm with application to wind farm aggregate modeling considering LVRT characteristic. IEEE Trans. Energy Convers. 35, 508–519. doi:10.1109/tec.2019.2938813
Kraus, R., and Mattausch, H. J. (1998). Status and trends of power semiconductor device models for circuit simulation. IEEE Trans. Power Electron. 13, 452–465. doi:10.1109/63.668107
Liang, T., and Dinavahi, V. (2018). Real-time system-on-chip emulation of electrothermal models for power electronic devices via Hammerstein configuration. IEEE J. Emerg. Sel. Top. Power Electron. 6, 203–218. doi:10.1109/jestpe.2017.2710348
Lin, N., and Dinavahi, V. (2018). Detailed device-level electrothermal modeling of the proactive hybrid HVDC breaker for real-time hardware-in-the-loop simulation of DC grids. IEEE Trans. Power Electron. 33, 1118–1134. doi:10.1109/tpel.2017.2685423
Liu, C., Ma, R., Bai, H., Li, Z., Gechter, F., and Gao, F. (2019). FPGA-based real-time simulation of high-power electronic system with nonlinear IGBT characteristics. IEEE J. Emerg. Sel. Top. Power Electron. 7, 41–51. doi:10.1109/jestpe.2018.2873157
Maguire, T., Elimban, S., Tara, E., and Zhang, Y. (2018). “Predicting switch ON/OFF statuses in real time electromagnetic transients simulations with voltage source converters,” in 2018 2nd IEEE Conference on Energy Internet and Energy System Integration (EI2), Beijing, China, 20 December 2018.
Maguire, T., Warkentin, B., Chen, Y., and Hasler, J. (2013). “Efficient techniques for real-time simulation of MMC systems,” in Int. Conf. Power Systems Transients, Vancouver, Canada, 18-20 July 2013.
Myaing, A., and Dinavahi, V. (2011). FPGA-based real-time emulation of power electronic systems with detailed representation of device characteristics. IEEE Trans. Ind. Electron. 58, 358–368. doi:10.1109/tie.2010.2044738
Nguyen, T. T., and Kim, H. M. (2021). Cluster-based predictive PCC voltage control of large-scale offshore wind farm. IEEE Access 9, 4630–4641. doi:10.1109/access.2020.3048175
Omar Faruque, M. D., Strasser, T., Lauss, G., Jalili-Marandi, V., Forsyth, P., Dufour, C., et al. (2015). Real-time simulation technologies for power systems design, testing, and analysis. IEEE Power Energy Technol. Syst. J. 2, 63–73. doi:10.1109/jpets.2015.2427370
Rajapakse, A. D., Gole, A. M., and Wilson, P. L. (2005). Electromagnetic transients simulation models for accurate representation of switching losses and thermal performance in power electronic systems. IEEE Trans. Power Deliv. 20, 319–327. doi:10.1109/TPWRD.2004.839726
Saad, H., Ould-Bachir, T., Mahseredjian, J., Dufour, C., Dennetiere, S., and Nguefeu, S. (2015). Real-time simulation of MMCs using CPU and FPGA. IEEE Trans. Power Electron. 30, 259–267. doi:10.1109/tpel.2013.2282600
Shen, Z., and Dinavahi, V. (2016). Real-time device-level transient electrothermal model for modular multilevel converter on FPGA. IEEE Trans. Power Electron. 31, 6155–6168. doi:10.1109/tpel.2015.2503281
Subedi, S., Rauniyar, M., Ishaq, S., Hansen, T. M., Tonkoski, R., Shirazi, M., et al. (2021). Review of methods to accelerate electromagnetic transient simulation of power systems. IEEE Access 9, 89714–89731. doi:10.1109/access.2021.3090320
Tong, N., Lin, X., Li, Z., Fang, J., Zhuo, Y., Sui, Q., et al. (2019). Coordinated sequential control of individual generators for large-scale DFIG-based wind farms. IEEE Trans. Sustain. Energy 11, 1679–1692. doi:10.1109/tste.2019.2936757
Keywords: electromagnetic transient simulation, power converter model, power loss, renewable power plant, modular multi-level converter
Citation: Liu H, Su R, Wu L, Li Y, Zhou Y and Yu S (2024) A current injection method for converter power loss representation in electromagnetic transient simulation. Front. Energy Res. 12:1359410. doi: 10.3389/fenrg.2024.1359410
Received: 21 December 2023; Accepted: 22 January 2024;
Published: 05 February 2024.
Edited by:
Hong Fan, Shanghai University of Electric Power, ChinaCopyright © 2024 Liu, Su, Wu, Li, Zhou and Yu. This is an open-access article distributed under the terms of the Creative Commons Attribution License (CC BY). The use, distribution or reproduction in other forums is permitted, provided the original author(s) and the copyright owner(s) are credited and that the original publication in this journal is cited, in accordance with accepted academic practice. No use, distribution or reproduction is permitted which does not comply with these terms.
*Correspondence: Rui Su, c3VyMjFAbWFpbHMudHNpbmdodWEuZWR1LmNu