 Jingdan Chen
 Weijia Yang
 Yulan Li
- State Key Laboratory of Water Resources Engineering and Management, Wuhan University, Wuhan, China
Aiming at the “net-zero carbon” target, a higher proportion of variable renewable energies (VREs) has been integrated into power grids, and pumped storage plants (PSPs) are crucial for guaranteeing the safe and stable operation of hybrid energy systems. As secondary frequency regulation (SFR) is related to the economic operation and the quality of auxiliary services provided by PSPs, it is critical to clarify its performance and compensation. Therefore, the corresponding quantitative evaluations of the SFR of pumped storage units (PSUs) are carried out in this paper. First, the performance of SFR is quantified based on the fuzzy analytic hierarchy process (FAHP). Considering the current situation in China’s electricity market, the average compensation of the PSP with each MW is determined to be 9.336 CNY per day, and a method for calculating the compensation of SFR is constructed. Then, taking a real Chinese PSP as an example, based on different wind power deviation signals, the quantitative evaluation of the compensation of SFR is conducted in accordance with the fixed-speed pumped storage units (FSPSUs) and the variable-speed pumped storage units (VSPSUs) in power priority and speed priority modes. The results show that the compensation of FSPSUs and VSPSUs (power priority mode and speed priority mode) is 10,900 CNY per day; 54,400 CNY per day; and 17,300 CNY per day. This paper could contribute to clarifying the compensation of SFR and providing technical support for the development of the auxiliary service market.
1 Introduction
To achieve the “net-zero carbon” target, a higher proportion of global variable renewable energies (VREs) is being integrated into the grid, posing a formidable challenge to the stability of the power grid (Seriño, 2018; Pratiwi and Juerges, 2020; Li et al., 2023a; Wang et al., 2023). Pumped storage (with its functions of peak shaving, automatic generation control (AGC), frequency regulation, standby, and black start) is the largest and most effective energy storage technology in a long time and plays an indispensable role in balancing the load of the power system, improving the quality of power supply, and increasing economic benefits (Chang et al., 2013; Pérez-Díaz et al., 2015; Xu et al., 2019; Rahmati and Akbari Foroud, 2020). Furthermore, with the continuous development of the social economy, the power requirements of users for electricity consumption also continue to grow (Guo and Wu, 2023). One of the primary issues is how to adjust the power output and improve secondary frequency regulation (SFR) to maximize power market participation and scheduling revenue, with the premise of grid security and stability. Therefore, for the economic operation of pumped storage units (PSUs) and the potential of auxiliary services, it is necessary to evaluate the performance and compensation of SFR of pumped storage plants (PSPs).
PSPs are divided into two types: fixed-speed pumped storage plants (FSPSPs) and variable-speed pumped storage power plants (VSPSPs). VSPSPs are not only superior to FSPSPs in terms of power generation modes but also can regulate power consumption under the pumping mode according to the variation range of speed to provide good frequency regulation (FR) capability for grids with more VREs, such as wind energy and solar energy (Alizadeh Bidgoli et al., 2020; Li et al., 2023b).
Regarding the comparison between FSPSUs and VSPSUs, most of the previous studies have focused on regulation performance. Yang and Yang (2019) conducted a performance evaluation of the power regulation of FSPSUs and VSPSUs, which combines the physical characteristics and economic indicators related to the auxiliary service market, and the results show that VSPSUs not only make a contribution to the stability of grids but also are better at the performance of the auxiliary service of the power market. Zhu et al. (2023) compared the dynamic performance of FSPSUs, VSPSUs, and thermal power units for primary frequency regulation (PFR) based on the deduced PFR performance indexes and quantitatively analyzed the superiority of the VSPSU in terms of the dynamic performance of PFR.
Regarding the influence mechanism of governor parameters on the unit, Ye et al. (2017); Ma et al. (2020) concluded that governor parameters play a dominant role in the dynamic characteristics of PSUs and that optimization can effectively improve the stability and quality of grids. By deducing a time-domain solution for guide vane opening response and a response time formula, Yang et al. (2016) found that the governor parameters are the most important factor affecting the settling time of power response. Tang et al. (2019) pointed out that the dynamic regulation characteristics of PSUs are obviously influenced by the governor control mode. For PSP balancing VRE in power grids, it is necessary to use step signals and actual power signals as inputs to analyze the sensitivity of the time domain. Fu et al. (2010) concluded the influence rule of governor parameters and the inertia time constant on the settling time.
Regarding the quantitative evaluation of FR performance indicators, various methods have been widely applied, including the hierarchical analysis method, fuzzy evaluation method, and expert scoring method (Zhang et al., 2022). In view of the current situation of auxiliary services of PSPs, Wang et al. (2010) constructed an index system and proposed a fuzzy comprehensive evaluation method based on hierarchical analysis. Based on the fuzzy hierarchical analysis method, Xiong et al. (2016) constructed an evaluation index system reflecting the performance of the speed control system (according to relevant information and operation experience) and verified the feasibility of the method with actual arithmetic examples.
Regarding the value of auxiliary services provided by PSPs, many relevant documents and reports were issued in a number of countries and regions. In the IEA Hydropower Technical Cooperation Program (HTCP), the economic value of energy and management services provided by PSPs was reviewed, and an overview document was produced for a number of countries and regions (IEA, 2017). Another IEA effort has proposed the requirements for the proper evaluation of techno-economic models for scheduling strategies for hydropower and pumped storage (PS) (Huertas-Hernando et al., 2016). In a project at the Argonne National Laboratory (Koritarov et al., 2014), an advanced dynamic simulation PSP model was developed and can be used to analyze and evaluate the value of PSPs in the power system with production cost and revenue. A report states that PSP capacity benefits from high-magnitude price fluctuations, as plants are both consumers and producers of electricity (Van Hout et al., 2017). It is shown that a rational price mechanism in the ancillary service market contributes to the benefits of PSPs so that the technical and economic value of PSPs is fully realized.
However, in many countries such as China, despite the rapid development of auxiliary service market in recent years, the standardized market mechanism has not been fully formed (Ming et al., 2014; Pollitt et al., 2017; Zhang et al., 2018). In China, for example, the current two-part tariff (National Development and Reform Commission, 2023) (including capacity price and quantity price) is difficult to reflect the value of auxiliary services and give full play to the potential of auxiliary services; hence, the relevant research needs to be started urgently.
There are two innovations proposed. 1) Only a small amount of study has given qualitative analysis and development suggestions for PSPs to participate in the auxiliary service market in the context of power market reform (Mou, 2018), and there is a lack of quantitative evaluation of the compensation of SFR. In response to this limitation, the performance of SFR is quantified based on the fuzzy analytic hierarchy process (FAHP), and by investigating the SFR compensation market in China, concrete compensation is clarified. 2) The study of SFR on the comparison between FSPSUs and VSPSUs is lacking in previous studies. Although this paper has made improvements in the above two aspects, one being the depth of comparison, where important evaluation indexes that can represent the performance of SFR are selected to do a better assessment, the other being the variety of models, where the control strategy of VSPSUs can be divided into “power priority mode” and “speed priority mode” (Kuwabara et al., 1996), the differences in the compensation of these two modes are compared.
The content of this paper is organized as follows: in Section 2, based on the FAHP, the performance of SFR of PSPs is quantitatively evaluated, and the corresponding scores are obtained. The average compensation of SFR is clarified through research on the current SFR market in China. The compensation formula is proposed based on the SFR score and average compensation. In Section 3, the models of FSPSUs and VSPSUs (in power priority and speed priority modes) are presented. In Section 4, numerical simulations are performed, and the performance and compensation of FSPSUs and VSPSUs (in speed priority and power priority modes) are compared, demonstrating the feasibility of the quantitative assessment work and the significance of the engineering guidance. In Section 5, the main contributions and conclusion of this paper are summarized.
2 Methods
A method to evaluate the compensation for SFR of PSUs is proposed in this section. In the first subsection, five important indicators in the SFR process of PSUs are selected as the basis for evaluation, and FAHP is adopted to quantify SFR performance by constructing the judgment matrix and solving the degradation degree. The evaluation score S of SFR performance is obtained. In the second subsection, through the research of the FR market in China, the average compensation for SFR of PSUs is clarified. The compensation calculation formula is proposed in combination with the FR performance score S in the first subsection, which can calculate compensation under various scenarios.
2.1 Analysis of the performance of SFR
Based on the auxiliary service compensation mechanisms of electricity markets in China and the United States of America, the five evaluation indexes selected and their calculation formulas are as follows:
(1) Average value of power difference ∆Pavg
where ∆Pavg is an index such that smaller values indicate better performance; ∆Pi is the power difference between the theoretical and simulation values; Pt,i is the simulation power value at the ith sample point; P*t,i is the theoretical power value at the ith sample point; ∆P*t,avg is the average value of the theoretical power value; P*t,1 is the theoretical power value at the first sample point; and N is the total number of samples.
(2) Standard deviation of power difference ∆Pstd
where ∆Pstd is an index such that smaller values indicate better performance.
(3) Penalty energy Ep
where Ep is an index, representing the accumulated energy deviation between the theoretical and simulation values, with smaller values indicating better performance and ∆t is sampling integration interval, taken as 0.1 s.
(4) Regulation mileage MR
where MR is an index, with larger values indicating better performance, Pe is the rated power of units, and the value is 310 MW of the plant in the engineering case.
(5) Power delay time Tdelay
where Tdelay is the time difference when the theoretical value is the same as the simulated value, DT is an intermediate value for the power delay time taken as 0.1 s, and rP,DT is the correlation coefficient between the two curves of theoretical and simulated power values.
These five items are all affected by the pumped storage units’ power regulation performance, and the better the regulation performance, the higher the score will be.
FAHP (Li et al., 2022) is an analysis method that integrates fuzzy mathematics and hierarchical analysis, and its theoretical basis includes an analytic hierarchy process and fuzzy comprehensive evaluation. The process of calculating the PFR performance score based on FAHP is shown in the Figure 1, and the specific method is as follows. According to the physical definition of the assessment indicators, ranking the factors of the indicator layer to establish a judgment matrix, and deriving the weights of each indicator; calculating the degree of deterioration of the indicators to unify the magnitude and order of magnitude of each indicator, a fuzzy affiliation matrix was obtained, which was multiplied by the weight vector of each indicator to obtain the vector of fuzzy judgments; and setting the comment vector V = (V1, V2, V3, and V4) = (excellent, good, general, and bad), and the score vector under four FR response states is G=(100, 80, 60, 30) (Li et al., 2022); the SFR performance score S can be obtained by multiplying the score vector with the fuzzy judgment vector.
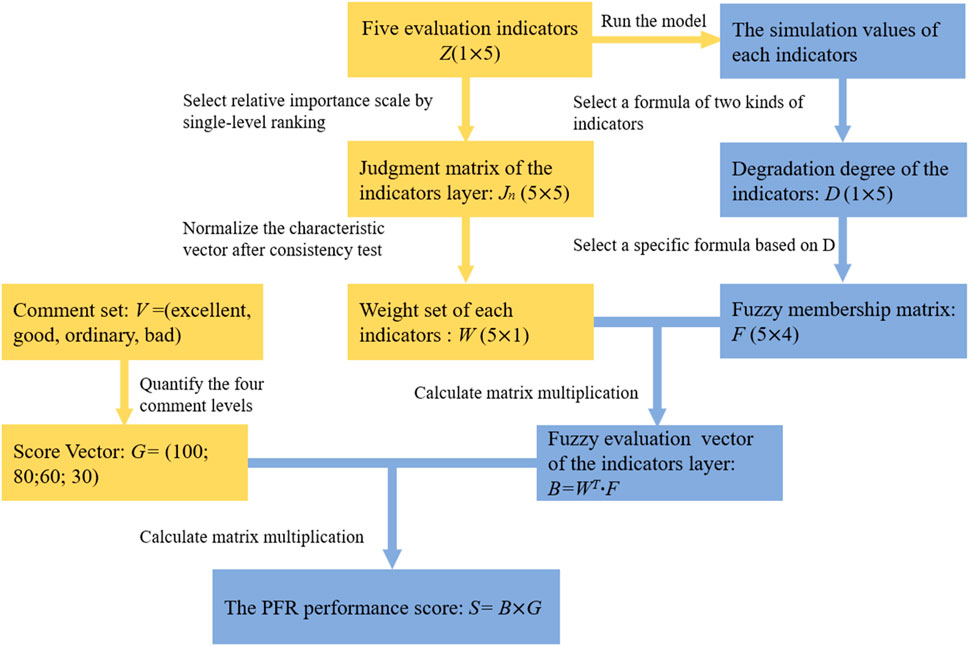
Figure 1. Flowchart of the quantitative evaluation method for PFR performance.
2.2 Analysis of the compensation for SFR
Referring to the latest data that has been published by China’s National Energy Administration (National Energy Administration, 2019), SFR compensation in China is shown in Table 1. Since the compensation of the Northwest region in the published data includes both PFR and SFR, while other regions only include AGC, the Northwest region data are not included in the table for reference. In the first half of 2019, excluding Tibet, the installed capacity was 1.37 billion kilowatts (KW), and the compensation for auxiliary services was 13.031 billion CNY in China. Among them, the compensation for SFR is 2.701 billion CNY, accounting for 20.73% of the total compensation for ancillary services.

Table 1. Compensation of SFR in China and the results of the compensation considering the mean value.
The compensation of the PSP divided by the installed capacity can be obtained as the average compensation of SFR. If the arithmetic mean is considered, the average compensation is 8.745 CNY per day with each MW. If the weighted average is considered, the average compensation considering all provinces is 9.216 CNY per day for each MW, and the average compensation considering the top 10 installed capacity provinces (National Energy Administration, 2021) is 9.336 CNY per day with each MW, as shown in Table 2. The obtained average compensation is the value when the PSU has qualified SFR performance, so based on the SFR performance score, the SFR compensation of the PSP can be calculated.
where A is the SFR compensation of PSP, measured in units per day per MW; R0 is average compensation, valued at 9.336 CNY per day with each MW, which can be adjusted flexibly according to market conditions; S is the SFR performance score; and Cp is the installed capacity of PSP.
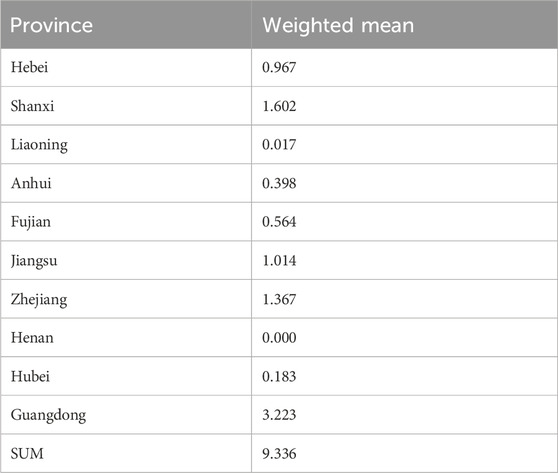
Table 2. Calculation of average compensation for provinces in China considering the top ten installed capacities of pumped storage.
Since the installed capacity in the table includes the total installed capacity of all types of power stations participating in the compensation of electric auxiliary services, the compensation cost also belongs to all power stations and is not limited to pumped storage power stations. Moreover, in actual operation, the average compensation per unit capacity of each type of power station is not the same, and the SFR compensation in this paper is obtained based on the same SFR compensation rate for each type of power station, so the calculation compensation may deviate from the compensation of the actual situation. This issue deserves further exploration in future research.
3 Models
In this section, in order to evaluate the compensation for SFR of PSUs in the ancillary services market, the FSPSU and VSPSU models are established. In contrast to the variable speed unit, the governor is an actuator to adjust the opening of the guide vanes to achieve output regulation for FSPSUs, which is shown in the block diagram in Figure 2. For the VSPSU model, the control strategies include “power priority mode” and “speed priority mode,” which are shown in Figure 3 and Figure 4, respectively. For the unit in the power priority mode in Figure 3, the converter controls the power and the governor controls the speed. For the unit in the speed priority mode in Figure 4, the converter controls the speed and the governor controls the power.
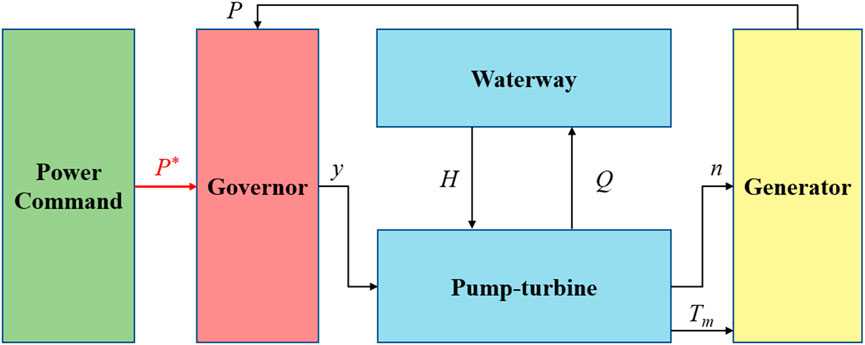
Figure 2. Block diagram of FSPSPs in the power regulation mode.

Figure 3. Block diagram of VSPSPs in the power priority mode.
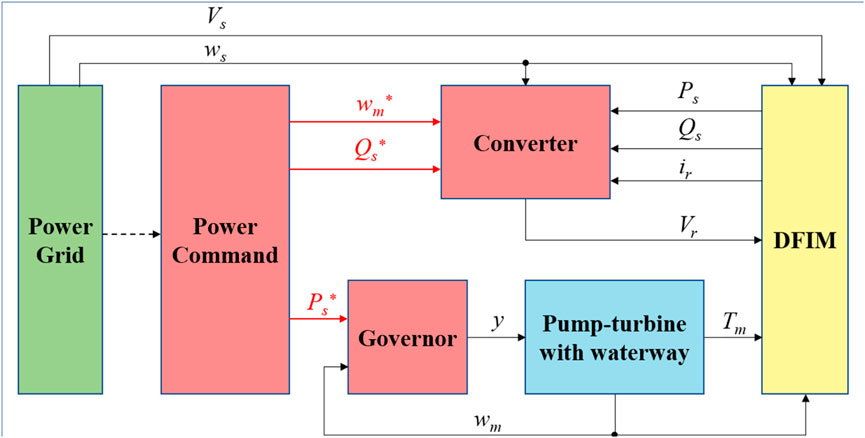
Figure 4. Block diagram of VSPSPs in the speed priority mode.
The models under these three control strategies are built based on the PSU models in available studies (Yang and Yang, 2019; Huang et al., 2022; Huang et al., 2023a), and the comparative validation between the simulation results and measured data has been confirmed (Huang et al., 2022; Huang et al., 2023a; Liu et al., 2023), illustrating the reliability of the models and the accuracy of the subsequent studies. The modeling in this section is based on the MATLAB/Simulink platform.
The pump turbine model is built using the improved Suter transformation method (Zheng et al., 2012; Kocaman and Modi, 2017), which can solve the multiple values problem of unitary discharge and unit moment in the S-region by eliminating the S-characteristics of the inverse pump mode. The piping system model is built using the method of characteristics (Huang et al., 2022), which has the advantages of high computational accuracy, high efficiency, and simple programming and can achieve an accurate simulation of the unsteady flow in a waterway system (Chaudhry, 2014). The governor model adopts a PID governor (Huang et al., 2023b), adding the nonlinear link of the opening limit with the starting guide vane opening instruction. A description of the principles of the doubly fed induction motor can be found in the related book and literature (Abad et al., 2011; Bidgoli et al., 2015).
For the FSPSU, the power signal is input into the “power command” in the diagram and is compared with the output power response signal to derive five performance evaluation indexes, which can be used to carry out simulation analysis and a quantitative score of the SFR performance of FSPSUs. Based on FAHP, the compensation for SFR can be calculated later. For VSPSUs, the power signal is input into the “control command” in the diagram and also compared with the power output signals, and the daily SFR compensation of the VSPSP can be obtained through the same steps.
4 Results
In this section, based on the numerical simulations and FAHP, SFR compensation is clarified, the differences in SFR performance of FSPSUs and VSPSUs are compared, and the differences in SFR between different control strategies are studied.
4.1 Engineering cases and power command
4.1.1 Engineering cases
The example power plant selected in the paper is a real VSPSP in China, with an installed capacity of 3,600 MW. The plant piping system parameters and the main unit parameter settings for the three models are kept the same, as shown in Table 3a,c, and the original value settings of the governor parameters are varied in the different modes, as shown in Table 3b.
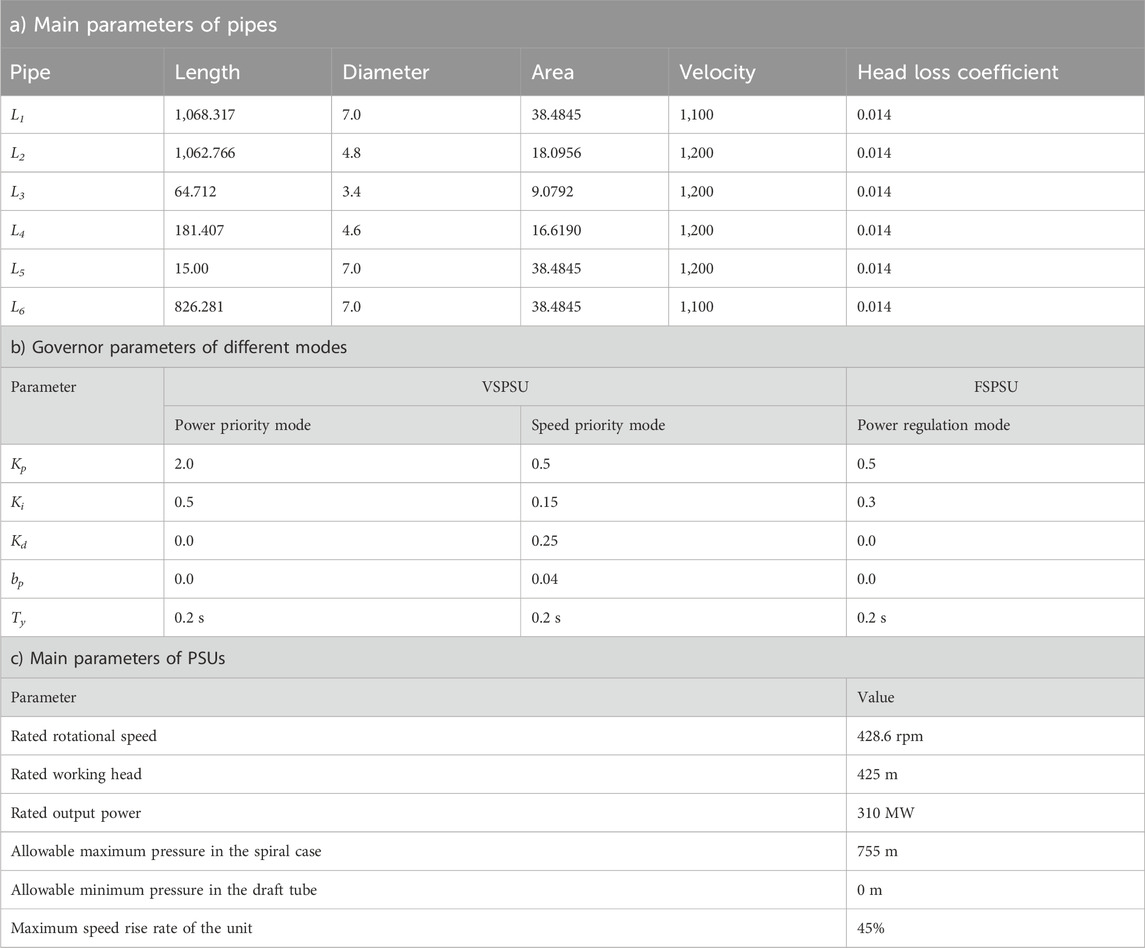
Table 3. Main parameters of the PSP.
For the speed priority mode, the speed of the VSPSU is directly controlled by the converter, which is the priority regulation target. However, the active power is controlled by the governor. Therefore, the governor parameter tuning can enable the unit to regulate the power faster and effectively reduce the oscillation and regulation error to ensure the stability of the system. Therefore, it is necessary for VSPSUs in the speed priority mode to analyze and tune the governor parameters to provide more reliable support for SFR. The analysis and governor parameter tuning for VSPSUs in the speed priority mode (see Appendix) are carried out in this study. The calculation results of SFR performance in different governor parameter setting schemes are shown in Supplementary Appendix Table S5, Supplementary Appendix Table S6, Supplementary Appendix Table S7, and Supplementary Appendix Table S8, and the comparisons of the power response process before and after governor parameter tuning are shown in Supplementary Appendix Figure S11, Supplementary Appendix Figure S12, Supplementary Appendix Figure S13, and Supplementary Appendix Figure S14.
For the power priority mode, the power is directly controlled by the converter and speed is controlled by the governor; therefore, the governor parameters have little influence on the power response. As for the FSPSU, there are many studies on governor parameter tuning (Yang et al., 2019; Guo and Wu, 2023), and the governor parameters of the FSPSU in this work have been tuned, which will not be repeated due to space limitations.
4.1.2 Power command
The power disturbance signal input in the PSU model in this paper is measured wind turbine power fluctuation signals, which are intended to provide technical support for the research of renewable energy consumption (Yang et al., 2018; LI et al., 2023).
In this paper, four kinds of wind power deviation signals are used, which are the center peak, left peak, right peak, and double peak, respectively. The data of these four wind power deviation signals are obtained from a real wind power station abroad. Their frequency distribution histograms are shown in Figure 5. The total duration of the simulation calculation in this section is 200 s. The first 50 s are without any power disturbance, and the unit is in steady state operation, followed by the input of power disturbance signals with a duration of 150 s. The sampling interval is 0.25 s, and each set of signals has 600 data pieces. In Figure 5, the horizontal coordinate of the graph indicates the amount of variation in power, and the vertical coordinate indicates the number of each type of variation in the 600 pieces of data.
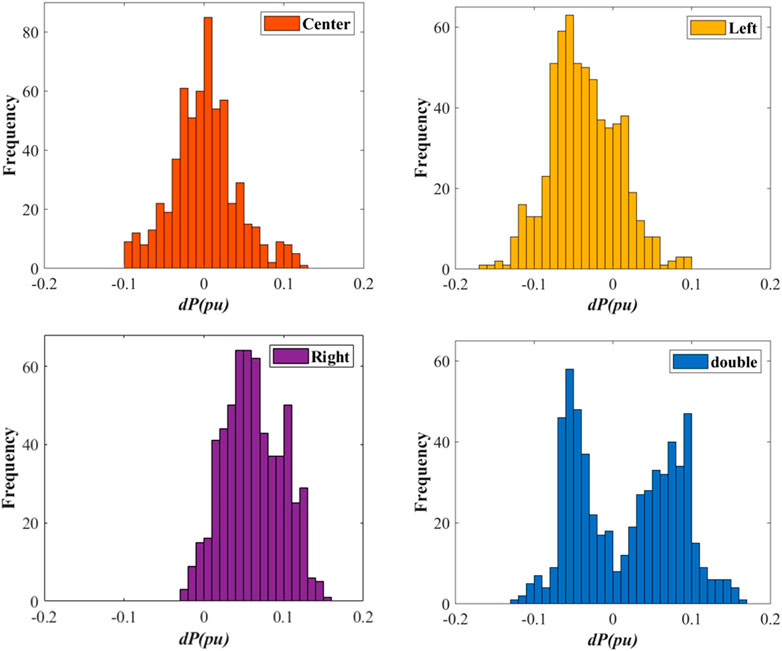
Figure 5. Frequency distribution histograms of wind power deviation signals.
4.2 Quantitative evaluation of SFR
Four types of wind power deviation signals with a time length of 200 s are input into each of the three models, and FAHP is used to compare the evaluation indexes, compensation, and power response curves of the three models.
The value of evaluation indexes and compensation calculation results of the three control models under different types of input signals are shown in Table 4. The comparison of the theoretical and simulated values of the power response process of the FSPSU is shown in Figure 6, and the comparison of VSPSUs (in power and speed priority modes) is shown in Figure 7, Figure 8, Figure 9, and Figure 10. In Figure 6, Figure 7, Figure 8, Figure 9, and Figure 10, the ideal result is the theoretical optimal power change process of the pumped storage unit, which is deduced from the input wind power signal, and it is used to compare with the simulation result. The results of the graphs are analyzed, and the conclusions are as follows.
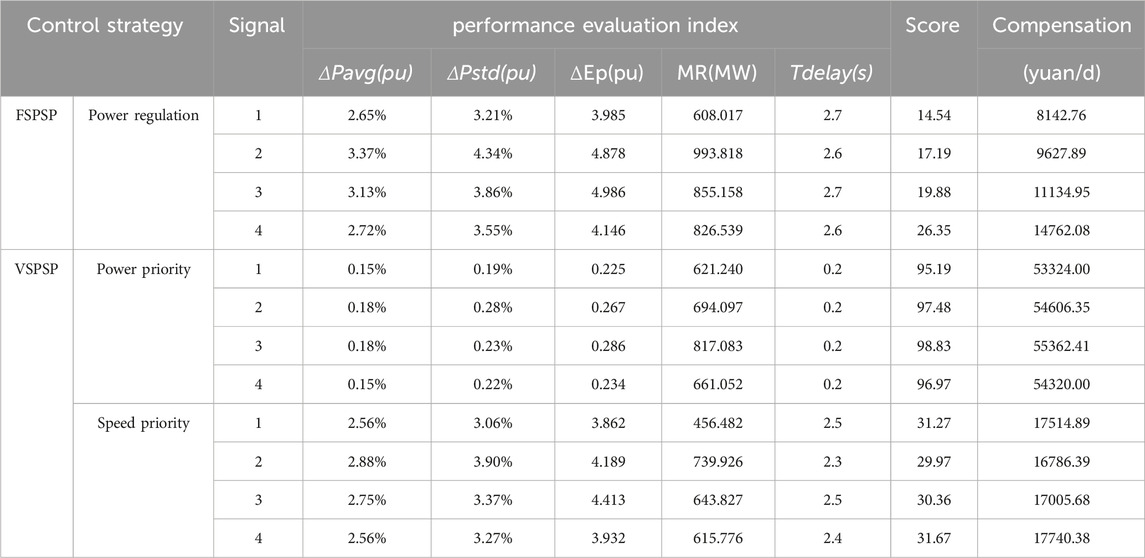
Table 4. Evaluation indexes and compensation calculation results of three control models under different wind power deviation signals.
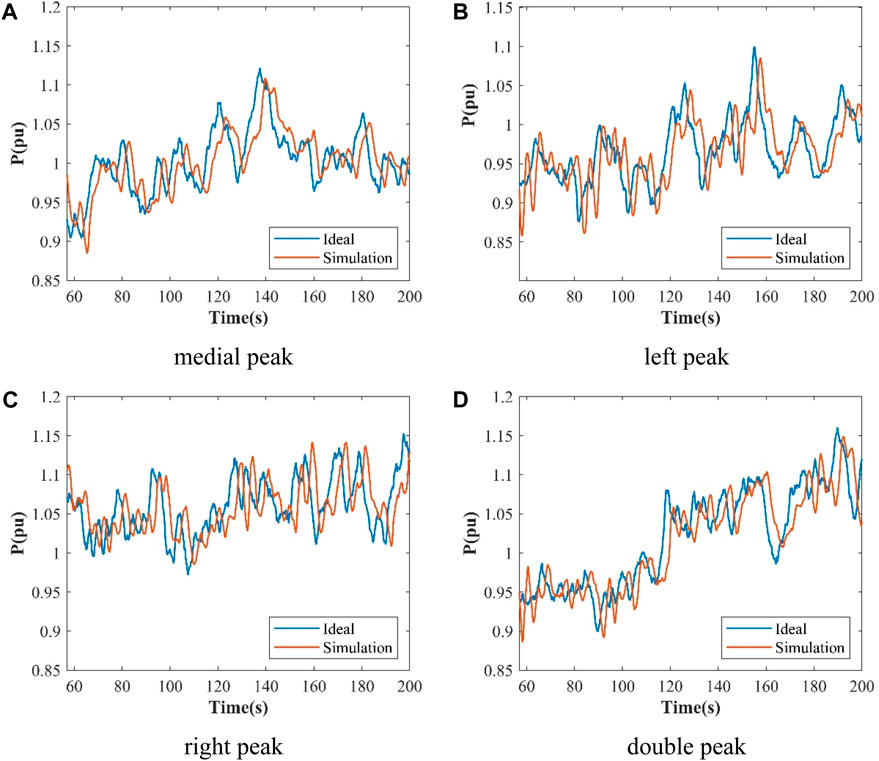
Figure 6. Power response comparison of the FSPSU between the ideal and simulation under different wind power deviation signals.
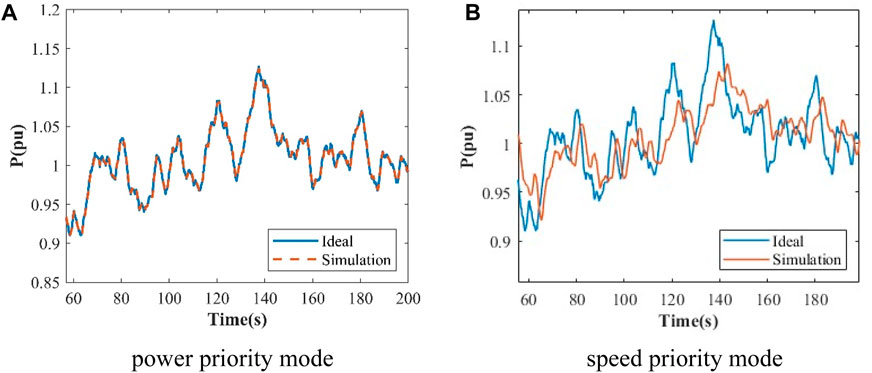
Figure 7. Power response comparison between the power and speed priority modes under medial peak signals.
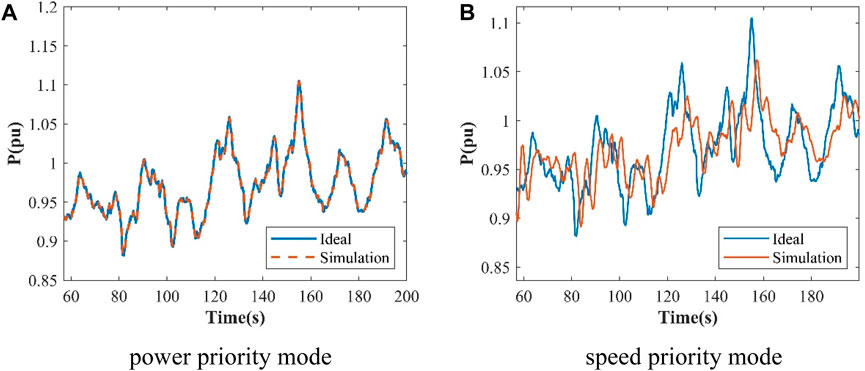
Figure 8. Power response comparison between the power and speed priority modes under left peak signals.
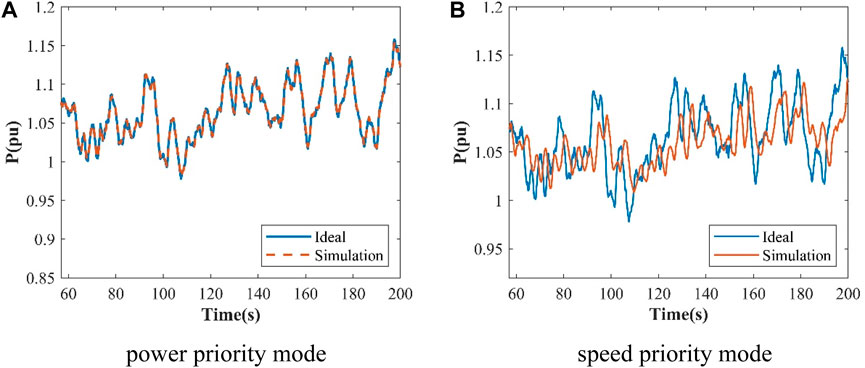
Figure 9. Power response comparison between the power and speed priority modes under right peak signals.
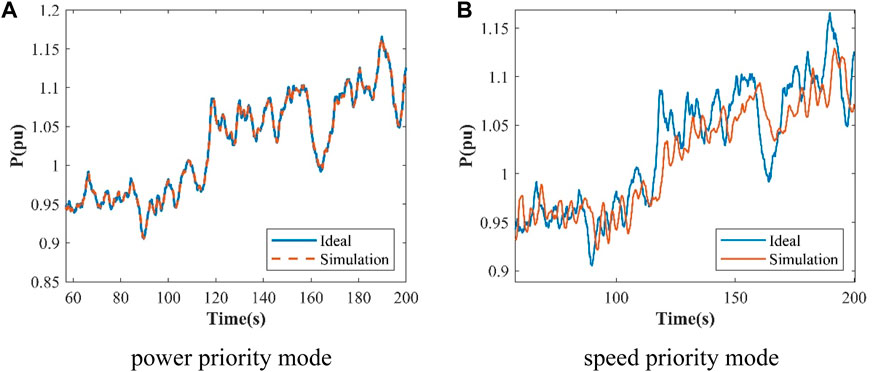
Figure 10. Power response comparison between the power and speed priority modes under double peak signals.
For the FSPSU, according to the compensation calculation formula proposed in the previous section, the compensation of the SFR for the power station is approximately 8,100–14,800 CNY per day, and the average compensation of the FSPSP is 10,900 CNY per day. From the power curve comparison chart, it can be observed that the power simulation output value of the FSPSU fluctuates more drastically, with a relatively low degree of agreement with the theoretical value, and the SFR performance is relatively poor.
For the VSPSU, when the control mode is power priority, the curves of the theoretical and simulated output values of the power response are more consistent with excellent SFR performance, and the compensation for SFR of the PSP per day ranges from 53,300 CNY to 55,400 CNY, with an average compensation of 54,400 CNY per day.
For the VSPSU, when the control mode is speed priority, the regulation amount of the unit is small, and the simulated power output value is delayed more, which results in the daily SFR compensation of the PSP between 17,000 and 17,700 CNY, with an average compensation of 17,300 CNY per day.
In terms of the factors affecting the evaluation index, according to the secondary frequency regulation process of the unit, the factors studied in this work affecting the evaluation index can be divided into three types: regulation strategy, governor parameter, and input signal. Among them, regulation strategy is the main factor. For regulation strategy, it is clear that the evaluation indexes are superior under power priority mode than under other regulation strategies. For the power priority mode, the converter controls the power; for the governor parameter, Kp and Ki are directly linked to the power variation, but Kd and bp are linked to the differential of power variation. Therefore, the influence of Kp and Ki is greater than that of Kd and bp; for the input signal, it is clear that the influence of the input signal is minimal from Figure 6 and Table 4.
Comparing the evaluation results of FSPSUs and VSPSUs, if the control mode is the power priority, the value of the SFR compensation will be 398.34% higher than that of FSPSUs. Moreover, for the four smaller and better evaluation indexes, the index results of VSPSUs are significantly lower than those of FSPSUs by one order of magnitude, which reflects that VSPSUs have obvious operational advantages. If the VSPSU is in the speed priority mode, the SFR compensation is 58.12% higher than that of FSPSUs, which means the overall difference is relatively small.
Comparing the two control strategies of VSPSUs, if the VSPSU adopts the power priority mode, SFR compensation is approximately 215.16% higher than that of the speed priority mode, and the four smaller and more superior indicators also differ by an order of magnitude. The reason is that the unit in the power priority mode has a faster response rate to load changes, and the corresponding steady-state error is also smaller.
5 Conclusion
In this paper, a method for evaluating the performance and compensation for the SFR of PSUs is constructed. Comparing the FSPSUs and VSPSUs under power priority and speed priority modes, the performance and compensation of SFR are analyzed, providing technical support for the development of the auxiliary service market. The main contributions and innovations of this work are condensed as follows:
(1) Based on the current situation of the SFR market in China, the average compensation of SFR for PSPs with each MW is determined to be 9.336 CNY per day. Combined with the quantitative evaluation of SFR performance, a method for evaluating SFR compensation of PSPs is constructed.
(2) The factors studied in this work affecting the evaluation index can be divided into three types: regulation strategy, governor parameter, and input signal. Among them, regulation strategy is the main factor.
(3) Compared with FSPSUs, VSPSUs can achieve rapid follow-up of the power command; hence, the performance of SFR is better. The VSPSU in the power priority mode has obvious advantages in the SFR auxiliary service because the power is directly controlled by the converter, achieving a fast power response.
(4) According to the quantification, the compensation of FSPSUs and VSPSUs (power priority mode and speed priority mode) is 10,900 CNY per day; 54,400 CNY per day; and 17,300 CNY per day.
This study also has several limitations and could be extended in the following aspects:
(1) On the evaluation of the performance of SFR, FAHP is selected in this paper. Although the evaluation indicators are fuzzy-processed, the selection of the judgment matrix and the calculation of the deterioration degree of the indicators still have a certain degree of subjectivity. It is not completely consistent with the actual situation, and further research on this issue will be meaningful in the future.
(2) On the calculation of the compensation for frequency regulation, due to limited data, the investigated installed capacity and compensation costs of the provinces in China are not limited to PSPs but also include other types of power stations that participate in the auxiliary service market. Therefore, the average compensation of SFR is calculated based on the assumption that different power stations have the same compensation rate of SFR. However, the real compensation rates of different power stations are not the same. Hence, there is a possible deviation between the calculated compensation and the actual compensation.
(3) The study object of ancillary services is limited to SFR, while ancillary services also include peak shaving, phase regulation, black start, and standby. Therefore, further study on other important service functions is meaningful to conduct.
Data availability statement
The raw data supporting the conclusion of this article will be made available by the authors, without undue reservation.
Author contributions
JC: writing–original draft, writing–review and editing, data curation, and formal analysis. WY: conceptualization, data curation, formal analysis, methodology, project administration, supervision, writing–review and editing, and writing–original draft. YuL: conceptualization, data curation, formal analysis, and writing–review and editing. YiL: supervision, writing–review and editing, and data curation. YC: funding acquisition, supervision, and writing–review and editing.
Funding
The author(s) declare that financial support was received for the research, authorship, and/or publication of this article. The authors thank the support from the National Natural Science Foundation of China (No. 52079096).
Acknowledgments
The authors thank the support from the National Natural Science Foundation of China (No. 52079096).
Conflict of interest
The authors declare that the research was conducted in the absence of any commercial or financial relationships that could be construed as a potential conflict of interest.
Publisher’s note
All claims expressed in this article are solely those of the authors and do not necessarily represent those of their affiliated organizations, or those of the publisher, the editors, and the reviewers. Any product that may be evaluated in this article, or claim that may be made by its manufacturer, is not guaranteed or endorsed by the publisher.
Supplementary material
The Supplementary Material for this article can be found online at: https://www.frontiersin.org/articles/10.3389/fenrg.2024.1358150/full#supplementary-material
References
Abad, G., Pez, J., and Guez, M. (2011). Doubly fed induction machine: modeling and control for wind energy generation applications. Wiley-IEEE Press.
Alizadeh Bidgoli, M., Yang, W., and Ahmadian, A. (2020). DFIM versus synchronous machine for variable speed pumped storage hydropower plants: a comparative evaluation of technical performance. Renew. Energy 159, 72–86. doi:10.1016/j.renene.2020.05.163
Bidgoli, M. A., Mohammadpour, H. A., and Bathaee, S. M. T. (2015). Advanced vector control design for DFIM-based hydropower storage for fault ride-through enhancement. IEEE Trans. Energy Convers. 30, 1449–1459. doi:10.1109/tec.2015.2437953
Chang, M. K., Eichman, J. D., Mueller, F., and Samuelsen, S. (2013). Buffering intermittent renewable power with hydroelectric generation: a case study in California. Appl. Energy 112, 1–11. doi:10.1016/j.apenergy.2013.04.092
Fu, L., Li, J., Yang, J., and Pao, H. (2010). Research on dynamic quality of governing system of hydropower station with tailrace surge tank. J. Hydroelectr. Eng. 29, 163–167. [In Chinese].
Guo, W., and Wu, F. (2023). Stability behavior of load adjustment and primary frequency control of pumped storage power plant with upstream and downstream surge tanks. J. Energy Storage 60, 106626. doi:10.1016/j.est.2023.106626
Huang, Y., Yang, W., Liao, Y., Zhao, Z., Ma, W., Yang, J., et al. (2022). Improved transfer function method for flexible simulation of hydraulic-mechanical-electrical transient processes of hydro-power plants. Renew. Energy 196, 390–404. doi:10.1016/j.renene.2022.06.142
Huang, Y., Yang, W., Zhao, Z., Han, W., Li, Y., and Yang, J. (2023a). Dynamic modeling and favorable speed command of variable-speed pumped-storage unit during power regulation. Renew. Energy 206, 769–783. doi:10.1016/j.renene.2023.02.112
Huang, Y., Yang, W., Zhao, Z., and Yang, J. (2023b). Active power fluctuations and control in hydraulic disturbance of variable speed pumped storage plants. J. Energy Storage 60, 106666. doi:10.1016/j.est.2023.106666
Huertas-Hernando, D., Farahmand, H., Holttinen, H., Kiviluoma, J., Rinne, E., Söder, L., et al. (2016). Hydro power flexibility for power systems with variable renewable energy sources: an IEA Task 25 collaboration. Wiley Interdiscip. Rev. Energy Environ. 6 (1), e220. doi:10.1002/wene.220
IEA (2017). The economic value of energy and water management services provided by hydropower projects with storage [R]: IEA Hydro Annex IX: Summary Report.
Kocaman, A. S., and Modi, V. (2017). Value of pumped hydro storage in a hybrid energy generation and allocation system. Appl. Energy 205, 1202–1215. doi:10.1016/j.apenergy.2017.08.129
Koritarov, V., Veselka, T. D., and Gasper, J. (2014). Modeling and analysis of value of advanced pumped storage hydropower in the United States. United States: USDOE Office of Energy Efficiency and Renewable Energy.
Kuwabara, T., Shibuya, A., Furuta, H., Kita, E., and Mitsuhashi, K. (1996). Design and dynamic response characteristics of 400 MW adjustable speed pumped storage unit for Ohkawachi power station. IEEE Trans. Energy Convers. 11 (2), 376–384. doi:10.1109/60.507649
Li, X., Yang, W., Wei, J., Wang, R., and Liao, Y. (2023a). Part-load operation risk assessment of hydropower units in hydro–wind–solar hybrid system considering hydraulic characteristics. Energy Rep. 9, 332–342. doi:10.1016/j.egyr.2023.04.284
Li, X., Yang, W., Zhao, Z., Wang, R., and Yin, X. (2023b). Advantage of priority regulation of pumped storage for carbon-emission-oriented co-scheduling of hybrid energy system. J. Energy Storage 58, 106400. doi:10.1016/j.est.2022.106400
Li, Y., Yang, W., Zhao, Z., Huang, Y., Liao, Y., and Yang, J. (2022). Ancillary service quantitative evaluation for primary frequency regulation of pumped storage units considering refined hydraulic characteristics. J. Energy Storage 45, 103414. doi:10.1016/j.est.2021.103414
Liu, Y., Yang, W., Huang, Y., and Wang, Y. (2023). Influence of operating speed of variable speed pumped storage units on pump outage condition [In Chinese]. Water Resour. Hydropower Eng. 54, 144–153.
Li, X., Yang, W., Zhao, Z., Wang, R., Yin, X., and Liu, P. (2023). Risk-averse energy management of hydro/thermal/pumped storage complementarily operating with wind/solar: balancing risk, cost and carbon emission. Sustain. Energy Technol. Assessments 60, 103534. doi:10.1016/j.seta.2023.103534
Ma, Y., Li, C., Zhou, J., and Zhang, Y. (2020). Comprehensive stochastic optimal scheduling in residential micro energy grid considering pumped-storage unit and demand response. J. Energy Storage 32, 101968. doi:10.1016/j.est.2020.101968
Ming, Z., Ximei, L., and Lilin, P. (2014). The ancillary services in China: an overview and key issues. Renew. Sustain. Energy Rev. 36, 83–90. doi:10.1016/j.rser.2014.04.040
Mou, D. (2018). Pumped storage hydro power’s function in the electricity market under the electricity deregulation background in China-A case study of Fujian province. Energy Environ. 30, 951–968. doi:10.1177/0958305x18813727
National Development and Reform Commission (2023). Notice on capacity tariffs for pumped storage power plants and related matters. China: National Development and Reform Commission.
National Energy Administration (2019). Briefing on the situation relating to electric auxiliary services in the first half of 2019. China: National Energy Administration.
National Energy Administration (2021). Medium and long-term development plan for pumped storage (2021-2035). China: National Energy Administration.
Pérez-Díaz, J. I., Chazarra, M., García-González, J., Cavazzini, G., and Stoppato, A. (2015). Trends and challenges in the operation of pumped-storage hydropower plants. Renew. Sustain. Energy Rev. 44, 767–784. doi:10.1016/j.rser.2015.01.029
Pollitt, M., Yang, C.-H., and Chen, H. (2017). Reforming the Chinese electricity supply sector: lessons from international experience. Cambridge Working Paper Economics 1713.
Pratiwi, S., and Juerges, N. (2020). Review of the impact of renewable energy development on the environment and nature conservation in Southeast Asia. Energy, Ecol. Environ. 5, 221–239. doi:10.1007/s40974-020-00166-2
Rahmati, I., and Akbari Foroud, A. (2020). Pumped-storage units to address spinning reserve concerns in the grids with high wind penetration. J. Energy Storage 31, 101612. doi:10.1016/j.est.2020.101612
Seriño, M. N. V. (2018). Diversification of nonhydro renewable energy sources in developing countries. Energy, Ecol. Environ. 3, 317–329. doi:10.1007/s40974-018-0106-y
Tang, R., Yang, J., Yang, W., Zou, J., and Lai, X. (2019). Dynamic regulation characteristics of pumped-storage plants with two generating units sharing common conduits and busbar for balancing variable renewable energy. Renew. Energy 135, 1064–1077. doi:10.1016/j.renene.2018.12.082
Van Hout, M., Özdemir, Ö., and Koutstaal, P. (2017). Large-scale balancing with Norwegian hydro power in the future European electricity market. Technical Report.
Wang, R., Yang, W., Ji, L., Li, X., Zhang, S., and Jing, X. (2023). Regulation intensity assessment of pumped storage units in daily scheduling for renewable energy consumption. Sustain. Energy Technol. Assessments 56, 103027. doi:10.1016/j.seta.2023.103027
Wang, W., Wang, G., Zhou, X., and Dong, B. (2010). Evaluation index system and method of pumped-storage power plants serving power grids. Power Syst. clean energy 26, 88–92. [In Chinese].
Xiong, T., Zhou, J., Fu, W., Zheng, Y., and Wang, Y. (2016). Comprehensive assessment of governing system for pumped storage unit with fuzzy analytical hierarchy process. Water Resour. Power 34, 170–172.
Xu, B., Zhu, F., Zhong, P., Chen, J., Liu, W., Ma, Y., et al. (2019). Identifying long-term effects of using hydropower to complement wind power uncertainty through stochastic programming. Appl. Energy 253, 113535. doi:10.1016/j.apenergy.2019.113535
Yang, W., Norrlund, P., Saarinen, L., Witt, A., Smith, B., Yang, J., et al. (2018). Burden on hydropower units for short-term balancing of renewable power systems. Nat. Commun. 9 (1), 2633. doi:10.1038/s41467-018-05060-4
Yang, W., and Yang, J. (2019). Advantage of variable-speed pumped storage plants for mitigating wind power variations: integrated modelling and performance assessment. Appl. Energy 237, 720–732. doi:10.1016/j.apenergy.2018.12.090
Yang, W., Yang, J., Guo, W., and Norrlund, P. (2016). Response time for primary frequency control of hydroelectric generating unit. Int. J. Electr. Power and Energy Syst. 74, 16–24. doi:10.1016/j.ijepes.2015.07.003
Yang, W., Yang, J., Tang, R., Ma, A., and Hou, L. (2019). Model experiments and study on regulating stability of isolated hydropower plants. IOP Conf. Ser. Earth Environ. Sci. 240, 082012. doi:10.1088/1755-1315/240/8/082012
Ye, Y., Yin, C., Gong, Y., and Zhou, J. (2017). Position control of nonlinear hydraulic system using an improved PSO based PID controller. Mech. Syst. Signal Process. 83, 241–259. doi:10.1016/j.ymssp.2016.06.010
Zhang, S., Andrews-Speed, P., and Li, S. (2018). To what extent will China’s ongoing electricity market reforms assist the integration of renewable energy. Energy Policy 114, 165–172. doi:10.1016/j.enpol.2017.12.002
Zhang, S., Yang, W., Li, X., Zhao, Z., Wang, R., and Li, Y. (2022). Economic evaluation of Wind–PV–Pumped storage hybrid system considering carbon emissions. Energy Rep. 8, 1249–1258. doi:10.1016/j.egyr.2022.03.001
Zheng, X. B., Guo, P. C., Tong, H. Z., and Luo, X. Q. (2012). Improved Suter-transformation for complete characteristic curves of pump-turbine. IOP Conf. Ser. Earth Environ. Sci. 15 (6), 062015. doi:10.1088/1755-1315/15/6/062015
Zhu, Z., Pan, W., Liu, T., and Liu, M. (2023). Frequency response mechanism modeling and performance analysis of adjustable-speed pumped storage unit [In Chinese]. Power Syst. Technol. 47, 463–474.
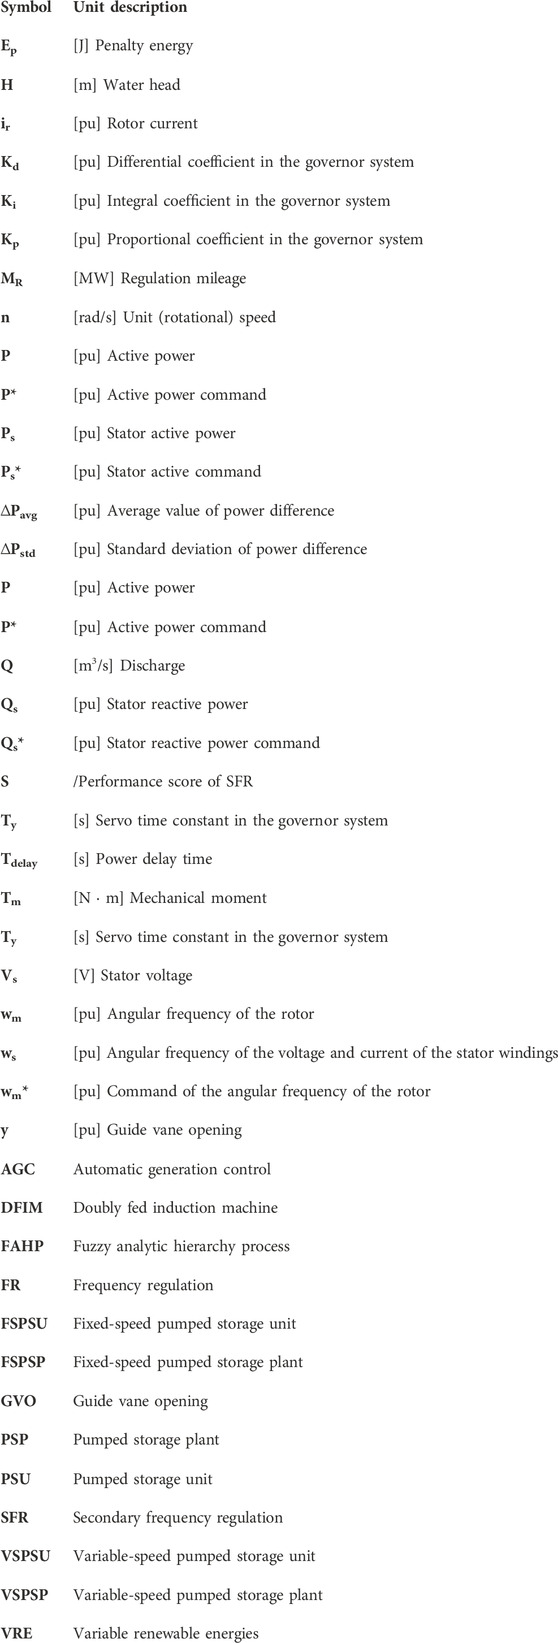
Nomenclature
Keywords: pumped storage, compensation of auxiliary service, secondary frequency regulation, performance of frequency regulation, quantitative evaluations
Citation: Chen J, Yang W, Li Y, Liao Y and Cheng Y (2024) Quantifying the performance and compensation of secondary frequency regulation of pumped storage plants considering variable-speed operation. Front. Energy Res. 12:1358150. doi: 10.3389/fenrg.2024.1358150
Received: 19 December 2023; Accepted: 25 March 2024;
Published: 07 May 2024.
Edited by:
Sandip K. Saha, Indian Institute of Technology Bombay, IndiaReviewed by:
Yun Zeng, Kunming University of Science and Technology, ChinaLeike Zhang, Taiyuan University of Technology, China
Copyright © 2024 Chen, Yang, Li, Liao and Cheng. This is an open-access article distributed under the terms of the Creative Commons Attribution License (CC BY). The use, distribution or reproduction in other forums is permitted, provided the original author(s) and the copyright owner(s) are credited and that the original publication in this journal is cited, in accordance with accepted academic practice. No use, distribution or reproduction is permitted which does not comply with these terms.
*Correspondence: Weijia Yang, d2VpamlhLnlhbmdAd2h1LmVkdS5jbg==