 Jianchao Hou*
 Yu Fu
Yu Fu- School of Economics and Management, Shanghai University of Electric Power, Shanghai, China
To study the spillover effect of the digital economy development on carbon emissions, this study innovatively constructs different spatial weight matrices, based on 2011–2020 panel data covering 30 Chinese provinces, and it explores the direct spillovers, conducted spillovers, and spillovers from different spillover channels, such as human capital, service industry development, and information development of digital economy development on carbon emissions through the spatial Durbin model combined with a mediating effect model. The results show that there is significant spatial heterogeneity in digital economy development; in terms of regions, the eastern region has the highest average development level and the central region has the highest average annual growth rate. Digital economy development can directly suppress carbon emissions, and it can also indirectly suppress carbon emissions by driving technological innovation and optimizing the energy consumption structure, and there exists a spatial spillover effect. Under human capital, service industry development and information development matrices, the spatial spillover effect of digital economy development on carbon emissions is significantly negative. Regions with the same level of information development are more likely to exert a spatial spillover effect of digital economy development on carbon emissions.
1 Introduction
All countries in the world today are confronted with a significant and pressing challenge in the form of climate change. Reducing carbon emissions (CE) to mitigate climate change has become an urgent task that requires concerted efforts by all countries to share this task, more than 130 countries and regions around the world have now proposed carbon neutrality targets. In 2015, the international community signed the Paris Agreement, urging parties to accelerate the development of national and regional greenhouse gas emission reduction programs tailored to local conditions and strive to achieve peak CE. The 27th Conference of the Parties to the United Nations Framework Convention on Climate Change (COP27) on 6 November 2022, emphasized the advocacy of green actions and expected countries to promote the realization of carbon neutrality and the building of a community of human destiny through legislation, policies and projects. China, being the foremost global energy consumer and a significant generator of CO2, the share of coal consumption is 30 percentage points higher than the world average, is facing the dilemma of fossil energy shortages and increasing pressure to reduce its CE, and it has responded positively and taken great measures to control greenhouse gases. In 2020, China proposed that it will strive to achieve peak CE by 2030 and carbon neutrality by 2060. China has been accelerating the green transformation of its economy and society to achieve this goal, becoming the main force of global “greening”. Based on data published by the World Bank, China’s cumulative energy savings surpassed half of all global energy savings from 2005 to 2020. Additionally, from 2012 to 2021, China supported an average economic growth of 6.5% accompanied by an annual energy consumption growth rate of 3%, saving a total of approximately 1.4 billion tons of standard coal and accordingly decreasing CE by 3.7 billion tons. Not only do these outcomes mean that China has achieved great results in CE reduction, but they also fully reflect China’s role as a great power in addressing climate change issues.
In the current era, the digital transformation is a major trend, and the Chinese government has issued a series of significant strategic plans and initiatives to support digital economy development (DIGDE). In 2021, China’s DIGDE grew to a scale of 45.5 trillion yuan, with the digital industrialization sector alone accounting for 8.35 trillion yuan. The rapid emergence of DIGDE has received sustained attention from academics, and as a more advanced economic and social form following agricultural and industrial economies, the digital economy has been endowed with higher green “expectations”. It is widely believed that DIGDE can accelerate the flow of innovation factors by virtue of its intelligent, Internet-based economy and sharing characteristics, and through the embedded integration and application innovation of digital technologies in key CE areas, such as buildings, energy and transportation, new energy is injected to promote the low-carbon transition (Qi and Xiao, 2020), which is a powerful impetus to drive the entire society into a new type of highly efficient, intelligent, and green low-carbon society. Recently, the Chinese government has prioritized synchronized regional development, emphasizing the fully utilization of DIGDE, guiding the linkage of regions and gradually narrowing regional disparities through the efficiency and cost advantages brought about by digitization and intelligent technologies. The government is doing so by encouraging the common construction and sharing of large-scale facilities between regions to promote energy savings and consumption reduction, leveraging the comparative advantages of each region, magnifying the superposition effect of digital technologies on green value and releasing the enormous potential for low-carbon development. However, it is worth noting that digital economic activities are also among the main sources of CE because of the deficiency in key sectors’ innovative capacity and the incomplete governance system in China’s DIGDE. How to form a virtuous circle of digital green practices is still an important focus for strengthening, optimizing and enlarging China’s DIGDE and achieving China’s CE reduction goals.
In this context, studying the impact of China’s DIGDE on CE is of great significance for promoting global carbon neutrality, facilitating economic transformation and development, and solving the synergistic problems of the global economy and the environment.
With DIGDE and the low-carbon transformation, there is still room for expansion in this field. Can China’s DIGDE become a new path for reducing CE? Does DIGDE have a geographic spillover effect on CE? Through which channels does DIGDE affect CE? Under different conditions, what are the characteristics of the spatial spill-over effect (SSE) of DIGDE on CE? Which conditions are more conducive to exerting SSE of DIGDE? This study centers on the above issues, and as a result, the marginal contributions of this study are: 1) In light of the ongoing iterative advancements in digital technology, the authoritative and harmonized standard does not exist for constructing and assessing a DIGDE index system. The present study endeavors to establish a comprehensive measurement index system for DIGDE by synthesizing the literature and incorporating available data resources. 2) Although some existing studies have used spatial measures that can account for the SSE inherent in CE, not enough attention has been paid to the SSE of the transmission mechanism through which DIGDE affects CE. In this study, the SDM is combined with a mediating effect model to study the trans-mission mechanism from a spatial perspective. 3) Studies on the SSE of DIGDE and CE are mostly based on a single matrix, and they focus on regions with similar geographic proximity and a similar economic level. They do not explore the possibility of spillovers due to other factors, and there are limitations in the choice of perspective and the discussion of the mechanism of the spatial effects of DIGDE. Referring to the research results in the literature, this study selects three major influencing factors, namely, human capital, service industry development and information development, and it constructs a spatial weight matrix innovatively to investigate the SSE of DIGDE on CE under these factors to provide useful policy insights to give full play to the green value and economic value of DIGDE and promote coordinated regional development. Providing insights and suggestions for regions to explore synergistic development paths, build synergistic governance mechanisms, and collaborate to realize carbon peaks has both academic value and practical significance.
The rest of this study is structured as follows. Section 2 is the literature review; Section 3 analyzes the impact mechanism and formulates hypotheses; Section 4 details the research design and data; Section 5 presents the empirical results and discusses the results of the benchmark regression, spatial effect regression and mediating effect regression; and Section 6 concludes the paper and offers policy recommendations.
2 Literature review
2.1 Literature on the concept and measurement of the digital economy
The digital economy is vigorously emerging worldwide. US academic Tapscott first conceptualized the digital economy at the beginning of internet development in the 20th century (Tapscott, 1996). Since then, scholars have increasingly directed their attention toward the digital economy. Studies have been conducted to define and measure DIGDE from different perspectives. According to Bukht et al. (2017), DIGDE is a type of economic production that is derived entirely from or that mostly relies upon digital technology, where digital goods or services are the base point.
Scholars in China and elsewhere have made many useful attempts to measure DIGDE. These attempts are typically divided into two groups. The first consists of direct methods, which estimate the corresponding DIGDE index to examine and compare the DIGDE index within each region (Eurostat, 2017; ITU, 2022; UNCTAD, 2021). The second category consists of construction methods, in which a multidimensional evaluation index system is constructed based on different perspectives (Cheng et al., 2023; Lin and Huang, 2023) and is subsequently used to measure DIGDE by assigning weights to the indicators.
2.2 Literature on the spatial differences in CE and the influencing factors
Research on CE has focused on carbon accounting along with differences in the spatial distribution of CE and influencing factors. There have been various concepts and methods of carbon accounting. For example, in 2011, the Chinese Academy of Sciences (CAS) started the “Climate Change: Carbon Budget and Relevant Issues” project to build a visualization system by integrating various utilization sector data to obtain the consumption factors of different energy types. The China Emissions Accounting and Datasets (CEADs) team used these CE factors to calculate and publish the corresponding CE inventory. Cai et al. developed a bottom-up urban greenhouse gas (GHG) accounting approach that can systematically reduce the uncertainty in emission variables and activity levels (Cai et al., 2018; Liu et al., 2021).
Numerous studies have confirmed that the distribution of CE varies significantly in space (Tong, 2020; Pan et al., 2023; Xu et al., 2023) and is determined by factors such as government intervention (Xiang et al., 2023), energy intensity (Chai et al., 2023), renewable energy (Azam et al., 2022), the economic output trend (Song et al., 2022) and industrial development (Cai et al., 2023). The research methods are focused on quantitative analysis. For example, Wang et al. (2023) employed structural decomposition analysis (SDA) as a method to assess the contributing factors affecting bilateral CE in 30 Chinese provinces, and they found that the technology effect can suppress bilateral CE, while the demand effect promotes bilateral CE. Azam et al. (2023a) used a panel autoregressive distributed lag (ARDL) found that negative synergy is perceived between CE and agricultural productivity.
(ARDL) model and found a negative synergy between CO2 emissions and agricultural productivity.
2.3 Link between DIGDE and CE
Established theoretical studies have argued that the carbon reduction impact of DIGDE is formed based on several aspects with the addition of digital technologies. At the governance level, digital governance theory holds that remote sensing technologies, big data, and cloud computing applications can increase the precision and efficacy of governmental environmental control (Yang et al., 2021) to enhance ecological governance (Thierer and Castillo, 2015), contributing to the realization of CE reductions. The flow of information between policymakers and the masses has been changed by enabling information interoperability and sharing between the government and society through digital media as a result of digital technology (Nulman and Ozkula, 2016; Bai et al., 2023). Simultaneously, the distribution of interactive information and internet environmental monitoring enable innovative interactive contact mechanisms between society and the government, promoting collaborative governance among all parties in the preservation of the ecosystem (Yang et al., 2020), which will enhance the efficiency of government governance (Chen et al., 2023b), and jointly promote the development of a low-carbon economy. From the perspective of energy efficiency, DIGDE can overcome limitations of time and space, accelerate the flow of factors and reduce energy consumption during transmission (Zhang et al., 2022). Meanwhile, digital technology strengthens green finance, accelerates the adoption of renewable energy, further promotes energy transformation (Han and Li, 2022) and improves energy use efficiency, which curbs CE. The findings of some research support this view. For example, Xie et al. (2024) found that DIGDE increases CE in the short term and exerts a carbon reduction effect in the long term. Wang et al. (2022) found that DIGDE is beneficial for reducing urban CE. Cheng et al. (2023) found that DIGDE reduces carbon emission intensity when the DIGDE index exceeds 0.419. Ma et al. (2022) conducted a study at the provincial level and found that DIGDE in China reduces the level of CE, while investments in research and development related to digitization also have a dampening effect on CE. Niu et al. (2024) found that DIGDE affects the transfer of CE between regions and reshapes resource trade relations.
Many beneficial explorations of DIGDE and CE have been conducted in the available literature, laying a rich foundation for our study. This study is based on the typical fact that DIGDE affects CE, and cuts in from the spatial perspective. Compared with the existing studies, this study focuses on SSE, by combining SDM with the mediating effect model to develop the study of the transmission mechanism from the spatial perspective. It also innovatively constructs a spatial weight matrix to empirically examine SSE of DIGDE on CE under different factors, such as human capital, service industry development and information development. To provide empirical support and policy references to give full play to the advantages of DIGDE, maximize support for the realization of spillover effects, and further develop its positive role in promoting synergistic low-carbon development in the region.
3 Theoretical hypotheses
3.1 Direct spillover mechanism of the impact of DIGDE on CE
DIGDE has led to a series of technological innovations (TEI) and management innovations that have been collected, integrated and distributed through the internet to maximize the effective use of resources. DIGDE has an impact on CE at three main levels. The first is the emission reduction effect of optimal resource allocation. DIGDE integrates information on production factors and resources through digital technology, optimizing resource allocation and the energy use structure, and thus reducing CE. At the same time, by promoting multiparty cooperation and group agglomeration, DIGDE has a positive externality effect on neighboring regions and even the whole economic system, i.e., it has an SSE. The second is the emission reduction efficacy in the low-carbon development model. DIGDE has broken the spatial and temporal barriers to production activities and has facilitated the regional circulation of production factors (Li and Wang, 2022), bringing positive externalities to overall output through local innovation activities (Park, 1995). The “digitalization of environmental sustainability” is promoted using monitoring technologies, enabling the generation of real-time CE data (Kloppenburg et al., 2022). Third, there is the emission reduction effect of environmental governance model innovation. Digital technologies are widely used in environmental governance, weakening geographic and organizational boundaries through digital platforms, attracting various stakeholders to construct and solve problems (Ozman and Gossart, 2017), and promoting the formation of informal environmental regulation dominated by the networked public (Certoma, 2022). Under the new pattern of information opening and sharing, through the role of competition and demonstration effects, the positive SSE of DIGDE on regional high-quality development can be brought into play, and the green transformation ability of surrounding regions can be improved. Thus, the following hypotheses is proposed.
H1. There is SSE on the impact of DIGDE on CE.
3.2 Conductive spillover mechanism of the impact of DIGDE on CE
DIGDE promotes changes in research and development (R&D) and innovation paradigms, provides new means and channels for innovation information access, and enhances innovation efficiency and quality (Lai et al., 2022). TEI on the energy supply side can accelerate the development of clean energy and the use of low-carbon technologies, promote the formation of new industrial and value chains, and facilitate the sharing and dissemination of low-carbon technologies and experiences. Thus, there are so-called innovation spillover benefits. TEI on the energy consumption side can improve energy efficiency. The application of low-carbon technologies in the transportation, construction, and chemical industries, directly contributes to CE reduction and drives the upgrading of green technologies in neighboring regions through cross-regional environmental collaboration.
At present, the resource endowment and scientific and technological development are hindering regional economic development and the realization of CE reduction targets in China. The realization of the goal of ecological civilization construction not only requires the guidance of TEI but also places higher demands on the energy supply system. DIGDE brings digital support to energy consumption structure (ECS) adjustment, which can support the government in quickly perceiving and making quick decisions by creating new tools to guide the real-time flow of energy factors (Ferreira et al., 2023). The widespread use of clean energy and new technologies can enhance the use of renewable energy and reduce the total CE from economic activities, ultimately forming a diversified and low-carbon energy supply pattern. Since the industrial chains and energy supply chains of neighboring regions are interrelated, the industrial adjustment and transfer brought by ECS optimization in a region can affect CE of neighboring regions through the cross-border flow of energy and production factors. Through the comprehensive analysis conducted above, the following hypothesis is proposed.
H2. DIGDE can influence CE by driving TEI and optimizing the ECS.
3.3 Differential spillover mechanism of the impact of DIGDE on CE
3.3.1 Human capital level
DIGDE has increased the demand for laborers’ skills in digital innovation, data processing and analysis, and digital technology applications. As a key factor leading innovation-driven development, human capital provides advanced knowledge and skills to support innovation development, and it is the main driver promoting innovation output and accelerating innovation transformation. In the DIGDE industry, the rapid influx of information and capital, and the corresponding labor input are more inclined toward highly skilled and high-quality talent. Regions with similar human capital levels have frequent knowledge exchange and high talent flow rates, which greatly improve the value-added of knowledge and innovation performance, and this improvement can facilitate regional industrial structure optimization and collaborative development. DIGDE is data-driven by nature, breaking the restrictions of time and space on production and life activities and making interregional cooperation and communication more convenient. Digital interactive tools such as online communication platforms, remote training and virtual reality technology, reduce the CE generated by outgoing traffic. It follows that the green development effect brought by DIGDE will inevitably spread to areas with strong human capital ties.
3.3.2 Service industry development level
Currently, the digital services brought by the digital revolution have become the new growth point of the service industry. DIGDE has promoted the digital transformation of the service industry, and thus, it not only has become the booster of Chinese-style service industry digitalization but also has tapped the potential and space of service consumption through the link effect, trust effect, empowerment effect and innovation effect. An increasing number of traditional brick-and-mortar services, such as retail, restaurant and entertainment businesses, are providing online services to consumers through digital platforms. Not only does this trend reduce the demand for physical stores and the associated energy consumption, but its digital features also reduce energy waste in the service supply chain through accurate consumer demand forecasting and resource management. The service industry generates knowledge and technology SSE on external industries when engaging in a series of exchanges, such as industry-university-research cooperation and school-enterprise alliances. In particular, regions with similar service industry levels are related in various aspects, such as inputs and outputs, which in turn increases the degree of knowledge and technology spillover, thus realizing the sharing of technology and experience.
3.3.3 Information development level
Unlike the eras of the agricultural economy and industrial economy, the key production factors in the DIGDE era are data and information. With the continuous advancement of the information process, the interactive network of producers has gradually improved, the traditional industrial boundaries have been broken, and the industrial correlation between regions has become increasingly close. With the rapid progress of big data and information transmission technology, the cost of information storage, transmission and processing has dropped significantly, and thus, DIGDE can realize the dissemination at a lower cost by virtue of its network externality, providing a broader reference and decision-making base for other regions and industries. Regions with similar levels of information development have similar digital infrastructure configurations, and enterprises in these regions can be connected through digital platforms and the internet, so that energy management technologies and experiences can be disseminated and absorbed more efficiently. Meanwhile, the utilization of modern information technology can enhance energy efficiency and effectively reduce the scale of CE.
Accordingly, combining Hypothesis 1, we propose the following hypothesis.
H3. DIGDE affects CE through a variety of spillover channels, and an SSE exists not only between neighboring regions, but also between regions with similar levels of human capital, service industry development and information development.
Combining the above analysis, the model of the framework is shown in Figure 1.
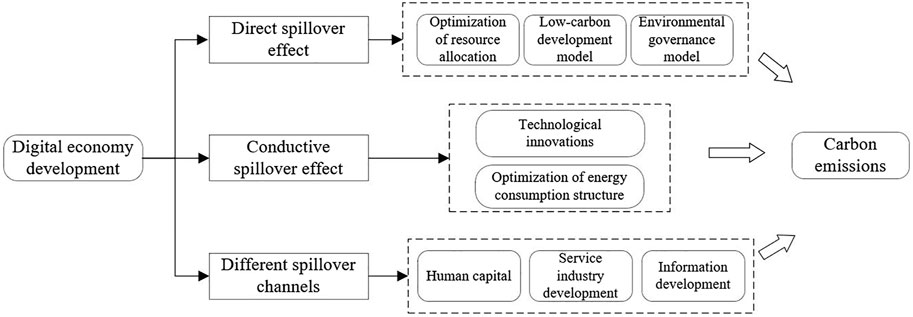
FIGURE 1. Theoretical framework diagram.
4 Methods and data
4.1 Static panel model
The stochastic impacts by regression on population, affluence, and technology (STIRPAT) model is a common model for analyzing the influence of economic elements on the environment. This model can take into account the unequally proportional influence of human factors on the environment and has good scalability. This study extends the STIRPAT model and constructs a baseline regression model by incorporating the theoretical analysis above as follows:
Here, in Eq. 1 lnCEit and lnDIGDEit denote the level of CE and DIGDE at year t in region i, respectively. lnGOV, lnOS, lnFD, lnUR and lnLY denote government financial support, the degree of marketization, the degree of openness to the outside world, the urbanization level and the level of per capita income, respectively. The area fixed effect is denoted by μ, the time fixed effect is denoted by σ, and the random disturbance term is denoted by ε.
4.2 SDM
Not only are CE directly influenced by the policies and economy of a region but they are also influenced by related factors in surrounding areas (Chen et al., 2023a). To adequately consider these influencing factors, this work studies the influence of DIGDE on CE by establishing an SDM. Moran’s I can test whether there is spatial autocorrelation in the data, and SDM can be used to explore its specific correlation. The specific construction of SDM requires a series of tests, the use of Hausman’s test can determine whether the model should be selected as a random-effects model (REM) or a fixed-effects model (FEM) (Azam et al., 2023b), the LR test can be used to further determine the fixation of the individual or time or both, and the combination of the WALD test can ultimately select the most appropriate model.
In Eq. 2 lnDEC is the explanatory variable, which includes DIGDE and the corresponding control variables, ρ0 denotes the spatially lagged regression coefficient. The remaining parameters are set as in Eq. 1.
4.3 Spatial weight matrix
Based on the previous theoretical analysis, referring to the results of existing research on the impact factors of DIGDE on CE (Grigorescu et al., 2021; Williams, 2021; Jiang et al., 2023; Pan et al., 2023; Wang et al., 2023), this study considers four major factors: geographic proximity, human capital development, service industry development, and information development. Four spatial weight matrices are used to process the SDM in this study. The first is the adjacency spatial weight matrix (W1), which uses 0 and 1 to mark the spatial adjacency between regions. Wij = 0 when region i, and region j are neighboring and Wij = 1 when region i and region j are not neighboring.
The second is the human capital matrix (W2), which takes the average annual employment in each province as a measure. When the level of human capital in two regions is similar, the greater weight of the two regions is considered, assuming that the levels of human capital in region i and region j are hi vs. hj.
The third is the service industry development matrix (W3), which, as a measure, is calculated by using the proportion of output value of the tertiary industry to GDP as the service industry development level in the two regions, assuming that the level of development of the service industry in the two regions is si and sj.
The fourth is the information development level matrix (W4), which, as a measure, is calculated by using the average annual telecommunication business revenue in each province, assuming that the level of information development in the two regions is di and dj.
The matrix construction formula is as follows.
In Eq. 3 zi denotes different variables in spatial weight matrix setting hi, si, and dij; zj denotes hj, sj and dj.
4.4 Mediating effect model
To verify whether TEI and the ECS act as mediating variables in accordance with the previous theoretical hypotheses, this study conducts a multiple mediating effect test based on the stepwise regression method combined with the SDM.
First, the regression coefficients of CE and DIGDE are tested to verify whether DIGDE has a direct impact on CE, as in Eq. 1.
Second, whether there are direct effects of DIGDE on the mediating variables is examined in Eq. 4.
Finally, the indirect and total effects of DIGDE and the mediating variables on CE are examined.
Where Mit denotes the mediating variable in Eq. 5.
4.5 Variable selection
4.5.1 Explained variable (CE)
Carbon Emissions (CE). According to the “Energy Statistics Reporting System” (2022), the consumption of various energy sources in use is equal to the sum of process conversion input losses, transportation, transmission and distribution losses, and final consumption. No combustion occurs in the energy lost for transportation and transmission and distribution, for this reason, this part measured only the CE of thermal power generation and heat supply input energy, ignoring the CE of other process energy losses. To avoid double counting, the portion used for industry is deducted from the final energy consumption.
In calculating the final CE, this study overcomes the problem of overly simple statistics of various types of final energy consumption leading to large calculation errors by referring to the method of Jing et al. (2019). The relevant data based on the energy balance of each province are used to determine the CE in the “China Energy Statistics Yearbook” by converting the total consumption amount of energy consumed across all forms of energy into standard consumption and multiplying the CO2 emission coefficients of different types of energy as follows:
In Eq. 6 Ei, Efi, Ehi, Eei and Eyi denote the ith energy consumption after conversion, consumption in thermal power generation, consumption used for heating, end consumption, and the portion of end consumption used for industry, respectively, and Si denotes the converted standard coal coefficient for each type of energy.
where λi denotes the ith energy CO2 emission coefficient in Eq. 7.
4.5.2 Explanatory variable (DIGDE)
This study constructs a DIGDE evaluation index system (Table 1) by fully considering the connotation of DIGDE and referring to the results of existing research (Zhao et al., 2023; OECE, 2018; Shahbaz et al., 2022). The subjective weighting method relies on the intention of decision-makers when assigning weights to indicators, which is not appropriately objective. The entropy weighting method assigns weights to indicators by comprehensively considering the information entropy of each evaluation indicator, avoiding the influence of subjective factors on the weights, so the results are more objective and reliable, the entropy weight method is utilized to estimate the amount of DIGDE in this work (Yi et al., 2022).
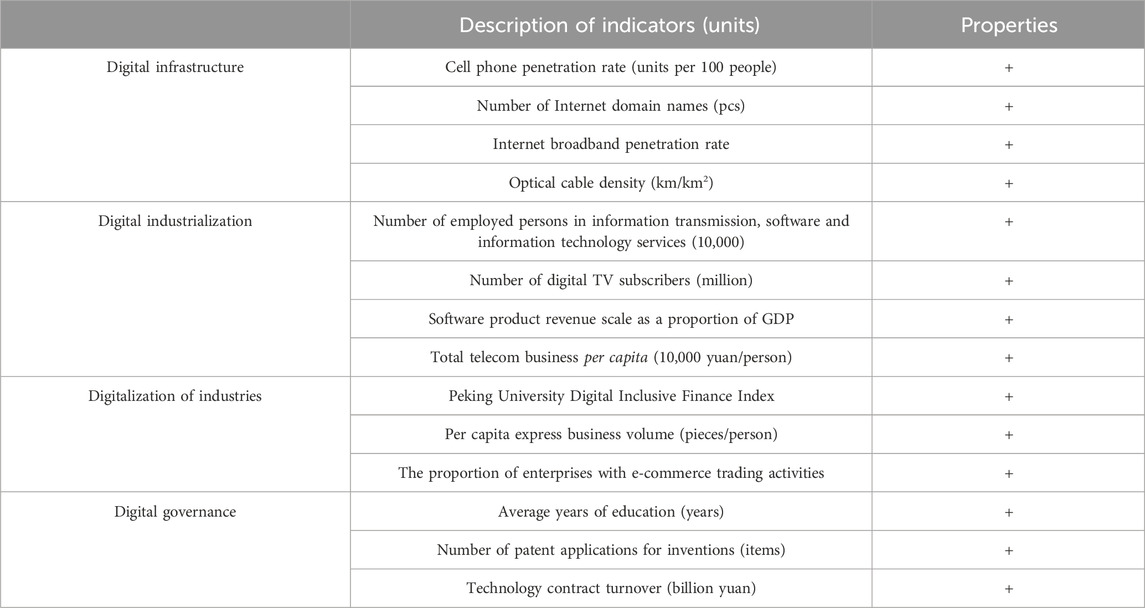
TABLE 1. DIGDE level indicator system.
The results of DIGDE are shown in Figure 2. Over time, the level in each region has risen yearly, and many regions lagging behind in DIGDE have accelerated their development and transformed into catching-up regions. Specifically, the overall average value of DIGDE has increased from 0.0648 to 0.2732, with a 14.78% yearly rate of increase on average, and the development level of provinces has also increased significantly. In 2020, Beijing, Shanghai, Zhejiang, Jiangsu, and Guangdong held the top development positions, with all four exceeding 0.4. In addition, Tianjin, Shandong and Shanxi are developing rapidly and are in the catching-up ranks of development. However, there is still a noticeable interprovincial disparity; for instance, the development levels in Beijing and Shanghai in 2020 were 3.26 times and 3.10 times those of Guizhou, respectively. However, the growth rate of lagging areas is high, and the catch-up trend is obvious.
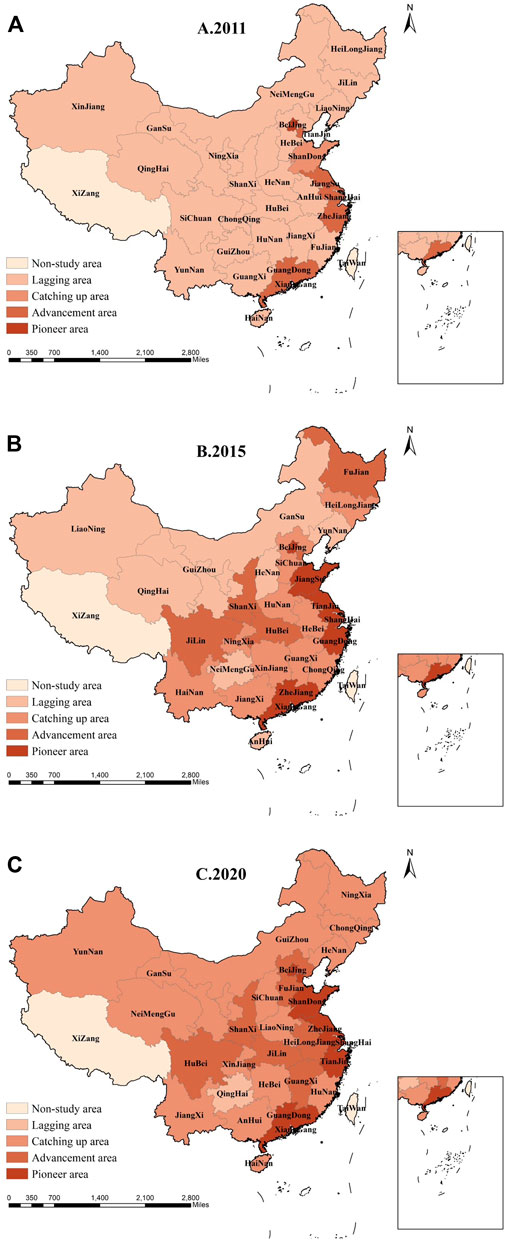
FIGURE 2. China’s DIGDE level in 2011, 2015, 2020.
From the perspective of individual regions, the eastern region has the largest overall average level of DIGDE, the central region has the highest average annual growth rate, indicating that the region’s digital economy is developing rapidly and has great potential for development. And although the growth rate of the western region is slightly lower than that of the central region, it also has a large space for development. From the point of view of the development level, the eastern region has a higher level of DIGDE, and its development is significantly better than that of other regions. Other regions have a weaker digitalization foundation, which makes the DIGDE level between regions have a large gap. It is still an urgent task to take effective measures to improve the level DIGDE in relatively underdeveloped regions, narrow the gap between regions and prevent the further widening of the “digital divide.” This is not only an important task at present, but also the key to the future DIGDE.
4.5.3 Other variables
4.5.3.1 Mediating variables
TEI: This study measures the level of regional TEI by using the proportion of science and technology expenditure in local general public budget expenditure (Wang et al., 2020).
ECS: This study draws on Shao et al. (2019) and uses the share of coal consumption in total energy consumption to measure the ECS.
4.5.3.2 Control variables
FD: FD is conducive to attracting foreign enterprises that have high energy-saving and emission-reducing technologies to enter the market to learn from them. The proportion of a region’s total imports and exports in GDP is used to evaluate this variable (Wang et al., 2022).
UR: UR implies a shift from an agricultural population to a nonagricultural population, and the change in the production, lifestyle and residence patterns of the group shifting from the agricultural population to the nonagricultural population is a shift in energy consumption demand, with consequent effects on CE. UR is expressed by the proportion of the urban population to the total population in this study (Zheng et al., 2020).
LY: LY can be used to measure people’s living standards, providing a reference basis for formulating important policies. We use 2011 as the benchmark period to process the GDP data in current-year prices, and we use real GDP per capita to measure LY (Zheng et al., 2020).
OS: An increase in marketization adjusts the allocation of resources and leads to changes in the organization of production. This variable is measured by using the marketization index developed by Fan et al. (2011).
GOV: Government support affects the local economy to varying degrees. This variable is measured by fiscal spending as a share of GDP (Zhang et al., 2022).
4.6 Data descriptions
Data are primarily taken from the China Statistical Yearbook, the National Bureau of Statistics, and relevant regional statistical yearbooks. The Peking University Digital Inclusive Finance Index comes from the Institute of Digital Finance, Peking University. Due to excessive missing data for Tibet, Taiwan, Macao and Hong Kong, they are not discussed in this study.
Missing data are filled in through linear interpolation. To avoid pseudoregression and eliminate heteroskedasticity, all variables are transformed using logarithmic scales.
Table 2 lists the descriptive statistics of each variable made in this paper, Table 3 lists the descriptive statistics of each variable: the maximum values of lnDIGDE and lnCE are 6.2405 and 11.7487, respectively, and the minimum values are 2.2721 and 8.1360, which are basically consistent with the measurements observed in the literature. lnOF has the maximum value of 7.5183 and the minimum value of 0.4164, which indicates that the level of openness to the outside world is uneven among different regions, and polarization is serious. This may be due to different geographic locations; coastal areas have developed freight transportation, so their level of openness to the outside world is higher. The standard deviation of lnLY is the largest at 1.3058, and the standard deviation of lnOS is the smallest at 0.2620, which indicates that per capita income levels vary widely across different regions in the sample, and the degree of marketization does not vary greatly.
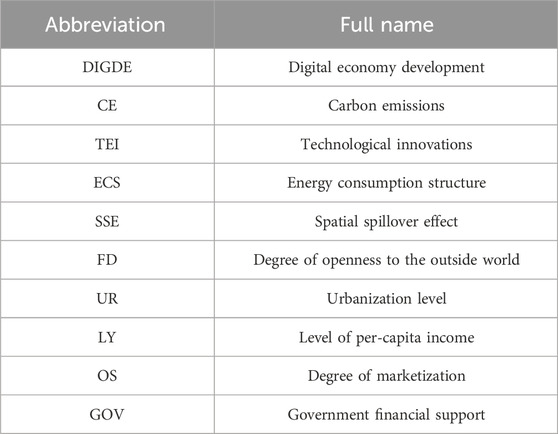
TABLE 2. Abbreviation comparison table.
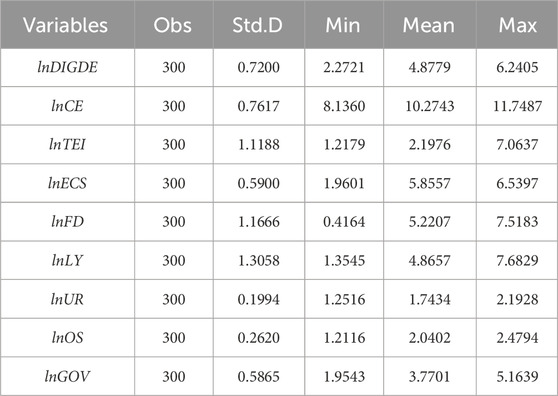
TABLE 3. Variables statistics.
5 Results and discussion
5.1 Spatial autocorrelation test
This study explores the agglomeration features of DIGDE and CE from 2011 to 2020 based on Moran’s I (Table 4), the findings of which demonstrate that Moran’s I is positively significant under W1. It is inferred that the close connections among different cities and their generated correlations can affect the spatial correlation of DIGDE and CE.
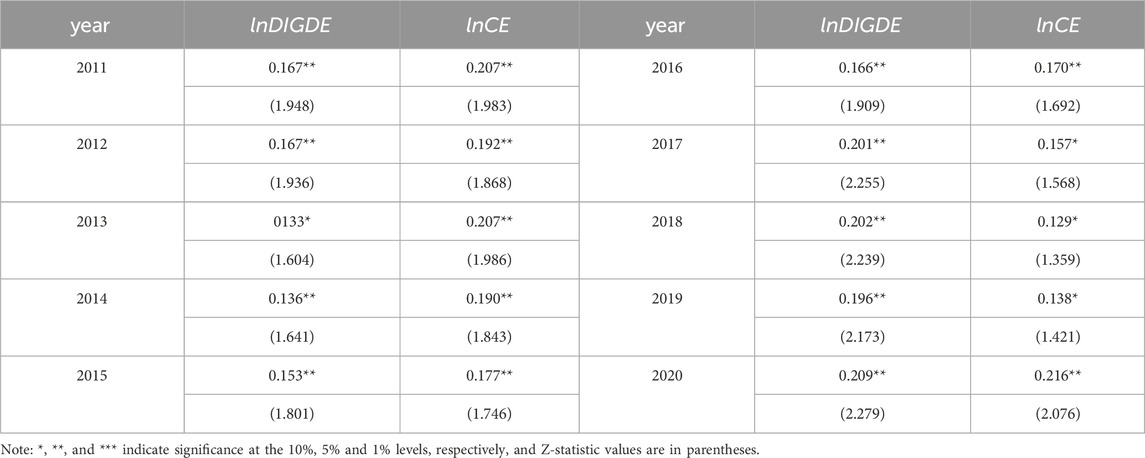
TABLE 4. Results of Moran’s I.
5.2 Benchmark regression test
The baseline regression model of Eq. 1 is first estimated, and the benchmark test results are shown as the regression findings in Table 5. The three columns show the results of mixed OLS, fixed effect and cluster standard errors. By comparing the model results, it can be seen that the model’s goodness of fit, significant levels of variables and coefficients do not change much in the three regressions, which indicates that the variables entered into the model are relatively stable. That is, the inhibitory effect of DIGDE on CE is stable and reliable. In summary, the regression results confirm Hypothesis 1 that DIGDE can suppress CE. Further spatial studies can be carried out on this phenomenon.
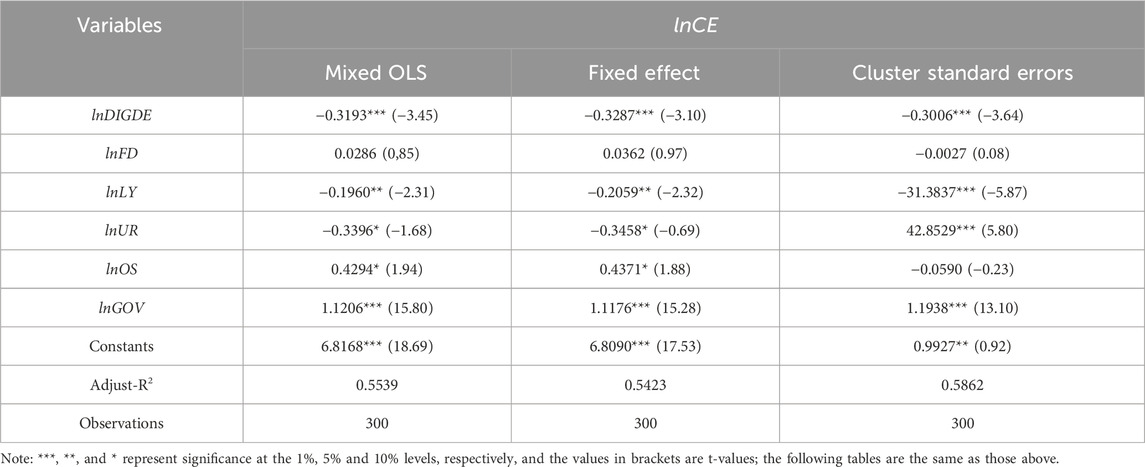
TABLE 5. Benchmark regression results.
5.3 Spatial model test
To determine the most effective model for exploring the relationship between DIGDE and CE, this study uses the LM, Wald, and LR tests (Chen et al., 20233), indicating that the SDM with time fixed effects is the best choice, the Hausman test supports the fixed effect model (Zhao and Wang, 2022) (Table 6). The partial differential method is applied to decompose the impact of the local region and neighboring regions into direct effects, indirect effects and total effects (LeSage and Pace, 2009) (Table 7).
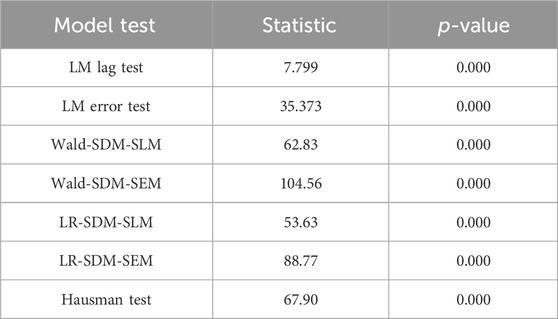
TABLE 6. Results of three major test.
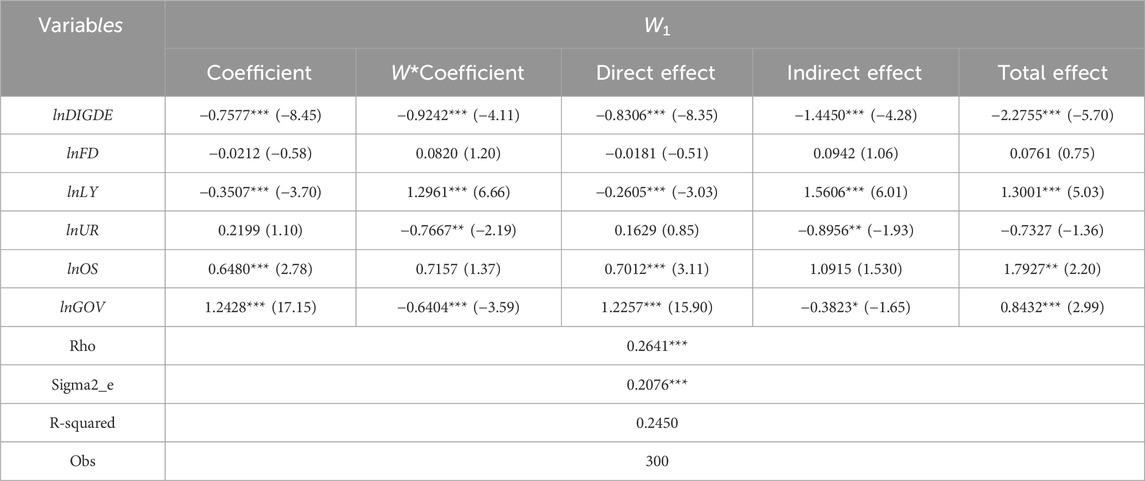
TABLE 7. Results of the SDM regression in Eq. 3.
The coefficients of the impact of DIGDE on CE and the SSE are both significantly negative under W1. Compared with Table 6, the impact of DIGDE on CE will be underestimated when the SSE is ignored, which is not conducive to effective regional environmental regulatory policies and DIGDE. The coefficient of the indirect effect of DEIGDE on CE is −1.4450, which is 1.7397 times the direct effect. This result indicates that DIGDE in a region can influence CE in neighboring regions, and when the level of DIGDE in a region increases by 1%, its inhibitory effect on CE in neighboring regions is 1.7297 times higher than that in the region. This phenomenon is due to the accelerated development of internet trading platforms, which accelerates the cross-regional flow of production factors. Through open sharing, the development of internet trading platforms promotes the productivity of neighboring regions, thus contributing to the optimization of resource allocation. It can be assumed that if neighboring regions also accelerate DIGDE, the overall level of CE reduction in an area will be improved, thus forming a virtuous circle of the “snowball effect” between regions.
Under W1 the coefficient of the control variable lnLY exhibits a positive effect on CE in surrounding areas and a negative effect on CE in region. The scale and development of production activities in an area are largely determined by the level of consumption of residents. High-income groups tend to have a higher demand for environmental standards and affordability. This higher demand has prompted enterprises to implement green production and sustainable development strategies and shift industries that are not environmentally friendly to neighboring areas. lnUR increases CE in a region, while it exhibits a lowering effect on adjacent areas. The rise in the urbanization level implies a more pronounced population agglomeration effect, which is accompanied by a shift in the labor force and a change in economic activity patterns, thus increasing transportation CE due to population migration. The lnOS and lnGOV variables increase local CE, and because the environmental effects have a relatively long and low return cycle, local governments tend to be more likely to invest in fields with faster economic return. If the direction of marketization and government financial support is oriented toward increasing productivity, then it will promote production scale expansion, which is not conducive to ECS and CE reduction (Shao et al., 2013). Furthermore, the promotion of new environmental protection technology industries and the impact of government regulation on the environment often have a certain time lag. Therefore, current period market-based reforms do not necessarily have a significant dampening effect on CE. However, sharing infrastructure with neighboring regions can effectively avoid duplication of investment in construction and waste of resources and reduce the land occupation, energy consumption and material extraction required for new projects, thus helping neighboring cities save energy and reduce CE.
5.4 Mediating effect test
The results of the stepwise regression and the decomposition of the mediating effects are listed in Tables 8, 9, and the results in model (2) satisfy the prerequisites for the subsequent stepwise regression in the theory of Judd and Kenny, (1981).
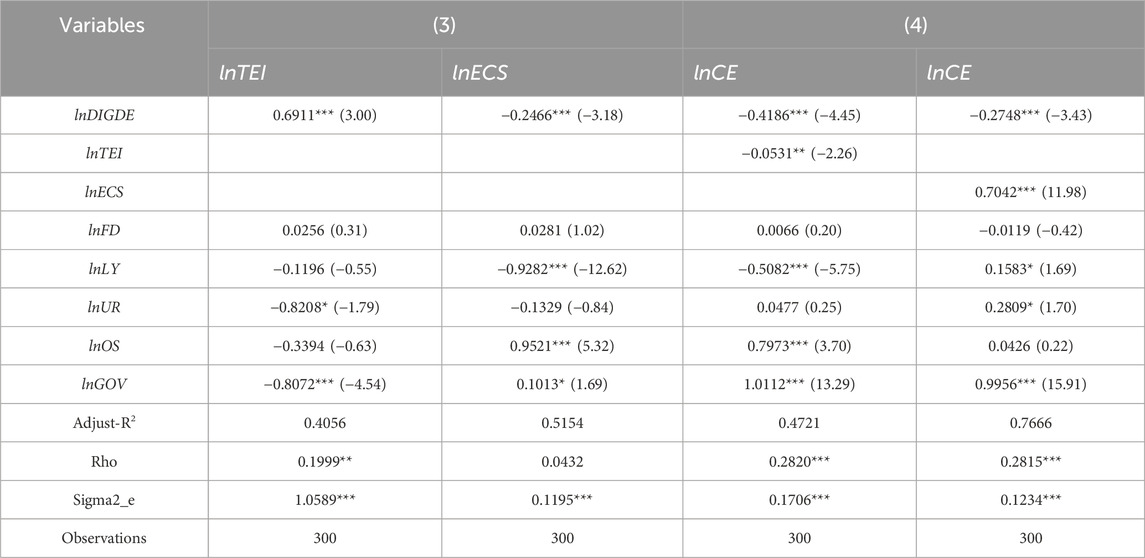
TABLE 8. Stepwise regression results of the mediation model.
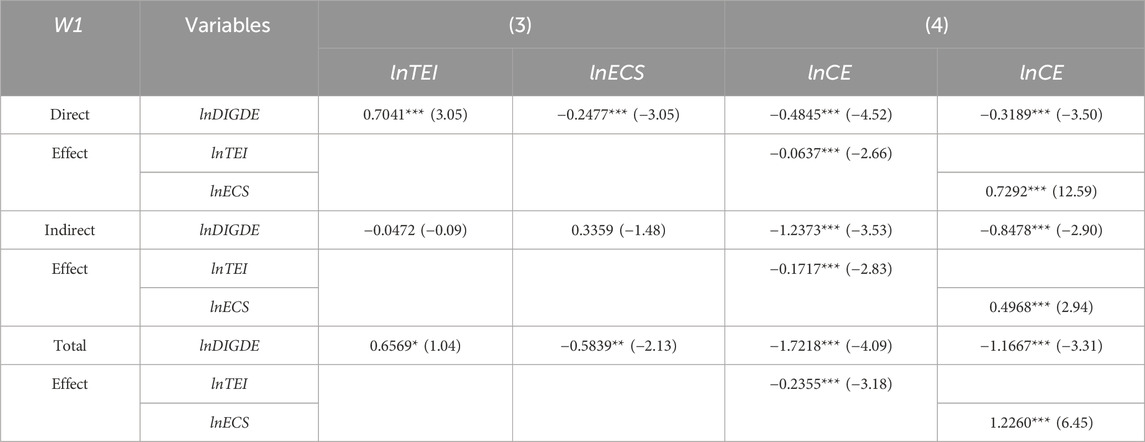
TABLE 9. Decomposition results of the mediation model.
Regarding the mediating transmission mechanism of TEI, DIGDE can significantly promote TEI, and after adding the mediating variable TEI, CE are shown to be significantly slowed by DIGDE and have a significant SSE. This result indicates that TEI holds as a mediating variable. Regarding the mediating transmission mechanism of the ECS, in model (3), the coefficient of the effect of DIGDE on the ECS is significantly negative. DIGDE on CE is negative, and the ECS on CE is positive in model (4). These results indicate that DIGDE can promote CE reduction, and at the same time, the increase in the proportion of coal consumption leads to higher CE levels, which once reaffirms that China’s “high-carbon” ECS with an abnormally high reliance on coal is an important reason for the hindrance in CE reduction (Shao et al., 2019). The coefficient shows that DIGDE has a strong promoting effect on TEI, and when the intermediary variable TEI exists, DIGDE has a more positive inhibiting effect on CE. DIGDE has driven the intelligent transformation of traditional industries and improved the efficiency of resource utilization, reducing the use of fossil fuels in the production process, and achieving the effect of saving energy to reduce emissions at the source. The SSE of the mediation effects decomposition results in Table 8 is also consistent with the expected assumptions. That is, DIGDE can lead regional green collaborative development through TEI and by optimizing the ECS.
5.5 Robustness test
The CE estimation method above uses regional CE for measurement, and there are still many studies in the literature that use per capita CE to measure CE levels. In Table 10, when lnPCE is used as the dependent variable, the mediating effect and SSE are still valid, which confirms the robustness of the results above.
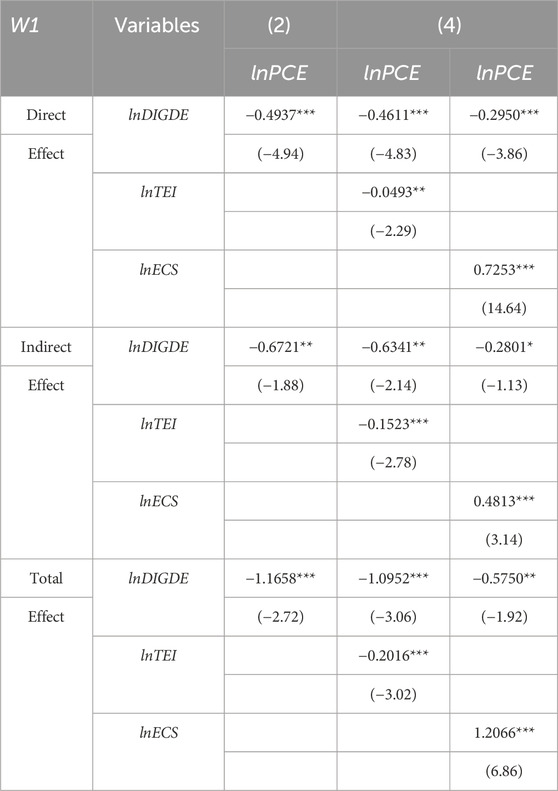
TABLE 10. Results of the robustness test.
In econometric regression, to obtain consistency in the effects, it is important to address possible endogeneity. Different from traditional ordinary least squares (OLS) regression, the SDM makes it possible to obtain estimates that are not biased by amplification, thus avoiding endogeneity due to omitted variables (LeSage and Pace, 2009). Drawing on Wang and Guo (2023), this study uses the generalized spatial two-stage least squares (GS2SLS) model to control for the endogeneity problem of the key variables and lags the explanatory variables by one period. The regression results in Table 11 show that after mitigating the potential endogeneity problem, the study’s conclusions still hold, and the mediating effect remains.
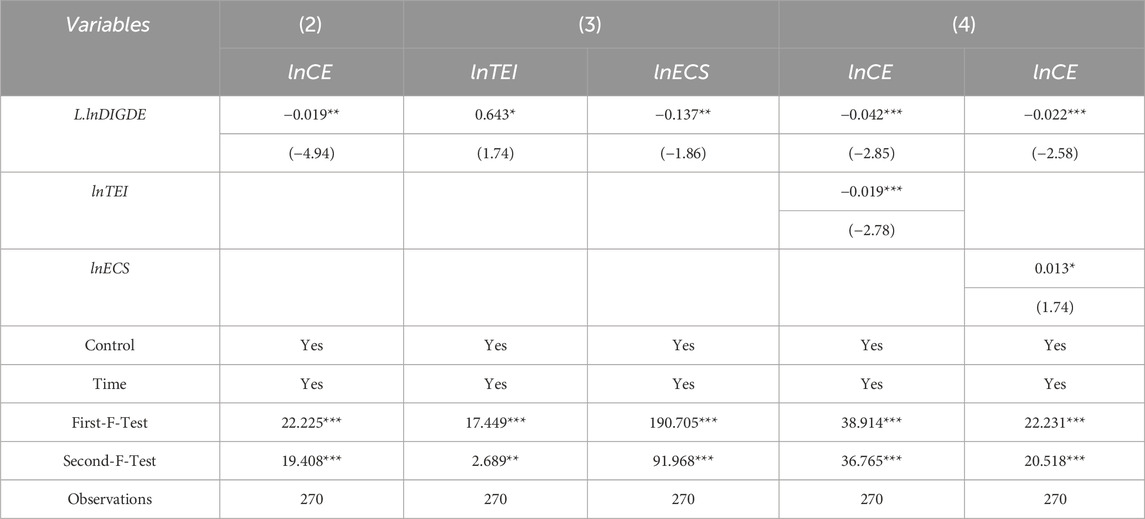
TABLE 11. GS2SLS results.
5.6 SSE
In Table 12, the SSE of DIGDE on CE also exists among regions with similar human capital, service development, and information development and is similar to the effects under W1. Additionally, the indirect effects are all larger than the direct effects, confirming H3. The coefficient of the indirect effect of DIGDE on CE is the largest under W4.
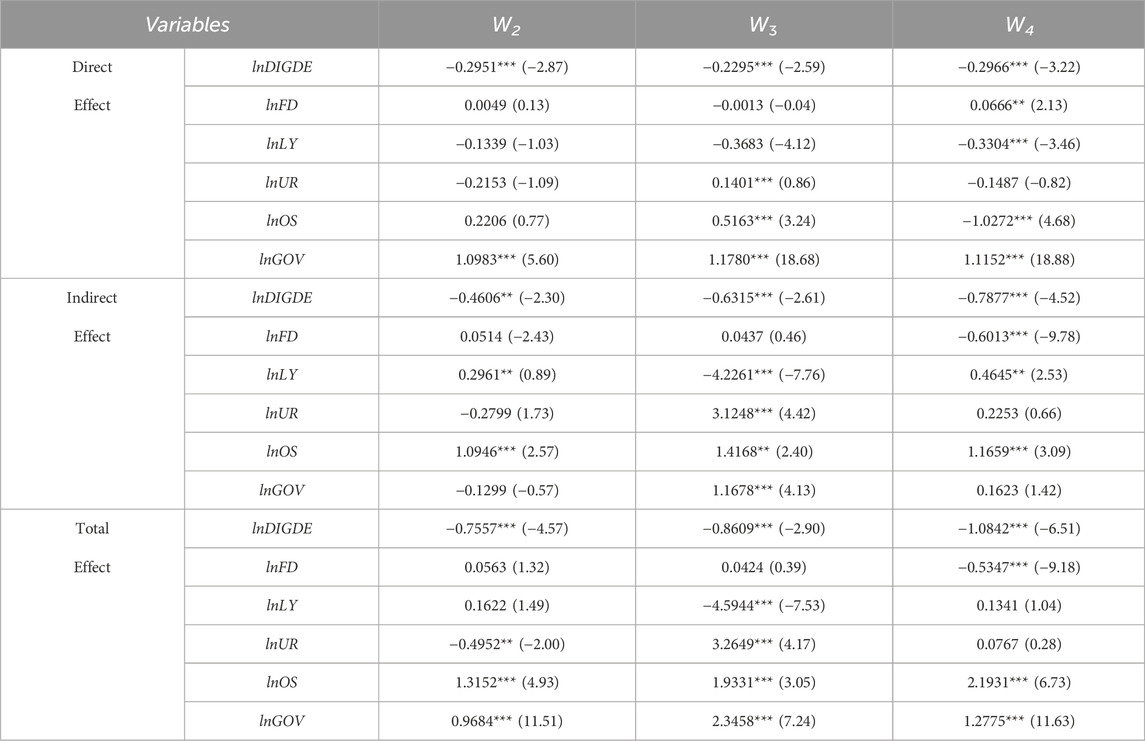
TABLE 12. Spillover channel test results.
In the context of digitalization and intelligence, human capital has become an important resource for regions, and innovative and high-tech companies have improved their innovation efficiency and green transformation capabilities by adjusting workforce involvement through effective talent management (Zahoor et al., 2022). Green enterprises promote carbon reduction in regions with higher environmental standards and more sophisticated energy-saving technologies, and can play a positive role in leading and regulating the development of regions with similar human capital. Meanwhile, DIGDE involves the Internet of Things and other fields with high intensity R&D investment, which can produce strong SSEs. These effects change the development model of the service industry through the intellectual capital and human capital needed by the service industry, and they promote its digital transformation. Through online platforms and applications, many traditional processes can be optimized, reducing energy consumption and CE in physical service processes. Regions with similar levels of service industry development have similar industrial structures and usually have closer flows of technological elements and industrial interconnection, which can promote green synergy through technology promotion and resource sharing. DIGDE drives the efficient operation of material flow and technology flow with information flow, and it promotes the optimal allocation of resource elements between industries. The symbiotic union of different types of industries is becoming increasingly common, and industrial integration is deepening, prompting the gradual adjustment of the industrial structure to be high grade, low carbon and green. Therefore, in regions with similar human capital and service development, DIGDE can exert an SSE that reduces CE. In addition, regions with similar levels of information technology development have high levels of networked synergy. Open platforms based on information technology provide a borderless space for information sharing, which fully reduces information asymmetry in the process of rapid information flow (Asongu et al., 2017), making the transmission of green technology ideas and environmental protection more effective. Therefore, compared with W2 and W3, it is easier to bring into play the SSE of DIGDE on CE under the W4 matrix.
6 Conclusion and policy implications
6.1 Conclusion
Given the typical fact that DIGDE affects CE, this study starts from the spatial perspective, and based on the panel data of 30 provinces and regions in China from 2011 to 2020, it innovatively constructs different spatial weight matrices on the basis of measuring the level of DIGDE and combines SDM with the mediation effect model to investigate the mechanism of the impact of DIGDE on CE and the multiple SSE from the spatial perspective. The following conclusions were drawn from this study. First, there is obvious spatial heterogeneity in DIGDE. The eastern region has the highest overall average level of DIGDE, which has reached a certain scale and height. The rapid growth of DIGDE in the central region, with the highest average annual growth rate, showing great potential and opportunities for development. The average annual growth rate of the western region is slightly lower than that of the central region, it also shows a stable development trend and broad development space. Second, DIGDE can suppress CE and have a significant SSE. This means that with DIGDE, not only can CE be reduced directly, but its influence can also be transferred between regions and have a dampening effect on CE in neighboring regions. DIGDE can indirectly reduce CE by driving TEI and optimizing ECS. Third, the impact of DIGDE on CE is also influenced by other factors, under the role of human capital, service industry development and the information development matrix, DIGDE has a negative SSE on CE. Regions with a similar level of information development are more likely to exert SSE of DIGDE on CE. This further emphasizes the important impact of synergies between DIGDE and other elements of development on CE.
6.2 Policy implications
Mitigating climate change and reducing CE is the common responsibility of all mankind. Based on the findings, the policy implications of this study are as follows.
The policy insights obtained from this paper are as follows. First, DIGDE is conducive to reducing CE, and in addressing the challenges of climate change, we should continue to increase the level of DIGDE. Continuously unleashing the dynamism of demand, including investment and information consumption, in DIGDE, and give full play to the leading role of DIGDE in green development. In response to SSE, interregional economic ties should be strengthened, and efforts should be made to narrow the gap in DIGDE between regions by exploiting different regions and forming a pattern of coordinated regional development by building a mechanism of synergistic development and complementary advantages between regions. Second, we should fully consider the transmission mechanism through which DIGDE affects CE and focus on improving the level of TEI and strive to drive the rise of low-carbon industries through the development of digital technology. The restructuring of ECS should be accelerated, the level of conversion and application of new energy should be improved, and a clean, low-carbon, safe and efficient energy system should be built. The government can strengthen the awareness of energy saving and emission reduction of enterprises by strengthening supervision and forcing them to optimize their own ECS. Third, considering the strongest SSE of DIGDE on CE under the information development level matrix, in exploring the practice of DIGDE and CE reduction, we should focus on learning from regions with similar levels of information development to quickly and effectively accumulate experience and give full play to the important role of information development in driving regional synergistic development.
The limitations of this study are as follows. First, digital technology is constantly iteratively developing, and methods of evaluating DIGDE can be further explored. Second, this study focuses on the impact of TEI and the ECS. Subsequent studies can also proceed from the perspectives of environmental regulation and economic ag-glomeration to further explore the impact path of DIGDE on CE. Finally, from the perspectives of service industry development, human capital and information development, this study examines the SSE of DIGDE on CE. Follow-up studies can also be carried out from the perspectives of other context elements.
Data availability statement
The original contributions presented in the study are included in the article/supplementary material, further inquiries can be directed to the corresponding author.
Author contributions
JH: Conceptualization, Data curation, Funding acquisition, Methodology, Supervision, Writing–original draft, Writing–review and editing. YF: Writing–original draft, Conceptualization, Data curation, Investigation, Methodology, Software, Validation, Visualization.
Funding
The authors declare financial support was received for the research, authorship, and/or publication of this article. This research was funded by General projects of the National Social Science Foundation of China, grant number 23BJY196.
Conflict of interest
The authors declare that the research was conducted in the absence of any commercial or financial relationships that could be construed as a potential conflict of interest.
Publisher’s note
All claims expressed in this article are solely those of the authors and do not necessarily represent those of their affiliated organizations, or those of the publisher, the editors and the reviewers. Any product that may be evaluated in this article, or claim that may be made by its manufacturer, is not guaranteed or endorsed by the publisher.
References
Asongu, S. A., Le, R. S., and Biekpe, N. (2017). Environmental degradation, ICT and inclusive development in Sub-Saharan Africa. Energ Policy 111, 353–361. doi:10.1016/j.enpol.2017.09.049
Azam, A., Ateeq, M., Shafique, M., Rafiq, M., and Yuan, J. (2023b). Primary energy consumption-growth nexus: the role of natural resources, quality of government, and fixed capital formation. Energy 263, 125570. doi:10.1016/j.energy.2022.125570
Azam, A., Rafiq, M., Shafique, M., and Yuan, J. (2022). Mitigating carbon emissions in China: the role of clean energy, technological innovation, and political-institutional quality. Front. Environ. Sci. 10, 814439. doi:10.3389/fenvs.2022.814439
Azam, A., Shafique, M., Rafiq, M., and Ateeq, M. (2023a). Moving toward sustainable agriculture: the nexus between clean energy, ICT, human capital and environmental degradation under SDG policies in European countries. Eenergy Strateg. Rev. 50, 101252. doi:10.1016/j.esr.2023.101252
Bai, T., Qi, Y., Li, Z., and Xu, D. (2023). Digital economy, industrial transformation and upgrading, and spatial transfer of carbon emissions: the paths for low-carbon transformation of Chinese cities. J. Environ. Manage. 344, 118528. doi:10.1016/j.jenvman.2023.118528
Bukht, R., and Heeks, R. (2017). Defining, conceptualising and measuring the digital economy. https://papers.ssrn.com/sol3/papers.cfm?abstract_id=3431732.
Cai, B., Liang, S., Zhou, J., Wang, J., Cao, L., Qu, S., et al. (2018). China high resolution emission database (CHRED) with point emission sources, gridded emission data, and supplementary socioeconomic data. Resour. Conserv. Recy 129, 232–239. doi:10.1016/j.resconrec.2017.10.036
Cai, L., Luo, J., Wang, M., Guo, J., Duan, J., Li, J., et al. (2023). Pathways for municipalities to achieve carbon emission peak and carbon neutrality: a study based on the LEAP model. Energy 262, 125435. doi:10.1016/j.energy.2022.125435
Certomà, C. (2022). Future scenarios of Digital Social Innovation in urban governance. A collective discussion on the socio-political implications in Ghent. Cities 122, 103542. doi:10.1016/j.cities.2021.103542
Chai, J., Tian, L., and Jia, R. (2023). New energy demonstration city, spatial spillover and carbon emission efficiency: evidence from China's quasi-natural experiment. Energ Policy 173, 113389. doi:10.1016/j.enpol.2022.113389
Chen, C., Ye, F., Xiao, H., Xie, W., Liu, B., and Wang, L. (2023a). The digital economy, spatial spillovers and forestry green total factor productivity. J. Clean. Prod. 405, 136890. doi:10.1016/j.jclepro.2023.136890
Chen, D., Hu, W., Li, Y., Zhang, C., Lu, X., and Cheng, H. (2023b). Exploring the temporal and spatial effects of city size on regional economic integration: evidence from the Yangtze River Economic Belt in China. Land use Policy 132, 106770. doi:10.1016/j.landusepol.2023.106770
Chen, L., Lu, Y., Meng, Y., and Zhao, W. (2023c). Research on the nexus between the digital economy and carbon emissions-Evidence at China's province level. J. Clean. Prod. 413, 137484. doi:10.1016/j.jclepro.2023.137484
Cheng, Y., Zhang, Y., Wang, J., and Jiang, J. (2023). The impact of the urban digital economy on China's carbon intensity: spatial spillover and mediating effect. Resour. Resour. Conserv. Recycl. 189, 106762. doi:10.1016/j.resconrec.2022.106762
Eurostat (2017). Digital economy and society in the EU——a browse through our online world in. https://ec.europa.eu/eurostat/cache/infographs/ict_2017/ (Accessed June 16, 2017).
Fan, G., Wang, X. L., and Ma, G. R. (2011). Contribution of marketization to China's economic growth. Econ. Res. J. 9, 4–16.
Ferreira, J. J., Lopes, J. M., Gomes, S., and Rammal, H. G. (2023). Industry 4.0 implementation: environmental and social sustainability in manufacturing multinational enterprises. J. Clean. Prod. 404, 136841. doi:10.1016/j.jclepro.2023.136841
Grigorescu, A., Pelinescu, E., Ion, A. E., and Dutcas, M. F. (2021). Human capital in digital economy: an empirical analysis of Central and Eastern European Countries from the European Union. Sustainability 13, 2020. doi:10.3390/su13042020
Han, P., and Li, J. (2022). “Measurement and comparison of digital economy development of cities in China. C,” in Business Intelligence and Information Technology: Proceedings of the International Conference on Business Intelligence and Information Technology BIIT 2021, Harbin, China, December, 2021. doi:10.1007/978-3-030-92632-8_6
ITU (2022). Measuring the information society report. Available online: https://www.itu.int/en/ITU-D/Statistics/Pages/publications/mis2017.aspx (Accessed on August 8, 2022).
Jiang, H., Chen, Z., Liang, Y., Zhao, W., Liu, D., and Chen, Z. (2023). The impact of industrial structure upgrading and digital economy integration on China’s urban carbon emissions. Mod. Manage 11, 1231855. doi:10.3389/fevo.2023.1231855
Jing, Q. N., Hou, H. M., Bai, H. T., and Xu, H. (2019). A top-bottom estimation method for city-level energy-related CO2 emissions. China Environ. Sci. 39, 420–427. doi:10.3389/fevo.2023.1231855
Judd, C. M., and Kenny, D. A. (1981). Process analysis: estimating mediation in treatment evaluations. Eval. Rev. 5, 602–619. doi:10.1177/0193841X8100500502
Kloppenburg, S., Gupta, A., Kruk, S. R., Makris, S., Bergsvik, R., Korenhof, P., et al. (2022). Scrutinizing environmental governance in a digital age: new ways of seeing, participating, and intervening. One Earth 5, 232–241. doi:10.1016/j.oneear.2022.02.004
Lai, Y. F., Ye, L. T., Xie, P. J., and Ma, X. R. (2022). The coupling coordination of regional science and technology innovation and digital economy. Sci. Technol. Prog. Policy 39, 31–41. doi:10.6049/kjjbydc.2021120733
Li, Z., and Wang, J. (2022). The dynamic impact of digital economy on carbon emission reduction: evidence city-level empirical data in China. J. Clean. Prod. 351, 131570. doi:10.1016/j.jclepro.2022.131570
Lin, B., and Huang, C. (2023). How will promoting the digital economy affect electricity intensity? Energ Policy 173, 113341. doi:10.1016/j.enpol.2022.113341
Liu, Z., Sun, T., Yu, Y., Ke, P., Deng, Z., Lu, C., et al. (2022). Near-real-time carbon emission accounting technology toward carbon neutrality. Engineering 14, 44–51. doi:10.1016/j.eng.2021.12.019
Ma, Q., Tariq, M., Mahmood, H., and Khan, Z. (2022). The nexus between digital economy and carbon dioxide emissions in China: the moderating role of investments in research and development. Technol. Soc. 68, 101910. doi:10.1016/j.techsoc.2022.101910
National Bureau of Statistics (2022). Energy statistical reporting system. Available online: http://www.stats.gov.cn/tjsj/tjzd/gjtjzd/202103/t20210316_1814943.html (Accessed on May 6, 2022).
Niu, X., Ma, Z., Ma, W., Yang, J., and Mao, T. (2024). The spatial spillover effects and equity of carbon emissions of digital economy in China. J. Clean. Prod. 434, 139885. doi:10.1016/j.jclepro.2023.139885
Nulman, E., and Özkula, S. M. (2016). Environmental nongovernmental organizations’ digital media practices toward environmental sustainability and implications for informational governance. Curr. Opin. Environ. Sustain 18, 10–16. doi:10.1016/j.cosust.2015.04.004
OECD (2018). Toolkit for measuring the digital economy. Available online: https://pdfslide.net/documents/toolkit-for-measuring-the-digital-economy.html?page=1 (Accessed on February 19, 2021).
Ozman, M., and Gossart, C. (2018). Digital social innovation: exploring an emerging field. https://papers.ssrn.com/sol3/papers.cfm?abstract_id=3434363.
Pan, X., Wang, Y., Tian, M., Feng, S., and Ai, B. (2023). Spatio-temporal impulse effect of foreign direct investment on intra-and inter-regional carbon emissions. Energy 262, 125438. doi:10.1016/j.energy.2022.125438
Pan, X. Y., Shen, Z. Y., and Song, M. L. (2023). Enhancing green technology innovation through enterprise environmental governance: a life cycle perspective with moderator analysis of dynamic innovation capability. Energy Policy 182, 113773.
Park, W. G. (1995). International R&D spillovers and OECD economic growth. Econ. Inq. 33, 571–591. doi:10.1111/J.1465-7295.1995.TB01882.X
Qi, Y. D., and Xiao, X. (2020). Transformation of enterprise management in the era of digital economy. Manag. World 36, 135–152+20.
Shahbaz, M., Wang, J., Dong, K., and Zhao, J. (2022). The impact of digital economy on energy transition across the globe: the mediating role of government governance. Renew. Sust. Energ Rev. 166, 112620. doi:10.1016/j.rser.2022.112620
Shao, S., Yang, L. L., and Huang, T. (2013). Theoretical model and experience from China of energy rebound effect. Econ. Res. J. 2, 96–109.
Shao, S., Zhang, K., and Dou, J. M. (2019). Effects of economic agglomeration on energy saving and emission reduction: theory and empirical evidence from China. Manage World 1, 36–60.
Shao, S., Zhang, K., and Dou, J. M. (2019). Effects of economic agglomeration on energy saving and emission reduction: theory and empirical evidence from China. Manag. World 1, 36–60. doi:10.19744/j.cnki.11-1235/f.2019.0005
Song, M., Mangla, S. K., Wang, J., Zhao, J., and An, J. (2022). Asymmetric information, “coal-to-gas” transition and coal reduction potential: an analysis using the nonparametric production frontier method. Energ Econ. 114, 106311. doi:10.1016/j.eneco.2022.106311
Tapscott, (1996). The digital economy: rethinking promise and peril in the age of networked intelligence. J. Acad. Libr. 22, 397. doi:10.5860/choice.33-5199
Thierer, A., and Castillo, (2015). A. Projecting the growth and economic impact of the internet of things. Fairfax, Virginia: George Mason University.
Tong, X. (2020). The spatiotemporal evolution pattern and influential factor of regional carbon emission convergence in China. Adv. Meteorol. 2020, 1–10. doi:10.1155/2020/4361570
UNCTAD (2021). Manual for the production of statistics on the digital economy. Available online: https://unctad.org/publication/manual-production-statistics-digital-economy-2020 (Accessed on April 29, 2021).
Wang, F. X., Han, Y., Crabbe, M. J. C., and Yue, X. G. (2020). Fiscal expenditures on science and technology and environmental pollution: evidence from China. Int. J. Environ. 17, 8761. doi:10.3390/ijerph17238761
Wang, H., Li, Y., Lin, W., and Wei, W. (2023). How does digital technology promote carbon emission reduction? Empirical evidence based on e-commerce pilot city policy in China. J. Environ. Manage 325, 116524. doi:10.1016/j.jenvman.2022.116524
Wang, J., Dong, K., Dong, X., and Taghizadeh-Hesary, F. (2022). Assessing the digital economy and its carbon-mitigation effects: the case of China. Energ Econ. 113, 106198. doi:10.1016/j.eneco.2022.106198
Wang, J., and Guo, D. (2023). Siphon and radiation effects of ICT agglomeration on green total factor productivity: evidence from a spatial Durbin model. Energ Econ. 126, 106953. doi:10.1016/j.eneco.2023.106953
Wang, W., He, Y., Lei, Y., Gao, W., Li, Y., Lan, H., et al. (2023). Digital economy sectors are key CO2 transmission centers in the economic system. J. Clean. Prod. 407, 136873. doi:10.1016/j.jclepro.2023.136873
Williams, L. D. (2021). Concepts of digital economy and industry 4.0 in intelligent and information systems. IJIN 2, 122–129. doi:10.1016/j.ijin.2021.09.002
Xiang, Y., Cui, H., and Bi, Y. (2023). The impact and channel effects of banking competition and government intervention on carbon emissions: evidence from China. Energ Policy 175, 113476. doi:10.1016/j.enpol.2023.113476
Xie, B., Liu, R., and Dwivedi, R. (2024). Digital economy, structural deviation, and regional carbon emissions. J. Clean. Prod. 434, 139890. doi:10.1016/j.jclepro.2023.139890
Xu, J., Wang, J., Li, R., and Yang, X. (2023). Spatio-temporal effects of urbanization on CO2 emissions: evidences from 268 Chinese cities. Energ Policy 117, 113569. doi:10.1016/j.enpol.2023.113569
Yang, J., Li, X., and Huang, S. (2020). Impacts on environmental quality and required environmental regulation adjustments: a perspective of directed technical change driven by big data. J. Clean. Prod. 275, 124126. doi:10.1016/j.jclepro.2020.124126
Yang, X., Wu, H., Ren, S., Ran, Q., and Zhang, J. (2021). Does the development of the internet contribute to air pollution control in China? Mechanism discussion and empirical test. Struct. Chang. Econ. Dyn. 56, 207–224. doi:10.1016/j.strueco.2020.12.001
Yi, M., Liu, Y., Sheng, M. S., and Wen, L. (2022). Effects of digital economy on carbon emission reduction: new evidence from China. Energ Policy 171, 113271. doi:10.1016/j.enpol.2022.113271
Zahoor, N., Christofi, M., Nwoba, A. C., Donbesuur, F., and Miri, D. (2022). Operational effectiveness in post-pandemic times: examining the roles of digital technologies, talent management and employee engagement in manufacturing SMEs. Prod. Plan. Control, 1–14. doi:10.1080/09537287.2022.2147863
Zhang, W., Liu, X., Wang, D., and Zhou, J. (2022). Digital economy and carbon emission performance: evidence at China's city level. Energ Policy 165, 112927. doi:10.1016/j.enpol.2022.112927
Zhao, C., and Wang, B. (2022). How does new-type urbanization affect air pollution? Empirical evidence based on spatial spillover effect and spatial Durbin model. Environ. Int. 165, 107304. doi:10.1016/j.envint.2022.107304
Zhao, S., Peng, D., Wen, H., and Wu, Y. (2023). Nonlinear and spatial spillover effects of the digital economy on green total factor energy efficiency: evidence from 281 cities in China. Environ. Sci. Pollut. Res. 30, 81896–81916. doi:10.1007/s11356-022-22694-6
Keywords: digital economy, spatial matrix, mediating effect, spatial spillover, carbon emissions
Citation: Hou J and Fu Y (2024) Study on the spillover effect of digital economy development on CO2 emissions. Front. Energy Res. 12:1358093. doi: 10.3389/fenrg.2024.1358093
Received: 19 December 2023; Accepted: 22 January 2024;
Published: 05 February 2024.
Edited by:
Shenbo Yang, Beijing University of Technology, ChinaReviewed by:
Anam Azam, Fraunhofer Institute for Systems and Innovation Research ISI (FHG), GermanyJuntao Du, Anhui University of Finance and Economics, China
Pin Li, Shanghai Jiao Tong University, China
Pengsheng Li, Business School of Dalian University of Technology, China
Copyright © 2024 Hou and Fu. This is an open-access article distributed under the terms of the Creative Commons Attribution License (CC BY). The use, distribution or reproduction in other forums is permitted, provided the original author(s) and the copyright owner(s) are credited and that the original publication in this journal is cited, in accordance with accepted academic practice. No use, distribution or reproduction is permitted which does not comply with these terms.
*Correspondence: Jianchao Hou, aGRzaHVveXVAMTI2LmNvbQ==