 Michel Tawil1*
 Eloisa Salina Borello1
 Sergio Bocchini1
 Candido Fabrizio Pirri1,2
 Francesca Verga1Christian Coti3Matteo Scapolo3Donatella Barbieri3Dario Viberti1
- 1Department of Environment, Land and Infrastructure Engineering, Politecnico di Torino, Torino, Italy
- 2Center for Sustainable Future Technologies, Fondazione Istituto Italiano di Tecnologia, Torino, Italy
- 3Snam-Stogit, Crema, Italy
Concerning the emerging power-to-gas technologies, which are considered the most promising technology for seasonal renewable energy storage, Underground Hydrogen Storage (UHS) has gained attention in the last few years. For safe and efficient storage, possible hydrogen losses due to dissolution into the aquifer must be estimated accurately. Due to safety concerns, experimental measurements of hydrogen solubility in brine at reservoir conditions are limited. In this study, a PVT cell is used to characterize the solubility of hydrogen and its mixtures with methane in saline water/brine. The experiments were carried out at 45, 50, and 55°C and from 1 bar up to 500 bar, mimicking a significant range of possible reservoir conditions. Two brine samples representative of two different reservoirs were tested. Two mixtures of methane and hydrogen (10 mol% H2 and 50 mol% H2, respectively) were considered, along with pure hydrogen, to account for the presence of methane in the primary phase of hydrogen storage in a depleted gas reservoir. In the current paper, a comparison of the experimental results with literature models is provided. At the experiment conditions, the impact of the differences in the composition of the two analyzed brines as well as the impact of the analyzed range of temperatures was not significant. Conversely, a non-negligible variation in terms of the slope of the solubility curve was observed as a function of the gas mixture composition: the curve increased more steeply as the percentage of hydrogen reduced.
1 Introduction
Fossil fuels are the main contributor to Green House Gas (GHG) emissions in different industrial sectors (Kumar et al., 2020). The global transition towards a sustainable future has necessitated the exploration of alternative energy sources and storage solutions. There are several types of hydrogen, depending on their production sources (Incer-Valverde et al., 2023):
• Green hydrogen by electrolysis through renewables
• Grey hydrogen by Steam Methane Reforming (SMR) without the use of Carbon Capture Utilization and Storage (CCUS)
• Blue hydrogen by SMR or coal gasification, including Carbon Capture Utilization and Storage.
• Turquoise hydrogen is produced from the pyrolysis of methane.
Currently, the typical way of producing blue and grey is through natural gas reforming (i.e., steam methane reforming; SMR) (Amid et al., 2016).
In recent years, energy demand has been increasing continuously. Hydrogen storage in underground reservoirs has gained considerable attention as an alternative and viable solution to minimize the gap between energy supply and demand (Chapman et al., 2019; Benetatos et al., 2021; Zivar et al., 2021; Muhammed et al., 2022; Raza et al., 2022; Ugarte and Salehi, 2022; Buscheck et al., 2024; Salina Borello et al., 2024). Underground reservoirs offer several advantages, including large storage capacities (Carden and Paterson, 1979) and long-term stability. Moreover, the geological formations that have historically served as repositories for oil, gas, and other hydrocarbons may also prove suitable for hydrogen storage (Tarkowski et al., 2021). Hydrogen produced from electrolysis can be stored in saline aquifers, porous formations, and oil and gas-depleted reservoirs (Bai et al., 2014; Pfeiffer and Bauer, 2015; Amid et al., 2016; Sainz Garcia et al., 2017; Ansari et al., 2022). Moreover, hydrogen has high reactivity and could participate in microbial processes (Reitenbach et al., 2015; Hagemann et al., 2016; Heinemann et al., 2021). Possible hydrogen losses due to dissolution into the aquifer are of great importance and therefore must be estimated accurately. Due to its extreme flammability and corrosion ability, experimental measurements of hydrogen solubility in brine are limited. Therefore, modelling is used to estimate hydrogen solubility in pure and saline water. Modeling consists of using an Equation of state (EoS) based on experimental data. (Li et al., 2018; Lopez-Lazaro et al., 2019; Rahbari et al., 2019; Chabab et al., 2020).
Few past studies have performed experiments to estimate the H2 solubility in water above 100 bar (Ipatiew et al., 1932; Wiebe and Gaddy, 1934; Pray et al., 1952; Zoss, 1952; Schroder, 1973; Gillespie and Wilson, 1980; Choudhary et al., 1982; Dohrn and Brunner, 1986; Kling and Maurer, 1991; Chabab et al., 2020). All the above-mentioned studies focus on pure hydrogen.
The scope of this study is the quantitative assessment of hydrogen that can dissolve in reservoir water during underground storage in depleted gas reservoirs, currently used as methane storage fields. This information is relevant for the assessment of possible storage losses in formation water and for the quantification of hydrogen available for participation in the microbial process. For this reason, the current work aims to provide an experimental estimation of the volume of hydrogen that might dissolve in the formation water at reservoir conditions (pressure, temperature, and salinity). Assuming that the hydrogen storage site has been used for the storage of methane, the presence of a mixture of methane and hydrogen is expected in the primary phase of hydrogen storage.
In this study, a PVT cell usually used in the oil and gas industry, is used to estimate the solubility of hydrogen and its mixtures with methane in saline water. The experiments were carried out at 45, 50, and 55°C and from 1 bar up to 500 bar, mimicking a significant range of possible reservoir conditions. In addition, two brine samples representative of two different reservoirs were considered. Two mixtures of methane and hydrogen (10 mol% H2 and 50 mol% H2, respectively) are considered along with pure hydrogen.
A comparison with available literature experimental data of pure hydrogen solubility in fresh water at 50°C (Wiebe and Gaddy, 1934; Kling and Maurer, 1991; Torin-Ollarves and Trusler, 2021) is provided along with the comparison with a literature correlation developed for pure hydrogen (Torin-Ollarves and Trusler, 2021) that allows accounting for brine salinity and different temperatures. The model by Torin-Ollarves and Trusler (2021) was constructed according to several experimental results from the literature (Wiebe et al., 1932; Wiebe and Gaddy, 1934; Crozier and Yamamoto, 1974; Gordon et al., 1977; Choudhary et al., 1982; Kling and Maurer, 1991; Chabab et al., 2020; Torin-Ollarves and Trusler, 2021).
2 Materials and methods
2.1 Background insights
Solubility of gas mixtures in brine is defined as the upper limit concentration of solute in a given amount of solvent at equilibrium (Petrucci et al., 2017). The solution gas-water ratio (
Eq. 1 is dimensionless; it can be expressed in molality form (mol of H2 per kg of water) dividing by factor
The amount of gas dissolved in the water is primarily a function of pressure and temperature. The concentration of a real gas in an aqueous solution can be calculated from Henry’s law (Henry, 1803) corrected for non-ideal behavior as follows (De Lucia et al., 2015):
where
As the pressure is decreased from the initial reservoir pressure (
Salinity of the liquid solvent may also have an effect: the solubility of gases in water is usually decreased by the addition of electrolytes, as described by the Sechenov equation (Hermann et al., 1995)
where
Thus, Eq. 2 can be extended as (Torin-Ollarves and Trusler, 2021):
According to Hala et al. (1967) and Prausnitz et al., 1986), the fugacity coefficient of a pure gas can be related to the compressibility factor (Z) as follows:
We used the Spycher and Reed (1988) EoS for pure hydrogen, valid in the range 25°C–600°C and up to 3,000 bar, which proved to be very accurate (De Lucia et al., 2015):
where
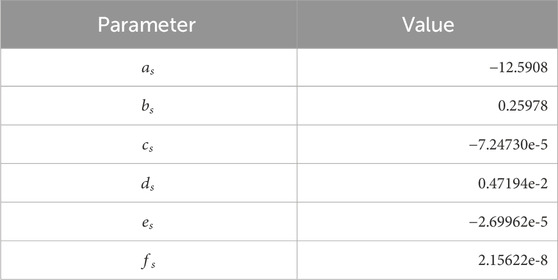
Table 1. Parameters in Eq. 6.
The vapor pressure in ordinary water substance at saturation can be estimated in function of temperature from (Wagner and Pruess, 1993):
where
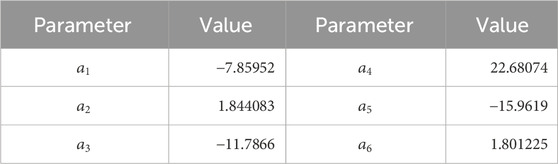
Table 2. Parameters in Eq. 7.
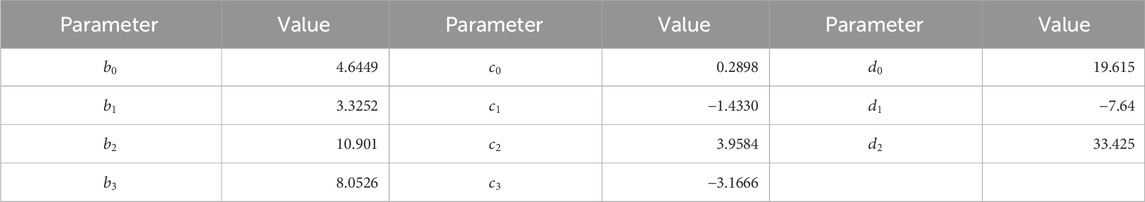
For a solution of pure hydrogen in pure water, Henry’s constant (
where
In this work, the bubble point and the curve of
2.2 Maximum dissolution assessment
The expansion experiment is similar to the conventional Differential Liberation Expansion (DLE) test typically performed on undersaturated oil samples to estimate PVT properties including the solution gas-oil ratio (Rs) at reservoir temperature and at different pressures representative of a depletion process starting from initial reservoir pressure. However, in the reservoir oil case the solution gas-oil ratio is measured directly from the experiment, while in our problem, the maximum amount of gas that can be dissolved in water had to be evaluated through preliminary dissolution experiments with different brine to H2 ratios.
Having a liquid volume fixed at 100 mlsc (the maximum available volume in the cell is 300 mL), an injection pressure greater than 1 atm was needed to manage Rsw values greater than 2. A summary is reported in Table 4, suggesting a volume ratio of 3.65 H2 in brine for complete dissolution at the pressure and temperature of interest, representative of a storage reservoir.

Table 4. Summary of the series of solubility experiments of different volume ratios at 50°C.
2.3 Experimental SetUp
The experimental set-up is composed by (Figure 1):
• PVT cell
• mass flow meter
• gasometer
• dry ice-cooling system
• volumetric pump
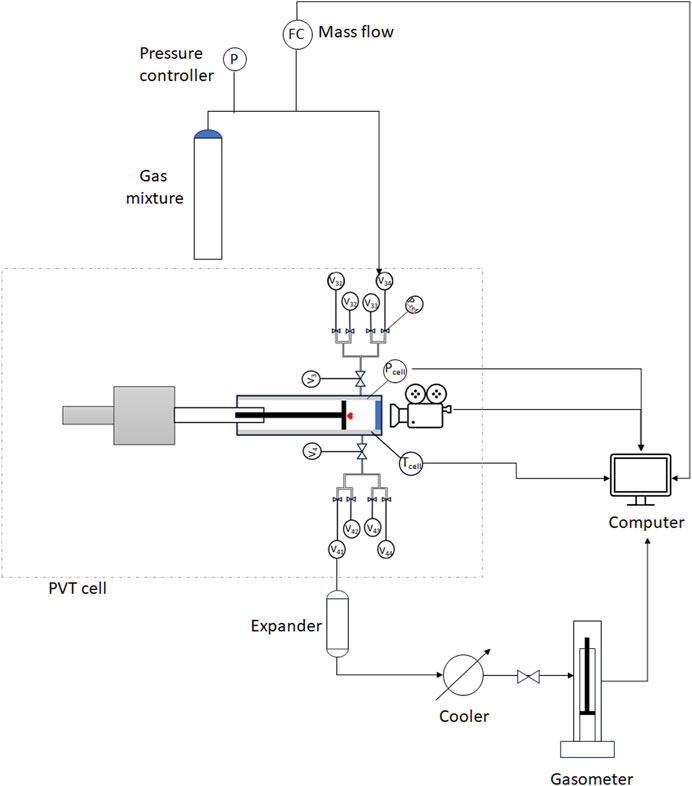
Figure 1. Schematic of the experimental setup.
A volumetric pump was used in the calibration phase, before the tests, to accurately measure the volume of liquid/gas entering the cell and compare it with the one estimated using the PVT cell software.
The PVT cell (Figure 2A) is an instrument for the study of thermodynamic properties and phase behavior of liquids and gases. It is composed of a fluid mixer mounted on the piston (depicted in red in Figure 1), an accurate pressure transducer, and an electric heater for temperature control. A digital camera system monitors the liquid/gas interface through a sapphire window (depicted in blue in Figure 1), on top of the cell visual head. The parts in contact with the fluids are made of Hastelloy to be safely used with hydrogen. Specifications and accuracy details of the instrument are listed in Table 5.
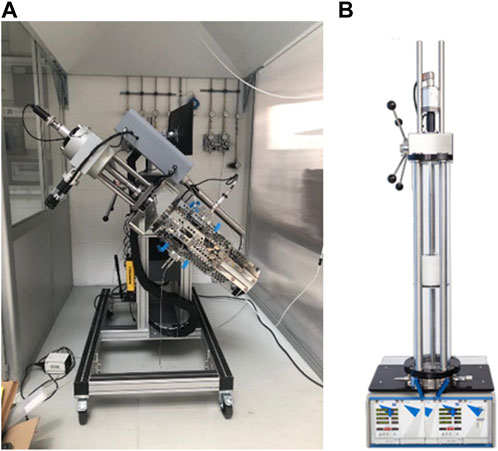
Figure 2. (A) PVT cell; (B) gasometer.
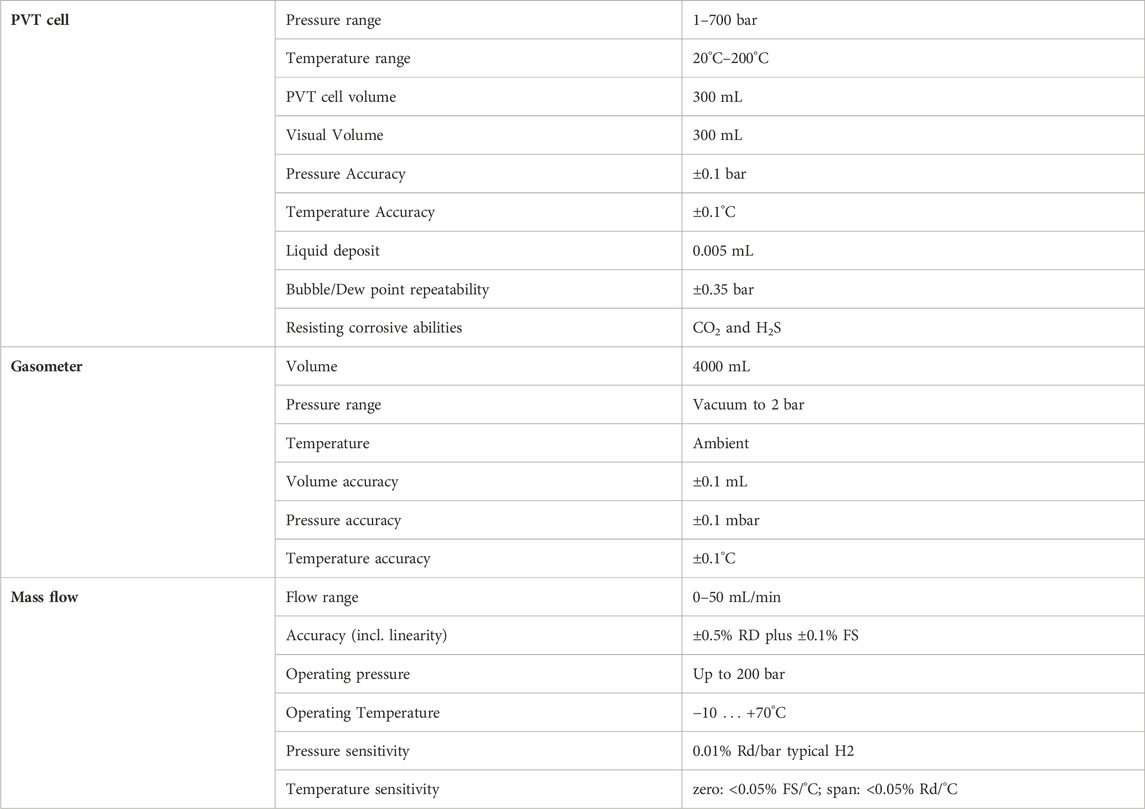
Table 5. Instruments specifications and accuracy.
At the inlet, the flow of the injected gas is monitored using a mass flow meter, specific for hydrogen and its mixtures.
At the outlet, the gas liberated at each pressure step is cooled using a dry ice cooling system along the outlet line and it is then sent to a gasometer (Figure 2B), where it expands and cools to room temperature. The gasometer specifications are reported in Table 5.
2.4 Test procedure
Before running the tests, the PVT cell was calibrated within the desired working pressure range (1 bar–500 bar) and temperature range (20°C–100°C) to increase its accuracy on the volume measurements.
The test procedure is the following:
1) Water injection: Fill the cell with 100 mL of brine
2) Gas injection:
a) Flush the connection tubes with the working gas to remove the air and avoid any contact between the gas mixture and the air at high pressure and temperature.
b) Set the inlet injection pressure to 8 bar.
c) Move the cell from 100 mL to 150 mL and simultaneously record the flow injected into the cell with the Mass flow meter to inject exactly 50 mL.
e) Verify the volume of the liquid (
3) Pressure and temperature setting:
f) Compress the cell at ambient temperature to reach the complete dissolution (300–500 bar depending on the gas mixture and working temperature). A maximum pressure ramp limit equal to 1 bar/s is imposed to avoid sapphire rupture.
g) Increase the temperature to the desired value (T = 45C°, 50°C, or 55°C). The temperature is not changed during the compression to avoid exceeding the maximum pressure ramp limit.
4) Mixing: start the stirring. An hour or two is needed to solubilize the gas into the brine solution, depending on the type of gas mixture. This process is associated with a pressure drop, which is compensated by piston movement to maintain the pressure constant.
5) Solubility test: expand the solution in pressure steps, until the cumulative released gas volume matches the injected value or the atmospheric pressure is reached:
h) Expansion: induce a pressure drop by expansion (30 bar, less near the bubble point)
i) Gas separation: If one or more bubbles are observable during the expansion step (i.e., the bubble point is reached), turn on the stirring to liberate the dissolved gas. The gas leaving the brine solution causes a slight pressure increase. The stirring is kept on until the pressure is stabilized.
j) Gas measurement: measure the released gas volume with the gasometer.
i) To avoid a high pressure drop into the cell when sending the gas bubble to the gasometer, the pressure in the cell is maintained by rapid compression. In all the experiments, the pressure drop during the release of the gas was around 2 bar.
ii) Gas expansion is allowed within the tubes between the cell and the gasometer so that the gas entering the gasometer is at atmospheric pressure.
iii) The gas leaving the cell is cooled along the line between the PVT cell and the gasometer; possible aqueous vapor in the gas is condensed using dry ice to avoid the uncertainty of the measurement in the gasometer and to prevent its corrosion.
2.4.1 Samples and testing conditions
The presence of a mixture of methane and hydrogen is expected in the primary phase of hydrogen storage in a depleted gas reservoir. Thus, mixtures of methane and hydrogen were considered along with pure hydrogen. Solubility tests were carried out for four different gas samples:
• 10 mol% H2 and 90 mol% CH4.
• 50 mol% H2 and 50 mol% CH4.
• pure hydrogen (100 mol% H2).
Three temperature values were considered, representative of the reservoir conditions: 45°C, 50°C, and 55°C. A working pressure range of 1–500 bar was adopted.
The solubility tests were conducted each with two synthetic brine solutions, representative of real reservoir brine in place. Composition and pH details are summarized in Table 6. The complete set of tests is summarized in Table 7.

Table 6. Concentration of brine 1 and brine 2.

Table 7. Summary of the performed solubility tests.
3 Results
In the experiments carried out with pure hydrogen all the gas injected was completely dissolved at 300 bar during compression and stirring. Complete dissolution was not achievable without stirring (several minutes of stirring were required). During decompression, the first bubble of the gas appeared at 210 bar. The first step at which the gas was released from the PVT cell was around 185 bar (±2 bar due to the pressure drop created by the opening of the valves).
In the experiments carried with a gas mixture of 50 mol% methane and 50 mol% hydrogen, compressing to 300 bar and stirring was not enough to dissolve the gas into the brine. For the experiments at 45°C and 50°C, compressing to 350 bar and stirring for a longer amount of time was capable of dissolving the gas in the brines. For 55°C, a higher pressure (up to 500 bar) and higher stirring velocity were needed to dissolve the gas into B1 and B2. During decompression, the first bubble of the gas appeared at 210 bar. The first step at which the gas was released from the PVT cell was around 195 bar.
In the experiments with a gas mixture of 90 mol% methane and 10 mol% hydrogen, for all the temperatures, a pressure of 500 bar was needed, accompanied by stirring to completely dissolve the gas mixture. During the decompression phase, the first bubble of gas appeared at 220 bar for 45°C while at 230 for 50°C and 55°C. The first step at which the gas was released from the PVT cell was 10 bar below the bubble point for each experiment.
Experimental data are summarized in Table 8. The obtained isothermal solubility curves as a function of pressure are reported in Figure 3 and Figure 4 in the form of volume ratio and molar concentration, respectively. A comparison in terms of the slope of the linear part of the Rs curve is given in the form of boxplots in Figure 5. A comparison with literature results for the pure hydrogen case (Wiebe and Gaddy, 1934; Kling and Maurer, 1991; Torin-Ollarves and Trusler, 2021) is given in Figure 6.
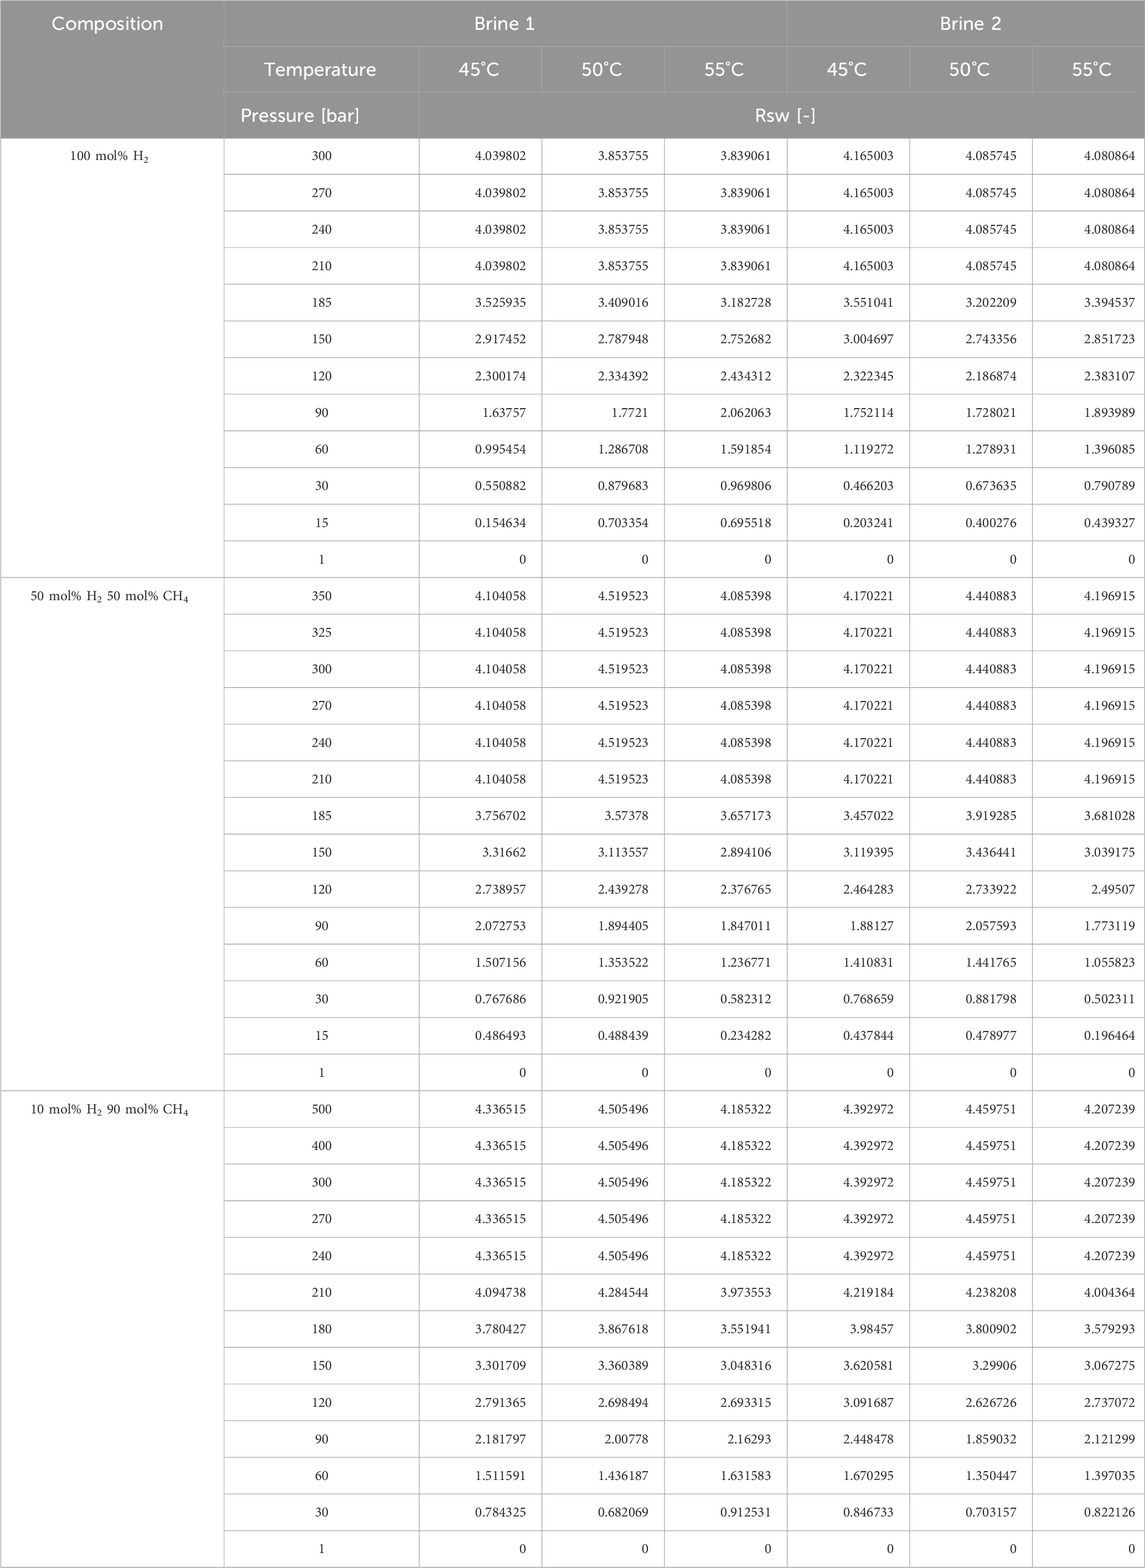
Table 8. Test results.
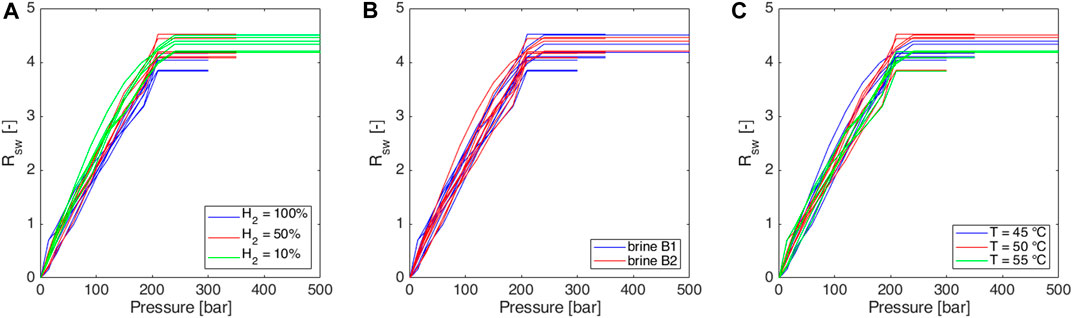
Figure 3. Experimentally obtained isothermal solubility curves, expressed in terms of solution gas water volume ratio (Rsw) as a function of pressure: sensitivity to (A) gas mixture, (B) brine salinity (see Table 6), and (C) temperature.
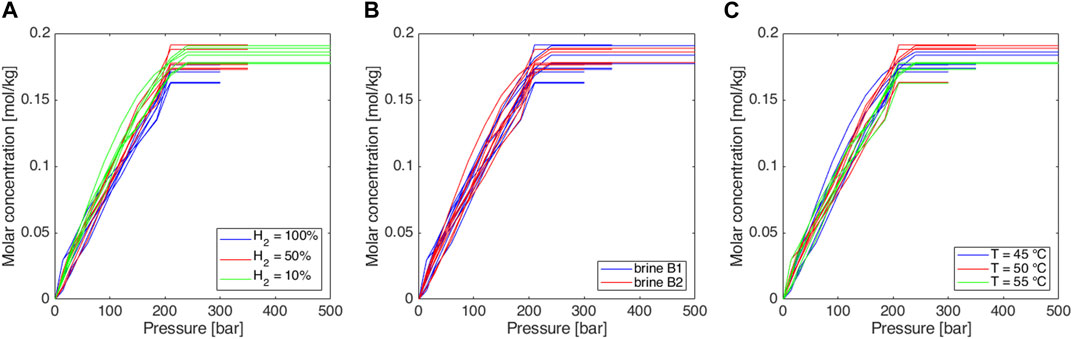
Figure 4. Experimentally obtained isothermal solubility curves, expressed in terms of the molar concentration of total gas as a function of pressure: sensitivity to (A) gas mixture, (B) brine salinity (see Table 6), and (C) temperature.
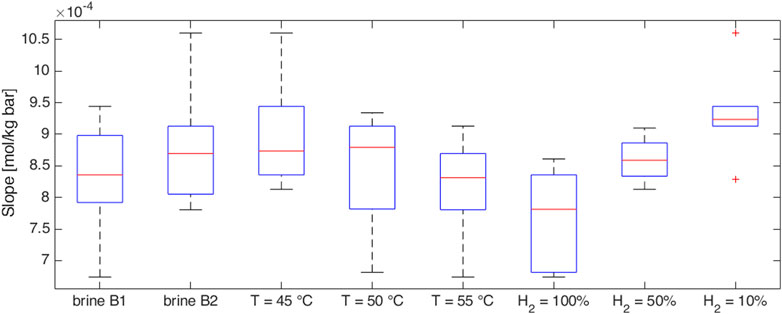
Figure 5. Sensitivity of the slope of the experimentally obtained isothermal solubility curves to brine salinity, temperature, and gas mixture.
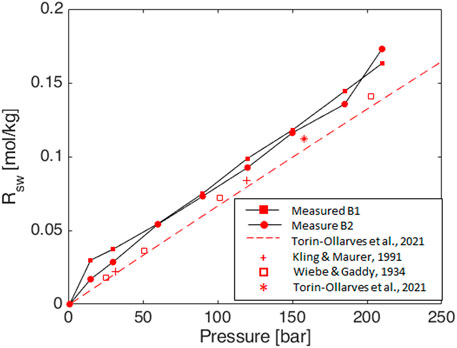
Figure 6. Experimental data of solubility curves for pure hydrogen in brine (salinity as in Table 6) at 50°C compared with literature values: model by Torin-Ollarves and Trusler 2021 at the same salinity (dashed lines); experimental data in pure water by Wiebe and Gaddy 1934 (squares), Kling and Maurer 1991 (crosses), and Torin-Ollarves and Trusler 2021 (asterisk).
In all cases maximum Rs value is about 4, as it is expected consequently to the injected gas volumes (Section 2.2); small differences observed in the reached maximum Rs values are probably related to uncertainties on the initial gas volume at standard conditions. The 50 mL of gas at injection conditions corresponds to slightly different volumes at standard conditions because the ambient temperature can vary, and the initial pressure setting is subject to a little uncertainty.
4 Discussion
In all the cases, very similar curves were obtained (Figures 3–5). Methane-hydrogen mixtures dissolve more easily in formation water (i.e., higher slopes were observed) when a low percentage of hydrogen is considered. The result is coherent with the technical literature since pure methane is known to be more soluble than pure hydrogen in water (Kaye and Laby, 1986). At the experiment conditions, the impact of the chemical composition of the two analyzed brines was not significant and the effect of temperature was extremely limited. As a consequence, the possible temperature changes over the years during storage operations should not have a significant effect on solubility phenomena.
The obtained values are comparable with literature experimental values for pure hydrogen in pure water (Wiebe and Gaddy, 1934; Kling and Maurer, 1991; Torin-Ollarves and Trusler, 2021) and correlations for pure hydrogen at the desired salinity (Torin-Ollarves and Trusler, 2021) (Figure 6). Some discrepancies can be recognized, but the associated uncertainty does not have an impact on the results for UHS purposes.
The obtained Rsw curves can be used to estimate the quantity of gas that dissolves in formation water during a storage cycle (a simplified analytical calculation is provided in the Appendix), thus allowing an estimate of the quantity of hydrogen available for possible participation in microbial processes. It is pointed out that in the absence of microbial activities, the gas quantity that dissolves as the pressure increases during the injection period is not lost. It is released as the pressure is gradually reduced during the withdrawal phase. Furthermore, it has to be pointed out that the volume of gas dissolving in the formation water is extremely limited.
The formation water in an underground gas reservoir is saturated with natural gases since the fluids are in equilibrium at the reservoir thermodynamic conditions. The amount of gas dissolved into the formation water is described, in typical reservoir simulation numerical models, adopting the Rsw vs. pressure curve. In conventional reservoir engineering and in conventional UGS, the composition of the gas is almost constant in time. In UHS, the composition of the reservoir fluid changes over time and should be characterized by an increasing percentage of hydrogen over the injection/withdrawal cycle and over the years. Similarly, the relative amount of hydrogen dissolved in the formation water will increase. It has to be pointed out that the process of solubility is reversible, i.e. the amount of gas dissolved during injection periods (when pressure increases) is not lost but liberates during the withdrawal periods.
The obtained experimental solubility results might represent a slight overestimation of dissolved gas at reservoir conditions due to the assisted stirring during compression. It is also important to point out that within the reservoir, the direct contact area between the gas and the brine is smaller compared to the PVT cell.
Data availability statement
The datasets presented in this study can be found in online repositories. The names of the repository/repositories and accession number(s) can be found below: https://github.com/REDD-PoliTO/Solubility-Experiments.
Author contributions
MT: Investigation, Methodology, Writing–original draft, Writing–review and editing. ESB: Formal Analysis, Software, Visualization, Writing–original draft, Writing–review and editing. SB: Writing–review and editing. CP: Funding acquisition, Project administration, Writing–review and editing. FV: Funding acquisition, Project administration, Resources, Writing–review and editing. CC: Funding acquisition, Project administration, Writing–review and editing. MS: Resources, Writing–review and editing. DB: Resources, Writing–review and editing. DV: Conceptualization, Methodology, Supervision, Writing–original draft, Writing–review and editing.
Funding
The author(s) declare that financial support was received for the research, authorship, and/or publication of this article. This research was funded by the company SNAM-Stogit. The funder was not involved in the study design, collection, analysis, interpretation of data, the writing of this article, or the decision to submit it for publication.
Acknowledgments
The authors would like to greatly acknowledge SNAM-Stogit for their support.
Conflict of interest
Authors CC, MS and DB were employed by company Snam-Stogit.
The remaining authors declare that the research was conducted in the absence of any commercial or financial relationships that could be construed as a potential conflict of interest.
Publisher’s note
All claims expressed in this article are solely those of the authors and do not necessarily represent those of their affiliated organizations, or those of the publisher, the editors and the reviewers. Any product that may be evaluated in this article, or claim that may be made by its manufacturer, is not guaranteed or endorsed by the publisher.
References
Amid, A., Mignard, D., and Wilkinson, M. (2016). Seasonal storage of hydrogen in a depleted natural gas reservoir. Int. J. Hydrogen Energy 41 (12), 5549–5558. doi:10.1016/j.ijhydene.2016.02.036
Ansari, S., Safaei-Farouji, M., Atashrouz, S., Abedi, A., Hemmati-Sarapardeh, A., and Mohaddespour, A. (2022). Prediction of hydrogen solubility in aqueous solutions: comparison of equations of state and advanced machine learning-metaheuristic approaches. Int. J. Hydrogen Energy 47 (89), 37724–37741. doi:10.1016/j.ijhydene.2022.08.288
Bai, M., Song, K., Sun, Y., He, M., Li, Y., and Sun, J. (2014). An overview of hydrogen underground storage technology and prospects in China. J. Petroleum Sci. Eng. 124, 132–136. doi:10.1016/j.petrol.2014.09.037
Benetatos, C., Bocchini, S., Carpignano, A., Chiodoni, A., Cocuzza, M., Deangeli, C., et al. (2021). How underground systems can contribute to meet the challenges of energy transition. GEAM, Pàtron Ed. S.r.l (163), 65–80. doi:10.19199/2021.163-164.1121-9041.065
Buscheck, T., Goodman, A., Lackey, G., De Toledo Camargo, J., Huerta, N., Haeri, F., et al. (2024). Underground storage of hydrogen and hydrogen/methane mixtures in porous reservoirs: influence of reservoir factors and engineering choices on deliverability and storage operations. Int. J. Hydrogen Energy 49, 1088–1107. doi:10.1016/j.ijhydene.2023.07.073
Carden, P., and Paterson, L. (1979). Physical, chemical and energy aspects of underground hydrogen storage. Int. J. Hydrogen Energy 4 (6), 559–569. doi:10.1016/0360-3199(79)90083-1
Chabab, S., Theveneau, P., Coquelet, C., Corvisier, J., and Paricaud, P. (2020). Measurements and predictive models of high-pressure H2 solubility in brine (H2O+ NaCl) for underground hydrogen storage application. Int. J. Hydrogen Energy 45 (56), 32206–32220. doi:10.1016/j.ijhydene.2020.08.192
Chapman, A., Itaoka, K., Hirose, K., Davidson, F. T., Nagasawa, K., Lloyd, A. C., et al. (2019). A review of four case studies assessing the potential for hydrogen penetration of the future energy system. Int. J. Hydrogen Energy 44 (13), 6371–6382. doi:10.1016/j.ijhydene.2019.01.168
Choudhary, V. R., Parande, M. G., and Brahme, P. H. (1982). Simple apparatus for measuring solubility of gases at high pressures. Ind. Eng. Chem. Fund. 21, 472–474. doi:10.1021/i100008a027
Crozier, T. E., and Yamamoto, S. (1974). Solubility of hydrogen in water, sea water, and sodium chloride solutions. J. Chem. Eng. Data 19, 242–244. doi:10.1021/je60062a007
De Lucia, M., Pilz, P., Liebscher, A., and Kühn, M. (2015). Measurements of H2 solubility in saline solutions under reservoir conditions: preliminary results from Project H2STORE. Energy Procedia 76, 487–494. ISSN 1876-6102. doi:10.1016/j.egypro.2015.07.892
Dohrn, R., and Brunner, G. (1986). Phase equilibria in ternary and quaternary systems of hydrogen, water and hydrocarbons at elevated temperatures and pressures. Fluid Phase Equilibria 29, 535–544. doi:10.1016/0378-3812(86)85052-X
Gillespie, P., and Wilson, G. (1980). GPA research report RR-41 gas processors association. Tulsa: OK.
Gordon, L. I., Cohen, Y., and Standley, D. R. (1977). The solubility of molecular hydrogen in seawater. Res 24, 937–941. doi:10.1016/0146-6291(77)90563-x
Hagemann, B., Rasoulzadeh, M., Panfilov, M., Ganzer, L., and Reitenbach, V. (2016). Hydrogenization of underground storage of natural gas: Impact of hydrogen on the hydrodynamic and bio-chemical behavior. Comput Geosci 20, 595–606. doi:10.1007/s10596-015-9515-6
Hala, E., Pick, J., Fried, V., and Vilim, O. (1967). Vapor-liquid equilibrium. (English trans. By G. Standart). Pergamon Press, 599. ISBN: 9781483160863.
Heinemann, N., Alcalde, J., Miocic, J. M., Hangx, S. J. T., Kallmeyer, J., Ostertag-Henning, C., et al. (2021). Enabling large-scale hydrogen storage in porous media – the scientific challenges. Energy and Environ. Sci. 14 (2), 853–864. doi:10.1039/D0EE03536J
Henry, W. (1803). Experiments on the quantity of gases absorbed by water, at different temperatures, and under different pressures. Phil. Trans. R. Soc. Lond. 93, 29–43. doi:10.1098/rstl.1803.0004
Hermann, C., Dewes, I., and Schumpe, A. (1995). The estimation of gas solubilities in salt solutions. Chem. Eng. Sci. 50 (Issue 10), 1673–1675. ISSN 0009-2509. doi:10.1016/0009-2509(95)00031-Y
Incer-Valverde, J., Korayem, A., Tsatsaronis, G., and Morosuk, T. (2023). “Colors” of hydrogen: definitions and carbon intensity. Energy Convers. Manag. 291, 117294. doi:10.1016/j.enconman.2023.117294
Ipatiew, W. W., Drushina-Artemowitsch, S. I., and Tichomirow, W. I. (1932). Löslichkeit des Wasserstoffs in Wasser unter Druck. Berichte Der Deutschen Chemischen Gesellschaft (A B Ser.) 65 (4), 568–571. doi:10.1002/cber.19320650412
Kaye, G. W. C., and Laby, T. H. (1986). Tables of physical and chemical constants. 15th ed. NY: Longman, 219.
Kling, G., and Maurer, G. (1991). The solubility of hydrogen in water and in 2-aminoethanol at temperatures between 323 K and 423 K and pressures up to 16 MPa. J. Chem. Thermodyn. 23, 531–541. doi:10.1016/s0021-9614(05)80095-3
Kumar, S., Foroozesh, J., Edlmann, K., Rezk, M. G., and Lim, C. Y. (2020). A comprehensive review of value-added CO2 sequestration in subsurface saline aquifers. J. Nat. Gas Sci. Eng. 81, 103437. doi:10.1016/j.jngse.2020.103437
Li, D., Beyer, C., and Bauer, S. (2018). A unified phase equilibrium model for hydrogen solubility and solution density. Int. J. Hydrogen Energy 43 (1), 512–529. doi:10.1016/j.ijhydene.2017.07.228
Lopez-Lazaro, C., Bachaud, P., Moretti, I., and Ferrando, N. (2019). Predicting the phase behavior of hydrogen in NaCl brines by molecular simulation for geological applications. BSGF - Earth Sci. Bull. 190, 7. doi:10.1051/bsgf/2019008
Muhammed, N. S., Haq, B., Al Shehri, D., Al-Ahmed, A., Rahman, M. M., and Zaman, E. (2022). A review on underground hydrogen storage: insight into geological sites, influencing factors and future outlook. Energy Rep. 8, 461–499. doi:10.1016/j.egyr.2021.12.002
Petrucci, R., Herring, F., Madura, J., and Bissonnette, C. (2017). General chemistry principles and modern applications. 11th ed. Toronto: Pearson Prentice Hall, 2016. ISBN 978-0-13-293128-1.
Pfeiffer, W. T., and Bauer, S. (2015). Subsurface porous media hydrogen storage – scenario development and simulation. Energy Procedia 76, 565–572. doi:10.1016/j.egypro.2015.07.872
Prausnitz, J. M., Lichtenthaler, R. N., and De Azevedo, E. G. (1986). Molecular thermodynamics of fluid-phase equilibria. 2nd ed. Prentice-Hall. ISBN: 978-0139777455.
Pray, H., Schweickert u, C. E., and Minnich, B. H. (1952). Solubility of hydrogen, oxygen, nitrogen, and helium in water at elevated temperatures. Ind. Eng. Chem. 44, 1146–1151. doi:10.1021/ie50509a058
Rahbari, A., Brenkman, J., Hens, R., Ramdin, M., Van Den Broeke, L. J. P., Schoon, R., et al. (2019). Solubility of water in hydrogen at high pressures: a molecular simulation study. J. Chem. Eng. Data 64 (9), 4103–4115. doi:10.1021/acs.jced.9b00513
Raza, A., Arif, M., Glatz, G., Mahmoud, M., Al Kobaisi, M., Alafnan, S., et al. (2022). A holistic overview of underground hydrogen storage: influencing factors, current understanding, and outlook. Fuel 330, 125636. doi:10.1016/j.fuel.2022.125636
Reitenbach, V., Ganzer, L., Albrecht, D., and Hagemann, B. (2015). Influence of added hydrogen on underground gas storage: a review of key issues. Environ Earth Sci. 73, 6927–6937. doi:10.1007/s12665-015-4176-2
Sainz-Garcia, A., Abarca, E., Rubi, V., and Grandia, F. (2017). Assessment of feasible strategies for seasonal underground hydrogen storage in a saline aquifer. Int. J. Hydrogen Energy 42 (26), 16657–16666. doi:10.1016/j.ijhydene.2017.05.076
Salina Borello, E., Bocchini, S., Chiodoni, A., Coti, C., Fontana, M., Panini, F., et al. (2024). Underground hydrogen storage safety: experimental study of hydrogen diffusion through caprocks. Energies 17, 394. doi:10.3390/en17020394
Schröder, W. (1973). Untersuchungen über die Temperaturabhängigkeit der Gaslöslichkeit in Wasser. Chem. Ing. Tech. 45 (9–10), 603–608. doi:10.1002/cite.330450908
Spycher, N., and Reed, M. (1988). Fugacity coefficients of H2, CO2, CH4, H2O and of H2O- CO2-CH4 mixtures: a virial equation treatment for moderate pressures and temperatures applicable to calculations of hydrothermal boiling. Geochim. Cosmochim. Acta 52, 739–749. doi:10.1016/0016-7037(88)90334-1
Tarkowski, R., Uliasz-Misiak, B., and Tarkowski, P. (2021). Storage of hydrogen, natural gas, and carbon dioxide – geological and legal conditions. Int. J. Hydrogen Energy 46 (38), 20010–20022. doi:10.1016/j.ijhydene.2021.03.131
Torin-Ollarves, G. A., and Trusler, J. P. M. (2021). Solubility of hydrogen in sodium chloride brine at high pressures. Fluid Phase Equilibria 539, 113025. ISSN 0378-3812. doi:10.1016/j.fluid.2021.113025
Ugarte, E. R., and Salehi, S. (2022). A review on well integrity issues for underground hydrogen storage. J. Energy Resour. Technol. 144 (4), 042001. doi:10.1115/1.4052626
Wagner, W., and Pruss, A. (1993). International equations for the saturation properties of ordinary water substance. Revised according to the international temperature scale of 1990. Addendum to J. Phys. Chem. Ref. Data 16, 893 (1987). J. Phys. Chem. Ref. Data 22 (3), 783–787. doi:10.1063/1.555926
Wiebe, R., and Gaddy, V. L. (1934). The solubility of hydrogen in water at 0, 50, 75 and 100° from 25 to 1000 atmospheres. JACS 56, 76–79. doi:10.1021/ja01316a022
Wiebe, R., Gaddy, V. L., and Heins, J. C. (1932). Solubility of hydrogen in water at 25 °C from 25 to 1000 atmospheres. Ind. Eng. Chem. 24, 823–825. doi:10.1021/ie50271a024
Zivar, D., Kumar, S., and Foroozesh, J. (2021). Underground hydrogen storage: a comprehensive review. Int. J. Hydrogen Energy 46 (45), 23436–23462. doi:10.1016/j.ijhydene.2020.08.138
Zoss, L. (1952). A study of the hydrogen and water and oxygen and water systems at various temperatures and pressures. Ph. D. Thesis. West Lafayette: Purdue University.
Appendix A An estimate of gas volume dissolving within a storage cycle
The obtained Rsw curves can be used to estimate the quantity of gas that dissolves in a storage cycle, as the storage pressure increases from a starting pressure
The volume of gas at a pressure
where, considering a biphasic system of gas and water,
The volume of injected gas from a starting pressure
Thus, the volume ratio of injected gas that dissolves is:
By way of example, the scenario of pure H2 in brine B1 at 45°C is considered;
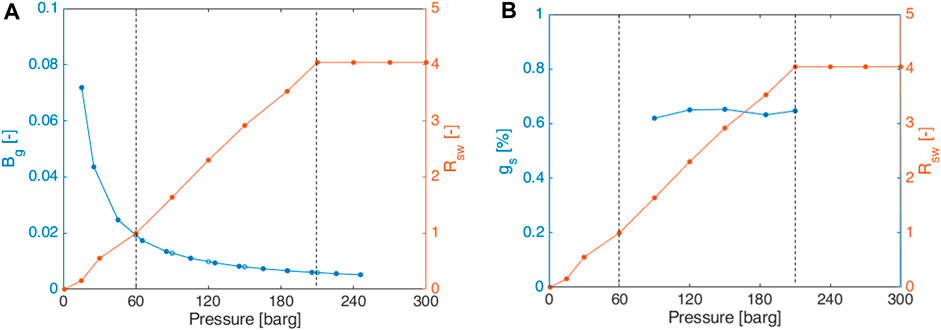
FIGURE 7. Scenario of pure H2 in brine 1 at 45°C: (A) Rsw and Bg; (B) percentage of gas in solution.
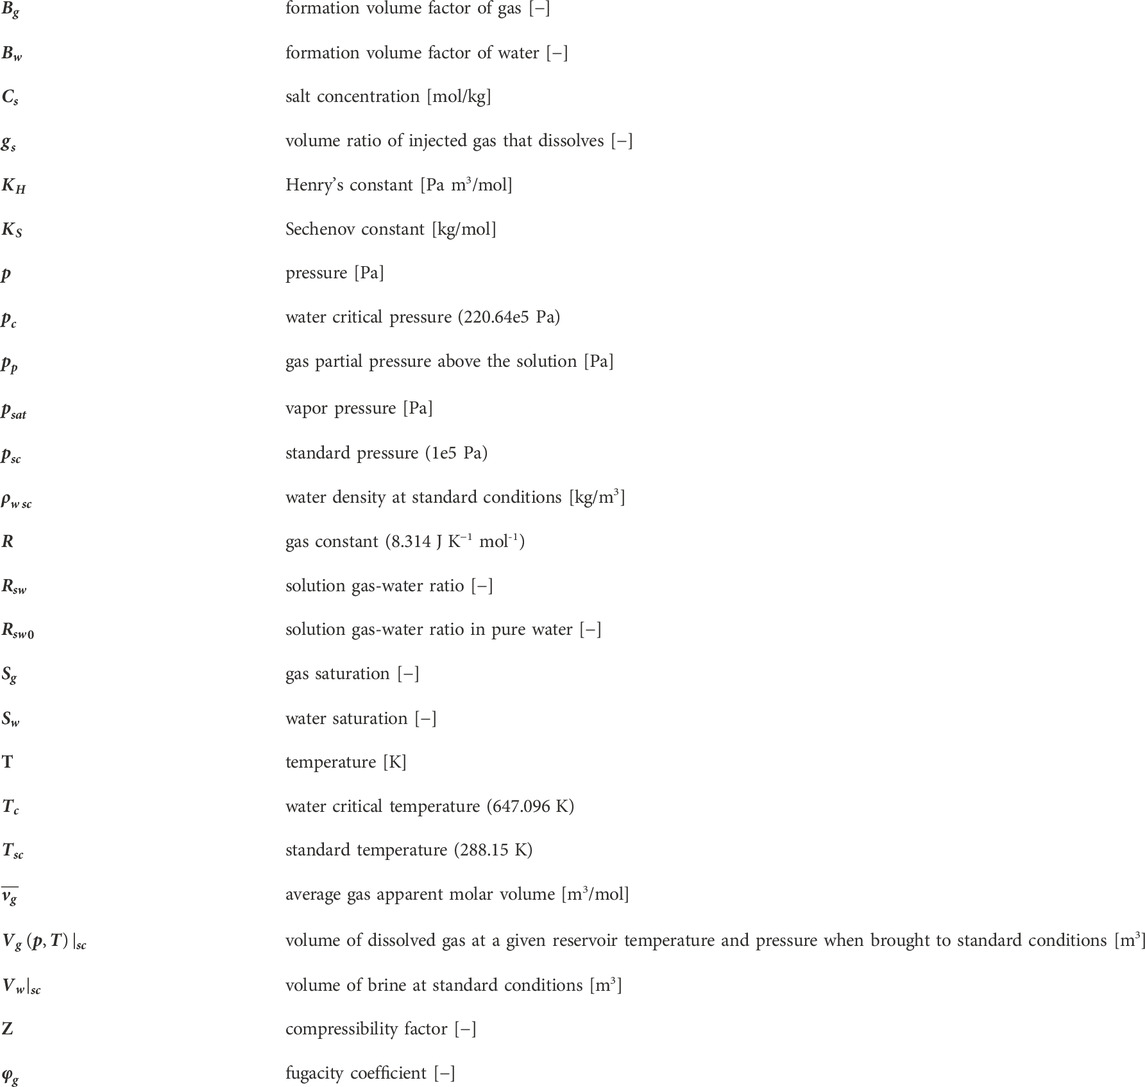
Nomenclature
Keywords: hydrogen storage, solubility, H2-CH4 mixtures, PVT cell, brine, gas storage
Citation: Tawil M, Salina Borello E, Bocchini S, Pirri CF, Verga F, Coti C, Scapolo M, Barbieri D and Viberti D (2024) Solubility of H2-CH4 mixtures in brine at underground hydrogen storage thermodynamic conditions. Front. Energy Res. 12:1356491. doi: 10.3389/fenrg.2024.1356491
Received: 15 December 2023; Accepted: 03 April 2024;
Published: 22 April 2024.
Edited by:
Lingping Zeng, Commonwealth Scientific and Industrial Research Organisation (CSIRO), AustraliaReviewed by:
Timothy A. Barckholtz, ExxonMobil Technology and Engineering, United StatesJoachim Tremosa, Geostock, France
Copyright © 2024 Tawil, Salina Borello, Bocchini, Pirri, Verga, Coti, Scapolo, Barbieri and Viberti. This is an open-access article distributed under the terms of the Creative Commons Attribution License (CC BY). The use, distribution or reproduction in other forums is permitted, provided the original author(s) and the copyright owner(s) are credited and that the original publication in this journal is cited, in accordance with accepted academic practice. No use, distribution or reproduction is permitted which does not comply with these terms.
*Correspondence: Michel Tawil, bWljaGVsLnRhd2lsQHBvbGl0by5pdA==