 Xiting Chen
 Xianghui Lu
 Yisong Hu
94% of researchers rate our articles as excellent or good
Learn more about the work of our research integrity team to safeguard the quality of each article we publish.
Find out more
ORIGINAL RESEARCH article
Front. Energy Res., 07 February 2024
Sec. Nuclear Energy
Volume 12 - 2024 | https://doi.org/10.3389/fenrg.2024.1356274
This article is part of the Research TopicThermal-Hydraulics in Once-Through Steam Generator (OTSG) for Nuclear ReactorsView all 5 articles
The flow characteristics of the primary side of the helical coil once-through steam generator (OTSG) have a significant impact on the safe operation of the reactor. Different from the land-based stationary working conditions, the flow of the primary side of the OTSG is influenced by sea waves and winds under ocean conditions. The rigid body motion model is used to calculate the flow of the primary side under different ocean conditions, including heeling, trimming, rolling, pitching, heaving, and combined conditions. The results show that under heeling and trimming conditions, the static pressure of the primary side is different from that under vertical conditions due to the influence of gravity, but its impact on the flow field is relatively small. Under rolling and pitching conditions, the mean flow velocity and pressure drop change periodically with the movement of the OTSG, and the smaller the sway angle, the smaller the variation amplitude of the mean flow velocity and pressure drop. Under the heaving condition, the variation amplitude of the mean flow velocity is greater than that under rolling and pitching conditions, and reverse flow occurs. Under the combined heaving and rolling condition, the mean flow velocity and pressure drop are influenced by the period and amplitude of both the two motions.
Floating nuclear power plants are the best solutions for ocean energy supply problems as they can provide continuous, reliable, and efficient power to offshore oil exploitation platforms, remote islands, as well as for seawater desalination (Buongiorno et al., 2016; Jie, 2020). Helical coil once-through steam generators (OTSG) as the key components of small nuclear power plants are featured with compact structure, high heat transfer efficiency, and tolerance of thermal expansion stress (Yao et al., 2021a). The flow and heat transfer process in the OTSGs involves the interaction between the primary and secondary sides. The primary side is the shell side and the fluid is pressurized thus no phase change occurs, while the secondary side refers to the tube side and flow boiling occurs to generate the superheated steam (Zheng et al., 2023).
The flow and heat transfer of the primary side of an OTSG has a significant impact on the reactor’s safe operation. Numerous computer codes with simplified lumped or one-dimensional models coupling the flow and heat transfer of the primary and secondary sides are developed to analyze the thermal hydraulic behavior of OTSGs (Zhang et al., 2017; Chen et al., 2019). To obtain more three-dimensional flow and heat transfer details, Ye et al. (2018) calculated the velocity profiles and pressure drop through the primary side of the OTSG with FLUENT and found that the flow distribution in the primary side of an OTSG is a property of its structure, on which inlet conditions have little effect. Shi et al. (2019) numerically modeled the flow of the primary and secondary sides considering the heat transfer between the two sides, and the results showed that the primary and secondary pressures decrease approximately linearly and non-linearly along their flow directions, respectively. Lee and Hassan (2020) used large eddy simulation (LES) to investigate the flow across a realistic five-layered helical coil tube bundle and simplified coil bundle, and the results revealed that the realistic model is more vulnerable to flow-induced vibration. Yao et al. (2021b) analyzed the interaction between the primary and secondary sides, and the results showed that the variation of the primary flow rate greatly affects the heat transfer coefficient of the primary side. The primary side inlet temperature has a significant influence on the two-phase zone length of the secondary side. Lee et al. (2018) measured the flow among adjacent rods with particle image velocimetry (PIV) method and found that the asymmetric flow structure behind the rods seems to be a unique feature of helically coiled tube bundles, which is different from that in straight tube bundles.
Different from the land-based stationary working conditions, the flow of the primary side of the OTSG is influenced by sea waves and winds under ocean conditions. The stagnation or reverse flow of the fluid may reduce the ability to remove heat from the reactor core, which threatens the reactor’s safe operation (Xi et al., 2015; Zeng et al., 2023). Therefore, it is necessary to study the effects of ocean conditions. The ocean conditions mainly include heeling, heaving, rolling, pitching, yawing, swaying, and surging conditions (Ishida et al., 1990). Zhong et al. (2010) summarized the study of ocean condition effects on flow characteristics of natural circulation. Generally, inclination would reduce the ability of natural circulation, rolling and heaving motions would cause core flow rate oscillation and the amplitude of oscillation increases with the acceleration increases and period decreases. Numerous system analysis codes have been developed for their high accuracy and efficiency. Bai and Peng (2022) used the system program RELAP5 to study the thermal-hydraulic characteristics under ocean conditions. The results showed that the effect of rolling motion was insignificant in single-phasezones under force circulation, however, the flow oscillation amplitude was strongly affected under natural circulation. Hou et al. (2023) built a numerical simulation code to analyze the flow and heat transfer characteristics of OTSGs and the results revealed that the sway direction, sway angle, and the distance of the sway axis would significantly affect the system. He et al. (2017) developed a system analysis code based on RELAP5/MOD3 and concluded that the inclination condition would reduce the mass flow rate, and the rolling motion would bring additional pressure drop. Besides, the combination of inclination and rolling motion would break the thermal-hydraulic symmetry among different loops and enlarge the fluctuation amplitude of the core flow rate. Wu et al. (2020) used a modified one-dimensional system program RELAP5/MOD3.3 to study the effects of rolling, heaving, and inclined motions. Simulation results showed that the average core mass flow rate would reduce under rolling motion, while it was less affected under heaving motion. What’s more, the inclined condition might reduce the steam superheat degree and affect the performance of the turbine. Li et al. (2019) developed a system model with OTSGs annularly arranged and calculated the effect of inclined, heaving, and rolling conditions. The results indicated that a large inclined angle may cause a higher temperature in the core outlet and insufficient superheat steam of the OTSG in natural circulation mode operation. However, as the inclined angle is limited, the reactor safety can be guaranteed under natural circulation mode. Cheng et al. (2022) calculated the flow rate of the reactor under heaving and rolling motions. The results showed that heaving motion can cause periodic flow rate fluctuation in both primary and secondary loops, and amplitude is the main influence factor on the flow rate fluctuation of the primary loop. Rolling motion can cause flow fluctuation in the two symmetric loops of the primary system, but its impact is limited and would not cause dramatic changes in system parameters at the core. Du et al. (2023) studied the shell-side heat and mass transfer characteristics of vapor-liquid two-phase mixed refrigerants in a simplified model extracted from the experimental facility with FLUENT, and found that the ocean conditions improve heat transfer performance by approximately 0.1%–0.8% and are beneficial to reducing the flow resistance by approximately 3.1%–8.6%.
Most of the research about ocean condition effects on the flow in the primary side of OTSGs are based on system programs, and the numerical study usually employs simplified partial geometry structures. The detailed study of the flow characteristics across the helical coil tubes of the whole OTSGs is insufficient. In this paper, a realistic geometry model of the primary side of an OTSG is established to obtain more accurate flow characteristics under different ocean conditions, including heeling, trimming, rolling, pitching, heaving, and combined conditions.
The calculation zone of the primary side of an OTSG, as shown in Figure 1, is formed by subtracting helical coil tubes from a hollow cylinder. The outer and inner diameters of the hollow cylinder are 1.7 m and 0.7 m, respectively. The height of the hollow cylinder is 0.4 m. A total number of 18-layer helical coil tubes with an outer diameter of 0.02 m are distributed uniformly along the radial direction in the hollow cylinder.
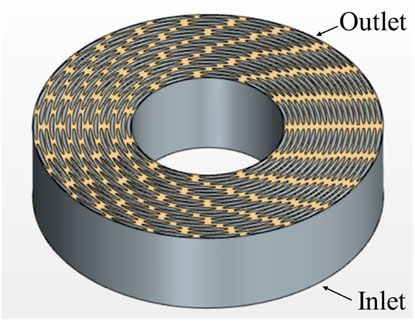
FIGURE 1. Calculation structure of the primary side of an OTSG.
To study the flow characteristics of the primary side of OTSG, single-phase pressurized water flows from the bottom to the top during the calculation. The water flows in with a velocity of 1.2 m/s, and the water temperature is set as 300°C. The outlet is set as constant pressure outlet condition, and the ambient pressure is set as 15.5 MPa.
The influence of ocean conditions on the flow in the primary side of the OTSG is applied through a rigid body motion model under the dynamic grid model. The rotation or translation motion of the entire computational domain is achieved by moving the vertices or rotation axis of the calculation domain, and the relative position of the mesh remains unchanged during the calculation.
The grid speed is,
where
The relative velocity can be written as,
where
In the dynamic grid model, the mass conservation equation can be expressed as,
where ρ is the density,
The momentum conservation equation is as follows,
where
The realizable k-ε model is used to simulate the turbulent flow of the primary side, as it is suitable for rotating flow, boundary layer flow with strong inverse pressure gradient, flow separation, and secondary flow.
The modeled transport equations for k and ε are written as,
where
In these equations, Gk and Gb represent the generation of turbulence kinetic energy due to the mean velocity gradients and buoyancy, respectively. YM represents the contribution of the fluctuating dilatation in compressible turbulence to the overall dissipation rate. σk and σε are the turbulent Prandtl number for k and ε. Sk and Sε are user-defined source terms.
The two-layer all y + processing method is chosen to deal with the velocity distribution near the wall.
The ocean conditions discussed in this paper include heeling, trimming, rolling, pitching, heaving, and combined heaving and rolling conditions, as shown in Figure 2.
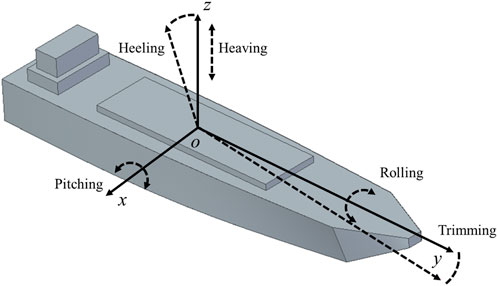
FIGURE 2. Diagram of different ocean conditions.
Heeling and trimming conditions are stationary. Among them, the heeling condition refers to the inclination around the central axis of the ship in the left and right directions, and the trimming condition refers to the inclination towards the bow or stern of the ship. The calculation of heeling and trimming conditions is completed by adjusting the direction of gravity.
The rolling condition refers to the sway along the left and right side of the ship, while the pitching condition refers to the sway along the bow or stern of the ship. During the calculation, the axis and angular velocity need to be set. The angular velocity of the OTSG can be written as,
where
For the heaving condition, the velocity of the OTSG in the vertical direction can be written as,
where A is the amplitude.
For the combined heaving and rolling condition, two motion functions need to be added together to complete the simulation.
The calculation zone is meshed by polyhedral grids with STAR-CCM+. A 2-layer boundary layer mesh is set on the outer side of the coil tube walls. The generated mesh is shown in Figure 3.
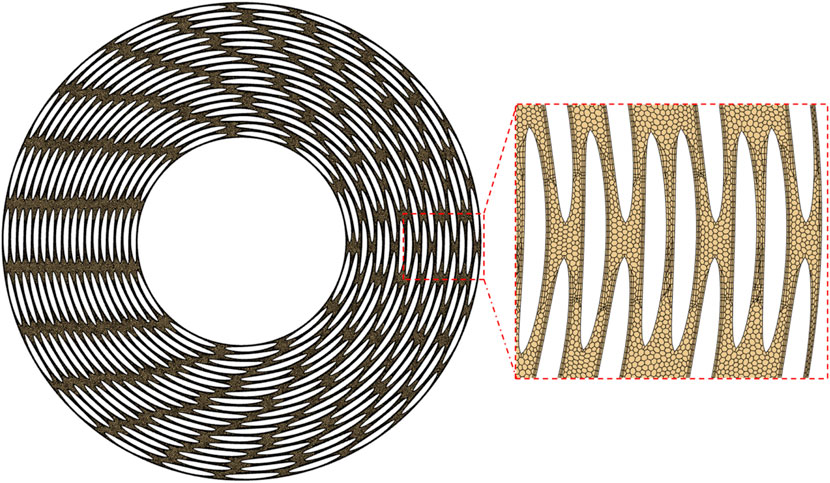
FIGURE 3. Diagram of generated mesh.
To check the mesh independency, the simulation is conducted with three different number of meshes: 9.76 million, 10.98 million and 12.35 million. The difference of the pressure drop across the OTSG of the last two meshes is less than 1%, so the total mesh number of 10.98 million is used in this paper, which is determined considering both the computational accuracy and efficiency.
The distribution of the velocity along the axis of the OTSG at the longitudinal section of the primary side under the heeling condition is shown in Figure 4. The flow velocity between the tubes of adjacent layers is significantly higher than that between the tubes of the same layer, as the main flow is along the axis from the inlet to the outlet. As shown in Figure 4, the maximum velocity near the inlet is about 2.7 m/s, but that near the outlet is less than 2.2 m/s. The homogeneity of velocity along the radial direction near the outlet is better than that close to the inlet. This is because the velocity near the inlet is affected by the geometry as some of the tubes are cut in the cross section. However, as the helical coil tube bundles help the flow mixture, the uniformity of velocity along the radial direction increases along the flow direction. What’s more, there is no significant difference in the velocity between the inner and outer layers of the OTSG under the heeling condition, because the flow rate is in the forced circulation range, where the effect of gravity can be neglected.

FIGURE 4. Velocity distribution at the longitudinal section of the primary side of the OTSG under heeling condition.
The distribution of static pressure at the longitudinal section of the primary side of the OTSG under heeling condition is shown in Figure 5. Compared with the vertical upward static condition, the pressure at the outlet is smaller at heeling condition, while that at the inlet is larger, which increases the overall pressure drop by approximately 5%.

FIGURE 5. Static pressure distribution at the longitudinal section of the primary side of the OTSG under heeling condition.
As the inclination condition only changes the gravity direction, the distribution of the velocity and pressure under the trimming condition is similar to that under heeling condition.
In the calculation of the rolling condition, the assumed sway period of the OTSG is 7 s, and the maximum sway angle is 22.5°. The distance between the OTSG and the rotation axis is 1.58 m. The variation of the mean flow velocity relative to the OTSG along the axial direction at the central cross-section with time is shown in Figure 6. Since the flow is incompressible, the difference in mean flow velocity at different cross-sections is negligible. The mean flow velocity changes periodically with the rolling of the OTSG, but there is a slight delay of about 0.4 s compared to the period of angular velocity.
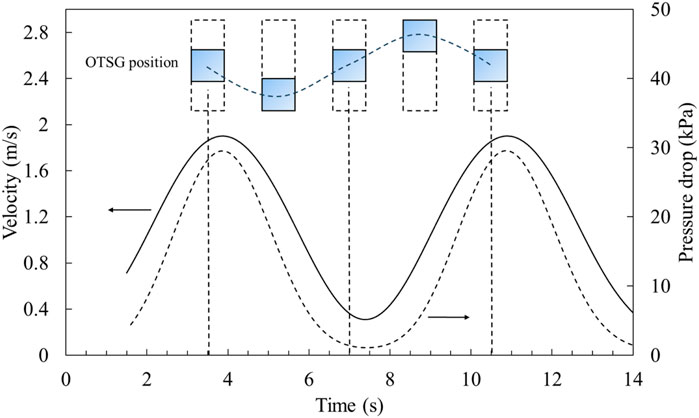
FIGURE 6. Variation of mean velocity and total pressure drop with time under rolling condition.
During the falling process of the OTSG from the highest to the lowest position, the mean flow velocity increases first and then decreases, and it reaches a maximum value of 1.9 m/s when the OTSG is in the vertical state. During the rising process, the mean flow velocity decreases first and reaches a minimum value of 0.3 m/s when the OTSG is in the vertical state. After that, the mean velocity increases gradually. In addition, the average value of the mean flow velocity in a period is 1.1 m/s, which is close to that in the stationary state. The results indicate that the flow rate required to remove the heat from the reactor core can be guaranteed under the rolling condition. Compared with the stationary condition, pulsating flow is observed between adjacent tubes under the rolling condition, which significantly increases the flow instability.
The variation of total pressure drop of the primary side of the OTSG with time is shown in Figure 6. Unlike the sinusoidal variation of the mean flow velocity, the pressure drop fluctuation amplitude in the falling process is larger and changes sharply, while that in the rising process is smaller and changes gently. This is because the pressure drop across helical coil tubes is influenced by both the inertial and viscous terms. The inertial term is proportional to the square of the velocity, while the viscous term is only proportional to the velocity. In the falling process, the flow velocity is larger and the inertial term dominates, so the pressure drop increases more and the change is more intense. However, in the rising process, the flow velocity is relatively small and the viscous term dominates, so the amplitude is smaller and the change is mild.
Besides, as shown in Figure 6, the pressure drop profile shows a symmetrical distribution before and after the mean flow velocity reaches its extreme value, indicating that the Coriolis force and centrifugal force caused by rolling have little impact on the pressure drop.
The variation of mean flow velocity along the axial direction at the central cross-section with time under the pitching condition with a period of 5 s and a maximum sway angle of 10° is shown in Figure 7. The distance between the OTSG and the rotation axis is 2.09 m. The mean flow velocity varies periodically with a maximum value of 1.5 m/s and a minimum value of 0.7 m/s with the pitching of the OTSG. The smaller variation amplitude of the mean flow velocity under the pitching condition is caused by the smaller sway amplitude compared to that under the rolling condition. However, the average value of mean flow velocity is close to that under the rolling condition, which indicates that the influence of the sway condition on the mean flow rate can be neglected and the flow rate required for the reactor core heat dissipation can be guaranteed.
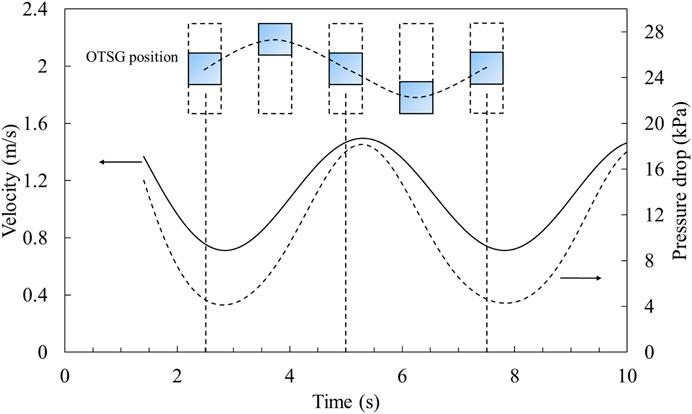
FIGURE 7. Variation of mean velocity and total pressure drop with time under pitching condition.
As shown in Figure 7, the total pressure drop varies between 4.1 kPa and 18.1 kPa with the pitching of the OTSG. The variation amplitude of pressure drop is smaller compared with that under the rolling condition due to the smaller mean flow velocity variation. Besides, the change rate of the pressure drop at the peak and valley are similar, because the variation of mean flow velocity is smaller and the difference caused by the inertial and viscous terms can be ignored.
The acceleration with an amplitude of 4.9 m/s2 and a period of 5 s is applied to the OTSG to simulate the flow of the primary side under the heaving condition. The variations of velocity and acceleration of the OTSG with time are shown in Figure 8. The amplitude of velocity is 3.9 m/s, and there is a 90° phase difference between the velocity and acceleration. At the beginning, the acceleration is 0 m/s2 and the velocity reaches the minimum value of −3.9 m/s. At 2.5 s, the acceleration drops to 0 m/s2 again, and the maximum velocity reaches 3.9 m/s.

FIGURE 8. Variation of velocity and acceleration of OTSG under heaving condition.
The variation of the mean flow velocity along the axial direction at the central cross-section with time is shown in Figure 9. Different from the rolling and pitching conditions, reverse flow occurs at about 2.0 s, because the upward velocity of the OTSG surpasses the mean flow velocity. At 2.5 s, the OTSG moves upward across the midpoint of the displacement and the velocity reaches the maximum value. After a delay of about 0.3 s, the mean flow velocity reaches the minimum value of −2.5 m/s. Subsequently, as the velocity of the OTSG decreases, the mean flow velocity gradually increases. At 5 s, the OTSG moves downward across the midpoint of the displacement and the velocity reaches its minimum value. After a delay of about 0.3 s, the mean flow velocity reaches the maximum value of 4.4 m/s. Under the heaving condition, the mean flow velocity is strongly affected by the movement of OTSG, and there exists a delay of about 0.3 s between the movement of the OTSG and the mean flow.
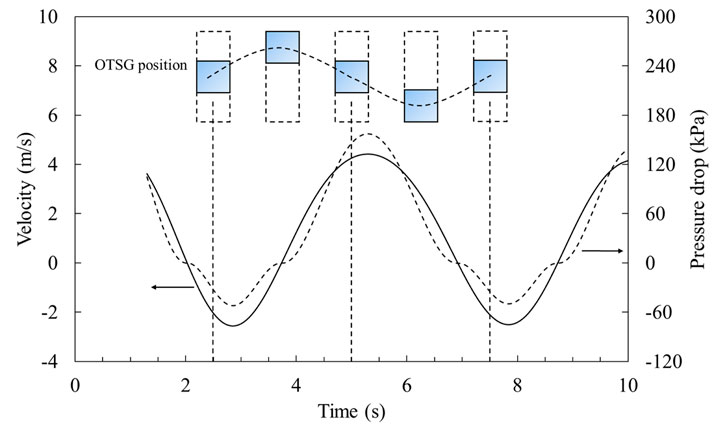
FIGURE 9. Variation of mean velocity and total pressure drop with time under heaving condition.
The variation of the total pressure drop of the primary side of the OTSG with time is shown in Figure 9. The total pressure drop depends on the flow direction and becomes negative when the reverse flow occurs. The variation of pressure drop is consistent with that of the mean flow velocity and there is no delay between these two variables. The maximum pressure drop is about 157 kPa, and the minimum pressure drop is about −51 kPa. The pressure drop at the peak and valley of the profile is more pronounced compared with that in the rolling and pitching condition, because the absolute mean flow velocity is larger, where the inertial term dominates near this region and the pressure drop is proportional to the square of the velocity. However, the pressure drop change is mild when the mean flow velocity is close to 0 m/s, because the viscous term dominates near this region, where the pressure drop is proportional to the velocity.
In the combined heaving and rolling condition, the period of the rolling motion is 7 s and the maximum sway angle is 22.5°, while the period of the heaving motion is 5 s and the amplitude is 4.9 m/s2. The motion function is obtained by adding Eqs 10, 11, and both of the two motions are set in the rising period at the beginning. As shown in Figure 10, the mean flow velocity profile is more complex due to the different periods of rolling and heaving motions. At 3.2 s, the mean flow velocity reaches the maximum value of 2.3 m/s. This is because the rolling and heaving motions are both in the falling period at this time. The mean flow velocity reaches the second extreme value of 1.3 m/s at 8.1 s, as the heaving motion is in the falling period, which compensates for the rising of the rolling motion. The mean flow velocity strongly depends on the period and amplitude of rolling and heaving motions. The final composed mean flow velocity profile changes when the amplitude or the period of these two motions changes.
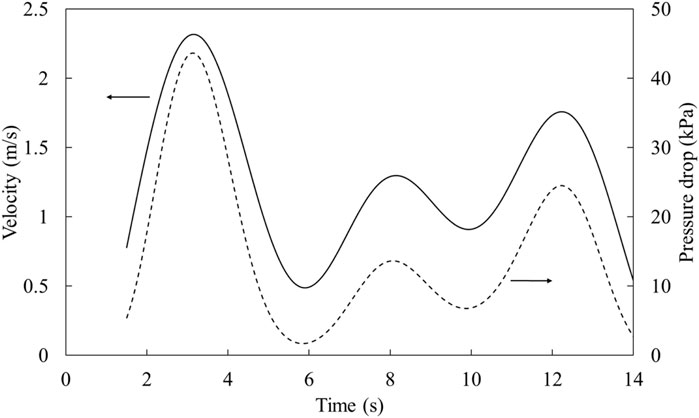
FIGURE 10. Variation of mean velocity and total pressure drop with time under combined heaving and rolling condition.
The variation of the total pressure drop of the primary side of the OTSG with time is shown in Figure 10. The variation of the pressure drop is similar to that of the mean flow velocity. The pressure drop is higher at the falling period of the OTSG and decreases at the rising period. Besides, the pressure drop increases more at a higher mean flow velocity region, and the change of pressure drop is mild when the mean flow velocity is low under the rising period. The reason is similar to the pressure drop variation in the rolling and pitching conditions, that is, the inertia term dominates at large flow velocity where the pressure drop is proportional to the square of the velocity; the viscosity term dominates at low flow velocity where the resistance is just proportional to the flow velocity.
Numerical simulation is conducted to study the flow characteristics of the primary side of the OTSG under different ocean conditions, including heeling, trimming, rolling, pitching, heaving and combined conditions. The main conclusions are as follows:
(1) Under heeling and trimming conditions, the distribution of static pressure of the primary side of OTSG is different from that under the vertical condition due to the influence of gravity, but its impact on the flow field is relatively small. As the helical coil tube bundles help the flow mixture, the uniformity of velocity along the radial direction increases along the flow direction.
(2) Under rolling and pitching conditions, the mean flow velocity and pressure drop change periodically with the movement of the OTSG, and there exists a delay of about 0.4 s. During the falling process of the OTSG, the mean flow velocity increases first and then decreases, and it reaches the maximum value of 1.9 m/s when the OTSG is in the vertical state. The pressure drop is larger and changes more intensely in the falling period. Besides, the Coriolis force and centrifugal force caused by rolling or pitching motion have little impact on the pressure drop. Since the sway angle is smaller under the pitching condition, the amplitude of mean flow velocity and pressure drop are smaller compared with that under the rolling condition. The average value of mean flow velocity is close to that under the stationary condition, which indicates that the flow rate required for removing the heat from the reactor core can be guaranteed under rolling and pitching conditions.
(3) Under the heaving condition, the variation amplitude of the mean flow velocity is greater than that under pitching and rolling conditions. The mean flow velocity is strongly affected by the movement of OTSG. Reverse flow, which needs to be avoided as much as possible, occurs when the upward velocity of the OTSG surpasses the mean flow velocity. There exists a delay of about 0.3 s between the mean flow velocity and the movement of the OTSG. The pressure drop at the peak and valley of the profile is more pronounced and the pressure drop change is mild when the mean flow velocity is close to 0 m/s.
(4) Under the combined heaving and rolling condition, the mean flow velocity of the cross-section is influenced by the period and amplitude of both the two motions. The variation of the composed mean flow velocity is more complex when the two motion conditions have different periods and amplitudes. For conditions combined with two or more motions, the full cycle simulation is required to obtain the most severe condition.
The original contributions presented in the study are included in the article/Supplementary material, further inquiries can be directed to the corresponding author.
XC: Methodology, Software, Writing–original draft. XL: Project administration, Writing–review and editing. YG: Investigation, Writing–original draft. YM: Supervision, Writing–review and editing. YH: Methodology, Validation, Writing–review and editing. JZ: Supervision, Writing–review and editing. JC: Supervision, Writing–review and editing.
The author(s) declare that no financial support was received for the research, authorship, and/or publication of this article.
Authors XC, XL, YG, YM, YH, JZ, and JC were employed by China Nuclear Power Technology Research Institute Co Ltd.
All claims expressed in this article are solely those of the authors and do not necessarily represent those of their affiliated organizations, or those of the publisher, the editors and the reviewers. Any product that may be evaluated in this article, or claim that may be made by its manufacturer, is not guaranteed or endorsed by the publisher.
Bai, T.-Z., and Peng, C.-H. (2022). Thermal hydraulic characteristics of helical coil once-through steam generator under ocean conditions. Nucl. Sci. Tech. 33, 134. doi:10.1007/s41365-022-01108-9
Buongiorno, J., Jurewicz, J., Golay, M., and Todreas, N. (2016). The offshore floating nuclear plant concept. Nucl. Technol. 194, 1–14. doi:10.13182/NT15-49
Chen, H., Chen, J., and Zhang, X. (2019). Development of thermal-hydraulic analysis code of a helically coiled once-through steam generator based on two-fluid model. Ann. Nucl. Energy. 132, 773–783. doi:10.1016/j.anucene.2019.06.047
Cheng, K., Chu, X., Qiu, Z., Xian, L., and Deng, J. (2022). “Study on steady operational characteristics of floating nuclear reactor under ocean condition,” in International Conference on Nuclear Engineering, Virtual, Online, August, 2022. doi:10.1115/ICONE29-92063
Du, X.-P., Yu, G.-L., Xu, Y.-C., Chen, Z.-J., Li, N.-L., and Wang, H.-G. (2023). Research on shell-side heat and mass transfer with multi-component in LNG spiral-wound heat exchanger under sloshing conditions. Pet. Sci., doi:10.1016/j.petsci.2023.10.016
He, L., Wang, B., Xia, G., and Peng, M. (2017). Study on natural circulation characteristics of an IPWR under inclined and rolling condition. Nucl. Eng. Des. 317, 81–89. doi:10.1016/j.nucengdes.2017.03.033
Hou, Y., Li, J., Sun, H., Li, W., Zhang, C., and Xiang, Y. (2023). Effects of rolling motion on helical coil once-through steam generator thermal-hydraulic characteristics. Ann. Nucl. Energy. 194, 110068. doi:10.1016/j.anucene.2023.110068
Ishida, I., Kusunoki, T., Murata, H., Yokomura, T., Kobayashi, M., and Nariai, H. (1990). Thermal-hydraulic behavior of a marine reactor during oscillations. Nucl. Eng. Des. 120, 213–225. doi:10.1016/0029-5493(90)90374-7
Jie, X. (2020). Research progress of reactor thermal-hydraulic characteristics under Ocean Conditions in China. Front. Energy Res. 8, 593362. doi:10.3389/fenrg.2020.593362
Lee, S., Delgado, M., Lee, S. J., and Hassan, Y. A. (2018). Experimental investigation of the isothermal flow field across slant 5-tube bundles in helically coiled steam generator geometry using PIV. Nucl. Eng. Des. 338, 261–268. doi:10.1016/j.nucengdes.2018.08.012
Lee, S. J., and Hassan, Y. A. (2020). Numerical investigation of helical coil tube bundle in turbulent cross flow using large eddy simulation. Int. J. Heat. Fluid Fl. 82, 108529. doi:10.1016/j.ijheatfluidflow.2019.108529
Li, R., Xia, G., Peng, M., and Sun, L. (2019). The simulation study on natural circulation operating characteristics of FNPP in inclined condition. Nucl. Eng. Technol. 51, 1738–1748. doi:10.1016/j.net.2019.05.021
Shi, J., Yang, L., Sun, B., Li, Y., Yu, X., and Zhang, P. (2019). Numerical calculation of the thermal-hydraulic characteristics in a once-through steam generator based on a coupled boundary. Appl. Therm. Eng. 148, 734–746. doi:10.1016/j.applthermaleng.2018.11.096
Wu, J., Zheng, M., Wang, M., Zhao, S., and Zhang, X. (2020). Research on thermal hydraulic characteristics of integrated reactor in natural circulation operation under ocean motions. Prog. Nucl. Energy 126, 03399. doi:10.1016/j.pnucene.2020.103399
Xi, M., Wu, Y., Tian, W., Su, G. H., and Qiu, S. (2015). The influence of ocean conditions on thermal-hydraulic characteristics of a passive residual heat removal system. Prog. Nucl. Energy 85, 573–587. doi:10.1016/j.pnucene.2015.08.010
Yao, H., Chen, G., Lu, K., Liao, H., Wu, Y., Tian, W., et al. (2021a). Study on the thermal and geometrical parameters of helical coil once-through steam generator system. Int. J. Adv. Nucl. React. Des. Technol. 3, 80–96. doi:10.1016/j.jandt.2021.07.001
Yao, H., Chen, G., Lu, K., Wu, Y., Tian, W., Su, G., et al. (2021b). Study on the systematic thermal-hydraulic characteristics of helical coil once-through steam generator. Ann. Nucl. Energy. 154, 108096. doi:10.1016/j.anucene.2020.108096
Ye, K., Zhang, Y., Sheng, X., Li, N., Yang, Y., and Chen, Y. (2018). Numerical analysis of the flow behavior in a helically coiled once through steam generator. Nucl. Eng. Des. 330, 187–198. doi:10.1016/j.nucengdes.2018.01.031
Zeng, J., Mao, Y., Li, B., Zhu, J., Hu, Y., and Chen, J. (2023). Analysis of coolant flow distribution characteristics at core inlet of small pressurized water reactor under rolling condition. Front. Energy Res. 11, 1324187. doi:10.3389/fenrg.2023.1324187
Zhang, Y., Wang, D., Lin, J., and Hao, J. (2017). Development of a computer code for thermal–hydraulic design and analysis of helically coiled tube once-through steam generator. Nucl. Eng. Technol. 49, 1388–1395. doi:10.1016/j.net.2017.06.017
Zheng, X., Lu, X., Gao, Y., Jin, D., Hu, Y., Hu, Y., et al. (2023). Experimental study on friction pressure drop and circumferential heat transfer characteristics in helical tubes. Front. Energy Res. 11, 1204850. doi:10.3389/fenrg.2023.1204850
Keywords: once-through steam generator (OTSG), ocean conditions, numerical simulation, flow characteristics, primary side
Citation: Chen X, Lu X, Gao Y, Mao Y, Hu Y, Zhu J and Chen J (2024) Numerical study on flow characteristics in the primary side of a once-through steam generator under ocean conditions. Front. Energy Res. 12:1356274. doi: 10.3389/fenrg.2024.1356274
Received: 15 December 2023; Accepted: 25 January 2024;
Published: 07 February 2024.
Edited by:
Xiongbo Duan, Central South University, ChinaReviewed by:
Naihua W Ang, Shandong University, ChinaCopyright © 2024 Chen, Lu, Gao, Mao, Hu, Zhu and Chen. This is an open-access article distributed under the terms of the Creative Commons Attribution License (CC BY). The use, distribution or reproduction in other forums is permitted, provided the original author(s) and the copyright owner(s) are credited and that the original publication in this journal is cited, in accordance with accepted academic practice. No use, distribution or reproduction is permitted which does not comply with these terms.
*Correspondence: Xiting Chen, MTg3ODk0NjEwNTlAMTYzLmNvbQ==
Disclaimer: All claims expressed in this article are solely those of the authors and do not necessarily represent those of their affiliated organizations, or those of the publisher, the editors and the reviewers. Any product that may be evaluated in this article or claim that may be made by its manufacturer is not guaranteed or endorsed by the publisher.
Research integrity at Frontiers
Learn more about the work of our research integrity team to safeguard the quality of each article we publish.