 Mukesh Pushkarna1*
 Kambhampati Venkata Govardhan Rao2
 B. Srikanth Goud3
 M. Kiran Kumar4
 Ch. Rami Reddy5,6
 Hossam Kotb7
 Kareem M. AboRas7*
 Yahya Z. Alharthi8
 Amr Yousef9,10*
- 1Department of Electrical Engineering, GLA University Mathura, Mathura, India
- 2Department of Electrical and Electronics Engineering, St. Martin’s Engineering College, Secunderabad, India
- 3Department of Electrical and Electronics Engineering, Anurag University, Hyderabad, India
- 4Department of Electrical and Electronics Engineering, Koneru Lakshmaiah Education Foundation, Guntur, India
- 5Department of Electrical and Electronics Engineering, Joginpally B R Engineering College, Hyderabad, India
- 6Applied Science Research Center, Applied Science Private University, Amman, Jordan
- 7Department of Electrical Power and Machines, Faculty of Engineering, Alexandria University, Alexandria, Egypt
- 8Department of Electrical Engineering, College of Engineering, University of Hafr Albatin, Hafr, Saudi Arabia
- 9Electrical Engineering Department, University of Business and Technology, Jeddah, Saudi Arabia
- 10Engineering Mathematics and Physics Department, Faculty of Engineering, Alexandria University, Alexandria, Egypt
A significant portion of wind power conversion systems worldwide comprise wind farms (WFs) that use Squirrel Cage Induction Generator (SCIG) and are directly linked to the power grid. In facilities that generate electrical energy at a moderate level, WFs are connected by means of distribution systems that use medium voltage (MV). It is not uncommon for such a system to produce a scenario in which the amount of electricity generated corresponds to the grid’s transit volume. When a wind farm’s wind power generation system is connected to a weak grid, the lack of potential control of the Point of Common Coupling (PCC) is a primary issue. This strategy is called a “Wind Farm with Weak Grid Connection.” Therefore, the amalgamation of weak grids, fluctuating electricity from wind, and variations in load on the system cause disruptions in the PCC voltage, further degrading the Power Quality (PQ) and the WF stability. Either the control method at the production level or the compensating strategies at the PCC level can improve this situation. If wind farms are built on SCIG and are directly linked to the grid, it is essential to utilise the last substitute. The technology known as Custom Power Devices (CUPS), proved extremely helpful for this type of application. This study presents a compensation technique based on a specific CUPS device, known as the Unified Power Quality Compensator (UPQC), as a possible solution. The potential terminals of WF needed to be regulated, and the voltage fluctuations on the grid side required to be reduced, so a custom-made control strategy for the UPQC device was designed internally. The control of power, such as active and reactive in the UPQC’s series and shunt converters, as well as the transmission of power via the UPQC DC-Link between converters, are the foundation of the internal control strategy that has been developed. Compared to other bespoke tactics that use reactive power, this strategy increases the UPQC’s capability to provide compensation. The suggested study calculates THD using a FUZZY controller. The results are compared to PI controller results. Simulation findings show how the suggested compensating strategy can minimise THD values and improve wind farm power and stability. The simulations suggest that the proposed compensating strategy enhances WF power and stability.
1 Introduction
The location of wind-generated electricity generating depends on wind energy. High-voltage (HV) transmission lines are usually far from these facilities (Xie and Sun, 2022). If the facility has medium power, medium voltage (MV) distribution wires will link the WF. The most distinguishing characteristic of these connections is an improved voltage control sensitivity to load variations (Huang et al., 2021). Therefore, the capability of the scheme to normalize potential at the PCC, which is the point at which the electrical system and the WF are coupled, is an essential factor in the proper operation of the WF. In addition, it is common knowledge that wind farms produce variable amounts of electric power due to the unpredictable nature of wind resources. These variations harm the consistency and quality of the electricity provided by the electric power systems (Song et al., 2023).
Additionally, SCIG-used wind turbines have been in use since the beginning of energy extraction from wind resources. The supply mains or capacitor banks supply the required reactive power with SCIG (Yang et al., 2024). There are fluctuations in the rotor speed. For example, the power grid’s injected (demanded) WF active (reactive) power will fluctuate due to wind disturbances. This will produce variations in the WF terminal potential and the system’s impedance. Electrical power turbulences will eventually find their way into the power system (Zhang et al., 2023), which may result in a spectacle known as a “flicker,” which is characterised by oscillations in the level of illumination caused by voltage variations. Additionally, the regular operation of the WF is hampered by these disturbances. The effect is significantly more significant when “weak grids” (WG) are specifically considered.
Several potential methods have been proposed in demand to reduce the possible electric variations that can result in a “flicker” at the WF terminals. Updating the electrical grid by raising the power level at short circuits at the PCC is the most popular solution. This decreases system sensitivity to power fluctuations and voltage control issues (Liu et al., 2023).
Electronic equipment for electric power systems has become widespread due to high-power electronics technology. This device reacts faster than line frequency. FACTS and devices give these active compensators tremendous flexibility for controlling power flow in gearbox systems employing Custom Power System (CUPS) devices (Liu et al., 2023). This type of active compensator increased wind energy assimilation in weak systems, as researched (Miaofen et al., 2023).
We propose and test a UPQC-based compensation approach for a SCIG-based WF connected to a weak distribution power grid. This system is based on a study (Li et al., 2022a). The potential at the WF terminal can be controlled and the PCC experiences fewer voltage swings due to the management of the UPQC. These fluctuations are caused by changes in the system load and the pulsating power provided by the WF, respectively. Inoculating the voltage “in phase” with the PCC potential, the series converter with UPQC controls the electrical potential at the WF terminal (Miaofen et al., 2023). This is achieved through voltage injection. Similarly, the parallel converter is utilised to screen the power created by the WF to prevent voltage swings. This function requires the ability to actively and reactively handle electricity. The standard DC link takes active power distribution among various converters (Chen et al., 2022). Simulations were carried out to demonstrate how successful the proposed compensatory strategy not only for UPQC and also verified with fuzzy logic controller.
1.1 Motivation
The literature survey, Table.1, shows that research has been carried out in the area of wind farms (WF) that use SCIG and are directly linked to the power grid. In facilities that generate electrical energy at a moderated level. Only a little research has revealed that wind farms are built on SCIG and are directly linked to the grid. It is essential to utilize for substitute. In this article, the technology known as CUPS, or custom power devices, proved extremely helpful for this type of application.
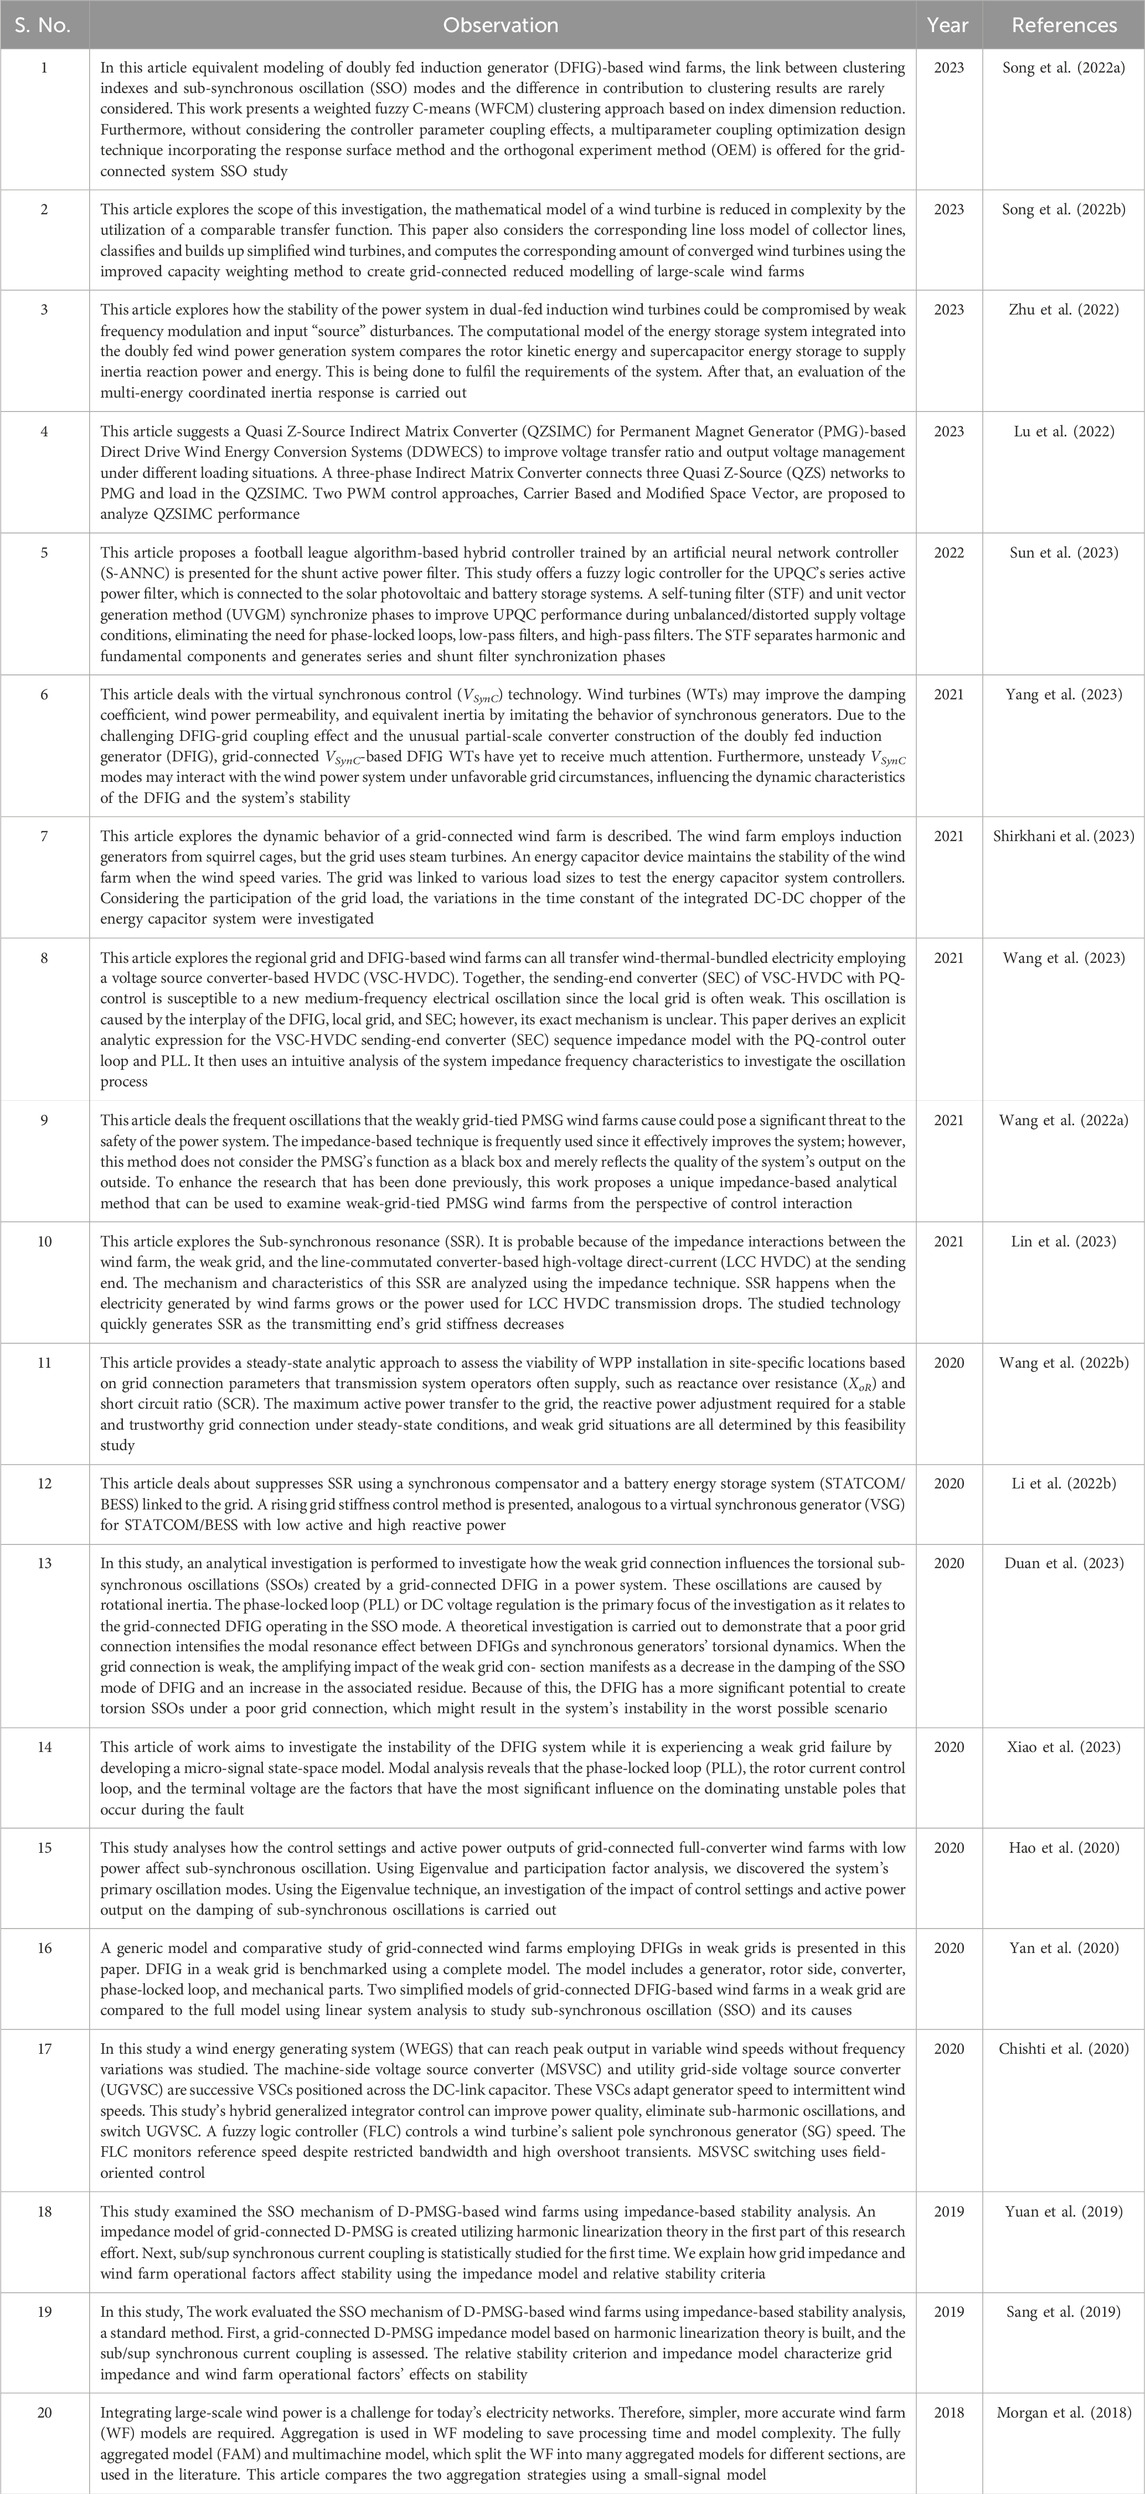
TABLE 1. Literature analysis.
1.2 Literature review
A compensation technique that is based on a specific CUPS device known as the UPQC is presented in this study as a possible solution. The same is also implemented with a fuzzy logic controller and PI controller.
1.3 Contribution and organization of the paper
The main contribution of this paper is:
• The main technical characteristics of the weak grid are investigated in that WF is connected using distribution systems that use medium voltage (MV).
• The general case study of an electrical system with small WF with the parameters of 36 wind turbines for generating 21.6 MW electrical power.
• A dynamic layout of UPQC with complete switching converter involvement is developed.
• The complete controlling scheme of UPQC with Series and Shunt compensator is simulated.
• A new fuzzy logic controller is introduced into the system. These are tested with MATLAB Simulink to get a stable operation to improve voltage WF in the weak grid, and THD results are also presented.
This paper is organized with an abstract on keywords. In the first section, the introduction is explained in terms of wind forms with different UPQC and fuzzy techniques, followed by the literature survey and the paper’s contribution. The second section discusses the general case study in the electrical system. In the third section, the turbine rotor and disturbance model are discussed. In the fourth section, the proposed layout of the dynamic compensator model of the induction generator is developed. The fifth and sixth section consists of control scheme for UPQC and fuzzy implementation techniques. The seventh section deal with results and discussion The eighth and ninth sections deal with discussion for paper outcome, followed by an explanation of the conclusion.
2 General case study explanation of electrical system
The electrical system being looked at in this research can be seen in Figure 1. The WF comprises 36 wind turbines utilising squirrel cage induction generators, producing 21.6 MW of electrical power. Each turbine is coupled to an electrical grid of a 630 kVA 0.69/33 kV transformer and features attached fixed reactive compensation capacitor banks with a rating of 175kVAr. Based on reference (Liu et al., 2018), this system depicts a real-life scenario.
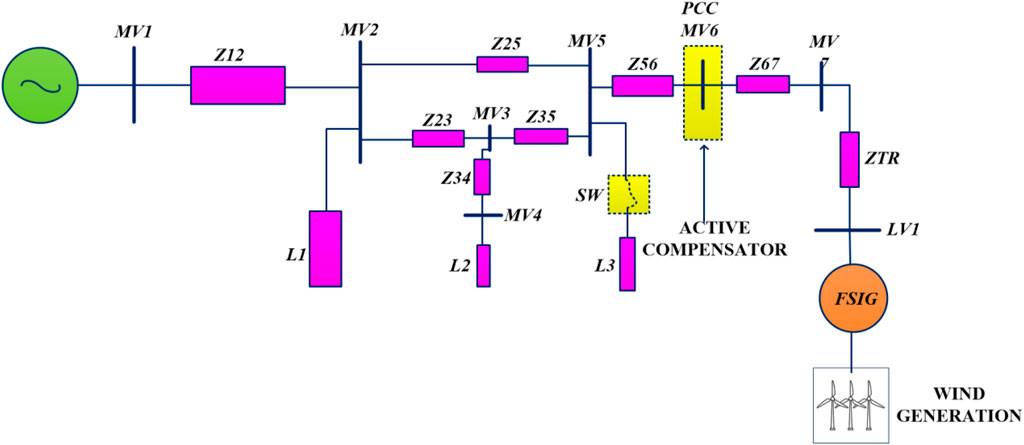
FIGURE 1. A general power system for the case study.
The indication of the “connection weakness” based on the power ratio during a quick circuit to the power-valued WF. Consequently, while taking into consideration the fact that the short circuit power in MV6 is SSC> 120 MV A, so this ratio can be calculated with (1).
Any value of r < 20 is regarded as having a “weak grid” linkage (Nie et al., 2022).
3 Turbine rotor and associated disturbances model
The following expression determines the amount of electricity obtained from a WT:
Where ρ is the air density, R is the radius of the swept area, v is wind speed, and CP is the power coefficient.
For the considered turbines (600 kW), the values are R = 31.2 m,ρ= 1.225 kg/m3 and CP calculation is taken from (Damchi and Eivazi, 2022).
The power from the turbines is then combined to create a comprehensive model of the WF, showing that the entire WF is represented by a single corresponding turbine producing electrical potential from wind power, which is the same as the mean totality of the power provided by each turbine is expressed in (3):
In addition, disruptions in the wind flow can cause the wind speed
In most situations, the effect of the edge coat of the atmosphere is disregarded in favour of the results provided by the shadow effect produced by the tower (Yang et al., 2015). Note that the total of perturbations can occur if the entire turbines operate in the same sequence and in phase, which has the most significant impression on the electrical grid (worst case scenario) because the pulsation of power has the most significant peak in this situation. Therefore, the turbine combination method is acceptable.
4 Typical layout of dynamic compensator model induction generator
The model used for the SCIG is the one that is included in the Matlab/Simulink, Sim Power Systems package (Venkata Govardhan Rao et al., 2022). Dynamic voltage fluctuations are accounted for by supplying the MV6 (PCC) bus bar with potential in series and active reactive power. This is accomplished with a unified type compensator, a UPQC (Ray et al., 2021). The general layout of this compensator can be seen in Figure 2A, while Figure 1 should be used as a reference for the bus bar and impedance numbering.
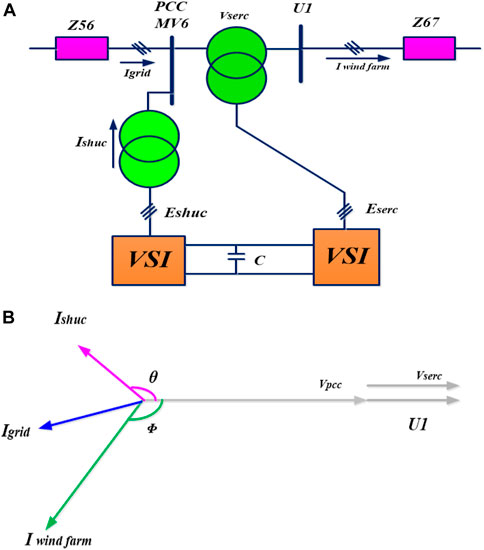
FIGURE 2. (A) representation of UPQC and (B) UPQC phasor.
The process involves utilising VSI or CSI electrical converters to create three-phase voltages. As for its lower loss of DC link and quicker system response, the VSI converter is preferred over the CSI converter (Srikanth et al., 2023). The UPQC’s shunt converter is accountable for injecting current at PCC, as explained in Figure 2B, while the series converter produces electric potential for PCC and UI. The vital theme of the compensator is that the series and shunt VSIs operate using the same DC bus. Thanks to this functionality, the two different types of converters can actively transfer power.
The converters are manufactured using ideal regulated voltage sources since the switching control of the converters is outside the purview of this work, and the higher-order harmonics produced by VSI converters are outside the bandwidth of importance in the simulation analysis. It is completed since the switching converter control is not involved in this task. Figure 3 displays the finalized model of the UPQC system’s power side.
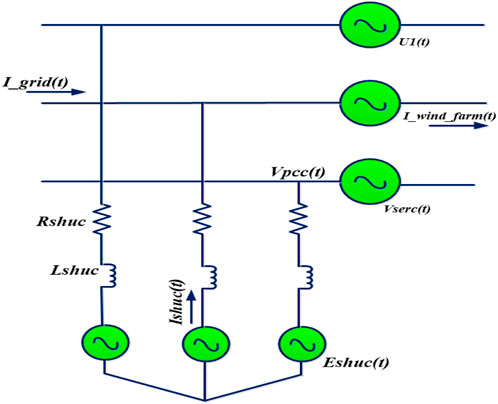
FIGURE 3. Compensator Model for Power Stage at AC side.
Where fi = a,b,c represents either the phase voltage or current, and fi = d,q,0 represents that magnitude transformed to the dqo space. The controlling of UPQC, with rotating frames using a park’s transformation is mentioned in (4) & (5).
It enables the position of a reference frame of the rotating body in the positive direction of the PCC potential space vector. A PLL mechanism determines a reference angle synchronism with the PCC positive sequence fundamental voltage space vector. This makes it possible to get the desired outcome. This study has a PLL that is examined using the “instantaneous power theory”.
Under balanced and equilibrium conditions, the synchronous reference frame’s electric potential and current vectors do not change. This quality is advantageous for study and detached control.
5 Control scheme for UPQC
The WF terminal voltage is maintained at its nominal level by managing the UPQC serial converter (as in Figure 3), which makes up for variations in the PCC voltage. If this is done, the grid-generated voltage disturbances will not be able to reach the WF facilities. If voltage dips occur at the WF terminals due to this control action, it may have the unexpected impact of increasing the LVRT capacity.
Figure 4A explains the series converter controller block diagram. The PCC electric potential is subtracted from the reference electric potential to produce the injected electric potential, which is aligned in phase with the PCC electric potential. The voltage is injected as a result. On the other hand, the UPQC uses its shunt converter to mesh the pulsations of active and reactive power components, which WF causes. As a result, there will not be any pulsations in the electricity that the WF compensator set injects into the grid. Pulsations cause voltage fluctuations that may propagate throughout the system. This action can be finished with the correct electrical current injection into the PCC. Additionally, this converter has been able to normalize the voltage on the DC bus.
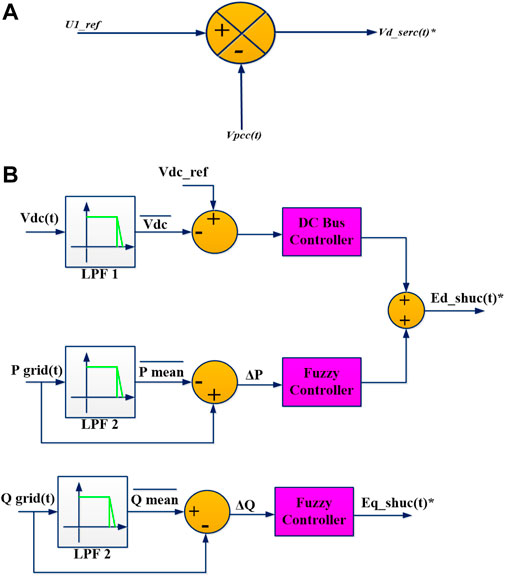
FIGURE 4. (A) controller for series compensator and (B) controller for shunt compensator.
The block architecture of the shunt converter controller is displayed in Figure 4B. The voltage instructions of Ed_shuC* and Eq_shuC* are produced in this way, depending on the variations ΔP and ΔQ, respectively. The deviations are computed by deducting the mean power from the instantaneous power measured in PCC. Filing by low pass filter calculates the expected values of the active and reactive power components. These filters’ bandwidths are altered such that, by the IEC61000-4-15 standard, the fluctuation components for power are chosen as they lie in the flicker band and accept compensation.
Additionally, the control action for the DC–bus voltage loop is contained within Ed_shuC*since its components operate at a frequency that is lower than that of the flicker–band.
In the rotating reference frame, the powers PshuC and QshuC are computed as follows in (6):
The equations other than PCC voltage variation, can be expressed as follows in (7):
Given that the shunt converter is built around a VSI, we must produce sufficient voltage to attain the currents in (6). It is possible by the model of VSI, which is discussed in (Song et al., 2022a), which leads to a linear relationship between the power output and the controlled voltages. Following are the resultant equation in (8):
Proportional controllers have examples of P and Q control loops, whereas the DC–bus loop is an example of a PI controller.
In a nutshell, UPQC is considered a “power buffer” in the suggested strategy, which helps to equalise the power inoculated into the power system grid. This style of operation is conceptually represented by a schematic, which may be found in Figure 5.
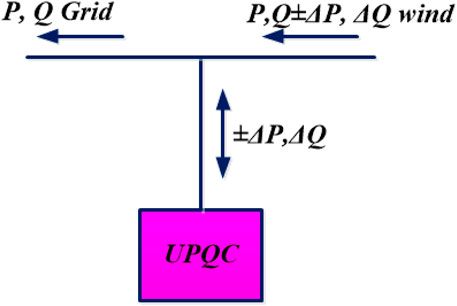
FIGURE 5. Power buffer Concept.
It is crucial to remember that the storage element installed on the bus containing UPQC must uphold its mean power at zero because the bus lacks an external DC supply. This is the situation to protect the system’s integrity. To do this, a well-designed DC voltage controller is essential.
The concept of power buffer may not be executed with a DVR; however, it is possible to do so with a DSTATCOM. A DVR device is more appropriate in this situation than DSTATCOM’s solution since voltage regulation during moderately significant disturbances cannot be effectively managed with just DSTATCOM’s reactive power.
6 Implementation of fuzzy logic controller (FLC)
The enormous potential of fuzzy set theory for effectively addressing the problem’s uncertainty is evident (Raju and Rao, 2015). It is an outstanding mathematical tool for handling ambiguity-related uncertainties. The concept of fuzzification and de-fuzzification is explained in Figure 6A, and the membership functions of fuzzy controller are depicted in Figure 6B.
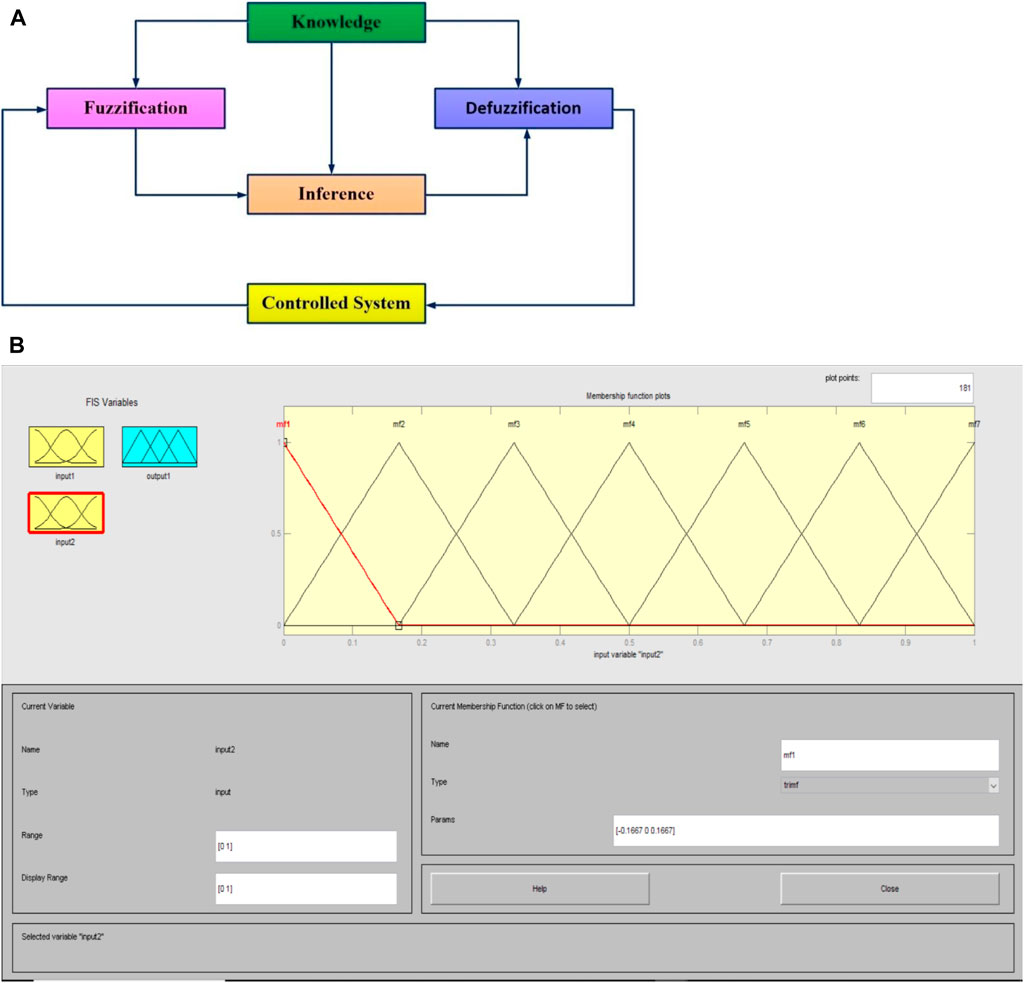
FIGURE 6. (A) Division of fuzzification and (B) membership functions of fuzzy controller.
6.1 Error calculation
The difference between the value as it is now and the reference value that the repeated controller created helps calculate the error signal (errA). Additionally, the RerrA represents the variance in error in the current sampling and its prior sampling. These current signals are measured and transformed to per unit (p.u.) values for each phase.
6.2 FLC
Three subsections make up the FLC section. The following is a summary of these subsections..
6.3 Fuzzification
The fuzzy linguistic variable, which has a crisply defined border, is created by fuzzifying the numerical input variable measurements, and Table 2 reflects the fuzzy rules for using this fuzzification.
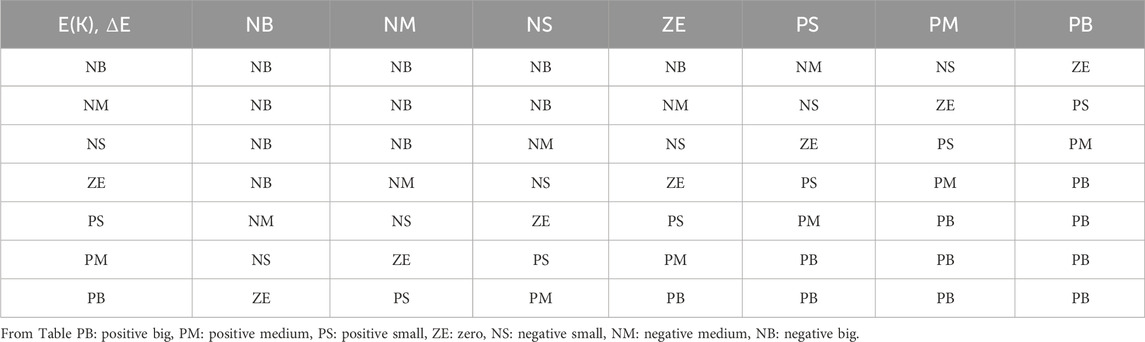
TABLE 2. Fuzzy rules for this case.
6.4 De-fuzzification
Previously represented as linguistic labels by a fuzzy set, the controller outputs are transformed into actual control (analogue) signals during de-fuzzification. For the fuzzy model’s de-fuzzification procedure, the “Sugeno’s Weighted Average” method, a particular application of the “Mamdani Model,” is employed.
Signal processing: The FLC process output creates the control signals. They are compared to the carrier signal to produce switching signals for converters.
7 Results and discussions
Matlab/Simulink software was used to create the prototypical view of the power system scheme depicted in Figure 1. The controllers and the control strategy described in Section III are included in this model. Numerical simulations were carried out to determine and compensate for the voltage fluctuation brought on by variations in wind power and voltage regulation difficulties brought on by a sudden load hook-up.
7.1 Electrical potential fluctuation compensation
Figure 7 displays the simulation results for 0–5 s. The cyclical power pulse the tower shadow effect creates starts when time equals 0.5. As was already established, the tower shadow changes torque, affecting the WF’s active and reactive power components. The frequency of power variation at the minimum wind speed is f = 3.4 Hz, and the resulting magnitude of the electric potential variation at PCC is in (9):
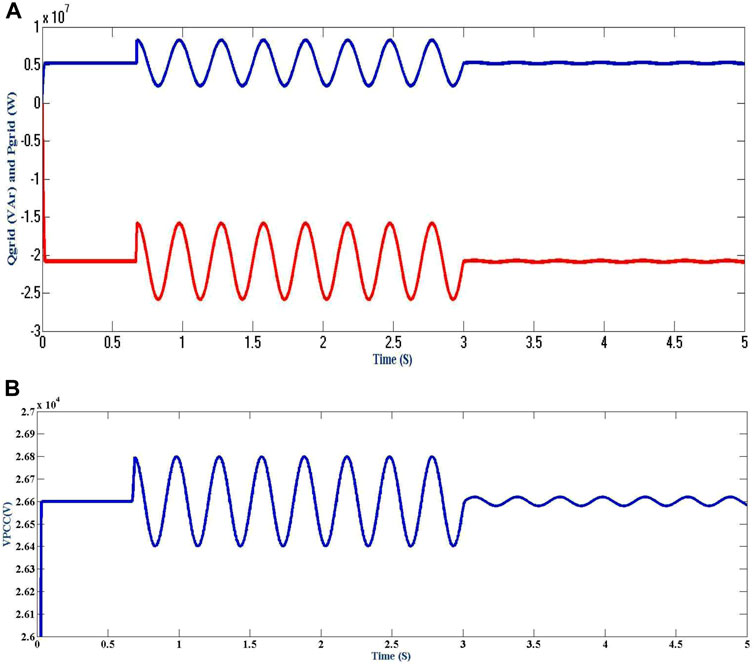
FIGURE 7. (A) Active and reactive power demand’s power component at the power grid side and (B) Electric Potential at PCC.
For 0.5 to 3, the middle curve of Figure 7A shows this voltage fluctuation. The fluctuation’s value exceeds the IEC standard’s maximum allowable limit (Zhu et al., 2022). This shows that the WF has a detrimental effect on the System Power Quality even when everything operates smoothly.
P, Q controllers are turned on at time t = 3.0″, which causes the pulsations of active and reactive power to slow down. The PCC voltage fluctuation’s amplitude has decreased from its prior value of 1.6% (without correction), which was previously used, to this new amount.
Given that it is less than the set permitted maximum limit of 0.5% at 3.4Hz, this number complies with the requirements of the IEC standard.
Figure 7A illustrates the active and reactive power and voltage pulses on the DC side of the UPQC. As can be seen from Figure 7A, the series converter needs very little power to run. However, the shunt converter needs a high instantaneous power level from the capacitor to compensate for changes in active power. The DC side power is unaffected by reactive power compensation. The behaviour of the WF terminal potential is depicted in Figure 7B. The series converter action keeps the WF terminal potential constant independent of the PCC voltage’s behaviour.
According to VSI’s operational features, the voltage level on the DC bus is capped at a specific level. Because the capacitor is in charge of managing the fluctuating active power, the value of the capacitor must be selected so that the DC electric potential “ripple” is in the specified margin.
For instance, a capacitor with a size of C = 0.42 F has been considered. It is simple to quickly obtain this high value by utilizing capacitors based on modern technology, known as ultracapacitors. Figure 8A shows the power in the capacitor of the DC bus, and Figure 8B shows the voltage in the capacitor of the DC bus. It is crucial to remember that when the grid’s measured current flows towards the park, it is optimistic.
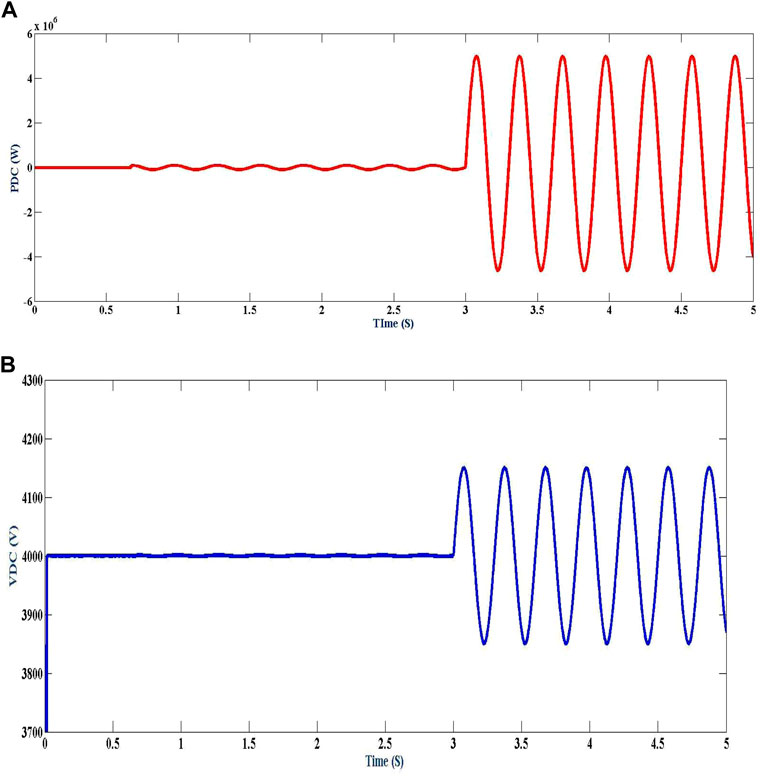
FIGURE 8. (A) Power in the capacitor of DC bus and (B) Voltage in the capacitor of DC bus.
7.2 Regulation of electric potential
The UPQC is used in this section to maintain the steady WF terminal potential while concurrently reducing PCC electric potential variations caused by abrupt engagement or disengagement of loads, power system malfunctions, and other difficulties. At the time t = 6″, the switch labelled SW to L3 is closed, which results in a sudden connection of the load in Figure 1. This load has a PL3 rating of 9.2 MW and a QL3 rating of 9.25 MW. After then, the load is disconnected at a time equal to 10 s.
Power in the capacitor terminal voltages and the series injected voltage are displayed in Figure 9 for the “a” phase. Because of the action of the series converter, the figure shows a dramatic shift in the voltage at the PCC terminals, while the voltage at the WF terminals remains practically unchanged. As a result, the active power stage for a series converter is the same as the power for a shunt converter but has the opposite sign. Figure 10 and Figure 11 also explain the DC-bus voltage and the control action of VDC, both of which are extremely obvious. VDC’s mean value is maintained at the reference level. However, the ripple is not muted.
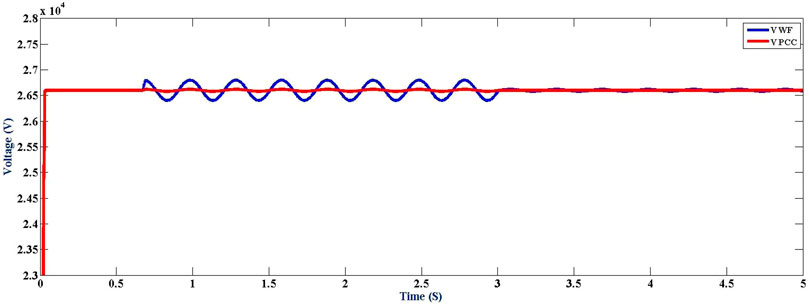
FIGURE 9. Electric Potentials of WF and PCC are shown in phase.
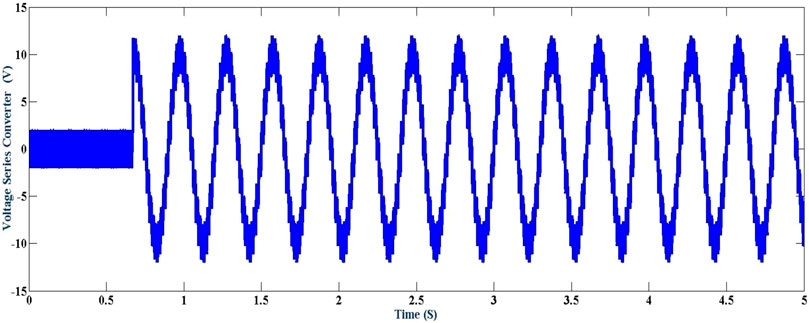
FIGURE 10. Series injected electric potential for the “a" phase.
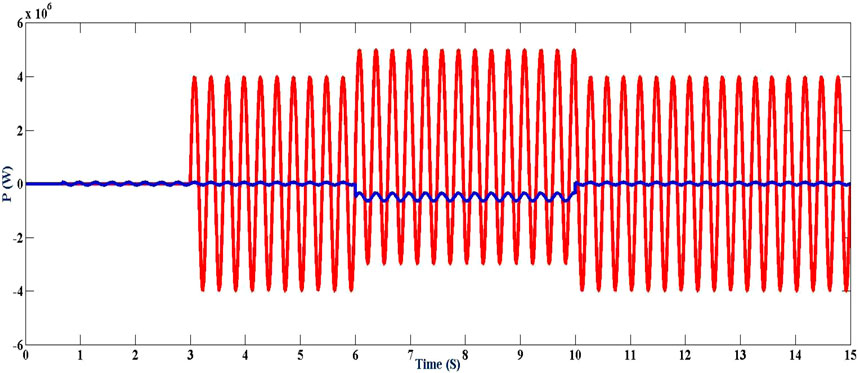
FIGURE 11. DC bus shunt and series active power.
The midpoint power injected or engrossed by the series converter is inserted or absorbed by the converter in a shunt as a result of the functioning of the loop for regulating DC voltage depicted in Figure 12.
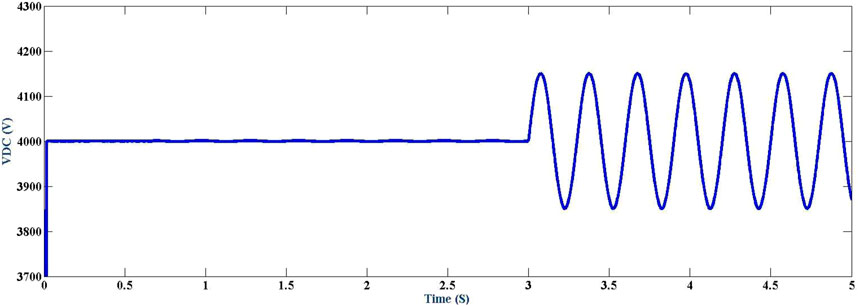
FIGURE 12. Bus potential at DC.
7.3 By using a fuzzy controller
The analysis was repeated by using a fuzzy controller and the results can be shown from Figure 13 Figure 14 Figure 15 Figure 16 Figure 17 Figure 18 Figure 19 Figure 20 to Figure 21.
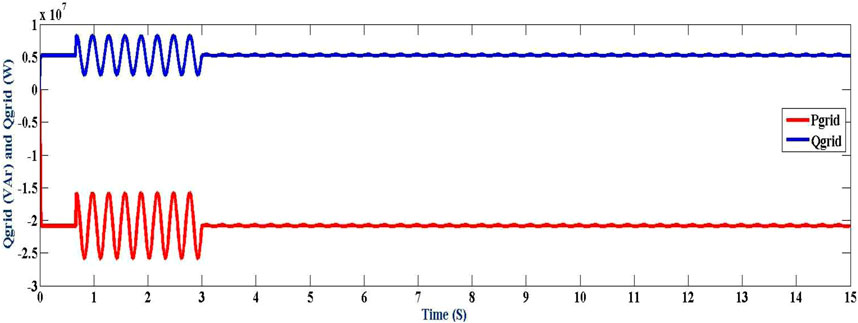
FIGURE 13. Power grid-side active and reactive power consumption.
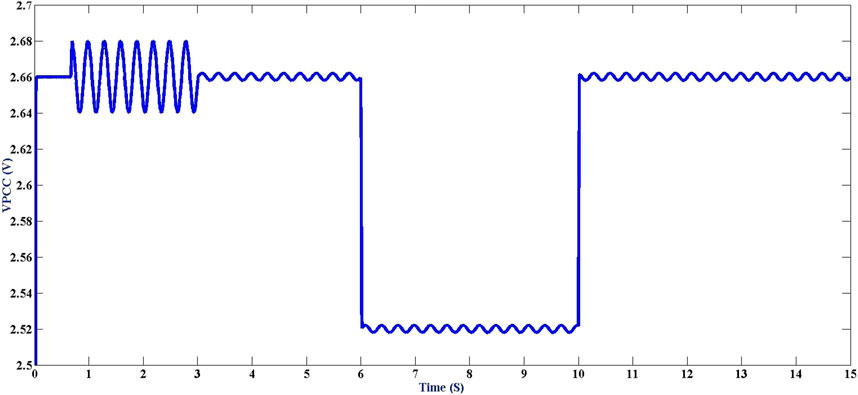
FIGURE 14. Potential at PCC.
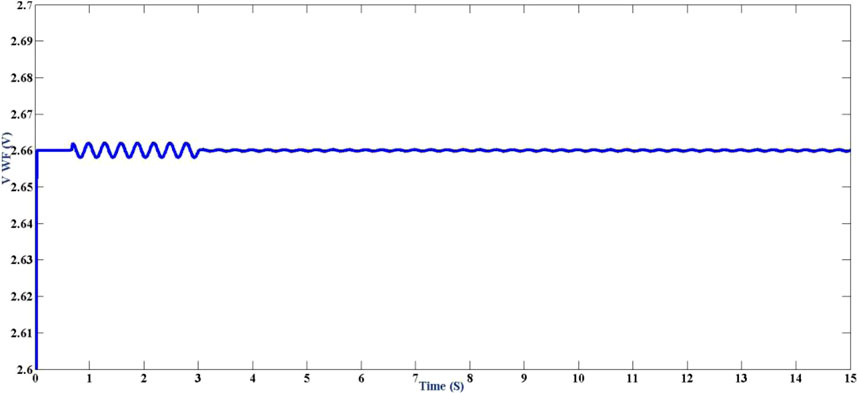
FIGURE 15. WF terminal Potentials.

FIGURE 16. Power in the capacitor at the DC bus.
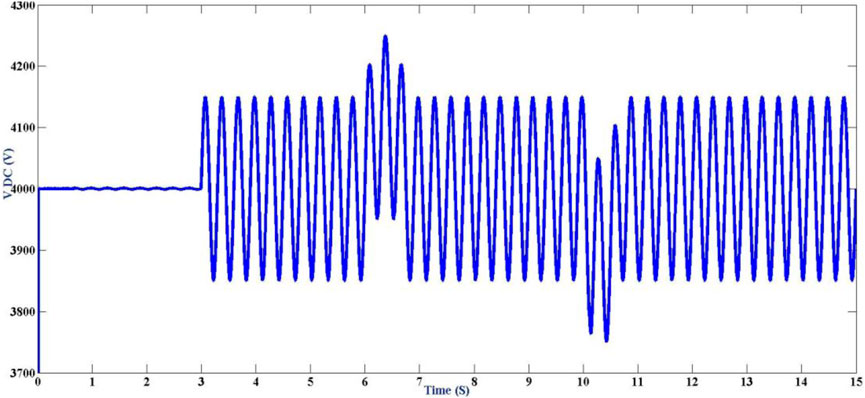
FIGURE 17. Capacitor potential in the DC bus.
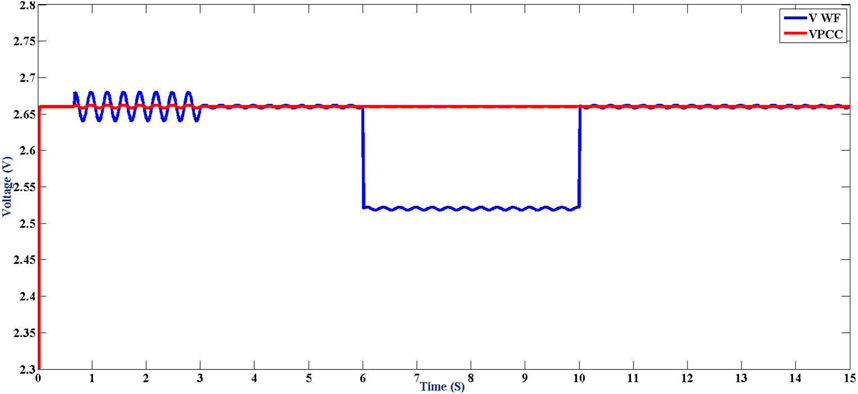
FIGURE 18. Potential at PCC in a phase of WF.
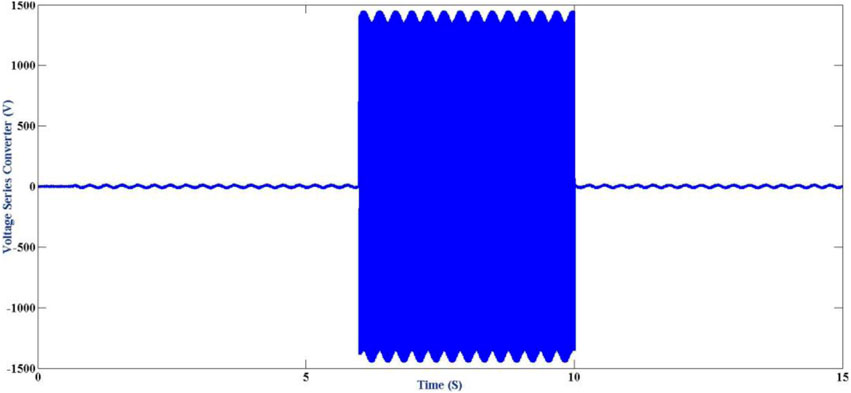
FIGURE 19. Voltage injected in series at “a” phase.
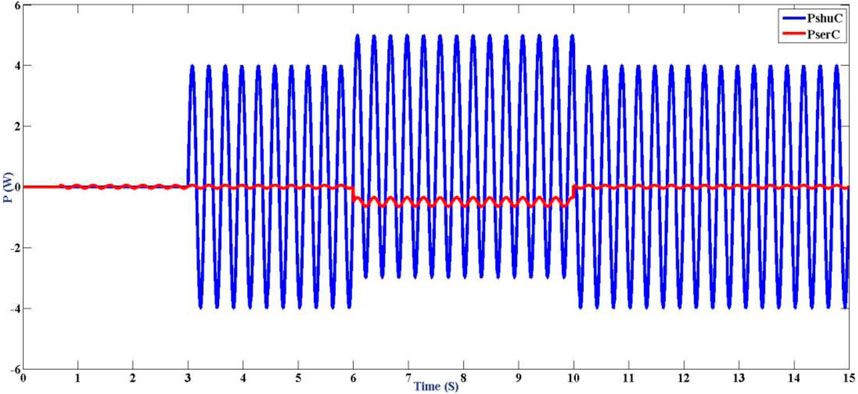
FIGURE 20. The DC bus’s shunt power and series power.
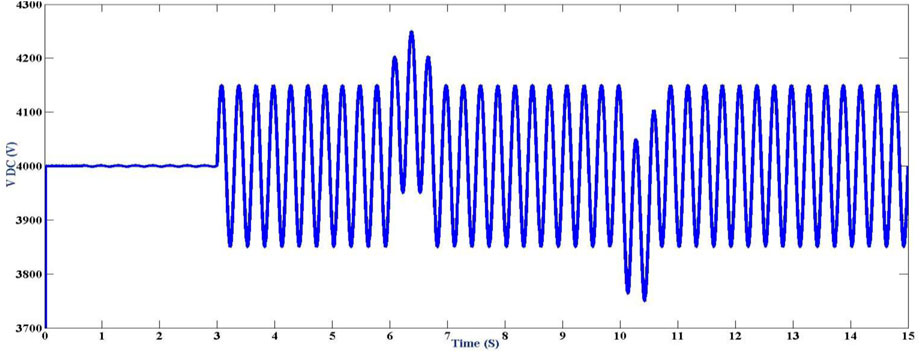
FIGURE 21. DC bus voltage.
8 Discussion of paper outcome
The UPQC and fuzzy logic controller results clearly illustrate the power demand potential of the PCC series and shunt compensators’ injected power. However, here, we proposed a fuzzy logic controller implementation to the same system; with this, we are maintaining all the parameters are the same, but the THD value of the Fuzzy system with the PI controller is meagre, i.e., 2.81% in comparison to the UPQC system of 5.13%. Shown in Figure 22A,B, the outcomes of the simulations demonstrate that the proposed compensation technique is beneficial in improving the Quality of power and stability in WF.
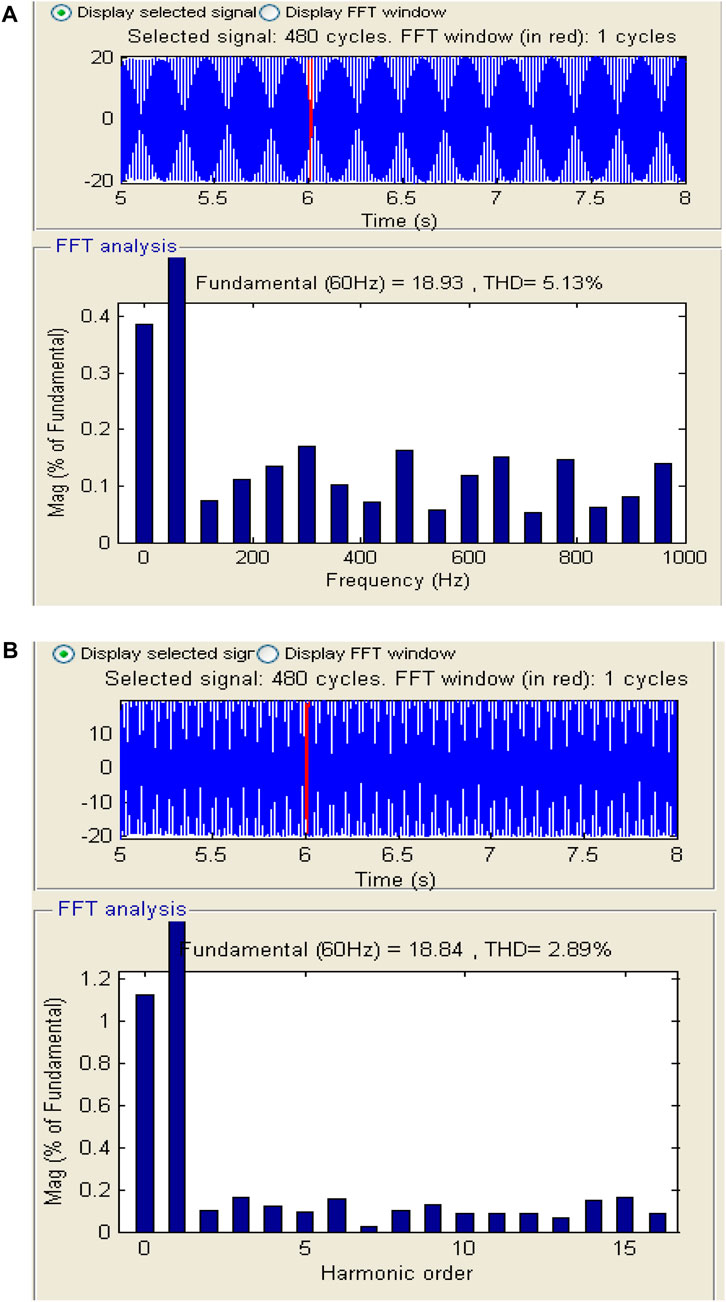
FIGURE 22. (A) FFT analysis with UPQC controller and (B) FFT analysis with fuzzy controller.
9 Conclusion
The article presents a newfangled compensation stratagem built by a UPQC compensator to link SCIG wind farms to feeble power grids. The recommended compensating technique raises the system’s power quality by utilizing the wholly DC energy storage and the active power sharing across UPQC converters. The DVR and DSTATCOM compensators do not include these features. The THD of the fuzzy controller improved the UPQC controller. The simulation’s outcomes explain that it is possible to regulate the voltage induced by an unexpected load connection and reject the power fluctuations caused by the “tower shadow effect” with satisfactory results. The research example thus shows that the suggested compensation scheme accomplishes its objectives. The performance levels of the various types of compensators will be compared in future research.
Data availability statement
The original contributions presented in the study are included in the article/Supplementary material, further inquiries can be directed to the corresponding authors.
Author contributions
MP: Conceptualization, Data curation, Formal Analysis, Funding acquisition, Investigation, Methodology, Project administration, Resources, Software, Supervision, Validation, Visualization, Writing–original draft, Writing–review and editing. KG: Conceptualization, Data curation, Formal Analysis, Funding acquisition, Investigation, Methodology, Project administration, Resources, Software, Supervision, Validation, Visualization, Writing–original draft, Writing–review and editing. BS: Conceptualization, Data curation, Formal Analysis, Funding acquisition, Investigation, Methodology, Project administration, Resources, Software, Supervision, Validation, Visualization, Writing–original draft, Writing–review and editing. MK: Conceptualization, Data curation, Formal Analysis, Funding acquisition, Investigation, Methodology, Project administration, Resources, Software, Supervision, Validation, Visualization, Writing–original draft, Writing–review and editing. CR: Conceptualization, Data curation, Formal Analysis, Funding acquisition, Investigation, Methodology, Project administration, Resources, Software, Supervision, Validation, Visualization, Writing–original draft, Writing–review and editing. HK: Conceptualization, Data curation, Formal Analysis, Funding acquisition, Investigation, Methodology, Project administration, Resources, Software, Supervision, Validation, Visualization, Writing–original draft, Writing–review and editing. KA: Software, Supervision, Validation, Visualization, Writing–original draft, Writing–review and editing, Conceptualization, Data curation, Formal Analysis, Funding acquisition, Investigation, Methodology, Project administration, Resources. AY: Conceptualization, Data curation, Formal Analysis, Funding acquisition, Investigation, Methodology, Project administration, Resources, Software, Supervision, Validation, Visualization, Writing–original draft, Writing–review and editing.
Funding
The author(s) declare that no financial support was received for the research, authorship, and/or publication of this article.
Conflict of interest
The authors declare that the research was conducted in the absence of any commercial or financial relationships that could be construed as a potential conflict of interest.
Publisher’s note
All claims expressed in this article are solely those of the authors and do not necessarily represent those of their affiliated organizations, or those of the publisher, the editors and the reviewers. Any product that may be evaluated in this article, or claim that may be made by its manufacturer, is not guaranteed or endorsed by the publisher.
References
Chen, C., Wu, X., Yuan, X., and Zheng, X. (2022). A new technique for the subdomain method in predicting electromagnetic performance of surface-mounted permanent magnet motors with shaped magnets and a quasi-regular polygon rotor core. IEEE Trans. Energy Conversion 38, 1396–1409. doi:10.1109/TEC.2022.3217042
Chishti, F., Murshid, S., and Singh, B. (2020). Weak grid intertie WEGS with hybrid generalized integrator for power quality improvement. IEEE Trans. Ind. Electron. 67 (2), 1113–1123. doi:10.1109/TIE.2019.2898598
Damchi, Y., and Eivazi, A. (2022). Power swing and fault detection in the presence of wind farms using generator speed zero-crossing moment. Int. Trans. Electr. Energy Syst. 2022, 1–17. doi:10.1155/2022/2569810
Duan, Y., Zhao, Y., and Hu, J. (2023). An initialization-free distributed algorithm for dynamic economic dispatch problems in microgrid: modeling, optimization and analysis. Sustain. Energy, Grids Netw. 34, 101004. doi:10.1016/j.segan.2023.101004
Hao, Y., Liang, J., Wang, K., Wu, G., Joseph, T., and Sun, R. (2020). Influence of active power output and control parameters of full-converter wind farms on sub-synchronous oscillation characteristics in weak grids. Energies 5225, 1–17. doi:10.3390/en13195225
Huang, N., Chen, Q., Cai, G., Xu, D., Zhang, L., and Zhao, W. (2021). Fault diagnosis of bearing in wind turbine gearbox under actual operating conditions driven by limited data with noise labels. IEEE Trans. Instrum. Meas. 70, 1–10. doi:10.1109/TIM.2020.3025396
Li, P., Hu, J., Qiu, L., Zhao, Y., and Ghosh, B. K. (2022b). A distributed economic dispatch strategy for power–water networks. IEEE Trans. Control Netw. Syst. 9 (1), 356–366. doi:10.1109/TCNS.2021.3104103
Li, S., Zhao, X., Liang, W., Hossain, M. T., and Zhang, Z. (2022a). A fast and accurate calculation method of line breaking power flow based on taylor expansion. Front. Energy Res. 10. doi:10.3389/fenrg.2022.943946
Lin, L., Zhang, J., Gao, X., Shi, J., Chen, C., and Huang, N. (2023). Power fingerprint identification based on the improved V-I trajectory with color encoding and transferred CBAM-ResNet. PloS one 18 (2), e0281482. doi:10.1371/journal.pone.0281482
Liu, H., Wang, W., Cui, J., and Tang, F. (2018). Optimal power factor regulation of dispersed wind farms under diverse load and stochastic wind conditions based on improved firefly algorithm. Math. Probl. Eng. 2018, 1–11. doi:10.1155/2018/6203278
Liu, Y., Liu, X., Li, X., Yuan, H., and Xue, Y. (2023). Model predictive control-based dual-mode operation of an energy-stored quasi-Z-source photovoltaic power system. IEEE Trans. Industrial Electron. 70 (9), 9169–9180. doi:10.1109/TIE.2022.3215451
Lu, L., Wu, W., Gao, Y., Pan, C., Yu, X., Zhang, C., et al. (2022). Study on current discrepancy and redistribution of HTS non-insulation closed-loop coils during charging/discharging and subsequent transient process toward steady-state operation. Supercond. Sci. Technol. 35 (9), 095001. doi:10.1088/1361-6668/ac7dfe
Miaofen, L., Youmin, L., Tianyang, W., Fulei, C., and Zhike, P. (2023). Adaptive synchronous demodulation transform with application to analyzing multicomponent signals for machinery fault diagnostics. Mech. Syst. Signal Process. 191, 110208. doi:10.1016/j.ymssp.2023.110208
Morgan, M. Y., El-Deib, A. A., and El-Marsafawy, M. (2018). Wind farm dynamic models assessment under weak grid conditions. IET Renew. Power Gener. 12 (12), 1325–1334. doi:10.1049/iet-rpg.2017.0292
Nie, Y., Wang, H., Gao, L., Wu, C., and Xi, M. (2022). Adaptive parameter estimation for static var generators based on wind speed fluctuation of wind farms. Int. Trans. Electr. Energy Syst. 2022, 1–12. doi:10.1155/2022/3877777
Raju, K. G., and Rao, K. V. G., “Fuzzy – genetic algorithm approach for fact placement in electrical power system,” no. 1, pp. 17, 2015.
Rao, K. V. G., Kiran Kumar, M., and Srikanth Goud, B. (2023). An independently controlled two output half bridge resonant LED driver. Electr. Power Components Syst. 0 (0), 1–21. doi:10.1080/15325008.2023.2238695
Ray, P., Ray, P. K., and Kumar Dash, S. (2021). Power quality enhancement and power flow analysis of a PV integrated UPQC system in a distribution network. IEEE Trans. Industry Appl. 58 (1), 201–211. doi:10.1109/tia.2021.3131404
Sang, S., Zhang, C., Cai, X., Molinas, M., Zhang, J., and Rao, F. (2019). Control of a type-IV wind turbine with the capability of robust grid-synchronization and inertial response for weak grid stable operation. IEEE Access 7, 58553–58569. doi:10.1109/ACCESS.2019.2914334
Shirkhani, M., Tavoosi, J., Danyali, S., Sarvenoee, A. K., Abdali, A., Mohammadzadeh, A., et al. (2023). A review on microgrid decentralized energy/voltage control structures and methods. Energy Rep. 10, 368–380. doi:10.1016/j.egyr.2023.06.022
Song, J., Mingotti, A., Zhang, J., Peretto, L., and Wen, H. (2022a). Fast iterative-interpolated DFT phasor estimator considering out-of-band interference. IEEE Trans. Instrum. Meas. 71, 1–14. doi:10.1109/TIM.2022.3203459
Song, J., Mingotti, A., Zhang, J., Peretto, L., and Wen, H. (2022b). Accurate damping factor and frequency estimation for damped real-valued sinusoidal signals. IEEE Trans. Instrum. Meas. 71, 1–4. doi:10.1109/TIM.2022.3220300
Song, X., Wang, H., Ma, X., Yuan, X., and Wu, X. (2023). Robust model predictive current control for a nine-phase open-end winding PMSM with high computational efficiency. IEEE Trans. Power Electron. 38 (11), 13933–13943. doi:10.1109/TPEL.2023.3309308
Srikanth, G., Venkata Sai Kalyani, T., Venkata Govardhan Rao, K., and Sanjeev, G. (2023). Amalgamation of smart grid with renewable energy eources. International J. of Smart Grid-ijSmartGrid 7 (2), 103–107. doi:10.20508/ijsmartgrid.v7i2.289.g276
Sun, Q., Lyu, G., Liu, X., Niu, F., and Gan, C. (2023). Virtual current compensation-based quasi-sinusoidal-wave excitation scheme for switched reluctance motor drives. IEEE Trans. Industrial Electron., 1–11. doi:10.1109/TIE.2023.3333056
Venkata Govardhan Rao, K., Kumar, M. K., Goud, B. S., Bajaj, M., Abou Houran, M., and Kamel, S. (2022). Design of a bidirectional DC/DC converter for a hybrid electric drive system with dual-battery storing energy. Front. Energy Res. 10 (November), 1–19. doi:10.3389/fenrg.2022.972089
Wang, H., Wang, B., Luo, P., Ma, F., Zhou, Y., and Mohamed, M. A. (2022b). State evaluation based on feature identification of measurement data: for resilient power system. CSEE J. Power Energy Syst. 8 (4), 983–992. doi:10.17775/CSEEJPES.2021.01270
Wang, Y., Chen, P., Yong, J., Xu, W., Xu, S., and Liu, K. (2022a). A comprehensive investigation on the selection of high-pass harmonic filters. IEEE Trans. Power Deliv. 37 (5), 4212–4226. doi:10.1109/TPWRD.2022.3147835
Wang, Y., Xia, F., Wang, Y., and Xiao, X. (2023). Harmonic transfer function based single-input single-output impedance modeling of LCCHVDC systems. J. Mod. Power Syst. Clean Energy. doi:10.35833/MPCE.2023.000093
Xiao, S., Wang, Z., Wu, G., Guo, Y., Gao, G., Zhang, X., et al. (2023). Critical assessment of the delivery methods of chemical and natural postharvest preservatives for fruits and vegetables: a review. IEEE Trans. Transp. Electrification, 1–23. doi:10.1080/10408398.2023.2289071
Xie, X., and Sun, Y. (2022). A piecewise probabilistic harmonic power flow approach in unbalanced residential distribution systems. Int. J. Electr. Power and Energy Syst. 141, 108114. doi:10.1016/j.ijepes.2022.108114
Yan, C., Yao, W., Wen, J., Fang, J., Ai, X., and Wen, J. (2020). Modelling and comparison analysis of grid-connected DFIG-based wind farm in weak grid. IET Renew. Power Gener. 14 (13), 2406–2415. doi:10.1049/iet-rpg.2019.1382
Yang, C., Wu, Z., Li, X., and Fars, A. (2024). Risk-constrained stochastic scheduling for energy hub: integrating renewables, demand response, and electric vehicles. Energy 288, 129680. doi:10.1016/j.energy.2023.129680
Yang, J., Zhang, R., Sun, Q., and Zhang, H. (2015). Optimal wind turbines micrositing in onshore wind farms using fuzzy genetic algorithm. Math. Probl. Eng. 2015, 1–9. doi:10.1155/2015/324203
Yang, Y., Zhang, Z., Zhou, Y., Wang, C., and Zhu, H. (2023). Design of a simultaneous information and power transfer system based on a modulating feature of magnetron. IEEE Trans. Microw. Theory Tech. 71 (2), 907–915. doi:10.1109/TMTT.2022.3205612
Yuan, S., Hao, Z., Zhang, T., Yuan, X., and Shu, J. (2019). Impedance modeling based method for sub/supsynchronous oscillation analysis of D-PMSG wind farm. Appl. Sci. 2813, 1–16. doi:10.3390/app9142831
Zhang, X., Gong, L., Zhao, X., Li, R., Yang, L., and Wang, B. (2023). Voltage and frequency stabilization control strategy of virtual synchronous generator based on small signal model. Energy Rep. 9, 583–590. doi:10.1016/j.egyr.2023.03.071
Zhu, L., Li, Z., and Hou, K. (2022). Effect of radical scavenger on electrical tree in cross-linked polyethylene with large harmonic superimposed DC voltage. High. Volt. 8, 739–748. doi:10.1049/hve2.12302
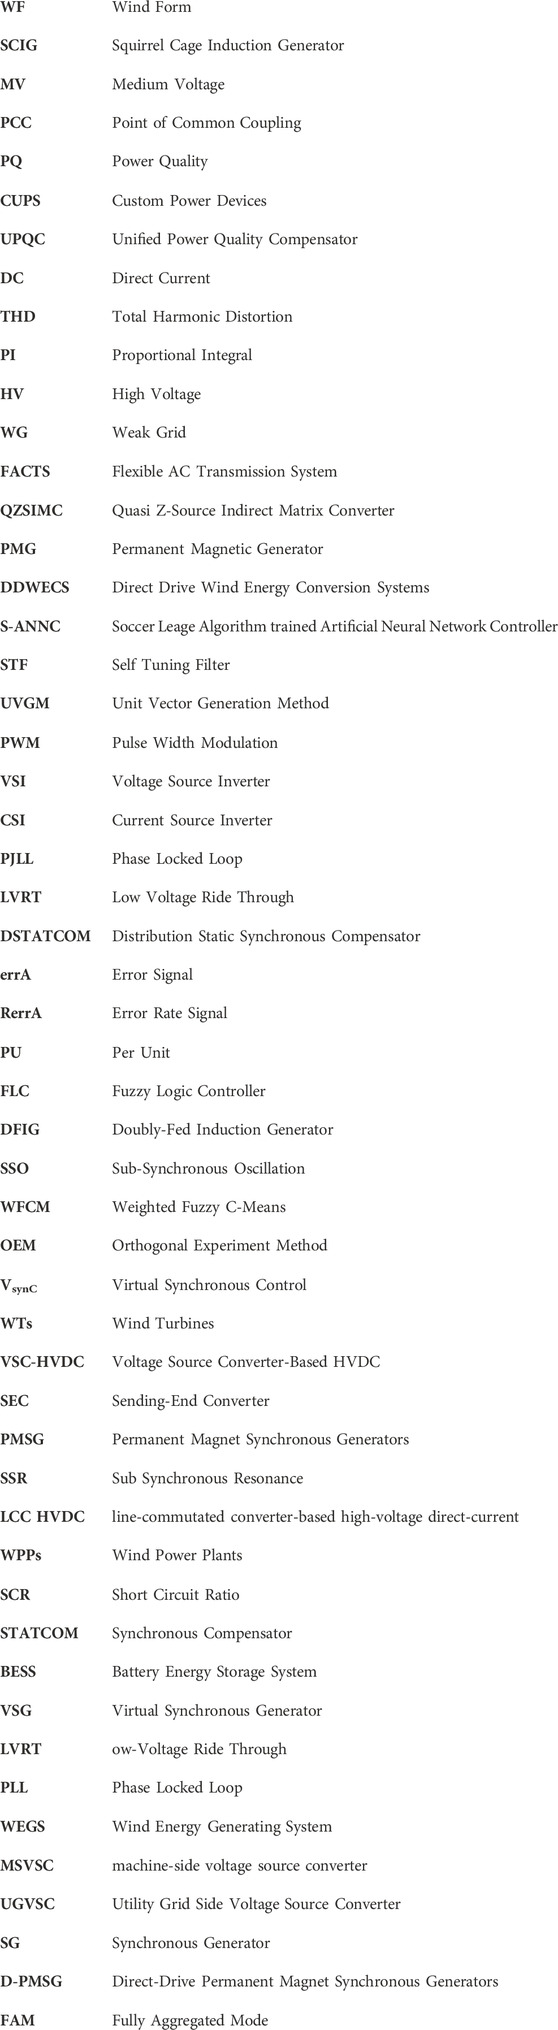
Nomenclature
Keywords: wind energy, UPQC, SCIG, voltage fluctuation, feeble grid, fuzzy
Citation: Pushkarna M, Govardhan Rao KV, Goud BS, Kumar MK, Reddy CR, Kotb H, AboRas KM, Alharthi YZ and Yousef A (2024) A new-fangled connection of UPQC tailored power device from wind farm to weak-grid. Front. Energy Res. 12:1355867. doi: 10.3389/fenrg.2024.1355867
Received: 14 December 2023; Accepted: 11 January 2024;
Published: 01 February 2024.
Edited by:
Praveen Kumar Balachandran, Vardhaman College of Engineering, IndiaReviewed by:
Sudhakar Babu Thanikanti, Chaitanya Bharathi Institute of Technology, IndiaKasi Ramakrishnareddy Ch, Vasavi College of Engineering, India
Pratikanta Mishra, SRM University, India
Copyright © 2024 Pushkarna, Govardhan Rao, Goud, Kumar, Reddy, Kotb, AboRas, Alharthi and Yousef. This is an open-access article distributed under the terms of the Creative Commons Attribution License (CC BY). The use, distribution or reproduction in other forums is permitted, provided the original author(s) and the copyright owner(s) are credited and that the original publication in this journal is cited, in accordance with accepted academic practice. No use, distribution or reproduction is permitted which does not comply with these terms.
*Correspondence: Kareem M. AboRas, a2FyZWVtLmFib3Jhc0BhbGV4dS5lZHUuZWc=; Amr Yousef, YS55b3VzZWZAdWJ0LmVkdS5zYQ==; Mukesh Pushkarna, bXVrZXNoLnB1c2hrYXJuYUBnbGEuYWMuaW4=