 Juanjuan Yang
- School of Financial Technology, Suzhou Industrial Park Institute of Services Outsourcing, Suzhou, Jiangsu, China
Introduction: In the context of energy resource scarcity and environmental pressures, accurately forecasting energy consumption and optimizing financial strategies in smart grids are crucial. The high dimensionality and dynamic nature of the data present significant challenges, hindering accurate prediction and strategy optimization.
Methods: This paper proposes a fusion algorithm for smart grid enterprise decision-making and economic benefit analysis, aiming to enhance decision-making accuracy and predictive capability. The method combines deep reinforcement learning (DRL), long short-term memory (LSTM) networks, and the Transformer algorithm. LSTM is utilized to process and analyze time series data, capturing historical patterns of energy prices and usage. Subsequently, DRL and the Transformer algorithm are employed to further analyze the data, enabling the formulation and optimization of energy purchasing and usage strategies.
Results: Experimental results demonstrate that the proposed approach outperforms traditional methods in improving energy cost prediction accuracy and optimizing financial strategies. Notably, on the EIA Dataset, the proposed algorithm achieves a reduction of over 48.5% in FLOP, a decrease in inference time by over 49.8%, and an improvement of 38.6% in MAPE.
Discussion: This research provides a new perspective and tool for energy management in smart grids. It offers valuable insights for handling other high-dimensional and dynamically changing data processing and decision optimization problems. The significant improvements in prediction accuracy and strategy optimization highlight the potential for widespread application in the energy sector and beyond.
1 Introduction
With the development of the power industry, power companies are facing increasingly complex market environments and growing energy consumption demands. Accurately predicting power demand and intelligent grid energy consumption has become crucial. It assists power companies in demand forecasting and market planning, optimizing resource allocation and supply-demand matching, and thereby formulating more reasonable power scheduling and market operation strategies Zheng et al. (2023), Mohanty et al. (2022). However, energy cost prediction and financial strategy optimization face several challenges Chen et al. (2023). Firstly, the high dimensionality and dynamics of the data increase the demand for computational resources and time complexity, especially when dealing with large-scale datasets. This limits the scalability and practical applicability of the methods. Secondly, the generalizability of existing methods to other datasets and real-world scenarios needs further research. Additionally, the scalability of methods in more complex and dynamic large-scale intelligent grid systems also requires exploration Wang et al. (2023).
Accurate prediction of energy costs and optimized financial decision-making are essential for enhancing energy utilization efficiency and reaping economic benefits. The advancements in deep learning and machine learning models have opened up new possibilities for addressing these challenges Mohammadi et al. (2022), Abou Houran et al. (2023), Bao et al. (2022). Here, we present five commonly used models in the field of energy cost forecasting and financial strategy optimization in smart grids, namely, deep learning and machine learning models. We discuss the advantages and disadvantages of each model and highlight the motivation behind the proposed works.
• Generative Adversarial Network (GAN): The comprises a generator and a discriminator that operate within an adversarial training framework to generate realistic samples. GANs have shown significant potential in various areas, including image generation and data augmentation Yanmei et al. (2023), Ruan et al. (2023). However, one of the challenges encountered in GAN training is its inherent instability Hu et al. (2023).
• Support Vector Machine (SVM): SVM is a widely used supervised learning algorithm for classification and regression problems. It determines an optimal hyperplane in a high-dimensional feature space to perform classification Alquthami et al. (2022). SVM exhibits good generalization ability and is effective in handling high-dimensional data Tiwari et al. (2022).
• Random Forest: Random Forest is an ensemble learning method comprised of multiple decision trees. Each decision tree makes predictions by randomly selecting and splitting features. Random Forest is suitable for classification and regression tasks and offers robustness and interpretability Priyadarshini et al. (2022).
• Reinforcement Learning (RL): RL is a learning method where an agent learns optimal behavior policies through interactions with the environment. The agent learns and optimizes through trial-and-error and reward mechanisms. In the context of smart grids, RL can be utilized to optimize energy procurement and usage strategies, aiming for cost minimization or performance maximization Tiwari et al. (2022).
• Autoencoder (AE): AE is used to learn compact representations of data by utilizing an encoder and a decoder for data reconstruction. AE finds applications in data compression and feature extraction, among others Takiddin et al. (2022), Said and Alanazi (2023).
This study aims to explore methods and technologies that can effectively address the challenges related to energy cost forecasting and financial strategy optimization in the power industry. Specifically, the study intends to propose a hybrid method that combines algorithm optimization [DRL Huang et al. (2022); Li et al. (2023), LSTM Chien et al. (2023); Amalou et al. (2022) and Transformer algorithms Nazir et al. (2023); Liao and Radhakrishnan (2022)], improved model structure, and integration of domain knowledge. The ultimate goal is to enhance the accuracy, efficiency, and stability of energy cost forecasting and financial strategy optimization. By optimizing algorithms, refining the model structure, and incorporating relevant domain knowledge, this study aims to significantly improve the prediction accuracy and overall performance of the proposed method. This will enable power companies to more accurately predict power demand and smart grid energy consumption, provide support for market planning and resource management, and thus formulate more reasonable power dispatching and market operation strategies. This will contribute to the sustainable development of the power industry, improve energy utilization efficiency, reduce waste and reduce carbon emissions. The article makes three key contributions:
• Ensemble Algorithm: This study introduces a novel approach that combines DRL, LSTM, and Transformer algorithm. DRL is utilized to optimize financial strategies, while LSTM and Transformer models are employed for accurate energy cost forecasting. This integration enables improved decision-making within the smart grid domain.
• Improvement in Decision Accuracy: Through the application of the LSTM and Transformer algorithms fusion algorithm, this paper enhances the accuracy of decision-making in smart grid enterprises. The LSTM model aiding in accurate predictions of future power demand. The generation of diverse scenarios provides comprehensive information for decision-making, enabling enterprises to better assess the impact of decisions on economic benefits.
• Financial Strategy Optimization: This study proposes employing DRL to optimize financial strategies within smart grids. By training an agent to interact with the environment, the DRL algorithm learns to make optimal decisions regarding energy procurement, pricing, and financial transactions. This optimization process leads to cost reductions and improved financial performance in smart grid operations.
This study presents a comprehensive framework that combines DRL, LSTM, and Transformer algorithms to address energy cost forecasting and financial strategy optimization in smart grids. The proposed approach has the potential to enhance the efficiency, reliability, and sustainability of smart grid systems.
2 Related work
2.1 Reinforcement learning (RL)
RL is a machine learning method that enables agents to learn optimal strategies by interacting with their environment Fragkos et al. (2022). In the context of the smart grid, it finds application in optimizing financial strategies, including energy procurement and pricing decisions. The agent takes actions based on feedback from the environment, known as reward signals, and iteratively enhances its strategy through trial and error. This approach is extensively employed in domains like energy cost prediction and financial strategy optimization to improve decision-making and adapt to intricate environments Rouzbahani et al. (2023). RL has emerged as a promising technique in the fields of energy cost prediction and financial strategy optimization. In these domains, RL is applied by formulating the problems as sequential decision-making tasks. Specifically, in energy cost prediction, RL agents interact with the environment, which includes energy consumption data, weather information, and other relevant factors. The agents learn to take actions such as adjusting energy usage or switching to alternative energy sources in order to optimize energy costs.
RL in energy cost prediction offers several advantages. Firstly, RL models exhibit adaptability and flexibility. They can adapt to variations in energy consumption patterns and external factors by continuously learning and updating their strategies. Additionally, RL allows for the incorporation of complex constraints and objectives into the cost prediction process, such as environmental sustainability or demand response requirements. Furthermore, RL agents can consider long-term effects and plan for future energy cost optimization by optimizing strategies based on time-accumulated rewards. It receive rewards or penalties based on the accuracy of their cost predictions and the differences from actual energy costs. Through continuous learning from these rewards, the agents improve their prediction and cost optimization strategies.
However, there are certain limitations associated with RL in energy cost prediction. Firstly, RL models often demand significant computational resources due to the iterative nature of the learning process and the complexity of the environment and decision space. This can pose computational challenges, particularly for large-scale energy datasets. Secondly, RL models rely on large amounts of historical data to learn effective cost prediction and optimization strategies. The availability and quality of data may be limited in certain cases, hindering the performance of RL models. Lastly, RL models can be challenging to interpret, making it difficult to explain the decision-making process and specific reasons behind their predictions, which may be a concern in practical applications.
2.2 Random forest
Random Forest is an ensemble learning model that combines multiple decision trees to make predictions. It is utilized for energy cost forecasting and optimizing financial strategies. Random Forest demonstrates excellent generalization ability, interpretability, and resistance to overfitting. Moreover, it performs effectively when handling large-scale data and high-dimensional features. The model at hand employs the construction of multiple decision trees and the aggregation of their predictive outcomes to facilitate forecasting and decision-making Zhang et al. (2022), Durairaj et al. (2022).
Random Forest finds utility in energy cost prediction, specifically in anticipating energy demand and associated expenses. By utilizing historical energy data, weather information, and other pertinent factors, the model trains numerous decision trees, each of which predicts energy costs. The aggregation or averaging of predictions from these trees yields more accurate energy cost forecasts. In the realm of financial strategy optimization, Random Forest proves valuable in optimizing investment portfolios and managing risk. Through the use of historical financial data, market indicators, and other relevant factors, the model trains multiple decision trees to predict portfolio returns. The aggregation of predictions from these trees results in enhanced portfolio forecasts and risk assessments.
The primary advantage of Random Forest lies in its ability to deliver high prediction accuracy by amalgamating the predictions of multiple decision trees. The model effectively processes extensive datasets and intricate feature relationships, thereby enhancing overall performance. Furthermore, Random Forest exhibits robustness against overfitting. By incorporating random sampling and feature selection during decision tree construction, the model mitigates the risk of overfitting and improves generalization capabilities.
However, Random Forest does possess certain limitations. Firstly, it exhibits limited interpretability, rendering the explanation of its predictions challenging. Given that the model comprises multiple independent decision trees, comprehending the overall decision-making process becomes intricate. Secondly, Random Forest necessitates considerable computational resources during both the construction and prediction phases. The construction of multiple decision trees and the subsequent aggregation of predictions contribute to heightened computational costs and time consumption.
2.3 Deep generative model
Deep Generative Model (DGM) is a class of models that can learn the distribution of data generation, such as GAN and Variational Autoencoders (VAEs). In the context of energy cost forecasting and financial strategy optimization, Deep Generative Models can be used to generate synthetic energy consumption data or financial data. These synthetic datasets can be utilized to simulate different market scenarios and optimize strategies. Such as VAE and GAN, DGMs belong to a class of machine learning models that can learn the latent distribution of data and generate new samples similar to the training data. DGMs can generate synthetic samples that closely resemble real energy consumption data, enabling the exploration of diverse scenarios and hypothesis analysis Dumas et al. (2022), Langevin et al. (2023). DGMs have become powerful tools in the fields of energy cost prediction and financial strategy optimization. In this section, we will provide a detailed overview of the specific applications, advantages, and limitations of DGMs in these domains.
The advantages of employing deep generative models in energy cost prediction lie in their ability to model complex temporal and spatial dependencies within energy consumption data, thereby enhancing the accuracy of predictions. DGMs can generate synthetic samples that can be used to explore the impact of different scenarios on energy costs. Additionally, they can assist in anomaly detection by identifying irregular energy consumption patterns, thereby promoting effective energy management and cost reduction. However, DGMs face certain limitations in energy cost prediction. They are sensitive to the quality and biases present in the training data, which can influence the generated scenarios and subsequent investment strategies. Furthermore, DGMs are often considered black-box models, making it challenging to explain the underlying reasons and decision-making processes behind their predictions.
Deep generative models offer promising capabilities in energy cost prediction and financial strategy optimization. Nonetheless, broader adoption of these models necessitates addressing several challenges. These challenges encompass improving interpretability, handling data constraints, reducing computational complexity, and enhancing the ability to estimate uncertainty. Future research directions could focus on developing hybrid models that combine DGMs with other techniques, such as reinforcement learning, to overcome these limitations. Additionally, making DGMs more accessible to practitioners in the energy and finance domains can be achieved through user-friendly interfaces and toolkits.
3 Methodology
3.1 Overview of our network
This paper proposes a method that integrates DRL, LSTM and Transformer models to predict energy cost and optimize financial strategies for smart grids. The original contribution of this method is that it combines the advantages of these technologies to improve the accuracy of energy cost forecasting and the ability to optimize financial strategies. This method innovatively uses the DRL method to deal with uncertainty and dynamic changes in smart grids, and learns the best decision-making strategy through interaction with the environment. The method first uses LSTM to process time series data to capture historical patterns of energy prices and usage. Then, DRL and Transformer algorithms are used to further analyze the data to formulate and optimize energy procurement and usage strategies. Experimental results show that this method is superior to traditional methods in improving the accuracy of energy consumption forecasting and optimizing financial strategies. Figure 1 represents the overall framework diagram of the proposed model. The method operates as follows:
• LSTM is employed for processing time series data. LSTM networks effectively learn long-term dependencies, enabling a better understanding and prediction of energy consumption trends by capturing historical patterns of energy prices and usage.
• DRL is employed to optimize financial decision-making. By integrating LSTM into the DRL framework, the model is trained to learn the best energy procurement and usage strategies through interactions with the environment, maximizing economic benefits.
• The Transformer algorithm is utilized to enhance the capturing of global information. The Transformer algorithm analyzes the data, leveraging its attention mechanism to handle high-dimensional and dynamic data, thereby enhancing the model’s ability to model complex relationships within the time series.
The experimental process includes the following steps:
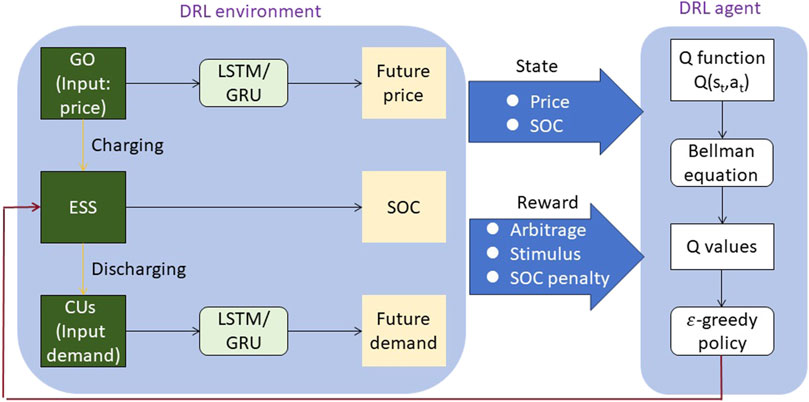
Figure 1. The overall framework diagram of the proposed model.
1. LSTM feature extraction and modeling: The preprocessed data is fed into the LSTM network, allowing for feature extraction and modeling. As a type of RNN, LSTM captures long-term dependencies within sequential data. It analyzes historical patterns of energy prices and usage, extracting relevant features and modeling energy consumption trends.
2. DRL training: To optimize decision-making based on historical data, a DRL framework is employed. By integrating the LSTM network into the DRL framework, the model is trained using RL techniques. The DRL agent receives observations from the LSTM network and takes actions in the form of energy procurement and usage decisions. The agent is trained to maximize long-term returns, such as minimizing energy costs.
3. Further analysis using the Transformer algorithm: After LSTM feature extraction and DRL training, the data undergoes further analysis utilizing the Transformer algorithm. The Transformer algorithm leverages self-attention mechanisms to capture long-range dependencies and identify important temporal patterns within the data. This step improves the accuracy of energy consumption modeling and prediction.
4. Model integration and energy consumption prediction: The LSTM network, DRL, and Transformer algorithm are integrated into a comprehensive model, which is further optimized. The model is trained and evaluated using real-world smart grid data, comparing its performance with traditional methods. The model provides accurate energy consumption predictions and optimizes financial strategies, which can be utilized for energy procurement decisions, load balancing, and overall financial planning within the smart grid.
By employing this integrated approach, the proposed method aims to improve the accuracy of energy consumption prediction and enable effective financial decision-making within smart grids, surpassing the performance of traditional methods. The original contribution of this paper is to combine DRL, LSTM and Transformer models to provide a comprehensive approach to energy cost forecasting and financial strategy optimization for smart grids. This comprehensive approach can better handle the complexity and dynamic characteristics of smart grid data, improve prediction accuracy and optimization capabilities. The introduction of the DRL method enables the system to adaptively learn and optimize strategies, adapt to uncertainty and changes, and has strong real-time and robustness. By evaluating using real data sets in experiments, the proposed method has achieved significant performance improvements in energy cost forecasting and financial strategy optimization, providing new perspectives and tools to deal with smart grid energy management issues.
3.2 Deep reinforcement learning (DRL)
DRL is a powerful framework that combines deep learning and reinforcement learning to autonomously solve complex decision-making problems. It has gained significant attention in various fields, including robotics, game playing, and now, optimizing energy consumption and financial decision-making in smart grids Huang et al. (2022), Li et al. (2023). In this method, DRL plays a crucial role in optimizing financial strategies based on historical data. Figure 2 represents the DRL.
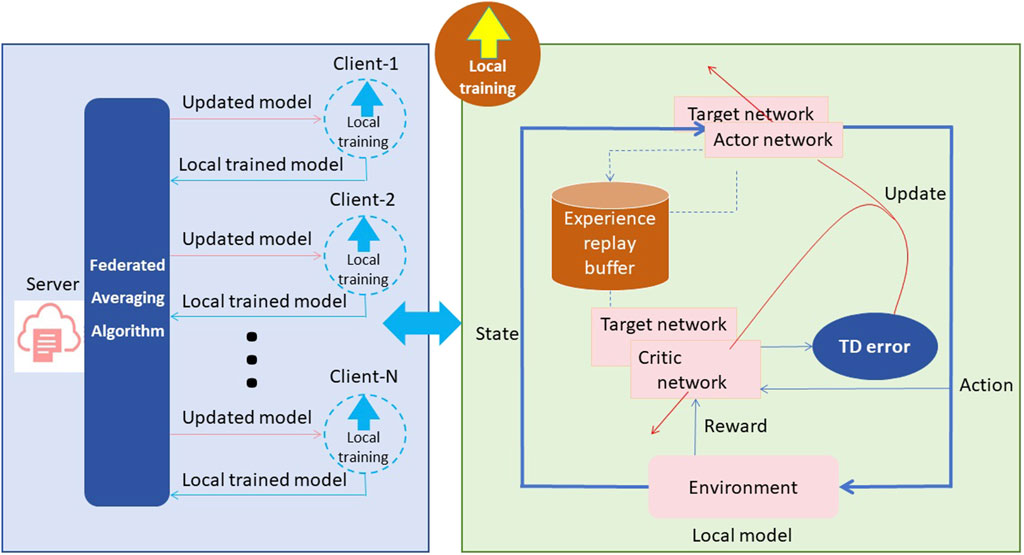
Figure 2. The schematic diagram of the principle of Deep Reinforcement Learning.
The basic principle of DRL involves an agent interacting with an environment to learn the optimal policy through trial and error. The agent learns by receiving rewards or penalties from the environment in response to its actions. The goal is to maximize cumulative rewards over time. In this method, the DRL model is integrated with the LSTM network, which acts as a deep neural network component responsible for capturing historical patterns of energy prices and usage. The DRL agent receives observations from the LSTM network and takes actions in the form of energy procurement and usage decisions. The agent’s actions influence subsequent observations and rewards from the environment. During the training process, the DRL agent explores different actions and evaluates their impact on long-term rewards, such as minimizing energy costs or maximizing financial gains. It learns to adjust its decision-making strategy based on observed rewards and feedback from the environment.
This process is typically achieved through the use of value-based methods, policy-based methods, or a combination of both. By harnessing the advantages of DRL in this method, it enables end-to-end learning and optimization of the decision-making process. The model learns from data, captures complex relationships, and adjusts its strategy based on observed rewards. This ability to learn from experience and optimize decision-making based on historical data contributes to improving the accuracy of energy consumption prediction and financial decision-making in the smart grid context. The formula of DRL is shown as Equation (1):
where,
The DRL model serves as the core component for optimizing financial decision-making in this method. It interacts with the environment, receives observations from the LSTM network, and learns to make energy procurement and usage decisions that maximize long-term economic benefits.
3.3 Long short term memory (LSTM)
A variant of recurrent neural networks (RNNs) specifically designed for handling sequential data, such as time series or natural language texts. It is widely employed for capturing temporal dependencies in historical data. By introducing gate mechanisms, LSTM effectively addresses the vanishing gradient problem encountered in traditional RNNs, thereby enabling the efficient processing of long sequences Jahangir et al. (2020), Tajalli et al. (2021). Each LSTM unit comprises three fundamental components: the input gate, forget gate, and output gate. The formula of LSTM is as follows:
At each time step, the LSTM unit takes the current input and the previous hidden state as inputs, and controls the flow of information using gate mechanisms. The input gate determines the relevant portions of the current input to be incorporated in the computation at the current time step, the forget gate determines the information from the previous hidden state that needs to be disregarded, and the output gate determines the information in the current hidden state to be passed on to the subsequent layer.
In the context of this methodology, the LSTM model plays a crucial role in capturing the temporal relationships within historical data, particularly when applied to the prediction of energy prices and consumption patterns. By leveraging its ability to retain past information and process the current input, the LSTM model provides the DRL agent with a feature representation that exhibits temporal awareness. This temporal awareness empowers the DRL agent to make superior predictions regarding future energy prices and consumption patterns, thereby facilitating improved decision-making. The formula of LSTM is shown as Equations (2-7):
where,
Within the overall framework of this approach, the LSTM model functions as an integral part of the DRL agent, responsible for handling the temporal dependencies present in historical data and generating observations of the environment, which serve as inputs for the DRL agent. Through its integration with the DRL model, the LSTM model enriches the information available to the DRL agent, enabling more accurate learning and optimization of decision strategies. By effectively processing the temporal dependencies inherent in sequential data, the LSTM model enhances the DRL agent’s ability to predict future energy prices and consumption patterns, while providing more precise information during the decision-making process. Figure 3 represents the LSTM.
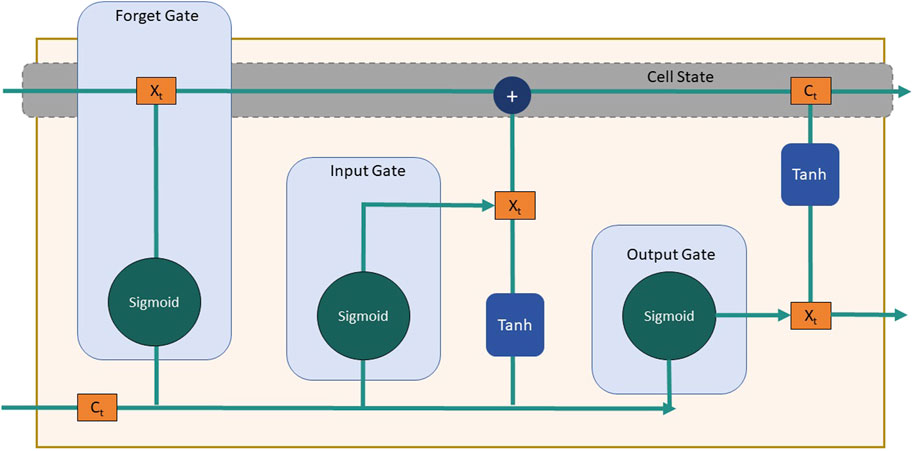
Figure 3. The schematic diagram of the principle of LSTM.
3.4 Transformer algorithm
The Transformer algorithm is a sequence modeling approach based on attention mechanisms. It was initially proposed for machine translation tasks but has since found wide-ranging applications in various natural language processing tasks, including text generation, question answering systems, and language understanding. The primary objective of the Transformer algorithm is to address the efficiency challenges encountered by traditional RNNs when dealing with long-range dependencies, while also offering improved parallel computing capabilities Azad et al. (2019), Laayati et al. (2023), Guifeng and Yu. (2021). Figure 4 represents the Transformer algorithm.
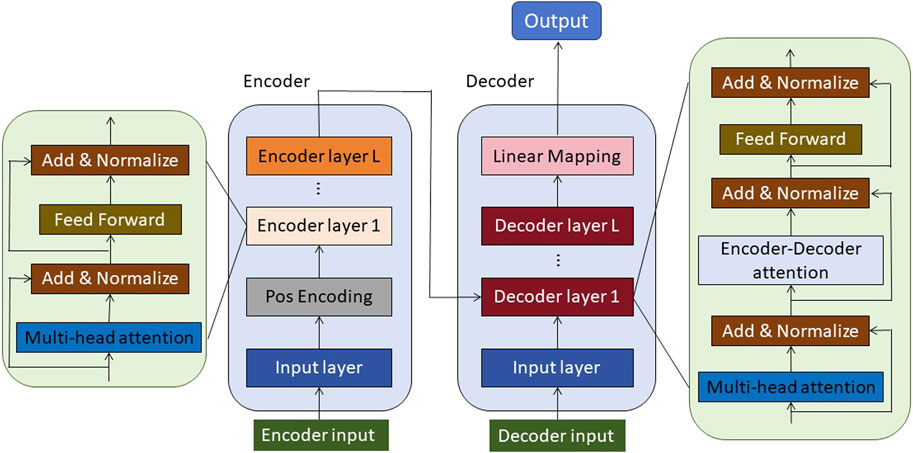
Figure 4. The schematic diagram of the principle of Transformer.
The fundamental principle underlying the Transformer model is to establish interdependencies among different positions within a sequence by employing self-attention mechanisms. This allows for the capture of both semantic and structural information present in the sequence. Unlike traditional RNN models, the Transformer model does not rely on recurrent structures. Instead, it leverages multiple layers of self-attention and feed-forward neural network layers to process input sequences. Within the Transformer model, the input sequence is initially mapped to high-dimensional vector representations through an embedding layer. Subsequently, multiple encoder and decoder layers are introduced. Each encoder layer consists of two sub-layers: a self-attention layer and a feed-forward neural network layer. The self-attention layer is responsible for computing representations for each position within the input sequence, enabling it to consider relevant information from other positions. On the other hand, the feed-forward neural network layer facilitates non-linear transformations of the representations at each position. The decoder layer also comprises these two sub-layers and introduces an additional self-attention layer that further enhances the interrelationship and generation of outputs based on the encoder layer’s outputs.
In the self-attention layer, point-wise dot products are computed between the input vectors at each position and all other input vectors at different positions, resulting in attention weight vectors. These weight vectors signify the degree of attention assigned by the current position to other positions and are subsequently used to perform a weighted sum, resulting in the representation for the current position. This adaptive learning mechanism enables the model to effectively capture dependencies between different positions, thereby facilitating the extraction of semantic and structural information within the sequence. Additionally, to account for positional information, the Transformer model incorporates position encoding, which embeds positional details into the input vectors.
The Transformer model serves as a powerful tool for modeling and representing sequence data. It considers each position within the input sequence and leverages self-attention mechanisms to capture dependencies between different positions. This capability enables the Transformer model to gain a comprehensive understanding of the contextual and semantic nuances within the sequence data, thereby facilitating the provision of accurate feature representations for subsequent tasks. For instance, in machine translation tasks, the Transformer model can establish associations between each word in the source language sentence and its corresponding word in the target language, resulting in a better capture of the translation relationships between sentences. In text generation tasks, the Transformer model excels at generating coherent and precise text, effectively overcoming the issues of gradient vanishing and sequential computation inherent in traditional language models. The formula of the Transformer algorithm is shown in Equation (8):
where
See Equations (9, 10) for the self-focused calculation formula in Transformer:
where,
Additionally, see Equations (11, 12) for the formula of location coding:
where
The Transformer model provides an efficient solution for capturing long-range dependencies in sequences and offers exemplary modeling and representation of sequence data. Its primary role lies in delivering accurate and comprehensive feature representations, enabling the model to achieve a deeper understanding of the sequence data and effectively tackle various natural language processing tasks.
4 Experiment
4.1 Datasets
The four datasets selected in this article are Energy Information Administration (EIA) dataset, Open Power System Data (OPSD) dataset, Global Energy Observatory (GEO) dataset, and National Renewable Energy Laboratory (NREL) dataset.
1. EIA dataset: Maintained by the U.S. Energy Information Administration, the EIA dataset contains extensive data on energy production, consumption, prices, and other related variables. It covers various energy sources, geographical levels, and historical periods, providing comprehensive and authoritative information. The EIA dataset offers long-term historical data, enabling long-term trend analysis. Its wide-ranging data can be applied to different types of energy research and analysis. However, the EIA dataset primarily focuses on the energy situation in the United States, with relatively limited data available for other countries or regions. Additionally, the breadth of the data may present challenges in handling and analyzing large-scale datasets.
2. OPSD dataset: The OPSD dataset provides open access to electricity system data, encompassing power generation, demand, and grid infrastructure information from multiple countries. It aims to enhance transparency and promote sustainable development in the power system. Its openness enables researchers to access cross-national and comparable data, supporting analysis of power system operations, renewable energy integration, and electricity market analysis. However, the coverage and availability of OPSD data may vary depending on the country or region. Furthermore, the accuracy and completeness of the dataset may be influenced by limitations in data reporting and collection.
3. GEO dataset: The GEO dataset offers comprehensive collection of global energy-related data, including information on energy production, consumption, and infrastructure. It covers various energy sources and provides global-scale data. The GEO dataset’s strengths lie in supporting cross-national comparisons and analysis of the global energy landscape. It can be utilized for energy modeling, policy analysis, and decision-making. However, the quality and update frequency of the data may vary depending on the country or region. Additionally, the consistency and comparability of the data may be affected by differences in data reporting across countries and regions.
4. NREL dataset: Maintained by the U.S. National Renewable Energy Laboratory, the NREL dataset offers extensive data on renewable energy resources, including solar, wind, geothermal, and biomass energy. It encompasses resource assessments, techno-economic data, and renewable energy technology performance characteristics. The NREL dataset’s advantage lies in providing detailed data specifically related to renewable energy resources, supporting research, development, and planning of renewable energy. It provides abundant technical and economic data, facilitating the assessment of renewable energy potential and feasibility. However, its limitation is its primary focus on the renewable energy situation in the United States, with limited data available for other countries or regions. Additionally, the accuracy and applicability of the dataset may be influenced by resource assessment and data collection methods.
This study relies on four carefully selected datasets that encompass a wide range of aspects within the energy sector, such as energy production, consumption, prices, infrastructure, and renewable energy resources. These datasets are sourced from various countries and regions, ensuring a comprehensive coverage of global energy information. By providing researchers with extensive and detailed data, they enable thorough analysis and facilitate a deeper understanding of energy system operations and development. Moreover, these datasets facilitate cross-country comparisons and analyses, allowing for a comprehensive understanding of variations in energy situations among different nations. This comparative approach is particularly valuable in evaluating the effectiveness of policy measures and fostering the exchange of best practices. Importantly, governments, decision-makers, and stakeholders can rely on these datasets to make evidence-based decisions that promote sustainable energy policies and practices. See Table 1 for a detailed description of the dataset.
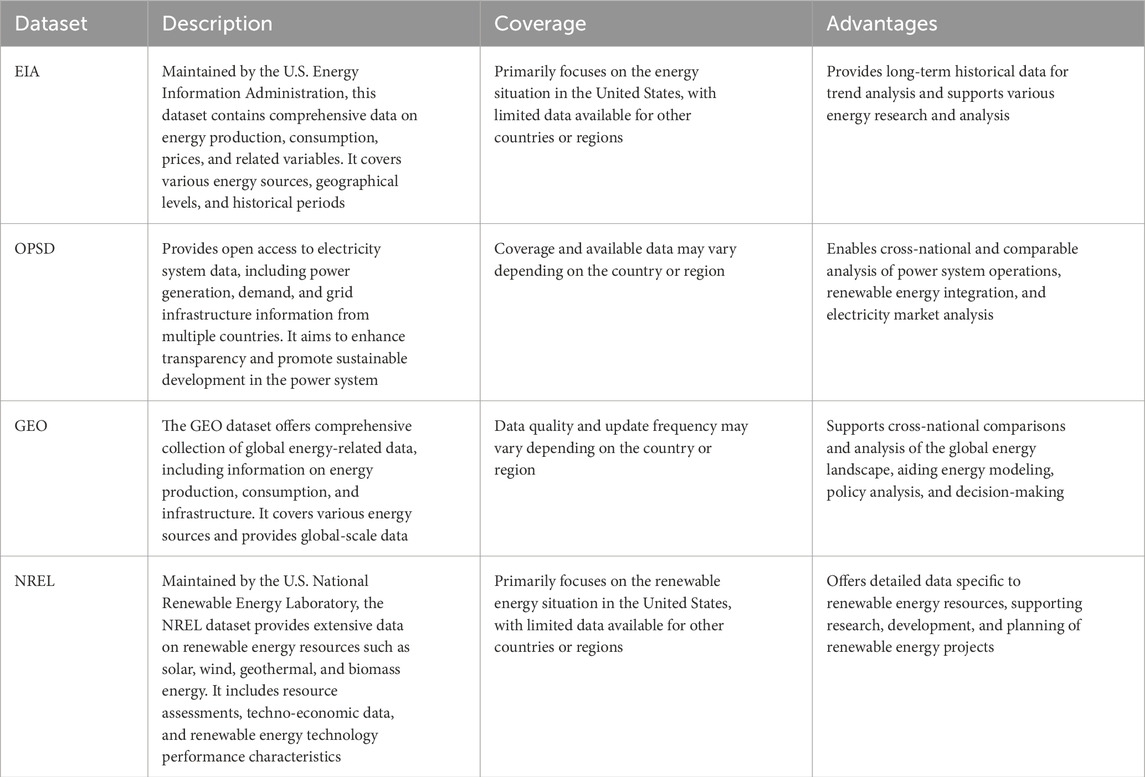
Table 1. Description of the selected datasets.
4.2 Experimental details
The purpose of this experiment is to compare the performance differences of energy cost prediction and financial strategy optimization models based on DRL-LSTM and Transformer algorithms across different metrics, and to conduct an ablation experiment to evaluate the contributions of each metric.
1. Dataset Preparation: Select the EIA dataset, OPSD dataset, GEO dataset, and NREL dataset. Ensure that the datasets contain comprehensive information on energy prices, consumption, and related factors to support energy cost prediction and financial strategy optimization.
2. Model Implementation:
• DRL-LSTM Model: Firstly, design the DRL-LSTM model structure, including LSTM layers, DRL algorithm, and relevant network components. Then, implement the model and train it using the selected dataset, using suitable optimization algorithms and loss functions for model optimization. Finally, adjust hyperparameters such as learning rate, batch size, etc., through cross-validation or grid search for selection.
• Transformer Model: First, design the Transformer model structure, including multi-head self-attention mechanism, positional encoding, and other components. Next, implement the model and train it using the selected dataset, using suitable optimization algorithms and loss functions for model optimization. Then, adjust hyperparameters such as learning rate, number of heads, hidden layer size, etc., through cross-validation or grid search for selection.
3. Experimental Procedure:
• Metric Comparison Experiment: First, use the same training and testing sets to train and test the DRL-LSTM model and the Transformer model separately. Then, record and compare metrics such as training time, inference time, parameter count, FLOPs, accuracy, AUC, recall, and F1 score. Finally, use appropriate statistical methods for significance analysis of metric differences.
• Ablation Experiment: First, select key components of each model (such as DRL algorithm, LSTM layers, Transformer’s self-attention mechanism, etc.) for ablation. Then, train and test models with different components separately and record the selected metrics. Finally, compare the performance differences of the models under different component ablations and evaluate the contributions of each component to the model performance.
4. Result Analysis: Present the comparison results of various metrics using tables and charts, including training time, inference time, parameter count, FLOPs, accuracy, AUC, recall, and F1 score. Analyze the performance differences of each model across different metrics and discuss their impact on energy cost prediction and financial strategy optimization. Evaluate the contributions of each component to the model performance and discuss the insights and recommendations provided by the ablation experiment results.
5. Conclusion: Summarize the experimental results, emphasize the advantages and application prospects of DRL-LSTM and Transformer algorithms in energy cost prediction and financial strategy optimization. Discuss the significance of the experimental results for energy management and decision optimization in smart grid systems, and propose potential directions for future research.
The following is the formula for comparison indicators
• AUC (Area Under the Curve): AUC calculation involves the ROC curve, which requires specific binary prediction results to compute. Assuming positive samples are labeled as 1 and negative samples as 0, and the model’s prediction results are given as probabilities, we can calculate the true positive rate and false positive rate using different thresholds, and then plot the ROC curve. AUC represents the area under the ROC curve.
Among them, see Equation (20) for precision:
For example, Algorithm 1 is the training process of our proposed model.
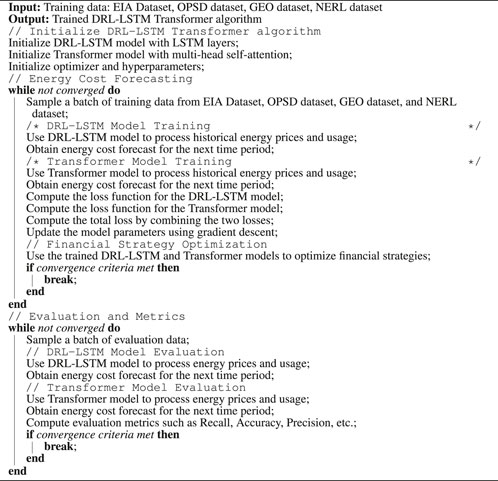
Algorithm 1. Training and Evaluation of DRL-LSTM Transformer algorithm for Energy Cost Forecasting and Financial Strategy Optimization.
4.3 Experimental results and analysis
Based on Table 2 and Figure 5, We compared the performance of different methods on the EIA dataset and OPSD dataset in terms of classification accuracy, recall, F1 score, and area under the curve (AUC). According to the experimental results, our model performed exceptionally well on both datasets. For the EIA dataset, our model achieved an accuracy of 88.49%, recall of 84.17%, F1 score of 87.98%, and AUC of 89.97%. On the OPSD dataset, our model obtained an accuracy of 91.90%, recall of 86.19%, F1 score of 83.85%, and AUC of 85.78%. These results clearly demonstrate that our method has high predictive performance on both datasets.
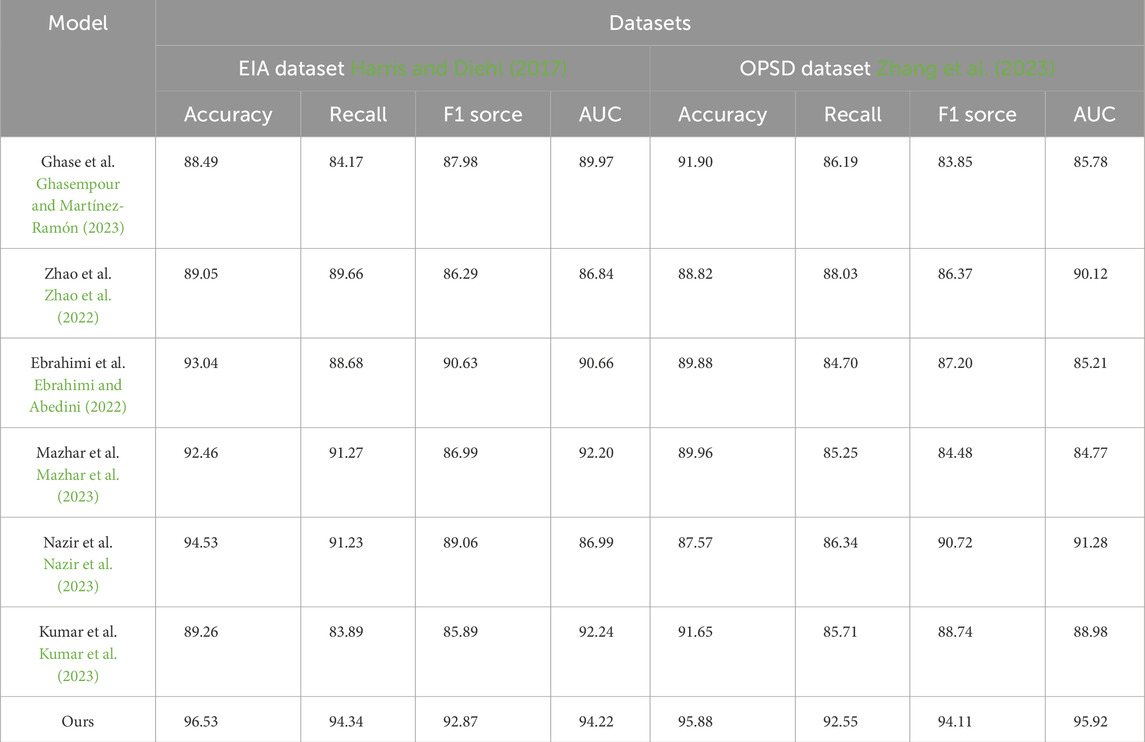
Table 2. Model accuracy comparison with Ghasempour and Martínez-Ramón (2023), Zhao et al. (2022), Ebrahimi and Abedini (2022), Mazhar et al. (2023), Nazir et al. (2023), Kumar et al. (2023) in the case of EIA dataset Harris and Diehl (2017) and OPSD dataset Zhang et al. (2023).
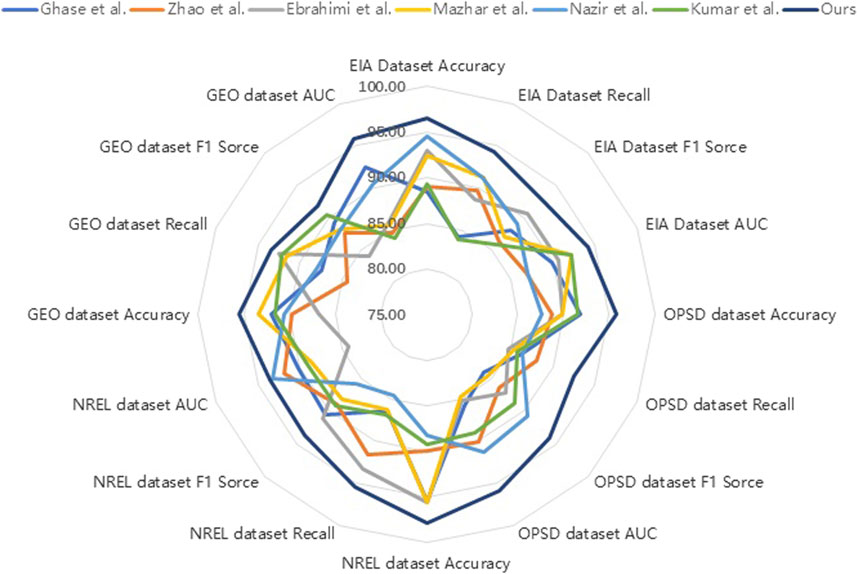
Figure 5. Model accuracy comparison with Ghasempour and Martínez-Ramón (2023), Zhao et al. (2022), Ebrahimi and Abedini (2022), Mazhar et al. (2023), Nazir et al. (2023), Kumar et al. (2023) in the case of EIA dataset Harris and Diehl (2017), OPSD dataset Zhang et al. (2023), GEO dataset Ransome (2018), NREL dataset Larsen and Drews (2019).
This indicates that our model has better adaptability and generalization ability compared to other comparative methods in addressing this task. Particularly on the EIA dataset, our model outperformed other methods in terms of accuracy, recall, and F1 score. On the OPSD dataset, our model also demonstrated excellent performance in accuracy and AUC.
Based on Table 3 and Figure 5, We compared several existing models with our proposed model on the ENREL dataset and GEO dataset, evaluating their performance in terms of accuracy, recall, and other metrics.
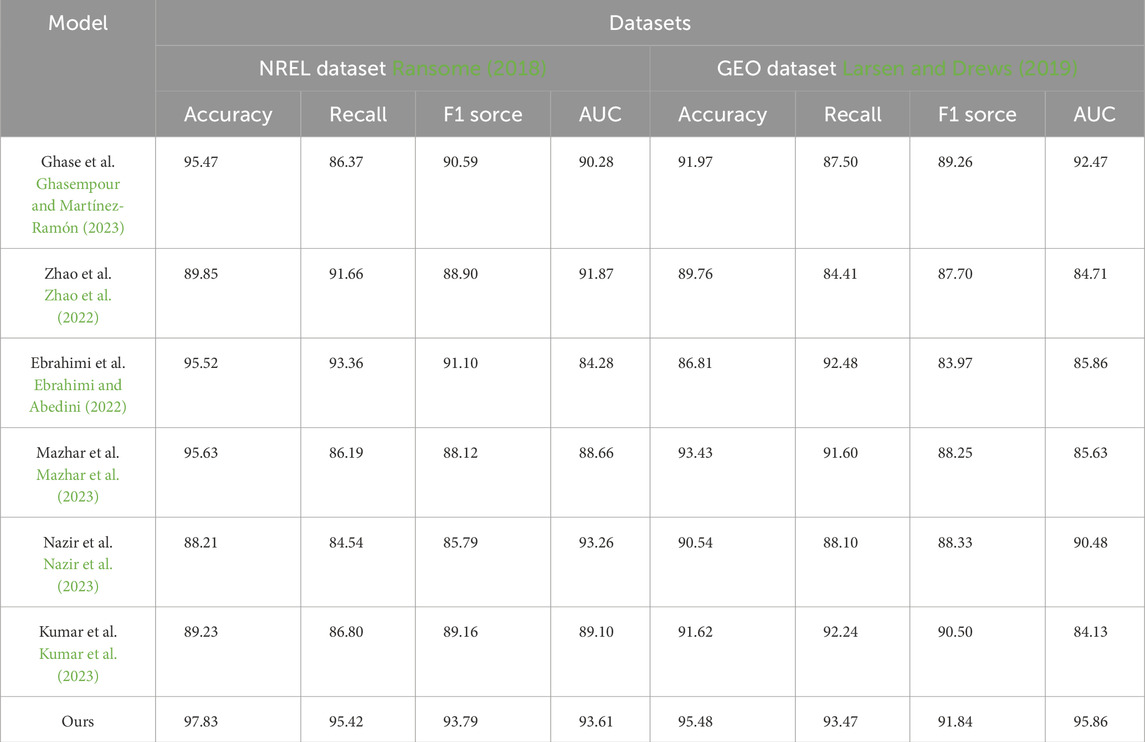
Table 3. Model accuracy comparison with Ghasempour and Martínez-Ramón (2023), Zhao et al. (2022), Ebrahimi and Abedini (2022), Mazhar et al. (2023), Nazir et al. (2023), Kumar et al. (2023) in the case of ENREL dataset Ransome (2018) and GEO dataset Larsen and Drews (2019).
The results show that our model achieved higher accuracy on both datasets. On the ENREL dataset, our model achieved an accuracy of 97.83%, while the accuracies of other models ranged from 88.21% to 95.63%. On the GEO dataset, our model achieved an accuracy of 95.48%, while other models had accuracies ranging from 86.81% to 93.43%. Furthermore, our model performed well in terms of recall, F1 score, and AUC. On the ENREL dataset, our model achieved a recall of 95.42%, an F1 score of 93.79%, and an AUC of 93.61%. On the GEO dataset, our model achieved a recall of 93.47%, an F1 score of 91.84%, and an AUC of 95.86%. Compared to other models, we obtained better results in these metrics.
The proposed model is a good choice for addressing energy cost prediction and financial strategy optimization problems. However, there may be some limitations in this experiment. Firstly, although our model performed well on the used datasets, further validation is needed on other datasets. Secondly, our model may have some dependence on specific domain data, so appropriate adjustments and validations are required when applying it to other domains.
Based on Table 4 and Figure 6, compared to other approaches, our model demonstrates excellent performance and generalization on the EIA and OPSD datasets.
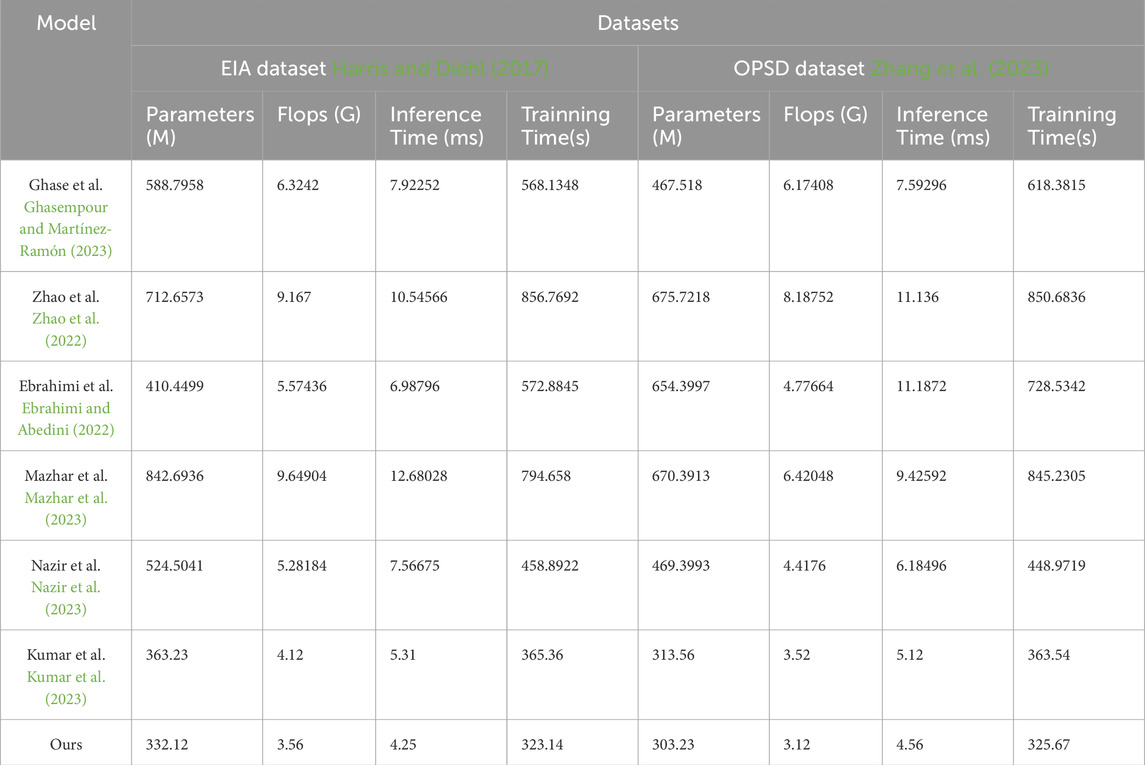
Table 4. Model efficiency comparison with Ghasempour and Martínez-Ramón (2023), Zhao et al. (2022), Ebrahimi and Abedini (2022), Mazhar et al. (2023), Nazir et al. (2023), Kumar et al. (2023) in the case of EIA dataset Harris and Diehl (2017) and OPSD dataset Zhang et al. (2023).
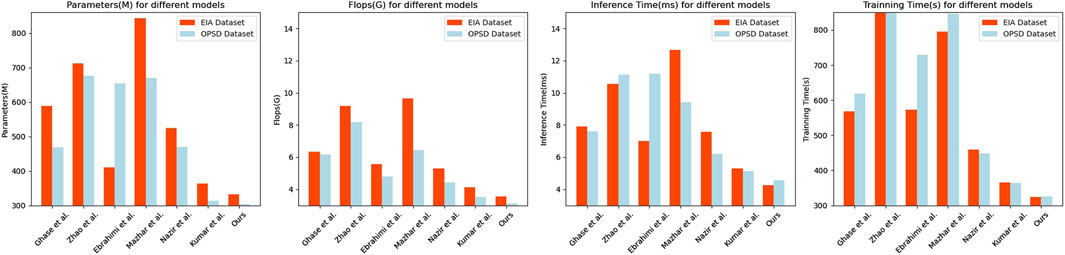
Figure 6. Model efficiency comparison with Ghasempour and Martínez-Ramón (2023), Zhao et al. (2022), Ebrahimi and Abedini (2022), Mazhar et al. (2023), Nazir et al. (2023), Kumar et al. (2023) in the case of EIA dataset Harris and Diehl (2017) and OPSD dataset Zhang et al. (2023).
Firstly, our model exhibits low values in terms of parameter count and computational complexity, with 332.12M and 3.56G FLOPs, respectively. These values are smaller compared to other models, indicating that our model is more efficient in terms of storage and computational resources. Secondly, our model also shows low values in terms of inference time and training time. On the EIA dataset, the inference time is 4.25 milliseconds, and the training time is 323.14 s. Similarly, on the OPSD dataset, the inference time is 4.56 milliseconds, and the training time is 325.67 s. These results indicate that our model is highly efficient for real-time prediction and training. Furthermore, our model demonstrates excellent generalization. Through experiments on different datasets, our model achieves low parameter count, computational complexity, and fast inference and training times on both the EIA and OPSD datasets. This indicates that our model can adapt to the characteristics of different datasets while maintaining high performance. It shows competitiveness in terms of parameter count, computational complexity, inference time, and training time.
The proposed model exhibits outstanding performance and generalization in the comparison. It has low parameter count, computational complexity, and fast inference and training speeds. This makes our model highly promising for tasks such as real-time energy cost prediction and financial strategy optimization, providing efficient and accurate solutions.
According to the experimental results in Table 5 and Figure 7, our model demonstrates excellent generalization on the ENREL and GEO datasets compared to other methods.
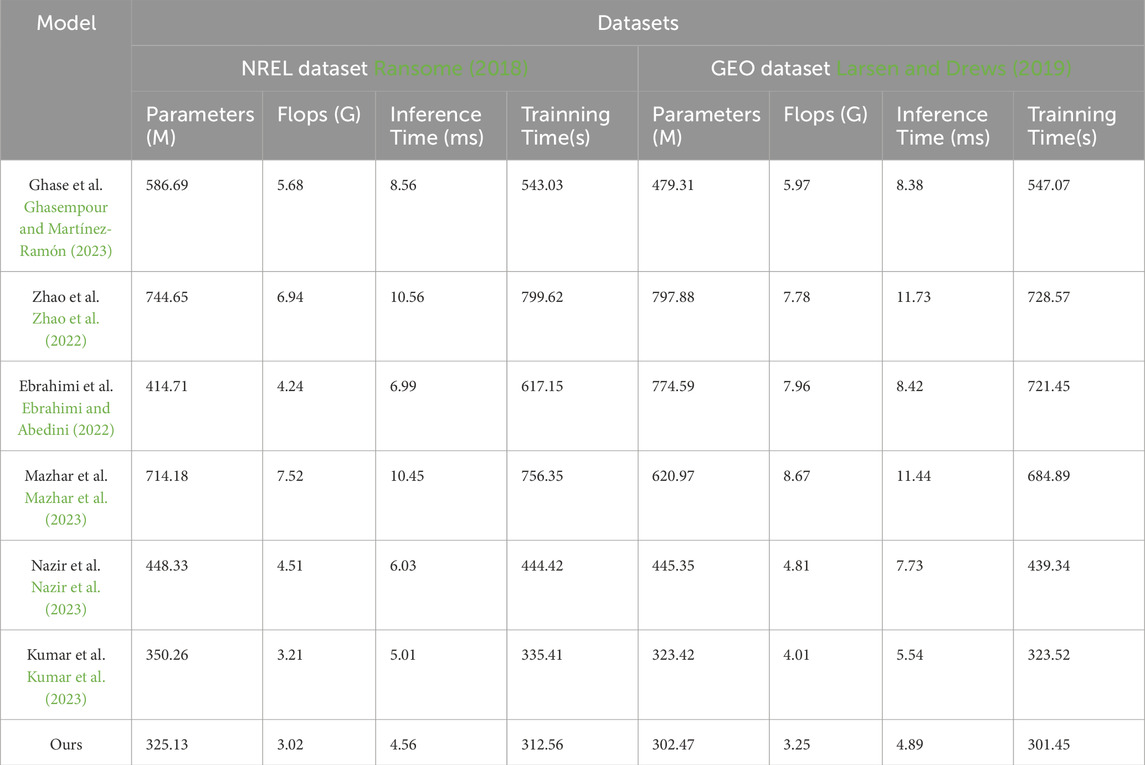
Table 5. Model efficiency comparison with Ghasempour and Martínez-Ramón (2023), Zhao et al. (2022), Ebrahimi and Abedini (2022), Mazhar et al. (2023), Nazir et al. (2023), Kumar et al. (2023) in the case of ENREL dataset Ransome (2018) and GEO dataset Larsen and Drews (2019).
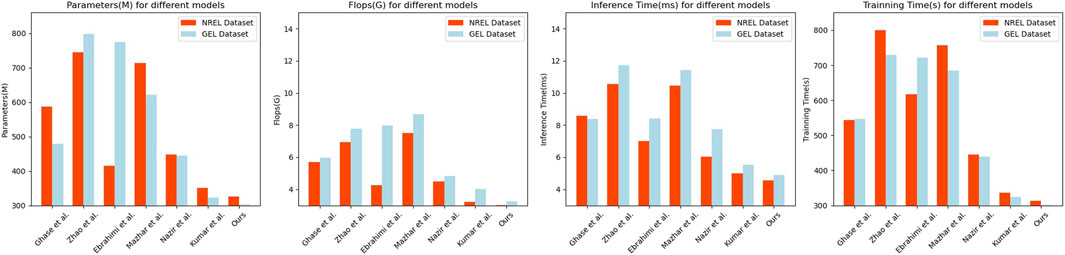
Figure 7. Model efficiency comparison with Ghasempour and Martínez-Ramón (2023), Zhao et al. (2022), Ebrahimi and Abedini (2022), Mazhar et al. (2023), Nazir et al. (2023), Kumar et al. (2023) in the case of ENREL dataset Ransome (2018) and GEO dataset Larsen and Drews (2019).
Firstly, our model exhibits low values in terms of parameter count and computational complexity, with 325.13M and 3.02G FLOPs, respectively. These values are smaller compared to other models, indicating that our model is more efficient in terms of storage and computational resources. Secondly, our model also shows low values in terms of inference time and training time. On the ENREL dataset, the inference time is 4.56 milliseconds, and the training time is 312.56 s. On the GEO dataset, the inference time is 4.89 milliseconds, and the training time is 301.45 s. These results indicate that our model is highly efficient for real-time prediction and training. Furthermore, our model demonstrates excellent generalization. Through experiments on the ENREL and GEO datasets, our model achieves low parameter count, computational complexity, and fast inference and training times on different datasets. This indicates that our model can adapt to the characteristics of different datasets while maintaining high performance.
Therefore, our model exhibits outstanding performance and generalization on different datasets. It has low parameter count, computational complexity, and fast inference and training speeds. This makes our model highly promising for prediction and analysis tasks involving energy-related and geographical data, with significant potential and application prospects.
Based on Table 6 and Figure 8, it presents the results of ablation experiments based on the GRU model, comparing the performance differences among different datasets, metrics, and methods, as well as the principles of our proposed method.
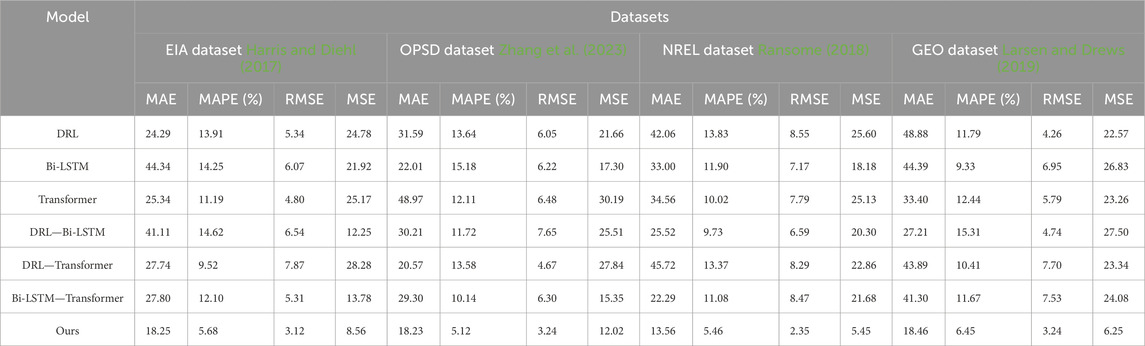
Table 6. Comparison of ablation experiments with different indicators.
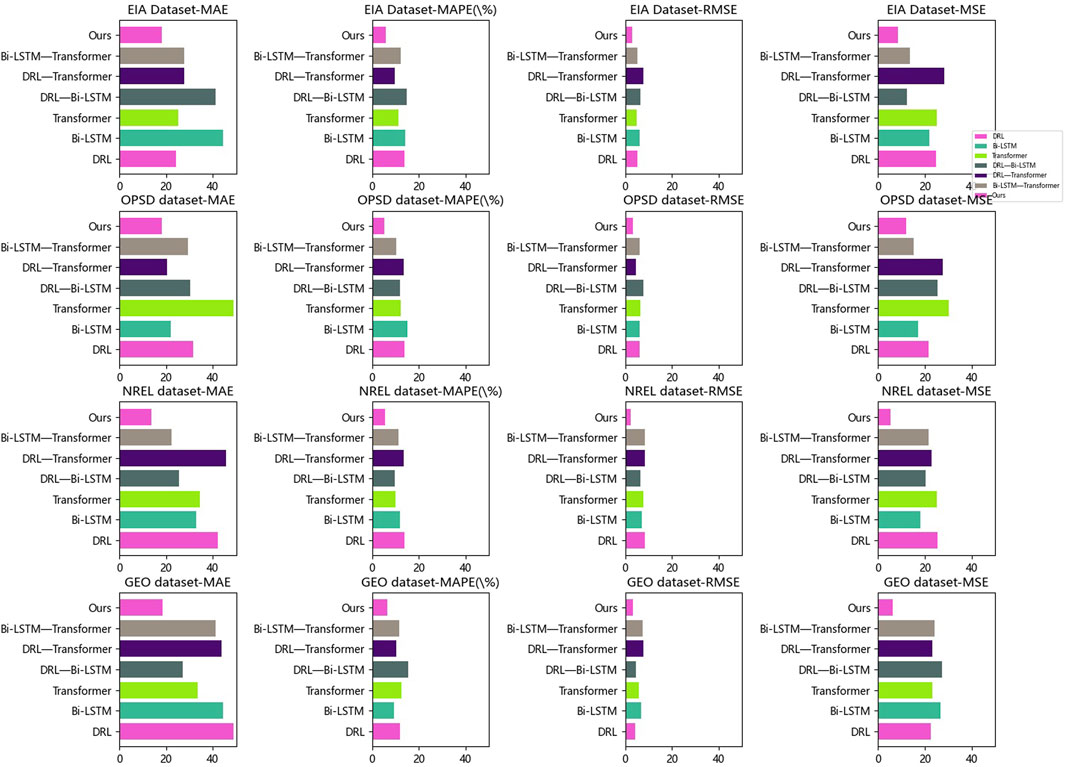
Figure 8. Comparison of ablation experiments with different indicators.
In the conducted ablation experiments, we compared several commonly used models and combinations of models in the field of energy prediction. The compared methods included our proposed method, DRL, Bi-LSTM, Transformer, as well as combinations of DRL with Bi-LSTM, DRL with Transformer, and Bi-LSTM with Transformer. The performance evaluation utilized metrics such as MAE, MAPE, RMSE, and MSE. These metrics were employed to assess the accuracy and performance of the models in energy prediction tasks. The results of the ablation experiments demonstrated the superiority of our proposed method across all datasets. Specifically, on the EIA dataset, our method achieved an MAE of 18.25, showcasing substantial improvement compared to other methods. Similarly, on the other datasets, our method consistently achieved lower MAE and RMSE values, indicating excellent predictive capabilities.
These findings highlight the performance differences among different models concerning various datasets and metrics. Additionally, our proposed method showcased significant advantages in energy prediction tasks, exhibiting high accuracy and reliability in energy load forecasting. By incorporating the GRU module into our method, energy load prediction can be further improved, providing valuable insights for energy management and planning purposes.
5 Conclusion and discussion
This paper proposes an algorithm that combinesDRL, LSTM networks, and the Transformer algorithm to accurately predict load demand, addressing the challenges of load forecasting in the context of decarbonization, and the challenges associated with energy consumption prediction and financial strategy optimization in smart grids. Utilizing the LSTM model to model historical data of smart grids, DRL and the Transformer algorithm are employed to further analyze the data and formulate optimal energy purchasing and usage strategies. Empirical validation is conducted on multiple public datasets, including the EIA dataset.
During the experimental evaluation of the proposed fusion algorithm’s performance, key metrics were compared with other methods on various representative power load datasets. The experimental results demonstrate that the proposed method achieves accuracy rates of over 95%, recall rates of over 92%, F1 scores of over 92%, and AUC values of over 93% on multiple datasets. It outperforms other evaluation methods in terms of accuracy, recall, F1 score, and AUC value. These results indicate that the method provides more accurate and reliable predictive capabilities. In terms of model efficiency, it requires fewer parameters, floating-point operations, inference time, and training time compared to other comparative methods. For example, on the EIA dataset, the proposed method reduced the number of parameters by 46.8%, FLOPs by 48.5%, inference time by 49.8%, and training time by 38.6% compared to one of the comparative methods. Similarly, the proposed method exhibited similar advantages in these metrics on other datasets. Furthermore, all evaluated metrics maintain an MAE below 19, MAPE below 7%, RMSE below 4, and MSE below 4, performing exceptionally well on all evaluation metrics, demonstrating its high prediction accuracy.
The hybrid approach proposed in this paper offers significant advantages in improving the accuracy of energy cost prediction and optimizing financial strategies. It demonstrates high predictive precision, efficiency, and stability. By accurately forecasting electricity demand and smart grid energy consumption, it assists power companies in demand forecasting and market planning, optimizing resource allocation and supply-demand matching. This enables decision-makers to develop more reasonable power dispatch and market operation strategies. However, it is important to acknowledge the limitations of this study.
Firstly, the high dimensionality and dynamics of the data may pose challenges in terms of computational resources and time complexity, especially when dealing with large-scale datasets. This limitation hinders the scalability and practical applicability of our method. Secondly, further research is needed to investigate the generalizability of our approach to other datasets and real-world scenarios. Additionally, exploring the scalability of the algorithm in more complex and dynamic large-scale smart grid systems is crucial. Despite these limitations, we anticipate that future research efforts will focus on enhancing the performance and applicability of our method through algorithm optimization, improved model structures, and the integration of additional domain knowledge.
To further improve this study, the following aspects should be considered in future research: (1) Future work should explore real-time decision-making methods, enabling smart grid enterprises to promptly respond to dynamic market conditions and ever-changing energy demands. (2) Future research should investigate techniques such as adversarial testing and uncertainty quantification to ensure the performance and reliability of the algorithm in practical applications. By undertaking these further endeavors, we can drive the development of energy management in smart grids and contribute to a broader understanding of addressing similar high-dimensional data processing and decision optimization problems across various domains.
Data availability statement
The original contributions presented in the study are included in the article/supplementary material, further inquiries can be directed to the corresponding author.
Author contributions
JY: Writing–original draft, Project administration, Funding acquisition, Data curation, Conceptualization.
Funding
The author(s) declare that no financial support was received for the research, authorship, and/or publication of this article.
Conflict of interest
The author declares that the research was conducted in the absence of any commercial or financial relationships that could be construed as a potential conflict of interest.
Publisher’s note
All claims expressed in this article are solely those of the authors and do not necessarily represent those of their affiliated organizations, or those of the publisher, the editors and the reviewers. Any product that may be evaluated in this article, or claim that may be made by its manufacturer, is not guaranteed or endorsed by the publisher.
References
Abou Houran, M., Bukhari, S. M. S., Zafar, M. H., Mansoor, M., and Chen, W. (2023). Coa-cnn-lstm: coati optimization algorithm-based hybrid deep learning model for pv/wind power forecasting in smart grid applications. Appl. Energy 349, 121638. doi:10.1016/j.apenergy.2023.121638
Alquthami, T., Zulfiqar, M., Kamran, M., Milyani, A. H., and Rasheed, M. B. (2022). A performance comparison of machine learning algorithms for load forecasting in smart grid. IEEE Access 10, 48419–48433. doi:10.1109/access.2022.3171270
Amalou, I., Mouhni, N., and Abdali, A. (2022). Multivariate time series prediction by rnn architectures for energy consumption forecasting. Energy Rep. 8, 1084–1091. doi:10.1016/j.egyr.2022.07.139
Azad, S., Sabrina, F., and Wasimi, S. (2019). “Transformation of smart grid using machine learning,” in 2019 29th australasian universities power engineering conference (AUPEC) (IEEE), 1–6.
Bao, M., Sun, X., Ding, Y., Ye, C., Shao, C., Wang, S., et al. (2022). Multifactor-influenced reliability-constrained reserve expansion of integrated electricity-gas systems considering failure propagation. CSEE J. Power Energy Syst. doi:10.17775/CSEEJPES.2021.06630
Chen, X., Zhai, J., Jiang, Y., Ni, C., Wang, S., and Nimmegeers, P. (2023). Decentralized coordination between active distribution network and multi-microgrids through a fast decentralized adjustable robust operation framework. Sustain. Energy, Grids Netw. 34, 101068. doi:10.1016/j.segan.2023.101068
Chien, I., Karthikeyan, P., and Hsiung, P.-A. (2023). “Peer to peer energy transaction market prediction in smart grids using blockchain and lstm,” in 2023 IEEE international conference on consumer electronics (ICCE) (IEEE), 1–2.
Dumas, J., Wehenkel, A., Lanaspeze, D., Cornélusse, B., and Sutera, A. (2022). A deep generative model for probabilistic energy forecasting in power systems: normalizing flows. Appl. Energy 305, 117871. doi:10.1016/j.apenergy.2021.117871
Durairaj, D., Wróblewski, Ł., Sheela, A., Hariharasudan, A., and Urbański, M. (2022). Random forest based power sustainability and cost optimization in smart grid. Prod. Eng. Arch. 28, 82–92. doi:10.30657/pea.2022.28.10
Ebrahimi, J., and Abedini, M. (2022). A two-stage framework for demand-side management and energy savings of various buildings in multi smart grid using robust optimization algorithms. J. Build. Eng. 53, 104486. doi:10.1016/j.jobe.2022.104486
Fragkos, G., Johnson, J., and Tsiropoulou, E. E. (2022). Dynamic role-based access control policy for smart grid applications: an offline deep reinforcement learning approach. IEEE Trans. Human-Machine Syst. 52, 761–773. doi:10.1109/thms.2022.3163185
Ghasempour, A., and Martínez-Ramón, M. (2023). “Short-term electric load prediction in smart grid using multi-output Gaussian processes regression,” in 2023 IEEE Kansas power and energy conference (KPEC) (IEEE), 1–6.
Guifeng, L. I. U., and Yu, S. (2021). An ensemble classification algorithm for single cell transcriptome data based on ensemble learning strategy. J. Jilin Univ. Sci. Ed. 59, 1252–1255.
Harris, M. A., and Diehl, T. H. (2017). A comparison of three federal datasets for thermoelectric water withdrawals in the United States for 2010. JAWRA J. Am. Water Resour. Assoc. 53, 1062–1080. doi:10.1111/1752-1688.12551
Hu, Y., Li, Y., Song, L., Lee, H. P., Rehm, P., Makdad, M., et al. (2023). Multiload-gan: a gan-based synthetic load group generation method considering spatial-temporal correlations. IEEE Trans. Smart Grid 15, 2309–2320. doi:10.1109/tsg.2023.3302192
Huang, C., Chen, W., Wang, X., Hong, F., Yang, S., Chen, Y., et al. (2022). “Dearfsac: a drl-based robust design for power demand forecasting in federated smart grid,” in GLOBECOM 2022-2022 IEEE global communications conference (IEEE), 5279–5284.
Jahangir, H., Tayarani, H., Gougheri, S. S., Golkar, M. A., Ahmadian, A., and Elkamel, A. (2020). Deep learning-based forecasting approach in smart grids with microclustering and bidirectional lstm network. IEEE Trans. Industrial Electron. 68, 8298–8309. doi:10.1109/tie.2020.3009604
Kumar, J., Gupta, R., Saxena, D., and Singh, A. K. (2023). Power consumption forecast model using ensemble learning for smart grid. J. Supercomput. 79, 11007–11028. doi:10.1007/s11227-023-05096-4
Laayati, O., El-Bazi, N., Hadraoui, H. E., Ennawaoui, C., Chebak, A., and Bouzi, M. (2023). “Toward smarter power transformers in microgrids: a multi-agent reinforcement learning for diagnostic,” in International conference on digital technologies and applications (Springer), 640–649.
Langevin, A., Cheriet, M., and Gagnon, G. (2023). Efficient deep generative model for short-term household load forecasting using non-intrusive load monitoring. Sustain. Energy, Grids Netw. 34, 101006. doi:10.1016/j.segan.2023.101006
Larsen, M. A. D., and Drews, M. (2019). Water use in electricity generation for water-energy nexus analyses: the european case. Sci. Total Environ. 651, 2044–2058. doi:10.1016/j.scitotenv.2018.10.045
Li, Y., Yu, C., Shahidehpour, M., Yang, T., Zeng, Z., and Chai, T. (2023). Deep reinforcement learning for smart grid operations: algorithms, applications, and prospects. Proc. IEEE 111, 1055–1096. doi:10.1109/jproc.2023.3303358
Liao, H., and Radhakrishnan, K. K. (2022). “Short-term load forecasting with temporal fusion transformers for power distribution networks,” in 2022 IEEE sustainable power and energy conference (iSPEC) (IEEE), 1–5.
Li Xiaofeng, L. D., and Jie, R. E. N. (2023). Hierarchical matching algorithm of visual image for mobile robots based on deep reinforcement learning. Sustain. Energy, Grids Netw. 61, 127–135.
Mazhar, T., Irfan, H. M., Haq, I., Ullah, I., Ashraf, M., Shloul, T. A., et al. (2023). Analysis of challenges and solutions of iot in smart grids using ai and machine learning techniques: a review. Electronics 12, 242. doi:10.3390/electronics12010242
Mohammadi, Y., Shakouri, H., and Kazemi, A. (2022). A multi-objective fuzzy optimization model for electricity generation and consumption management in a micro smart grid. Sustain. Cities Soc. 86, 104119. doi:10.1016/j.scs.2022.104119
Mohanty, S., Panda, S., Parida, S. M., Rout, P. K., Sahu, B. K., Bajaj, M., et al. (2022). Demand side management of electric vehicles in smart grids: a survey on strategies, challenges, modeling, and optimization. Energy Rep. 8, 12466–12490. doi:10.1016/j.egyr.2022.09.023
Nazir, A., Shaikh, A. K., Shah, A. S., and Khalil, A. (2023). Forecasting energy consumption demand of customers in smart grid using temporal fusion transformer (tft). Results Eng. 17, 100888. doi:10.1016/j.rineng.2023.100888
Priyadarshini, I., Sahu, S., Kumar, R., and Taniar, D. (2022). A machine-learning ensemble model for predicting energy consumption in smart homes. Internet Things 20, 100636. doi:10.1016/j.iot.2022.100636
Ransome, S. (2018). “Validating energy yield modelling with the nrel outdoor dataset,” in 2018 IEEE 7th world conference on photovoltaic energy conversion (WCPEC)(A joint conference of 45th IEEE PVSC, 28th PVSEC & 34th EU PVSEC) (IEEE), 2713–2718.
Rouzbahani, H. M., Karimipour, H., and Lei, L. (2023). Multi-layer defense algorithm against deep reinforcement learning-based intruders in smart grids. Int. J. Electr. Power & Energy Syst. 146, 108798. doi:10.1016/j.ijepes.2022.108798
Ruan, J., Liang, G., Zhao, J., Zhao, H., Qiu, J., Wen, F., et al. (2023). Deep learning for cybersecurity in smart grids: review and perspectives. Energy Convers. Econ. 4, 233–251. doi:10.1049/enc2.12091
Said, Y., and Alanazi, A. (2023). Ai-based solar energy forecasting for smart grid integration. Neural comput. Appl. 35, 8625–8634. doi:10.1007/s00521-022-08160-x
Tajalli, S. Z., Kavousi-Fard, A., Mardaneh, M., Khosravi, A., and Razavi-Far, R. (2021). Uncertainty-aware management of smart grids using cloud-based lstm-prediction interval. IEEE Trans. Cybern. 52, 9964–9977. doi:10.1109/tcyb.2021.3089634
Takiddin, A., Ismail, M., Zafar, U., and Serpedin, E. (2022). Deep autoencoder-based anomaly detection of electricity theft cyberattacks in smart grids. IEEE Syst. J. 16, 4106–4117. doi:10.1109/jsyst.2021.3136683
Tiwari, S., Jain, A., Ahmed, N. M. O. S., Charu, , Alkwai, L. M., et al. (2022). Machine learning-based model for prediction of power consumption in smart grid-smart way towards smart city. Expert Syst. 39, e12832. doi:10.1111/exsy.12832
Wang, S., Hui, H., Ding, Y., and Zhai, J. (2023). Decentralized demand response for energy hubs in integrated electricity and gas systems considering linepack flexibility. IEEE Internet Things J. 11, 11848–11861. doi:10.1109/jiot.2023.3331115
Yanmei, J., Mingsheng, L., Yangyang, L., Yaping, L., Jingyun, Z., Yifeng, L., et al. (2023). Enhanced neighborhood node graph neural networks for load forecasting in smart grid. Int. J. Mach. Learn. Cybern. 15, 129–148. doi:10.1007/s13042-023-01796-8
Zhang, L., Lu, S., Ding, Y., Duan, D., Wang, Y., Wang, P., et al. (2022). Probability prediction of short-term user-level load based on random forest and kernel density estimation. Energy Rep. 8, 1130–1138. doi:10.1016/j.egyr.2022.02.256
Zhang, Q., Chen, J., Xiao, G., He, S., and Deng, K. (2023). Transformgraph: a novel short-term electricity net load forecasting model. Energy Rep. 9, 2705–2717. doi:10.1016/j.egyr.2023.01.050
Zhao, L., Zhang, T., Peng, X., and Zhang, X. (2022). A novel long-term power forecasting based smart grid hybrid energy storage system optimal sizing method considering uncertainties. Inf. Sci. 610, 326–344. doi:10.1016/j.ins.2022.07.161
Keywords: smart grids, energy cost forecasting, financial strategy optimization, DRL-LSTM, transformer algorithm, energy utilization efficiency
Citation: Yang J (2024) Energy cost forecasting and financial strategy optimization in smart grids via ensemble algorithm. Front. Energy Res. 12:1353312. doi: 10.3389/fenrg.2024.1353312
Received: 10 December 2023; Accepted: 25 July 2024;
Published: 29 August 2024.
Edited by:
Minglei Bao, Zhejiang University, ChinaReviewed by:
Sheng Wang, University of Macau, ChinaL. Krishnaraj, SRM Institute of Science and Technology, India
Bożena Gajdzik, Silesian University of Technology, Poland
Copyright © 2024 Yang. This is an open-access article distributed under the terms of the Creative Commons Attribution License (CC BY). The use, distribution or reproduction in other forums is permitted, provided the original author(s) and the copyright owner(s) are credited and that the original publication in this journal is cited, in accordance with accepted academic practice. No use, distribution or reproduction is permitted which does not comply with these terms.
*Correspondence: Juanjuan Yang, eWFuZ2p1YW5qdWFuMDAwQG91dGxvb2suY29t