 Yuhong Zhang
 Wenshi Ren
- State Grid Sichuan Economic Research Institute, Chengdu, China
This paper studies the problem of considering customer satisfaction in the no-battery-swap mode and in the power-swap mode. First, with the goal of maximizing customer satisfaction, the total cost of charging and discharging and the minimum construction cost of swapping stations, the customer time window, and the load constraints of electric vehicles are considered. A model of electric vehicle charging and discharging route optimization and replacement station location without battery swapping behavior, considering customer satisfaction, is established, and then, a two-stage improved ant colony–genetic algorithm is designed to solve the model, and finally, the comparative analysis considers customer satisfaction. Based on the path optimization results and location decisions considering the cost of charging and discharging, the following conclusions are obtained: 1) electric vehicle route optimization and swap station location planning considering customer satisfaction can not only effectively reduce logistics distribution costs and replacement costs but also improve customer satisfaction levels. 2) Reducing the number of route crossings in the process of logistics distribution routes can save electricity costs for electric vehicles and logistics distribution costs, and help reduce the total cost of the entire logistics distribution network. 3) The gradient setting of the electricity price for electricity exchange will reduce the cost of electricity exchange, improve the utilization efficiency of the battery, reduce the cost of logistics and distribution, and improve the electricity exchange revenue of the electricity exchange station.
1 Introduction
As the economy and society rapidly advance, the demand for energy consumption has steadily risen, and energy shortage and environmental problems have become increasingly prominent. In terms of urban transportation, carbon emissions account for about a quarter of energy carbon emissions, of which urban road transport carbon emissions account for about 80% of the carbon emissions of the transportation industry, which is an important area for transportation carbon reduction (BAI et al., 2021). Electric vehicles that couple power and transportation have become important new energy vehicles because of their near-zero carbon emissions, low cost, and convenient energy-saving charging. According to China’s “New Energy Vehicle Industry Development Plan (2021–2035)” (The General Office, 2020), from 2021 onwards, China clearly proposed that the key areas of new energy logistics vehicles should not be less than 80%, and anticipated by 2035, pure electric vehicles will emerge as the predominant choice among newly sold vehicles, which provides a guarantee for the development of electric logistics vehicles in the field of urban distribution. To this end, electric vehicles show potential to replace traditional fuel vehicles and become an important means to solve transportation and travel. The Transportation sector is characterized by high carbon emissions. Logistics distribution is characterized by high demand, complex routes and road congestion, resulting in high carbon emissions and high vehicle costs. Electric vehicles have the characteristics of a relatively fixed driving range, focusing on short and medium distances, convenient centralized charging, and near-zero carbon emissions. In order to alleviate environmental pressures, the public sector and logistics distribution companies have begun to choose electric vehicles as the main means of transportation. At the same time, the electric vehicle as a means of transport makes the traditional fuel vehicle path planning method no longer applicable, thereby resulting in the electric vehicles to provide kinetic energy with batteries; in order to complete the distribution task, the driving process is limited by battery capacity and mileage in the long-distance distribution, the need for power supply in the middle, and the current set of charging/replacing facilities. There is a slow construction and unreasonable planning, with the increase in the demand for electricity for electric vehicles if the problem of electric energy supply of electric vehicles cannot be solved. It will limit the development of electric vehicles in the logistics industry. Considering the charging time and investment cost, it is recommended that the logistics enterprises cooperate with government departments to build and operate the replacement station, therefore, this paper will consider the replacement station as an electric energy supply facility and carry out the research on the logistics distribution path and site selection of the electric vehicle substation.
1.1 Literature review
The central challenge in logistics distribution lies in optimizing vehicle paths; considering the distribution of goods involves time scheduling problems, many scholars integrate the concept of time windows into the optimization problem of logistics distribution paths, forming a logistics distribution path optimization problem with a time window. In order to solve such problems, the current algorithm selection is very diverse; commonly used algorithms include genetic algorithms, particle swarm algorithms, ant colony algorithms, and taboo search algorithms.
In terms of path planning of electric vehicles, Guo et al. (2022) proposed a travel path planning method, considering the power supply of electric vehicles with the optimization goals of travel distance, travel time, travel energy consumption, and charging price. Ming et al. (2016) considered the mutually exclusive constraints of path selection, battery capacity, and charge and discharge status; integrated the optimal travel time of users and charging cost into the cost function; and studied the path selection problem of electric vehicles under the optimal two different decision-making goals under the time-of-use electricity price mechanism. DONG et al. (2018) considered factors such as path selection, time, battery capacity, and cargo capacity, and studied the optimization of logistics distribution paths and charging strategies for electric vehicles with the goal of optimizing the cost of driving time, battery loss, and fast charging cost of electric vehicles. Zhang et al. (2022) studied the SAEV path optimization problem considering the charging plan, unpredictable travel duration, and service timing, and developed a branch-price algorithm to introduce a customizable label-setting algorithm for identifying resilient and viable routes with feasible charging strategies. Berk and Bülent (2022) aimed to minimize the costs associated with battery degradation and total energy consumption against the backdrop of the traveling merchant problem with time windows, using commercial solvers to solve small-scale instances to examine the impact of battery degradation on routing decisions in different scenarios. Yang et al. (2023) proposed an optimal EV scheduling method on the load side that combines incentive scheduling with orderly scheduling so that the load curve tends to be flat and used to optimize the EV path. Saeed et al. (2023) proposed a vehicle routing optimization model based on the Al-Biruni earth radius optimization algorithm, considering user preferences, availability of charging infrastructure, and distance to the destination. Ren et al. (2020) proposed a shared car path optimization model that considers the operating costs of SEVs, the cost of user time, the cost of user car rentals, and the rewards of user sharing. Wang et al. (2015) analyzed the relationship between variables in the power battery distribution path optimization problem, constructed a priority function to determine the initial population, and suggested an enhanced genetic algorithm to address the path optimization problem for delivery vehicles with time windows, including simultaneous pick-up and delivery scenarios. Appiah and Xiong (2019) aimed to minimize total transportation costs by solving a unitary model through a particle swarm optimization algorithm to determine the path for vehicles traveling from the distribution center to serve a specific customer and return to the distribution center.
In terms of the site selection of battery swapping station, Deng et al. (2021) considered the two stages of electric vehicles during distribution and back to the distribution center, and studied the logistics distribution path planning and charge and discharge management problems of electric vehicles, considering customer satisfaction in the power exchange mode. In Zhang et al. (2023), based on new energy vehicles' daily driving habits and charging methods, the Monte Carlo sampling algorithm is adopted to establish the new energy car battery load model, the scheduling for electric vehicle charging behavior, and related facility construction that provides a direction. Zhou and Tan (2018) proposed the problem of distribution path and site selection of electric vehicles in the automobile assembly line, developed a mathematical programming model aimed at optimizing by minimizing the overall expenses within the system, and proposed a two-stage dynamic programming algorithm to obtain the optimal solution of the small-scale problem. Li et al. (2022) constructed a mathematical model of potential substation site selection under multi-path conditions, and on this basis, the relationship between the cruising range of electric vehicles and the cost of station construction, as well as the relationship between the number of substations and service flow, was analyzed. An et al. (2023) proposed a location optimization method that comprehensively considered many factors such as EV charging and discharging cost, power grid load stability, and user demand. Cheng et al. (2023) proposed an EV charging load prediction method based on variational mode decomposition and the Prophet-LSTM neural network to solve the problem of the charging station location. Zhao and Liang (2023) proposed a new charging scheduling and energy management approach for smart grid electric vehicles based on genetic algorithms (GAs), gated recurrent unit (GRU) neural networks, and reinforcement learning (RL) algorithms. Wang et al. (2020) proposed a BSS site selection framework based on the MCDM (multi-project decision method), which takes into account the lack of information in the site selection process of the replacement station and uses triangular fuzzy numbers to deal with uncertainty. Zu and Sun (2022), based on the site selection planning of charging stations and substations, considering the user’s behavioral capabilities, dynamically analyzed the correlation between crucial parameters and outcomes using the YALMIP/CPLEX method to solve the model. Qin and He (2021) determined the service radius of the substation from the aspects of driver driving preference, substation service objectives, and the mileage of electric vehicles, and used the grid method and position allocation model to analyze the distribution of substations with the smallest number of stations and the largest coverage.
In summary, although domestic and foreign scholars have considered the charging/replacing problems of electric vehicles in logistics distribution, they have not considered the relationship between the logistics distribution path of electric vehicles and the site selection results of their substations, and few literature studies have considered the combination of time window, logistics path optimization, and substation site selection. The main contribution of this paper is to establish the path optimization problem of electric vehicles without power exchange behavior and the site selection decision model of electric vehicle power exchange facilities distributed in urban distribution under the power exchange mode. The model comprehensively considers the impact of user satisfaction, the opportunity/penalty cost generated by the violation of the customer satisfaction time window, and the power exchange cost corresponding to the remaining battery power on the path planning and site selection decision of the power exchange facility. Finally, a two-stage hybrid ant colony algorithm is designed to solve the above model in order to obtain the urban distribution path optimization and site selection scheme suitable for electric vehicles, which can provide reference for the actual operation and management decisions of logistics enterprises.
2 Problem description and modeling
2.1 Problem description
The specific problem description is as follows: assuming that an enterprise has a logistics distribution center point O in a certain place and puts multiple electric vehicles with the same loading capacity and the same battery capacity into the logistics distribution service, the location of each customer point C and its cargo demand are known, and the logistics distribution center can meet its service needs. The distribution center serves as both the starting and ending points of the logistics distribution path, necessitating the vehicle to return to the distribution center upon completion of its service; owing to the electric vehicle having a power constraint, some of the longer sub-paths need to be replenished with electricity, the electric vehicle through the replacement station or back to the distribution center should reach the battery full state, and each electric vehicle should leave from the starting point and return to the end point through the replacement station no more than once. Therefore, enterprises need to reasonably arrange the logistics and distribution path of electric vehicles, which minimizes logistics and distribution costs. At the same time, it is crucial to factor in the expenses associated with replacing electric vehicles and ensure customer satisfaction, and select and build the replacement power station on a reasonable distribution path. The goal of the problem is how to reasonably design the electric logistics vehicle transportation path of the distribution center under the condition of limited distribution vehicles so as to meet the needs of customer points and achieve the goal of minimizing the total cost of the urban logistics distribution network and maximizing customer satisfaction.
For these cases, we need to consider the time window of the distribution route, the opportunity cost or penalty cost, the maximum cargo capacity of the electric vehicle, and so on. 1) The vehicle routing optimization problem with the time window is based on the classic vehicle routing optimization problem, adding that each customer point has a logistics distribution time limit; we call the customer point time limit as the time window. When enterprises use electric vehicles for services, electric vehicle distribution may be delayed or result in early arrival, and when in need to consider the distribution route time window problem, this article considers the choice of the soft time window constraint and all customers know the time window. Failure to deliver within the required time window will incur opportunity costs or penalty costs. 2) Because the enterprise needs to replace the electric vehicle in time, the distribution center also has the function of power exchange, and the electric vehicle can be replenished in the distribution center after returning to the distribution center. 3) The total customer demand on each distribution route does not exceed the maximum cargo capacity of electric vehicles, and the demand of each customer point can only be completed by one electric vehicle. 4) In order to consider making the electric vehicle power exchange work orderly and preventing the electric vehicle from re-entering the power exchange station to affect the power exchange of other electric vehicles and causing resource occupation, the replacement price will be set according to the remaining power level of the electric vehicle; if the remaining electricity is high, the corresponding purchased electricity price is correspondingly higher, and the conversion price is converted according to the remaining level of the remaining electricity. 5) The electric vehicle used in this article does not consider the loss to the battery due to charge and discharge during the power exchange process. 6) The power of an electric vehicle is not affected by the driver’s driving style and the difficulty of driving on the road. The schematic diagram of the electric vehicle path optimization problem in this paper is shown in Figure 1.

FIGURE 1. Schemes following the same formatting.
2.2 E-VRPTW model considering customer satisfaction
2.2.1 Objective construction
Considering the economic factors of logistics distribution costs and the influence of logistics distribution customer service time window on customer waiting time, the paper formulates a multi-objective optimization model which aims at maximizing the overall satisfaction of the system and minimizing the delivery time and total cost of the system.
(1) Minimizing the logistics distribution services cost
Considering the logistics integrated transportation service of electric vehicles in logistics distribution services and the site selection and construction of the replacement station, the logistics distribution cost of this paper mainly includes the total cost of electric vehicle power exchange cost, electric vehicle fixed cost, replacement station construction cost, and time window penalty cost. The cost of electric vehicle power exchange is related to the electricity exchange price and power exchange; the higher the electricity exchange price and the more the electricity exchange, the higher the power exchange cost; for this reason, it is necessary to optimize the power exchange of electric vehicles into the power exchange station. The length of the driving path of electric vehicles determines the cost of their logistics distribution travel time, and choosing a suitable location to build a replacement station can make the electric vehicle exchange power in its suitable power exchange during the driving distance while reducing the time cost; the longer the route travel time corresponds to the higher the route travel time cost, so the path should be reasonably selected during the route driving process so that the electric vehicle can be replenished. The specific mathematical expression is as follows:
The cost of electric vehicle replacement is related to the remaining electricity and power exchange price of electric vehicles driving into the power exchange station during distribution; taking into account the prevention of electric vehicles from re-entering the power exchange station multiple times and affecting the power exchange of other electric vehicles resulting in resource occupation, the replacement price will be set according to the remaining power level of electric vehicles; if the remaining electricity is more, the corresponding purchased electricity price is correspondingly higher. The expense linked to power exchange is associated with the frequency of power changes in electric vehicles during distribution, the remaining power to the power exchange station, and the electricity exchange price, and the calculation method is the sum of the purchase cost of the new replacement battery and the cost of a single battery rental.
The construction cost of the substation is related to the construction cost of a single substation and the number of substations under construction, as shown in the following equation.
Electric vehicle distribution costs are divided into variable costs and fixed costs. Variable costs are related to the length of the driving path of electric vehicles; the farther the driving distance, the greater the variable cost. Fixed cost is the total cost of the vehicle paid by the enterprise to purchase an electric vehicle that is put into use.
Considering the impact of the service time of delivery on customer delivery service satisfaction, the cost caused by the delivery time in violation of the merchant’s requirements in the objective function also takes into account the total cost, and this paper establishes a mathematical model based on the soft time window constraint, describing it as follows: if the delivery vehicle
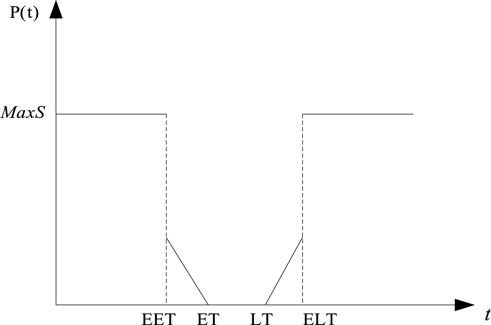
FIGURE 2. Penalty function for soft time windows.
The total time cost is shown below:
(2) Minimizing the total distribution distance of the logistics system.
Considering the reasonable planning of the site selection of the layout of the substation and the distribution path of the logistics enterprise, the logistics distribution distance can be reduced, and the expression of the logistics distribution distance F2 is given as follows:
(3) Maximum customer satisfaction.
Customer satisfaction is used to evaluate the service level of logistics distribution enterprises based on the logistics distribution time window. The length of its delivery time will directly affect the customer’s evaluation of its satisfaction. Its linear function expression F′3 is
For ease of calculation, customer dissatisfaction is considered, and customer dissatisfaction is represented by F3, and the F3 expression is expressed as follows:
2.2.2 Constraints
The planning and replacement management of electric vehicle logistics distribution routes should meet the following constraints: 1) Logistics distribution constraints: the constraints of logistics distribution mainly include path constraints, load constraints, arrival/departure time constraints, and remaining power constraints.
(1) Path constraints
Path constraints will restrict vehicle movement, considering the number of vehicles entering and leaving a node.
Eq. 10 indicates that each vehicle enters a node and leaves a node an equal number of times. Eq. 11 indicates that each customer can receive service from at most one electric vehicle. Eqs 12, 13 indicate that the distribution path of the electric vehicle forms a closed loop connecting end to end. Eq. 14 indicates that each electric vehicle departs from the distribution center and ends up in the distribution center. Eq. 15 defines that the value of a decision variable can only be 0 or 1. Eq. 16 indicates that the station can be visited many times.
(2) Load constraints
Formula 17 indicates that the total customer service of each electric vehicle cannot exceed the maximum cargo capacity of electric vehicles. Eq. (18) represents the overall count of electric vehicle transfers.
(3) Arrival/departure time constraints
When a customer provides delivery within an acceptable timeframe, there is zero opportunity cost and penalty cost. If the time window is exceeded, the penalty cost will be paid according to the length of the violation.
Eq. 19 means that the electric vehicle delivery time cannot exceed the customer’s maximum tolerable time window, Formula 20 and Formula 21, respectively, represent the time when the electric vehicle leaves the logistics distribution center and arrives at the customer, and Formula 22 represents the total time of the entire logistics distribution network electric vehicle to complete the logistics distribution use.
(4)Power constraints
Formula 23 indicates that the remaining power of the electric vehicle cannot exceed its power limit. Eqs 24–26 represent the electric vehicle leaving the distribution center and the customer node and the power level of the replacement station. Formula 27 represents the relationship between the remaining power of the electric vehicle leaving the previous customer point and the next customer point. Formula 28 represents the relationship between the power of two customer nodes. In summary, the multi-objective optimization model of electric vehicle logistics distribution path optimization and power exchange strategy considering customer satisfaction is represented as follows:
3 Detailed explanation of the algorithm process
3.1 Multi-objective model solving
Since the three objective functions in this paper have different orders of magnitude, the method based on fuzzy satisfaction is used to dimensioning the objective function. The entropy weight method is the most widely used method for solving multi-objective problems. However, the entropy weight method mainly empowers through the degree of dispersion of each objective, ignoring the horizontal influence generated by the correlation between the objectives. CRITIC is an objective weighting method that considers the impact of index correlation. The general process of the CRITIC method is represented as follows:
(1) First, suppose there are m plans and n goals respectively. Take the solutions of F1, F2 and F3 as objectives are taken as three CRITIC weighted schemes, and the following evaluation matrix is obtained:
where
(2) Then, the standard deviation and correlation coefficient were calculated for each target, as follows:
where
(3) The amount of information contained in each goal is calculated, and the weight of each goal is obtained, as follows:
where
Finally, the combined objective function is expressed as follows:
3.2 Two-stage hybrid algorithm design
Obviously, the problem solved by this model is an NP-hard problem, so combined with the characteristics and actual situation of this model, the positive feedback method — ant colony algorithm — which is robust and does not rely on the initial route selection is selected. In this paper, an improved two-stage hybrid algorithm solves the path optimization model when there is no power exchange behavior and the site selection model of the station in the power exchange mode. First of all, when designing the distribution path optimization model without power exchange behavior, in order to better integrate the advantages of the A* algorithm and the ant colony algorithm, the initial path suitable for the optimization of the logistics distribution path of electric vehicles is searched by the A* algorithm in the early stage, and the initial solution of the ant colony algorithm is formed; the positive feedback of the ant colony algorithm is used in the later stage, and the advantages of high solution accuracy are used; the method of combining the A* algorithm and the ant colony algorithm is used to generate the optimal path based on the pheromone iteration, and the load and mileage constraints of the electric vehicle are considered in the evaluation process and EV delivery time window constraints. Second, based on the optimal path of electric vehicle distribution, the genetic algorithm of the second stage is designed to solve the site selection model of the replacement station. While conducting the site selection process, the price of power exchange and the construction cost of the power exchange station are considered, and the cost constraint of the power exchange is based on the residual electricity of the electric vehicle so as to find the site selection scheme that meets the minimum cost of power exchange and construction of the power exchange station.
3.3 Improved ant colony algorithm to solve the path optimization model without power exchange behavior
3.3.1 Initial pheromone settings
The A* (A-Star) algorithm is the most efficient direct search method for solving the shortest path and is a common heuristic for many other problems. Its heuristic function is
The above equation
This article assumes that the distance between customer points is the Euclidean distance
The specific steps are as follows.
1) Build the initial function, and initialize the start list
2) Determine whether the open list is empty, if not, continue the iteration, and if it is empty, it ends because the optimal path cannot be found. If it is not empty, substitute the logistics distribution center O into
3) Calculate the value of the point
4) Determine whether the distribution volume of the electric vehicle distribution path exceeds the electric vehicle load capacity D, and if it exceeds it, return to step①.
5) If a customer point C is already in
6)
3.3.2 Construction path
After the A* algorithm is calculated, the initial optimal solution is obtained. Ants transfer from customer point i to select the next customer point j through certain probability selection rules. In the traditional ant colony algorithm, the state transition probability of ant m from node i to node j is expressed as shown in Eq. 31:
In Eq. 31,
The heuristic factor
The cost of logistics distribution services, logistics distribution distance, and customer satisfaction are used as the denominator of the heuristic factor in order for the vehicle to select the next customer demand point j by the customer point i, and the expectation is that the total cost is the smallest, the logistics distribution distance is the smallest, and the customer satisfaction is the largest. The transfer probability of customer points that meet the conditions of small total cost, short distance, and high satisfaction is increased so that vehicles are prioritized for customer points with small total distribution costs.
3.3.3 Pheromone volatile factor design
The pheromone volatility factor pertains to the rate at which pheromones dissipate. Its value intricately influences both the algorithm’s global search capacity and convergence speed. If set too high, pheromones evaporate rapidly, causing the exclusion of potentially superior paths. Conversely, a value set too low results in excessive residual pheromones along the path, thereby impacting the algorithm’s efficiency.
The size of the pheromone volatilization factor ρ-value in the ant colony algorithm determines the persistence of the above pheromone retention in the optimization path. Therefore, this paper selects the size of ρ for segmentation and adjusts the size of the pheromone volatilization factor as the number of iterations increases.
where n represents the current number of iterations and N represents the total number of iterations of the algorithm. Start setting ρ to a smaller value, guided by pheromones, to find the optimal path. After 0.5 N, the pheromone accumulation on the path is too high, and ρ is set to 0.3 to improve the pheromone volatilization effect and avoid the risk of falling into local optimization. When the number of iterations is more than 0.75 N, the pheromone concentration on the path reaches a large value, resulting in the corresponding increase of the ρ-value.
3.3.4 Pheromone update strategy
To make the search process more instructive, after all ants have formed their paths, the established paths are updated globally, and only the path of the ants that find the globally optimal path is updated with pheromones. The update rules are
where G is the total amount of pheromones left by ants passing through the optimal path and
For edges (i, j) that are not optimal paths, the update rules are
where
3.4 Improved genetic algorithm to solve the site selection model of the substation in the swap mode
First, the first-stage ant colony algorithm solves the path optimization model to obtain the optimal distribution path, and the function randomly generates the initial population, that is, different site combinations. Using the evaluation process to consider the cost of the power exchange, the fixed cost and the opportunity/penalty cost are minimized, and the sum of the costs of accessing the individual replacement stations is compared. The crossing operation is done by transposing the middle part of the parent’s tangent location. It then goes through multiple crossovers, variations, and iterations. Finally, the individual satisfies the constraints and makes the adaptation optimal so as to solve the site selection scheme that meets the minimum total cost of the replacement station site. The solution process is as follows:
1) The function is used to generate an initial population with a population of 100, the number of genes in the population equals the total number of customers, and the length of the individual is equal to the total number of demand points in each path.
2) The cross rate, number of evolutions, and number of iterations are set, considering the actual situation of the construction cost of the replacement power station. In this paper, the crossover rate is set to 0.5, the rate of variation is 0.05, and the number of iterations of the algorithm is 200.
3) The constraint subfunction is set; this stage considers the electric vehicle power level constraint, customer satisfaction time window, and power change path constraint. Among them, the power exchange power is negatively correlated with the remaining power of the electric vehicle, and the power exchange time is fixed.
4) The fitness function is set, the individual fitness degree in the genetic algorithm is directly proportional to the adaptability, and the goal of this paper is to minimize the total power exchange cost, including the additional electricity cost and opportunity penalty cost generated by visiting the replacement station.
5) Parental cross-mutation, the cross-operator that acts on the population, crosses by transposing, exchanges some genes between paired chromosomes, and crosses the part to mutate.
6) When the number of iterations reaches the specified number of iterations, the loop ends and outputs the final result.
According to the above algorithm introduction, the main steps of the two-stage hybrid algorithm are shown in Figure 3.
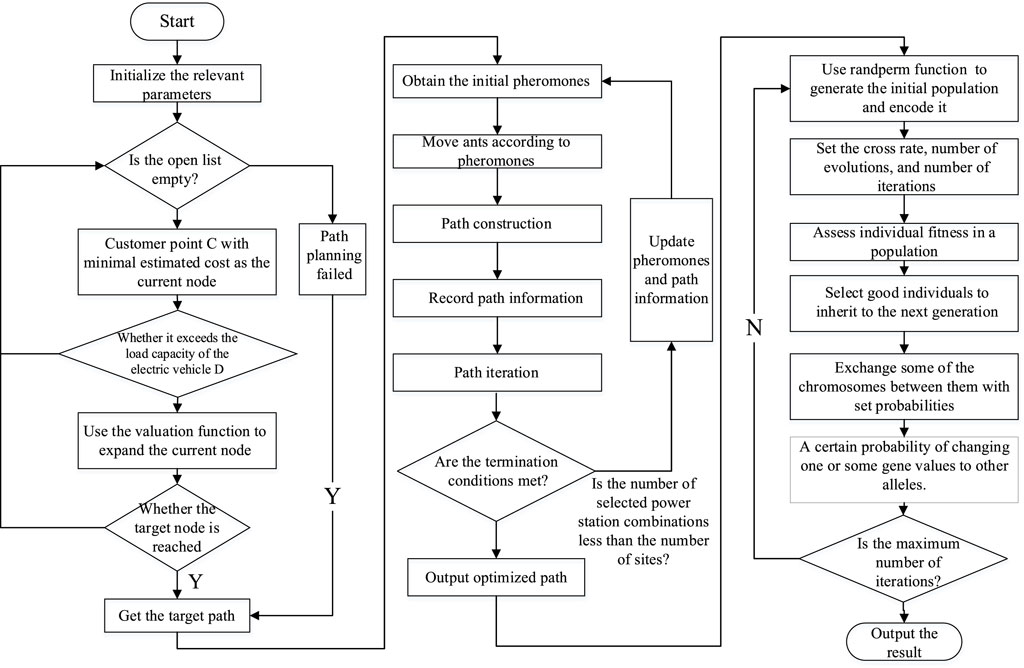
FIGURE 3. Two-stage hybrid algorithm design diagram.
4 Study analysis
In order to verify the applicability of the site selection model in the power exchange mode, this section uses the model solution case to study the optimal distribution path and the best site selection scheme and the total cost of distribution in this context, and compares the site selection decision and logistics distribution cost under the power exchange mode in order to draw realistic conclusions. In this paper, the different results of the objective function have been standardized and dimensionally unified in the calculation process.
4.1 Experimental data
The study data selected in this paper are shown in Table 1, assuming that a distribution center and 30 customers are distributed in a square area with a side length of 80 km, the coordinate unit is km, the customer’s demand for goods is generally 0–2 t; the location coordinates of the logistics distribution center and 30 customers, and the customer’s cargo demand and time window are shown in Table 1. Assuming that there are a total of 10 electric logistics vehicles of the same type in the distribution center, the maximum load capacity is 8 t, the average driving speed is 40 km/Li, the electricity cost per kilometer in the distribution process is 1 yuan, the unit time opportunity cost of the early arrival of the vehicle is 10 yuan/hour, the unit penalty cost of late arrival is 30 yuan/hour, and the fixed travel cost of the vehicle is 200 yuan/car. According to the above conditions, it is required to meet the constraints of the vehicle load and customer time window and make the total distribution cost and customer satisfaction the greatest by reasonably arranging the distribution route of the vehicle. Table 2
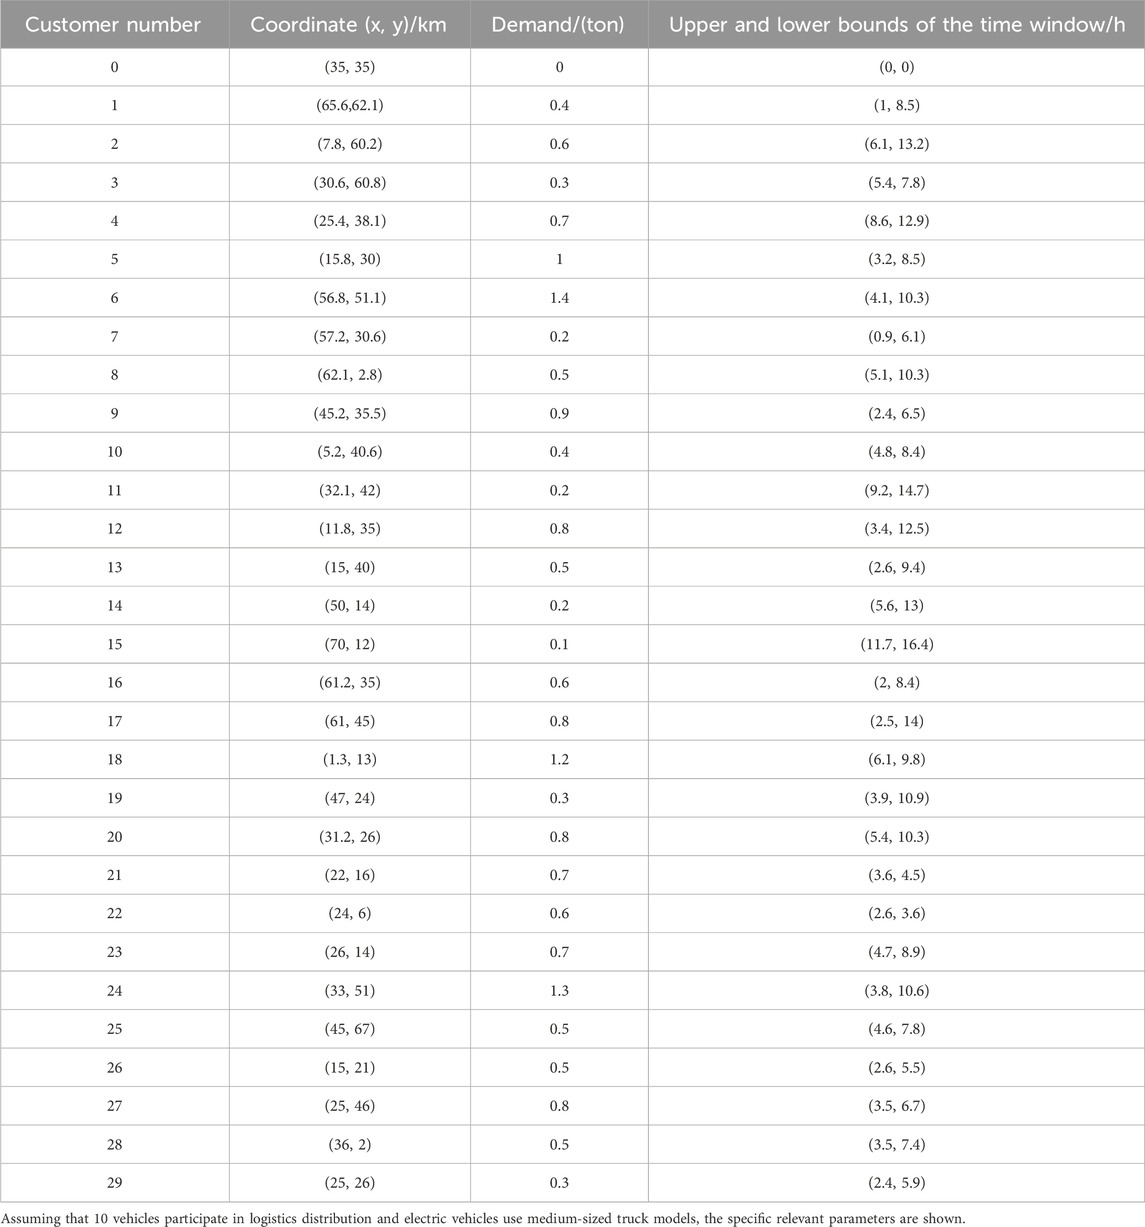
TABLE 1. Study data table.
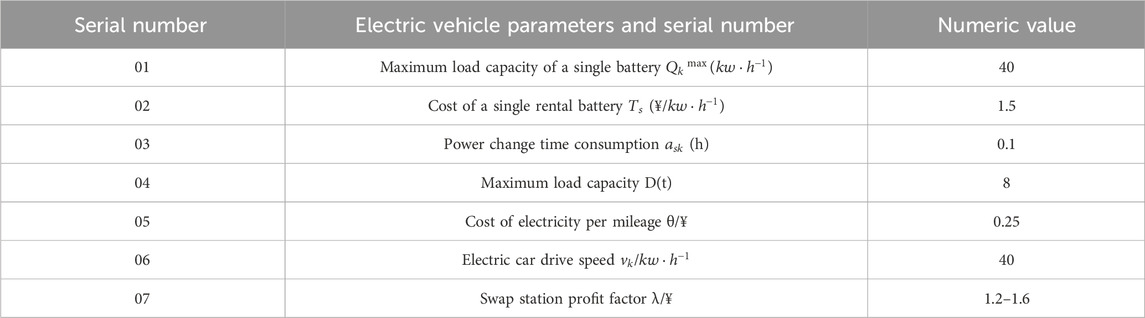
TABLE 2. Electric vehicle-related parameters.
4.2 The result of the model solution
4.2.1 Considering the results of logistics distribution route optimization for time windows
According to the experimental data given in Table 1, this paper uses the method of combining the A* algorithm and the ant colony algorithm to generate the optimal route based on the pheromone iteration, and the optimal distribution path and optimal roadmap are obtained, as shown in Table 3 and Figure 3.
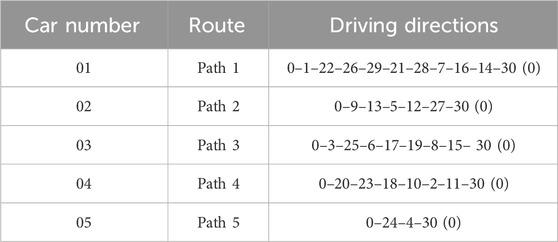
TABLE 3. Optimal route for electric vehicle distribution.
When there is no power exchange behavior, the improved ant colony algorithm in the first stage of this paper design is used to solve the path planning model and obtain the optimal distribution route, and the total cost of distribution generated under the path is 1942.85 yuan. From the path optimization results, it can be seen that subjected to the constraints of the customer’s time window, the first, second, and third paths require multiple electric vehicles for joint distribution to meet the customer’s time window needs, and the total number of delivery vehicles required for distribution is 5. The resulting fixed cost of electric vehicles is 1000 yuan, the distance cost of electric vehicles is 698.67 yuan, and the penalty cost and opportunity cost of the time window are the smallest, 244.16 yuan. It can be seen from this that the distribution route should be reduced as much as possible under the condition of meeting the constraints of the customer’s time window, and the number of vehicles used, that is, the fixed cost expenditure. The optimal delivery route diagram in this article is shown in Figure 4.
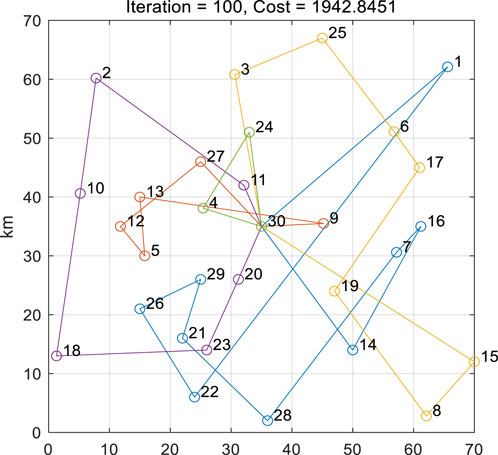
FIGURE 4. Optimal path for electric vehicles.
4.2.2 The result of the site selection of the substation in the power exchange mode
Based on the optimal path optimization map of logistics and distribution obtained above, this paper will next solve the site selection problem of the replacement station, considering the cost of the electric vehicle power exchange and the construction cost of the power exchange station. The difference between model solving in the power-swap mode and no swapping behavior is when the car has less power left, and it will enter the designated substation for power exchange. The entire power exchange process takes a shorter and fixed time than the charging time. The penalty cost and opportunity cost of the time window in this mode will have an impact, as well as the cost of replacing the electricity. Based on the optimal path optimization map, the location coordinates of the candidate points of the alternative station are obtained in this paper, as shown in Table 4.

TABLE 4. Location coordinates of the candidate point of the substation.
Since the vehicle enters the power exchange station for power exchange will delay a certain amount of time, resulting in a change in the time when the electric vehicle arrives at each customer point, the corresponding time window penalty cost and opportunity cost will also change. According to the optimization results of the logistics distribution path obtained above considering the time window, the relevant parameters of the electric vehicle and those of the substation are combined. Considering the load capacity and power constraints of electric vehicles, the second stage of the two-stage hybrid algorithm–genetic algorithm solution is used to minimize the cost of power exchange, the construction cost of the power exchange station, and the total distribution cost. Thus, obtaining the total cost of power exchange for electric vehicles to reach each substation for power exchange, the total cost of each path is shown in Table 5 below.
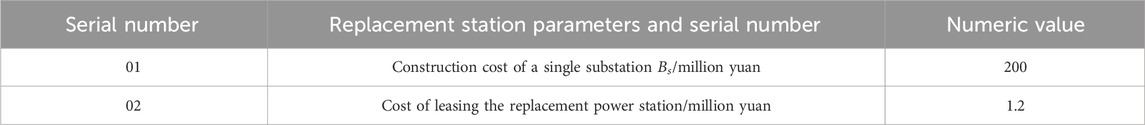
TABLE 5. Parameters related to the substation.
From the results in Table 6, it can be seen that in the power exchange mode, the electric vehicle has insufficient endurance of paths 2 and 3, the customer point 11 of path 1 has an insufficient power problem, the reachable candidate points are 1 and 5, and the total cost of the path to reach candidate point 1 is the smallest, so customer 12 chooses to change power at candidate point 1. In the same way, it can be known that customer points 5, 8, 13, and 9 are replaced at candidate points 5, 5, 1, and 1, respectively. Vehicle 1 in paths 1, 4, and 5 selects candidate point 1, while paths 2 and 3 select candidate point 5, mainly because the customer point in path 1 requires a later delivery time, and the power change mode of the electric vehicle reduces the power replenishment time. As a result, vehicles have plenty of time to travel to distant substations, reducing their opportunity costs. Based on the above results, the best candidate addresses for the replacement station in the power exchange mode are candidate points 1 and 5, and the single power exchange cost is 1139.2 yuan, of which the electricity cost is 338.3 yuan, and the opportunity cost and penalty cost are 445.5 yuan. In the following analysis, this article will discuss the path optimization and site selection of different time windows and power exchange rates.
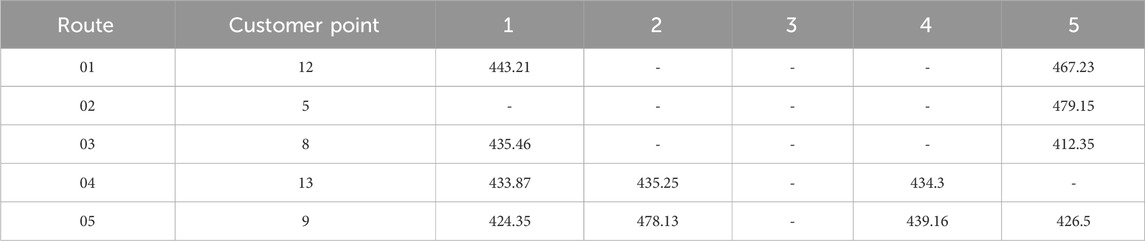
TABLE 6. Total cost of distribution for each route in the case of a power swap (yuan).
4.3 Analysis of influencing factors
Mainly based on the following four situations for analysis and comparison, scenario 1 is the model and method mentioned in the text, and the compromise values in the text are selected for comparative analysis; scenario 2 does not consider customer satisfaction, and the goal is to solve the lowest logistics and distribution costs; scenario 3 does not consider the cost of distribution, and the goal is to achieve the highest customer satisfaction; and scenario 4 targets minimal replacement costs and maximum customer satisfaction.
4.3.1 Time window influencing factors
Based on the definition of the above scenario, the logistics distribution path of the logistics distribution center in scenarios 1, 2, 3, and 4 is shown in Figure 5, and the corresponding logistics distribution journey cost, upper time window opportunity cost, lower time window penalty cost, fixed cost, power replacement cost, and customer satisfaction results are given in Table 7.
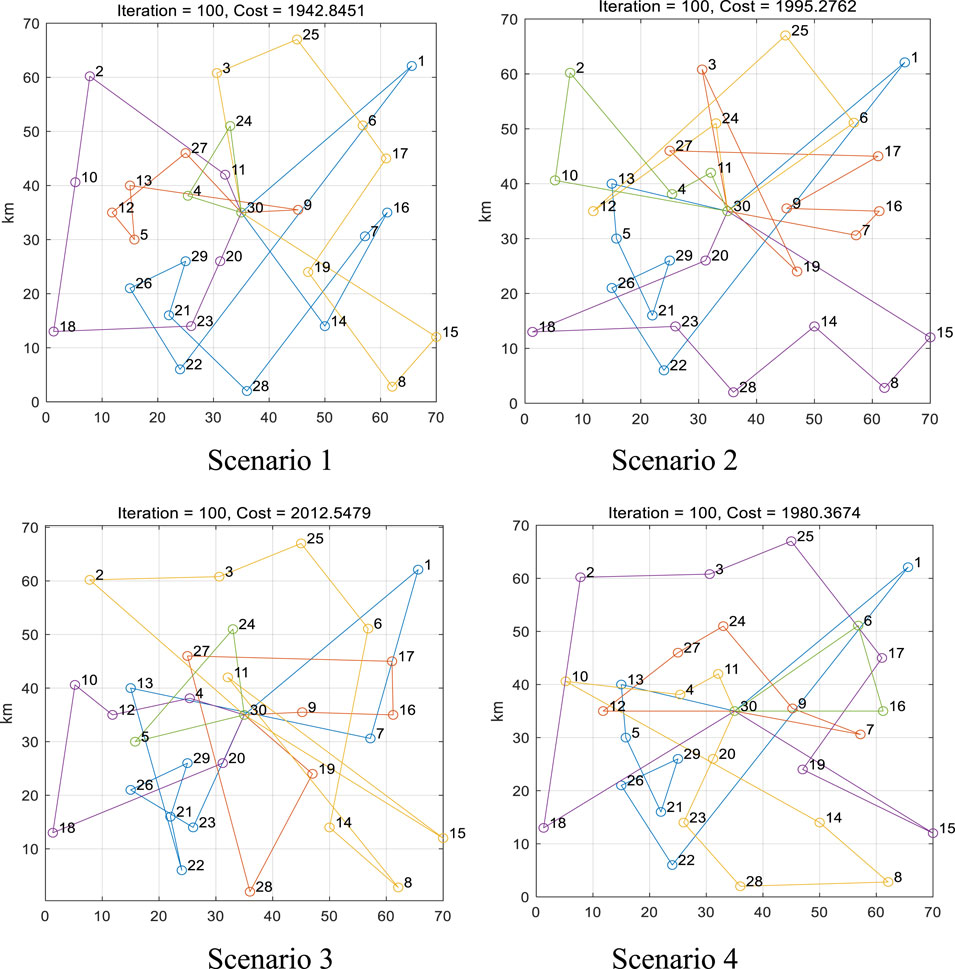
FIGURE 5. Logistics distribution routes in four scenarios.
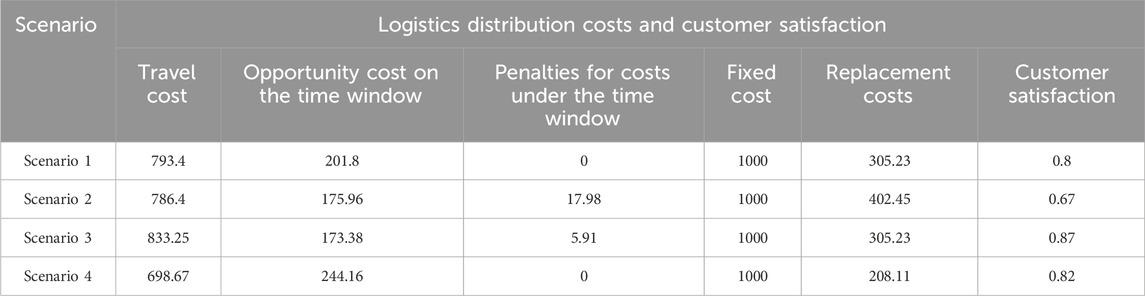
TABLE 7. Logistics distribution costs and customer satisfaction.
Based on Figure 5, it can be seen that the electric vehicle logistics distribution path in scenario 1 has fewer crossovers, scenario 2 has less, scenario 3 has more crossover paths, and scenario 4 has the most crossovers. According to Table 4, with the increase in the number of path crossings, in order to meet the goal of maximum customer satisfaction, the corresponding logistics distribution costs and power exchange costs will increase. Based on scenario 2, it can be seen that the total cost of logistics distribution is lower when the goal of maximum customer satisfaction is not considered. At this time, the total cost of logistics distribution is 1995.27, which will only be distributed under the premise of meeting the time window with the shortest path as the goal, although the distance distribution cost and power replacement cost are reduced, but due to the lack of consideration of the customer’s time window factor, the customer’s satisfaction level decreases to 0.67. For scenario 3, the customer satisfaction level is the largest, 0.87; compared with scenario 2, the satisfaction level increased by 20%, and the total cost of logistics distribution under this scenario is 2012.54, mainly because the logistics distribution center delivers the goods within the specified time window, and the electric vehicle driving route needs to be adjusted in the logistics distribution process, which brings more logistics distribution path crossover and power exchange costs. Scenario 4 considers the goal of the minimum power exchange cost and the maximum customer satisfaction level of the electric vehicle; it can be seen from Table 4 that the customer satisfaction level of scenario 4 has increased by 15% compared with scenario 2, and the power exchange cost is 208.11, which is 97.12 yuan lower than the replacement cost of the electric vehicle and the loss cost of the electric vehicle.
4.3.2 Factors affecting the amount of power exchanged
In order to prevent electric vehicles from re-entering the power exchange station for power exchange due to more remaining electricity, it will affect the normal power exchange order of the power exchange station. This paper assumes that when the residual power of the electric vehicle is less than 20%, the profit factor of the replacement station is 1.2, and it is ascending in steps, and the profit factor of the replacement station increases by 0.1 for every 20% increase in the remaining electricity. This section discusses the impact of the remaining power exchange on the site selection decision, logistics and distribution costs, and power exchange costs of the replacement station. The relationship between the amount of electricity exchanged and the cost of exchanging electricity is shown in Figure 6.
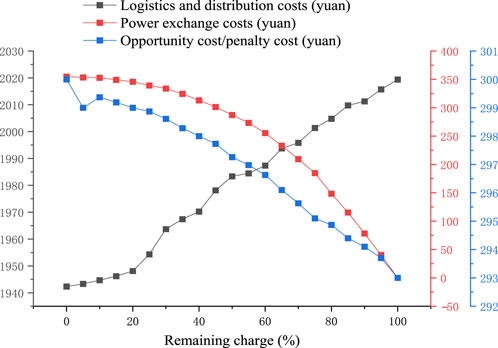
FIGURE 6. Diagram of the relationship between the amount of power exchanged and the cost of the power exchange.
As can be seen from Figure 6, the remaining power of electric vehicles is 0%–100%, and with the reduction of the remaining power of electric vehicle batteries, the total cost of logistics and distribution of electric vehicles has dropped from 2019.37 yuan to 1942.34 yuan, and the cost of power replacement has dropped from 354 yuan to 40 yuan. At the same time, the opportunity cost and penalty cost on the time window are also slowly increasing, from 293.27 yuan to 300.37. From the perspective of the degree of change in the cost of power exchange, the main reason is that with the reduction of the remaining power of electric vehicles, the profit factor of the replacement station is reduced, so when the remaining electricity is closer to 0, the unit replacement cost is smaller. From the perspective of the opportunity cost and penalty cost of the time window, the more the remaining power of the electric vehicle, the more it can ensure that the electric vehicle meets the distribution needs of the remaining customers, and there will be no need to replace the electricity in the middle, which will make the electric vehicle better meet the needs of customers, and the opportunity cost and penalty cost of the time window will be reduced.
Therefore, in order to meet the goal of the minimum total cost and the greatest customer satisfaction of logistics distribution, the gradient electricity price can be set according to the remaining electricity of the electric vehicle to reduce the unit replacement cost. On one hand, it can motivate electric vehicles to choose a power exchange station for power exchange, improve the income of the power exchange station, reduce the number of times the electric vehicle re-enters the replacement station, and effectively improve the battery utilization rate. On the other hand, due to the fixed power change time, electric vehicles can decide whether to change electricity according to their own remaining electricity and the time window needs of customer orders, effectively improving the efficiency of electric vehicle distribution.
5 Conclusion
Based on the impact of time window requirements on customer satisfaction, combined with the implementation of the gradient management of power exchange prices, this paper establishes a logistics distribution path optimization and site selection model for electric vehicles based on the maximum customer satisfaction and the lowest total cost. Among them, the total cost includes logistics and distribution costs, power station construction costs, power exchange costs, and fixed costs of electric vehicles. Aiming at the path optimization and site selection problem of electric vehicles, this paper designs a two-stage hybrid algorithm combining the ant colony algorithm and genetic algorithm to solve the problem, takes a distribution center as an example to select the study data to solve the model, performs numerical analysis, and analyzes whether the time window is set and the impact of the amount of power exchange on the total cost. The results of this paper show the following:
(1) The optimization of electric vehicle paths and the site selection planning of the replacement station considering customer satisfaction can not only effectively reduce the cost of logistics distribution and the cost of power exchange but also improve the level of customer satisfaction. When the cost of travel decreases from 793.4 to 698.67, customer satisfaction also increases from 0.8 to 0.82.
(2) Reduction in the number of path crossings during logistics and distribution routes saves 3.28% of the cost of electric vehicle electricity and logistics and distribution costs, and helps reduce the total cost of the entire logistics distribution network.
(3) The gradient setting of the electricity exchange price will reduce the cost of power exchange, improve the utilization efficiency of the battery while reducing the cost of logistics and distribution, and improve the power exchange income of the power exchange station.
Data availability statement
The raw data supporting the conclusion of this article will be made available by the authors, without undue reservation.
Author contributions
YZ: conceptualization, methodology, validation, and writing–original draft. WR: validation and writing–original draft. PH: validation and writing–original draft. JJ: writing–original draft. ZL: writing–review and editing. YJ: visualization and writing–review and editing.
Funding
The author(s) declare that no financial support was received for the research, authorship, and/or publication of this article.
Acknowledgments
This research is supported by the Sate Gird Sichuan Economic Research Institute (SGSCJY00JJJS2310038)
Conflict of interest
The authors declare that the research was conducted in the absence of any commercial or financial relationships that could be construed as a potential conflict of interest.
Publisher’s note
All claims expressed in this article are solely those of the authors and do not necessarily represent those of their affiliated organizations, or those of the publisher, the editors, and the reviewers. Any product that may be evaluated in this article, or claim that may be made by its manufacturer, is not guaranteed or endorsed by the publisher.
References
An, D., Cui, F., and Kang, X. (2023). Optimal scheduling for charging and discharging of electric vehicles based on deep reinforcement learning. Front. Energy Res. 11, 1273820. doi:10.3389/fenrg.2023.1273820
Appiah, M., and Xiong, Q. (2019). Route optimization in logistics distribution based on particle swarm optimization. Int. J. Comput. Appl. (30), 178. doi:10.5120/ijca2019919179
Bai, M., Zhang, M., and Wang, X. (2021). Policies and trends of global new energy vehicle industry development under the background of carbon neutrality. Inf. Technol. Stand. (12), 13–20. doi:10.3969/j.issn.1671-539X.2021.12.004
Berk, İ. R., and Bülent, Ç. (2022). The effect of battery degradation on the route optimization of electric vehicles. Procedia Comput. Sci., 204. doi:10.1016/J.PROCS.2022.08.118
Cheng, N., Zheng, P., Zheng, X., and Zhu, Z. (2023). Electric vehicle charging load prediction based on variational mode decomposition and prophet-LSTM. Front. Energy Res. 11, 1297849. doi:10.3389/fenrg.2023.1297849
Deng, Y., Mu, Y., Jia, H., Zhang, Y., et al. (2021). Logistics distribution path planning and charge and discharge management of electric vehicles considering customer satisfaction. Operations Res. Manag. 30 (7), 136–145. doi:10.12005/orms.2021.0000
Dong, J., Xiong, T., and Yang, H. (2018). Electric vehicle charging strategy considering electricity price mechanism and logistics distribution demand. J. Electr. Power Sci. Technol. 33 (3), 115–119. doi:10.3969/j.issn.1673-9140.2018.03.018
The General Office (2020). The general office of the state council issued the "development plan for the new energy vehicle industry (2021-2035)". Auto. Parts, (12), 33.
Guo, D., Li, C., Yan, W., Xu, Y., Wang, Y. q., Zhou, Y. c., et al. (2022). Optimal path planning method of electric vehicles considering power supply. J. Central South Univ. 29 (1), 331–345. doi:10.1007/s11771-022-4924-x
Li, Y., Liu, B., Yao, B., Chen, J., Qu, K., Wu, Q., et al. (2022). Site selection of expressway substation considering the stochastic characteristics of road network[J/OL]. J. Jilin Univ. Eng. Sci. 1-9. doi:10.13229/j.cnki.jdxbgxb20220767
Ming, L. I., Deng, Y., and Yang, H. (2016). Path selection and charging navigation strategy of electric vehicles under time-of-use electricity price. China South. Power Syst. Technol. 10 (8), 61–66. doi:10.13648/j.cnki.issn1674-0629.2016.08.009
Qin, Ge, and He, H. (2021). Research on site selection of electric vehicle swap station based on actual data. E3S Web Conf., 271. doi:10.1051/E3SCONF/202127101009
Ren, C., Wang, J., You, Y., and Zhang, Yu (2020). Routing optimization for shared electric vehicles with ride-sharing. Complexity. doi:10.1155/2020/9560135
Saeed, M. A., El-Kenawy, E. S. M., Ibrahim, A., Abdelhamid, A. A., Eid, M. M., El-Said, M., et al. (2023). A novel voting classifier for electric vehicles population at different locations using Al-biruni earth radius optimization algorithm. Front. Energy Res. 11, 1221032. doi:10.3389/fenrg.2023.1221032
Wang, M., Liu, K., and Niu, L. (2015). Research on electric vehicle battery distribution network and its scheduling algorithm in power swap mode. Logist. Technol. (9), 108–111. doi:10.3969/j.issn.1005-152X.2015.09.033
Wang, R., Li, X., Xu, C., and Li, F. (2020). Study on location decision framework of electric vehicle battery swapping station: using a hybrid MCDM method. Sustain. Cities Soc., 61. (prepublish). doi:10.1016/j.scs.2020.102149
Yang, Y., Wu, X., Zhang, Z., Jin, R., Zhang, C., Li, S., et al. (2023). Integrated energy system optimization and scheduling method considering the source and load coordinated scheduling of thermal-storage electric boilers and electric vehicles. Front. Energy Res. 11, 1237781. doi:10.3389/fenrg.2023.1237781
Zhang, B., Li, Z., Li, C., Duan, Q., Liu, L., Zu, G., et al. (2023). Research on new energy vehicle charging prediction based on Monte Carlo algorithm and its impact on distribution network. Front. Energy Res. 11, 1269041. doi:10.3389/fenrg.2023.1269041
Zhang, Li, Liu, Z., Lan, Yu, Fang, Ke, Yao, B., and Yu, B. (2022). Routing optimization of shared autonomous electric vehicles under uncertain travel time and uncertain service time. Transportation Research Part E, 157. doi:10.1016/j.tre.2021.102548
Zhao, X., and Liang, G. (2023). Optimizing electric vehicle charging schedules and energy management in smart grids using an integrated GA-GRU-RL approach. Front. Energy Res. 11, 1268513. doi:10.3389/fenrg.2023.1268513
Zhou, B., and Tan, F. (2018). Vehicle assembly line electric vehicle distribution path and site selection optimization. J. Hunan Univ. Nat. Sci. Ed. 45 (02), 69–77. doi:10.16339/j.cnki.hdxbzkb.2018.02.09
Zu, S., and Sun, L. (2022). Research on location planning of urban charging stations and battery-swapping stations for electric vehicles. Energy Rep. 8 (S4), 508–522. doi:10.1016/j.egyr.2022.01.206
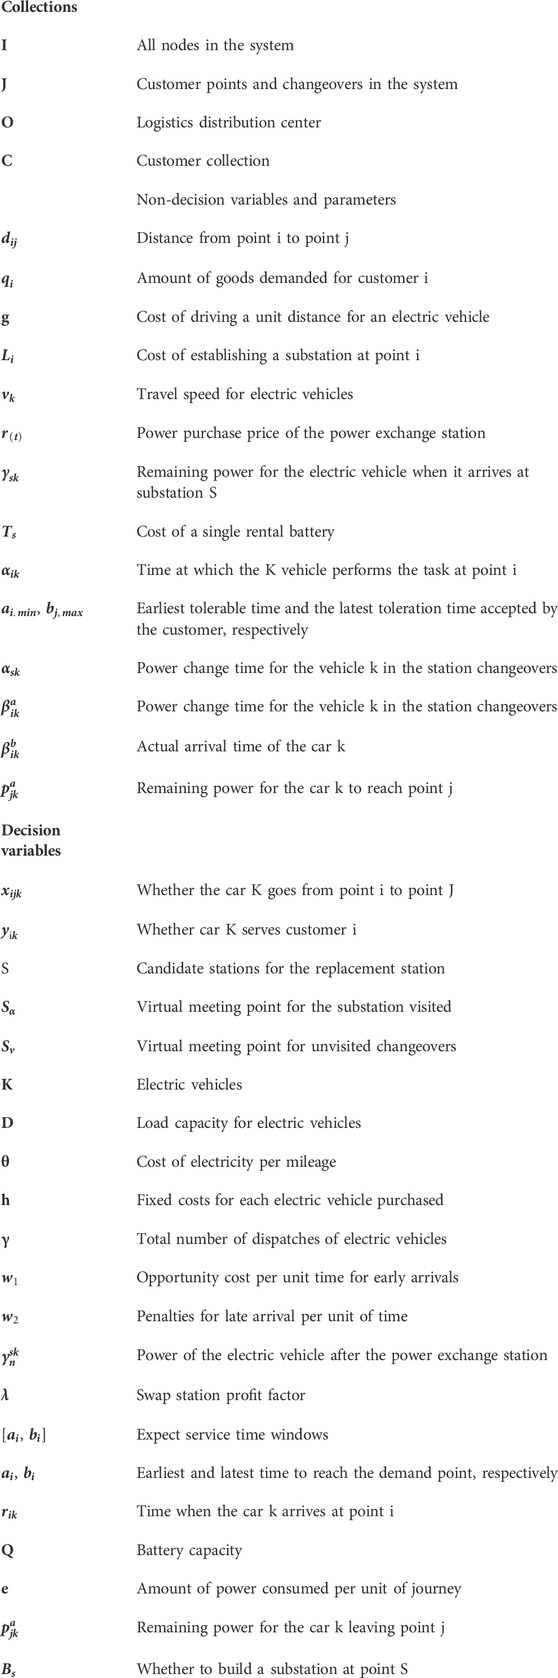
Nomenclature
Keywords: electric vehicle, two-stage hybrid algorithm, path optimization, site selection of battery swapping stations, customer satisfaction
Citation: Zhang Y, He P, Ren W, Jiao J, Long Z and Jian Y (2024) A customer satisfaction-based optimization model for the charging and discharging path and battery swapping stations’ site selection of electric vehicles. Front. Energy Res. 12:1353268. doi: 10.3389/fenrg.2024.1353268
Received: 10 December 2023; Accepted: 15 January 2024;
Published: 07 February 2024.
Edited by:
Shenbo Yang, Beijing University of Technology, ChinaReviewed by:
Gejirifu De, Technical University Dortmund, GermanySiyuan Chen, North China Electric Power University, China
Wei Fan, Beihang University, China
Copyright © 2024 Zhang, He, Ren, Jiao, Long and Jian. This is an open-access article distributed under the terms of the Creative Commons Attribution License (CC BY). The use, distribution or reproduction in other forums is permitted, provided the original author(s) and the copyright owner(s) are credited and that the original publication in this journal is cited, in accordance with accepted academic practice. No use, distribution or reproduction is permitted which does not comply with these terms.
*Correspondence: Wenshi Ren, Mjk1MDkwOTcxOEBxcS5jb20=