 Peng Zhang
 Junshi Chen2
- 1School of Electrical and Information Engineering, Tianjin University, Tianjin, China
- 2Lishui Power Supply Company, State Grid Zhejiang Electric Power Co., Ltd., Lishui, China
- 3Electric Power Research Institute, State Grid Beijing Electric Power Company, Beijing, China
In this article, a comprehensive analysis is conducted on the influencing factors of carbon emissions in the transportation sector during the evolution of electrification in Beijing. We also considered the impact of indirect carbon emissions caused by carbon emissions from public and private cars and electricity consumption on overall carbon emissions. Based on the LMDI decomposition theory, nine influencing factors are separated, including development level, energy intensity, vehicle structure, number of private cars, and private transportation energy consumption. The analysis results show that, from 2010 to 2021, the carbon emissions from transportation in Beijing increased from 922.98 × 10⁴t to 1490.6 × 104t. The private road carbon emission accounts for about 77.97%, and has become a decisive factor affecting road carbon emissions. In the public domain the contribution values of the development level and energy intensity are 25.20% and −38.71%, respectively. And they are the two most critical factors affecting carbon emissions on public road carbon emissions. In the private domain, the contribution values of the number of private cars, energy consumption of private transportation, and vehicle structure are 60.17%, 47.86%, and −12.99%, respectively. They are the three key factors affecting the private road carbon emissions. There is a significant difference in the proportion of indirect carbon emissions from electricity in the public and private domain. Indirect carbon emissions from electricity account for about 13.6% of road carbon emissions in the public sector, and about 0.9% in the private sector. The results in this paper provide useful references for decision-making in the adjustment of transportation energy structure and the promotion of electrified transportation in Beijing and other cities.
1 Introduction
With the increasing use of fossil energy, its emissions lead to a more serious greenhouse effect. In an effort to tackle climate change, the world signed the Paris Agreement in 2015 to stop global temperatures from rising. China is committed to achieving carbon peak by 2030 and carbon neutrality by 2060. However, CO2 emissions of China’s transportation industry have increased rapidly, and road traffic carbon emissions are dominant. Therefore, in order to achieve the goal of “double carbon,” it is necessary to conduct detailed research on road traffic carbon emissions. As an important transportation hub in China, Beijing’s transportation industry transport 240.374 million tons of goods and 280.577 million passengers in 2022. Beijing’s transportation industry has become an important component of China’s road traffic field, so it is necessary to conduct in-depth analysis of Beijing’s road traffic carbon emissions. So that it can provide effective guidance on how to decarbonize road traffic across the country.
At present, a large number of literatures have studied carbon emissions in the field of electrified transportation. As a key carbon emission factor in the field of transportation, automobiles have great research value. Therefore, starting from the direction of energy types, scholars believe that the development of electric vehicles instead of fuel vehicles can effectively alleviate traffic carbon emissions (Liu et al., 2022), and then study the impact of electric vehicles on traffic carbon emissions. Wang (2021) analyzed the impact of electric vehicles on carbon emissions in Maryland, United States, and concluded that CO2 emissions caused by electric vehicles have a large weight in the total CO2 emissions of road passenger transport. Zhang and Su (2020) also proposed to accelerate the scientific research and promotion of new energy vehicles to solve the problem of transportation carbon emissions, believing that this is an effective way to reduce carbon emissions in the field of transportation vehicles and break the bottleneck of low-carbon urban environment. Rui Feng et al. believe that the proportion of pollution-free electricity and coal electricity input in the charging process of electric vehicles is one of the important indicators to determine how much carbon emissions indirectly generated by electric vehicles. If the electricity input in the charging process of electric vehicles is pollution-free electricity, it can be understood that electric vehicles do not cause carbon emissions in the charging process. If the electricity input by the electric vehicle during the charging process contains coal electricity, it can be considered that the electric vehicle indirectly causes carbon emissions. According to research, more than 90% of energy consumption in China’s transportation field is fossil energy that will cause pollution, and the proportion of non-polluting electricity in the charging number of electric vehicles is only 15% (Chang et al., 2011). At present, some scholars have studied the indirect carbon emissions caused by electric vehicle consumption of electric energy in road traffic (Cao and Jiang, 2018), but they have not carefully distinguished the impact of buses and private cars on carbon emissions. Literature (Zhuang and Xia, 2017) included the carbon emission of urban private transportation into the carbon emission accounting content, but ignored the impact of indirect carbon emission caused by electric energy on road carbon emission when the proportion of electric vehicles is increasing. In addition, there have been studies on transport carbon emissions from different angles, including the factors affecting transport carbon efficiency, the impact of residents’ socio-economic characteristics on transport carbon emissions, the changes in carbon emissions from freight transport, the prediction of transport energy consumption or transport carbon emissions (Li and Jiu, 2016), as well as the improvement of transport measures, the use of new energy vehicles and low-emission vehicles, and the promotion of government policies to reduce carbon emissions from transport, among others. Research on the effect of transport carbon emission reduction. In terms of estimation of transport carbon emissions, Jia et al. (2010) estimated the level of transport energy consumption in China based on international calibre and compared it with that of other developed countries; Zhang et al. (2014) measured the energy consumption and carbon emissions of Beijing’s public transport in the whole life cycle; Zhao et al. (2009) estimated the carbon emissions of Shanghai’s urban transport such as private cars and buses; and Kakouei et al. (2012) estimated the carbon emissions of buses, taxis, private cars and motorbikes in Tehran, Iran. Regarding the selection of methods for analysing the factors affecting carbon emissions, among the mainstream methods for analysing carbon emissions, the LMDI decomposition method has been widely used due to its advantages of being residual-free and easy to use, and its decomposition process is simpler than that of the modified Fisher decomposition method and the S/S decomposition method, which is easier to be put into practical application (Liu et al., 2017; Zhang and Liu, 2021; Li et al., 2023).
From the viewpoint of existing literature, the current domestic research on urban road traffic carbon emissions still stays at the level of large-scale transportation operations mainly in the public sector (Wang et al., 2017; Gao, 2019; Liang and Feng, 2021), and does not give much consideration to the carbon emissions of the private sector, which are gradually becoming dominant, resulting in the limitations of the current analysis of road traffic carbon emissions (Cai et al., 2011; Xie and Wang, 2011; Li, 2022). With the increasing number of new energy vehicles, the electrification of transportation has also appeared new characteristics, and the carbon emissions of private road transportation have become an important part that cannot be ignored, and it is necessary to include the private sector in the accounting process of road carbon emissions into the scope of accounting (Yuan and Pan, 2013). Therefore, the purpose of this paper is to account for the carbon emissions generated by gasoline and fuel oil consumed by road traffic, distinguish the contribution of buses and private cars to the overall carbon emissions, and include the indirect carbon emissions caused by the consumption of electric energy by electric vehicles in the scope of the accounting, and optimize the traditional Kaya model, decompose the targeted influencing factors through LMDI decomposition, and explore the influence mechanism of the energy structure, the structure of the vehicle ratio, and other factors on carbon emissions. The study explores the influence of energy structure, vehicle ratio structure and other factors on carbon emissions, and provides a reference for Beijing and other cities to make decisions on the adjustment of transportation energy structure and the popularization of electrified transportation.
2 Research methods and data sources
Firstly, the transportation energy consumption is estimated, and then the transportation carbon emissions are estimated by the accounting method provided by IPCC (United Nations Intergovernmental Panel on Climate Change). Finally, the LMDI decomposition method is applied to analyze the factor decomposition of transportation carbon emissions, establish the influence factor model, and calculate the change value of each type of carbon emissions. The expression of the contribution value of each decomposition factor is written to quantitatively analyze the contribution value of each influence factor of transportation carbon emission (Li and Jiu, 2016). For the carbon emissions of road transportation in the private sector mentioned in this paper, the influence of the structure of private transportation vehicles is included in the factor decomposition analysis, and the energy intensity factor is divided into secondary indicators when establishing the influence factor model, and the intensity of thermal power and the actual electrical energy intensity are introduced.
2.1 Carbon emission accounting methods
As for the carbon emissions of the transportation industry, China does not have a formal data source platform at present. In this case, to obtain more accurate carbon emission data, reasonable calculation and speculation can only be made through the relevant data of carbon emissions. In the 2006 IPCC Guidelines for National Greenhouse Gas Inventories (Research on China’s Sustainable Development Energy and Carbon Emission Scenarios, 2003), two methods for calculating CO2 emissions of the transportation industry are proposed: “total” and “sub-total.” The “total” method is to calculate the amount of energy consumed in the process of transportation to obtain CO2 emissions. “sub-total” is the indirect calculation of CO2 emissions through the calculation of energy consumption by calculating the types of transport vehicles used in various modes of transportation, the number of hundred kilometers, hundred kilometers of fuel consumption and other data.
Considering the completeness of the published data in China’s transportation sector in the actual situation, this paper decides to adopt the total score in the 2006 IPCC Guidelines for National Greenhouse Gas Inventories to calculate CO2 emissions. Taking into account the actual situation of fuels used in the road transportation sector, the fuel types considered in this paper are divided into three categories: gasoline, diesel and electricity. Most of the emissions in the road transportation sector are CO2 emissions, so the data obtained by the above method is approximately equal to the carbon emissions and can be used.
2.2 Carbon emission decomposition method
A quantitative analysis method of replacing carbon emission reduction by electric energy in key industries is studied under the influence of multiple factors, and it is inevitable to choose the carbon emission factorization method to decompose carbon emissions into various factors for quantitative analysis. Carbon emission factorization methods fall into two categories: exponential factorization analysis (IDA) and structural factorization analysis (SDA). In contrast, the IDA method is simpler and more widely applicable. The carbon emission decomposition method is shown in Figure 1:
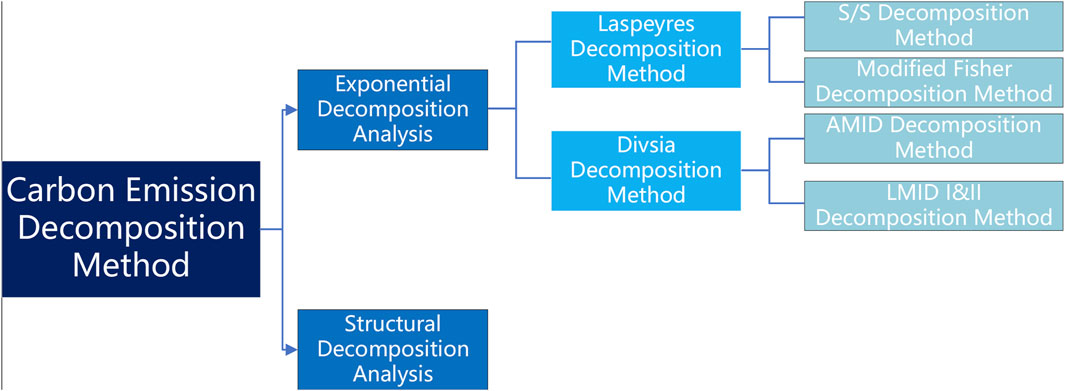
Figure 1. Carbon emission decomposition method.
Among the methods in the IDA category, the LMDI I decomposition method has the characteristics of strong applicability and accurate calculation results, so it has gained attention and exerted greater influence in the field of carbon emissions, and is mainly used to analyze the influence factors of national carbon emissions, regional carbon emissions, and the influence of industry development on carbon emissions.
The analysis of carbon emissions before and after the implementation of electric energy replacement in key industries belongs to the analysis of the impact of industry development on carbon emissions. Therefore, the LMDI I method is chosen for carbon emission decomposition.
2.3 Beijing road carbon emission accounting
2.3.1 Estimation of transportation energy consumption
The first step in carbon emission accounting is to estimate transportation energy consumption, as shown in Eq. 1.
where, i is the type of fuel, including gasoline, diesel and electric energy. j is the mode of transportation, considering highway; k is the type of carriage, including passenger and freight; t is the year; Eti is the amount of discounted coal converted to the i fuel in year t; Etj,k,i refers to the amount of discounted coal converted into fuel of type i in type j passenger or freight mode k in year t; Qtj,k,i refers to the physical amount of fuel of type i when it is consumed by type k passenger or freight transport mode of type j in year t; Fti is the contribution factor of Class i energy converted into standard coal in year t.
2.3.2 Calculation method of transportation carbon emission
The second step in carbon emission accounting is to calculate transportation carbon emissions, as shown in Eq. 2.
In the formula, Ei is the discounted coal amount of the i fuel, Ki is the carbon emission coefficient of various fuels, meaning the heat generated by various fuels in the reaction process and the carbon molecular weight in the chemical reaction formula. The following calculations in this paper consider carbon emissions from the public and private sectors of road transport, and the types of energy consumption considered are petrol, diesel and electricity.
2.4 Decomposition model of road traffic carbon emission factors in Beijing
According to the specific energy consumption and carbon emissions derived from the above, the traditional Kaya constant equation model was improved and extended to establish a multi-influence factor decomposition model in Eq. 3, decompose the carbon emissions of the transportation industry into 10 corresponding influencing factors, and the LMDI I decomposition method was chosen to decompose the carbon emissions into quantitative contribution values of the influencing factors according to the proportion of the weights, so as to study the influencing mechanism of the influencing factors on the carbon emissions of the roads in Beijing.
C is transportation carbon emission; Ci/Ei = YEi is the carbon emission coefficient of the i energy consumption; Ei/E = YSi is the proportion of the i type of energy consumption in the total road energy consumption, representing the energy structure; E/Vd = YIi is the energy consumption per unit turnover of the road, representing the energy intensity of the road; Vd/V = YGd is the weight ratio of the turnover of road transport mode in the total turnover of transportation, and is the transportation structure; V/Y = YF is the ratio of the total transportation turnover to the added value of the transportation GDP, and is the transportation intensity; Y represents the added value of transportation GDP; CS/ES = SE is the ratio of transportation carbon emissions to energy consumption discount coal amount, representing carbon emissions per unit energy consumption of private transportation; Es/Ki = SI is the energy consumption of private transportation unit of corresponding fuel type; Ki/K = SKi for private transport vehicle architecture; K is the number of private vehicles. E3/ES= YH is the proportion of thermal power generation in total power generation; ES/E= YB is the ratio of actual electricity consumption to total energy consumption.
Here an idea is provided that when only considering a certain type of energy consumption, it is possible to break down a certain influence factor in Eq. 4 in a more targeted way to analyze the contribution of its corresponding secondary influence factor under the current energy source, such as that shown in Eq. 5. This split is used to analyze the mechanism of the influence of secondary influences on carbon emissions.
2.4.1 Calculate the change in transportation carbon emissions
∆CYE is carbon emission effect per unit energy consumption; ∆CYS is Energy architecture effect; ∆CYI is Energy intensity effect; ∆CYG is Transport structure effect ∆CYF is transport intensity effect; ∆CY is development level effect; ∆CSE is Carbon effect of private transportation; ∆CSI is Private transportation energy consumption; ∆CSK is Vehicle architecture effect; ∆CK is Number of private cars.
2.4.2 Column write the contribution value expression of each decomposition factor
The contribution value of each decomposition factor is expressed as follows. The changes in transportation carbon emissions over the years are shown in Eq. 6, which is obtained by subtracting the current year’s carbon emissions from the baseline year’s carbon emissions. During the process of differencing, each influencing factor is differenced and mathematically substituted, resulting in the final expression of each influencing factor as Eq. 6–16. The representative meanings of each influencing factor in the formula are as follows:
Eqs 17, 18 represent the carbon emission contribution coefficients of the corresponding influencing factors in the public and private sectors, respectively. The specific formulas are as follows
2.5 Data source
The basic data used in this paper include economy, transportation and energy consumption, etc., which come from Beijing Statistical Yearbook (2010–2021), China Statistical Yearbook (2010–2021), China Transportation Yearbook (2010–2021) and China Energy Statistical Yearbook (2010–2021). In order to ensure accuracy, a reasonable conversion method is needed to normalize the physical data of energy consumption in Beijing Statistical Yearbook. We used the energy conversion coefficient provided in China Statistical Yearbook 2021 for correction, and the specific correction coefficient is shown in Table 1. As for the turnover data of roads, railways, pipelines and civil aviation, it is obtained from the Beijing Statistical Yearbook and the China Statistical Yearbook, while the energy consumption per unit turnover data is obtained from the China Transportation Yearbook.
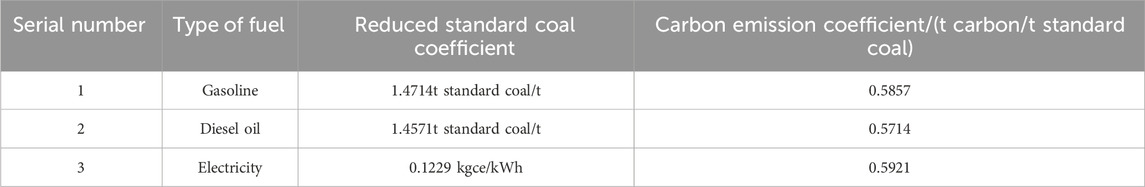
Table 1. Conversion coefficients of various fuels.
The data of fuel consumption in the private transportation sector refer to the consumption of gasoline and diesel in the domestic energy section of the China Energy Statistical Yearbook for 2010–2021. The data of the added value of the transportation industry are from the Beijing Statistical Yearbook, and the number of private vehicles is from the number of private vehicles in the China Transportation Yearbook.
The discounted coal coefficient is taken from the General Principles for the Calculation of Comprehensive Energy Consumption, and the carbon emission coefficient is taken from the 2006 IPCC Guidelines for National Greenhouse Gas Inventories.
3 Result analysis
3.1 Total carbon emission analysis of road traffic
Road traffic carbon emissions in Beijing showed an overall growth trend during 2010–2021. In 2010, the total carbon emission of road traffic was 992.98 × 10⁴t, and reached the highest value of 1516.97 × 104t in 2019, with the maximum increase of 523.99 × 10⁴t, with a total increase of 52.77%. During the period of 2019–2021, due to major public health events, the data decreased slightly, which was 1490.60 × 104t in 2021, with an increase of −26.37 × 10⁴t and a growth rate of −1.7%. As can be seen from Figure 2, carbon emission from the public sector in 2010 was 264.22 × 10⁴t, and this data increased to 327.09 × 10⁴t in 2019, with an increase of 62.87 × 10⁴t, or 23.79%. From 2019 to 2021, due to special factors, it will be reduced to 261.68 × 10⁴t. In 2010, the carbon emission of the private sector was 728.75 × 10⁴t, and in 2021, it increased to 1228.97 × 104t, an increase of 500.22 × 10⁴t, an increase of 68.64%. From the perspective of public and private, the increase of the private sector has driven the increase of the total carbon emission of road traffic to a greater extent and is relatively stable and not susceptible to special factors. It further explains the necessity of carbon emission accounting in the private sector.
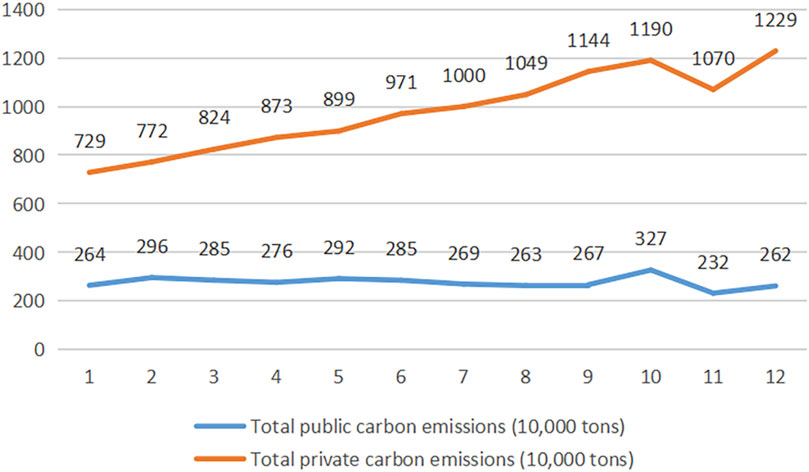
Figure 2. Comparison of total road carbon emissions of public and private sphere over the years.
3.2 Analysis of carbon emission factors
3.2.1 Analysis of public sector carbon emission factors
Figure 3 shows the decomposition effect diagram of carbon emissions, and the factors analyzed in the public domain are as follows.
(1) Energy intensity. A reduction in energy intensity can drive a reduction in energy consumption, that is, the ratio of the amount of energy (fuel) consumed to the amount of traffic turnover (the algebraic product of the tons of goods transported and the distance traveled). During the period of 2010–2021, the inhibitory effect was always maintained, and the contribution to the inhibition of carbon emissions in Beijing traffic was the largest, with a contribution value of −201.43 × 10⁴t, and the contribution rate reached −38.71%.
(2) Transportation structure: It has a significant positive impact on the increase of transportation carbon emissions. Considering the carbon emission and transportation efficiency data of railway, water transport, civil aviation, road and other modes, the carbon emission of railway is the highest, and the carbon emission of road ranks the second under the same transportation efficiency. From the perspective of the overall transport proportion, in the 10 years after 2010, the proportion of railway transport is stable, by the rise of new industries such as express delivery industry, road transport has maintained a high growth trend. The proportion of road turnover in the total turnover increased from 17.8% in 2010 to 26.3%, while the proportion of railway turnover decreased by 16.28%. The road transport volume only decreased slightly in some years, and the effect of the transport structure on the carbon emissions in the transport sector was negative, while the effect of the transport structure on the carbon emissions in the transport sector was positive in most years.
(3) Transport intensity: has an inhibiting effect on the change of carbon emissions in Beijing transportation. Transport intensity refers to the ratio of transport turnover (the algebraic product of tons of goods transported and transport distance) and the gross transport product within a cycle. A higher transport intensity is understood to mean that under the condition of constant gross product, a higher transport turnover is required to complete the project, whereas a lower transport intensity reflects high transport quality. From 2010 to 2020, the transportation intensity will be reduced from 1.28 × 10⁹t*km/106 thousand yuan to 1.12 × 10⁹t*km/106 thousand yuan, with an overall reduction of 12.5%, which has played an effective role in inhibiting the reduction of carbon emissions. The two periods from 2010 to 2013 and 2018 to 2019 have a positive effect on carbon emissions in the transportation sector of Beijing for a short time, and a negative effect in most and recent years, but the effect is relatively slight. In general, it can be seen that the transportation intensity has a inhibiting effect on carbon emissions in the transportation sector.
(4) Development level: It is the leading factor in the increase of Beijing’s transport carbon emissions, and has been increasing from 2010 to 2019, contributing a large proportion to the increase of Beijing’s transport carbon emissions, reaching 25.20%. It briefly declined in 2020 due to special factors. But the overall trend is strong. During 2010–2021, transport carbon emissions increased by 497.62 × 10⁴t, which is 150% of 2010 carbon emissions. During the same period, the gross transport product of Beijing increased from 570.4×10⁹ yuan to 942.5×10⁹ yuan, with an overall increase of 165%. The growth rate of the gross transport product of Beijing was higher than the increase rate of carbon emissions in the same period. Reasonable low-carbon policies and sustainable economic development provided a more scientific and comprehensive sustainable development path for the transport industry.
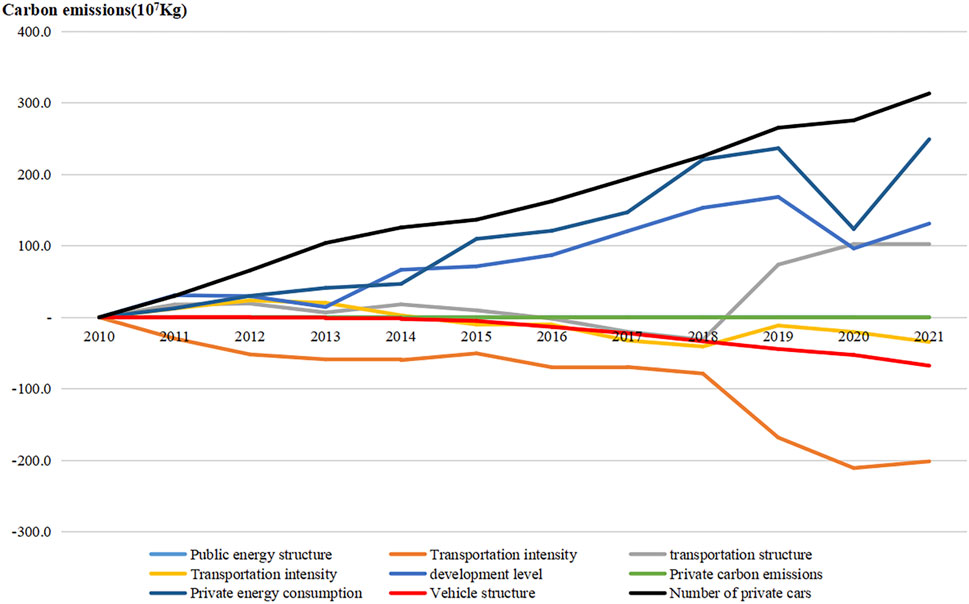
Figure 3. Carbon emission decomposition effect.
Generally speaking, in the public sector, the transportation structure has a positive effect on the growth of Beijing’s transportation carbon emissions, but the magnitude of the effect is not large; the level of development has a significant positive effect on Beijing’s transportation carbon emissions; and the energy structure, energy intensity, and transportation intensity all have negative effects on the changes in Beijing’s transportation carbon emissions.
3.2.2 Analysis of private sector carbon emission factors
Factors in the private sector are analyzed respectively as follows.
(1) Energy consumption of private transportation: It has a significant positive impact on the increase of carbon emissions from transportation in Beijing. The unit vehicle energy consumption of private automobiles is the ratio of energy consumption of private automobiles to the number of private automobiles. The higher the proportion of clean automobiles, the lower the unit vehicle energy consumption, and the more obvious the inhibition effect. In 2010, the unit vehicle energy consumption of private automobiles was 906.4 kg of standard coal, which increased to 1097.8 kg of standard coal in 2021, and briefly decreased in 2020 due to special factors. The rising energy consumption of private vehicles indicates that the traditional automobile and new energy automobile industry still has great potential for development in energy conservation and emission reduction.
(2) Vehicle structure: It refers to the proportion of vehicles consuming different energy in the total number of vehicles. As the structure of private vehicles gradually enters the stage of new energy transformation, the market share of clean energy will further increase, and the inhibition effect on carbon emissions will be enhanced year by year. In 2021, the generation of carbon emissions of 67.59 × 10⁴t has been suppressed, and the contribution rate reaches −12.99%. And maintain the trend of stable inhibition. Excellent vehicle structure scale system will be an important way of low-carbon in our country in the future.
(3) The number of private cars has a significant positive impact on the increase of carbon emissions from Beijing’s transportation, with the total number of private cars increasing at a high rate from 3.744 million to 5.211 million during 2010–2021, an increase of 140% over the same period. With the rapid development of China’s economy and the perfection of the auto industry system, the scale of private cars will continue to rise. At present, the carbon emissions caused by private cars account for 60.17% of the total carbon emissions from transport in Beijing. The continuous expansion of the scale of private vehicles will change the traditional situation of China’s road carbon emission based on public transportation and enter a new era dominated by private transportation. The carbon emission of private transportation has become an important part of the research and accounting of carbon emission in the field of transportation.
In the private sector, the energy consumption of private transportation and the number of private cars have a significant positive effect on Beijing’s transportation carbon emissions; the vehicle structure shows a negative effect on the transformation of Beijing’s transportation carbon emissions; the vehicle structure refers to the ratio of vehicles consuming different energy sources in the total number of vehicles; the higher the ratio of clean cars, the lower the energy consumption of the unit of vehicles, and the more significant the inhibition effect. Through the private sector, the above three effects show that the increase of the proportion of clean energy has an obvious inhibiting effect on the carbon emission of Beijing transportation, and the electric vehicle power substitution technology can further improve its inhibiting effect under the existing situation of the continuous expansion of the scale of the private car, and the feasibility of the technology is high. Specific analysis data are shown in Table 2.

Table 2. CO2 carbon emissions table for various effects.
3.3 Road traffic energy structure analysis
As shown in Figure 4, in road traffic in the public sector, carbon emissions caused by the three energy sources each account for a certain proportion, among which the average carbon emissions caused by gasoline account for 47.6%, the average carbon emissions caused by diesel account for 38.7%, and the average indirect carbon emissions caused by electric energy account for 13.7%. Between 2011 and 2021, the growth rate of carbon emissions caused by gasoline is 21.2%, the growth rate of carbon emissions caused by diesel is 19.2%, and the growth rate of indirect carbon emissions caused by electricity is 50.1%. As can be seen from Figure 5, in the private sector, the proportion of carbon emissions caused by gasoline, diesel and electric energy differs greatly, and the carbon emissions caused by gasoline far exceeds those of the other two energy sources. Among them, gasoline accounted for 99.1% of carbon emissions, diesel and electric energy accounted for 0.07% and 0.8%, respectively. The total carbon emissions from electric energy sources are small but the growth rate is high. Overall, gasoline energy is the most important factor causing road carbon emissions, but the ability of electric energy to cause indirect carbon emissions in the future cannot be ignored.
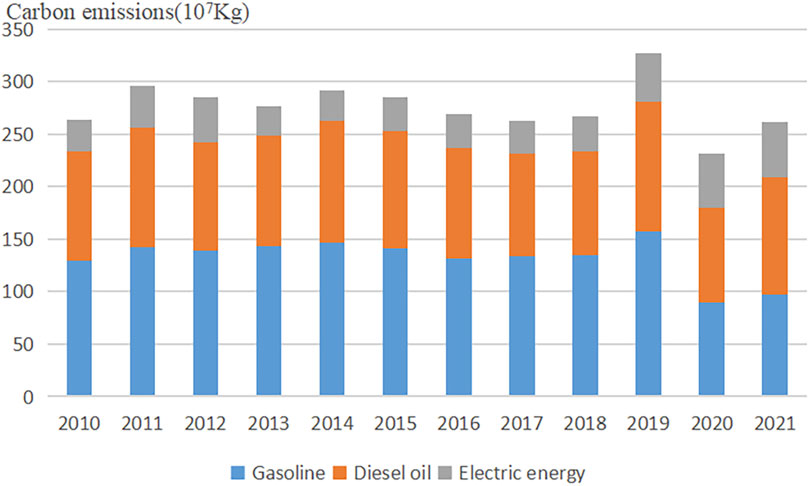
Figure 4. Historical proportion of carbon emission energy structure on public sector roads.
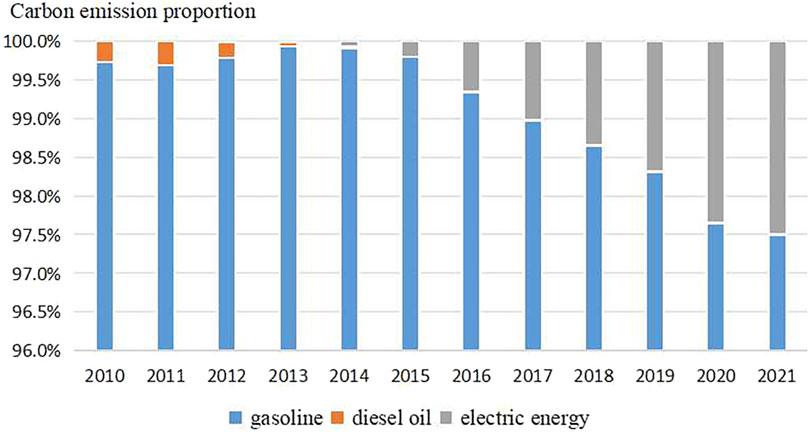
Figure 5. Proportion of road carbon emission energy structure in the private sphere over the years.
According to the conclusion, although China’s road transportation field is still dominated by gasoline, diesel and other non-clean energy in recent years, clean energy mainly based on electric energy is also being vigorously developed, and the transportation field is being combined with clean energy technology, which can boldly predict that the future energy structure boundary will move from the fossil energy with high carbon emission to the clean energy with low carbon emission, i.e., the effect of energy structure will be more powerful inhibition of the impact of carbon emission; and along with the continuous development and improvement of new energy technology, the utilization rate of clean energy will continue to increase, and the field of utilization will continue to expand. And along with the continuous development and improvement of new energy technologies, the utilization rate of clean energy will continue to increase, and the field of utilization will continue to expand, according to the historical development trend of production capacity, in the future, the unit energy consumption will correspond to more economic output, so the energy intensity effect will be more stable and continue to inhibit the carbon emissions in the field of transportation, and the energy consumption of a private car unit will be reduced when it reaches a certain capacity threshold, so the energy intensity effect will be more stable and continue to inhibit carbon emissions in the field of transportation. Energy consumption per unit of private car will also change from promotion to suppression after reaching a certain capacity threshold; according to the current direction of transportation in China, more and more people are using private cars to travel, and the number of private cars is still growing, so the scale effect of private cars in this industry in Beijing will continue to show a significant promotion in the short term; China is still in the golden age of rapid development, and the economic sector is far from saturation, and the huge economy of China is still continuing to effectively develop. China’s huge economy is still expanding effectively, and economic output will continue to increase, which means that the economic output effect will contribute to carbon emissions for a long time.
4 Conclusion and policy recommendations
Carbon emissions from private roads account for about 77.97% of the carbon emissions from Beijing’s transportation roads during the period 2010–2021, and carbon emissions from private transportation have become a major influence. Therefore, it is necessary to encourage the use of public transportation for travel, and the government provides a convenient public transportation network to ensure that public transportation routes cover all areas of the city and provide passengers with convenient route information. Increase the number and frequency of public transportation modes such as buses, subways and light railways to reduce waiting time; publicize the advantages of public transportation through advertisements, social media, brochures, etc., such as reducing traffic pressure, saving costs, reducing environmental pollution, etc., as well as how to plan travel routes and the proper use of public transportation; build convenient public transportation transfer stations at important transportation hubs such as train stations and airports to make it convenient for the public to take different modes of transportation. Provide convenient pedestrian access and bicycle parking facilities to encourage non-motorized transport travel and public transport interchange; provide incentives or preferential policies to encourage the public to use public transport. For example, offering points accumulated by taking public transportation to exchange for gifts, admission tickets, etc., and cooperating with local merchants to offer exclusive discounts on public transportation.
Encourage the electrification of the transportation sector, provide funding and support for research and innovation in the electrification of the transportation sector by means of policy guidance, financial support and market development, encourage the research and development of technologies for the electrification of the transportation sector, reduce the cost of research and development by means of granting R&D subsidies, enhance the relevance of the process of electrification of the transportation sector to the economic society and the environment and society, cultivate local manufacturers of electric transportation vehicles and the supply chain and improve the competitiveness of the domestic industry. Increase consumer choice. Deeply promote new energy electric vehicles and establish a new energy-based automotive structure. Actively promote the proportion of new energy vehicles in China’s automobile sector, and strive to achieve a half of the proportion of new energy vehicles within 10 years and 70% within 30 years. Reducing the proportion of traditional fuel vehicles in China has an important leading role in the further decarbonization of China’s transportation sector, and has important data accumulation experience in the further development of new energy in the field of transportation and the promotion of electrified replacement of urban public service vehicles. It can accelerate the process of new energy development through the advantage of China’s large population and improve China’s international status and voice in the field of new energy.
Actively promote new technologies to reduce carbon emissions from transportation. Adopting new types of energy to replace polluting energy sources is an effective way to promote decarbonization in the transportation sector. Liquefied petroleum gas (LPG) and liquefied natural gas (LNG) have been widely used in the urban transportation systems of some cities in China, but the scope of application of cleaner energy sources is currently limited, with experimental use in more areas. The government should also introduce appropriate incentive policies to enhance the competitive advantage of clean alternative energy in the market and prompt the accumulation of effective data and experience in its production and use as soon as possible. Improve the cleanliness of charging electric vehicles. With electric indirect carbon emissions accounting for about 28% of road emissions in the private sector, we need to work to increase the share of clean energy charging. By improving the scheduling relationship between the transportation and energy grids, on the one hand, new charging optimization and allocation strategies are used to manage the charging and discharging of electric energy vehicles, optimize the charging process and improve charging efficiency. On the other hand, increase the share of new energy power systems in the transportation sector and prioritize the use of clean energy power. Increase the consumption of clean energy by electric vehicles and reduce the share of coal power in electric vehicle charging.
The contribution of the number of private cars, private energy consumption and vehicle structure factors to the impact of carbon emissions in Beijing has reached a high level, and during the period 2010–2021, Beijing, as the capital city of China, usually has a higher level of economic development and per capita income than many other cities. The rapid development of the economy and the increase in purchasing power of residents have prompted the purchase and use of private cars, leading to a rapid increase in the number of private cars,. In addition Beijing is experiencing rapid urbanisation, with urban expansion and population growth contributing to the demand for private automobiles. At the same time, with the advancement of urbanisation and the expansion of living and working circles, the number of private cars, as an important means of improving travel efficiency and personal quality of life, has subsequently increased rapidly. Based on the above analysis, we should increase support policies for new energy vehicles, including purchase subsidies and licence concessions, to promote the purchase of new energy vehicles to promote the use of new low-carbon or carbon-emission-free private transport, for example, by providing subsidies for the purchase of new energy vehicles, installing additional EV charging piles facilities, and launching measures such as dedicated driving lanes for new energy vehicles.
Data availability statement
The datasets presented in this study can be found in online repositories. The names of the repository/repositories and accession number(s) can be found below: https://www.stats.gov.cn/zsk/s?qt=%E4%B8%AD%E5%9B%BD%E8%83%BD%E6%BA%90%E7%BB%9F%E8%AE%A1&siteCode=tjzsk&tab=all&toolsStatus=1, https://nj.tjj.beijing.gov.cn/nj/main/2021-tjnj/zk/indexch.htm, https://www.stats.gov.cn/sj/ndsj/, https://zhuanlan.zhihu.com/p/565500714?utm_id=0, https://zhuanlan.zhihu.com/p/654960178.
Author contributions
PZ: Writing–original draft. JC: Formal Analysis, Supervision, Writing–review and editing. ZZ: Formal Analysis, Supervision, Writing–review and editing. LW: Investigation, Validation, Writing–review and editing. LZ: Investigation, Validation, Writing–review and editing.
Funding
The authors declare financial support was received for the research, authorship, and/or publication of this article. This study is supported by science and technology project of State Grid titled with “Research on quantitative analysis and aggregation simulation technology of emission reduction effect of electric energy substitution in key sectors facing urban carbon neutralization” (5400-202111493A-0-5-ZN).
Conflict of interest
Authors JC and ZZ were employed by State Grid Zhejiang Electric Power Co., Ltd. Authors LW and LZ were employed by State Grid Beijing Electric Power Company.
The remaining author declares that the research was conducted in the absence of any commercial or financial relationships that could be construed as a potential conflict of interest.
The authors declare that this study received funding from science and technology project of State Grid. The funder had the following involvement in the study: data collection.
Publisher’s note
All claims expressed in this article are solely those of the authors and do not necessarily represent those of their affiliated organizations, or those of the publisher, the editors and the reviewers. Any product that may be evaluated in this article, or claim that may be made by its manufacturer, is not guaranteed or endorsed by the publisher.
Supplementary material
The Supplementary Material for this article can be found online at: https://www.frontiersin.org/articles/10.3389/fenrg.2024.1352083/full#supplementary-material
References
Cai, B., Cao, D., Liu, L., Zhang, Z., and Zhou, Y. (2011). Research on carbon dioxide emissions from road traffic in China. Energy China 33 (04), 26–30.
Cao, J., and Jiang, W. (2018). Comprehensive evaluation on circular economy level based on AHP-TOPSIS analytical method. Statistics Decis. 34 (14), 128–131. doi:10.13546/j.cnki.tjyjc.2018.14.030
Chang, R., Sun, L., and Jin, P. (2011). “The discussion of calculation method of electric vehicle emission in China. China electrotechnical society,” in Proceedings of the 2011 Academic Annual Conference of the Chinese Electrotechnical Society, 223–225.
Fan, J., and Zhou, L. (2019). The mechanism and effect of urbanization and real estate investment on carbon emissions in China. Sci. Geogr. Sin. 39 (04), 644–653. doi:10.13249/j.cnki.sgs.2019.04.014
Gao, Y. (2019). Analysis of traffic carbon emission accounting and influencing factors in Tianjin. Recycl. Resour. Circular Econ. 12 (06), 18–21. doi:10.13249/j.cnki.sgs.2019.04.014
Jia, S., Mao, B., Liu, S., and Sun, Q. (2010). Calculation and analysis of transportation energy consumption level in China. J. Transp. Syst. Eng. Inf. Technol. 10 (1), 22–27. doi:10.1016/s1570-6672(09)60020-9
Kakouei, A., Vatani, A., and Idris, A. K. B. (2012). An estimation of traffic related CO2 emissions from motor vehicles in the capital city of Iran J. Iran. J. Environ. Health Sci. Eng. 9 (1), 1–5.
Li, C., and Jiu, D. (2016). Empirical study on influence factors of carbon emissions in China's transportation industry based on LMDI decomposition method. J. Resour. Dev. Mark. 32 (05), 518–521.
Li, X., Su, S., and Zhang, Y. (2023). Carbon emission prediction and carbon peak path analysis in Fujian Province. Resour. Dev. Mark. 39 (02), 139–147.
Li, Z. (2022). Trend analysis on the carbon emission from transportation in China. China Transp. Rev. 44 (05), 24–27.
Liang, N., and Feng, Y. (2021). Empirical study on decomposition of factors influencing carbon emissions in shanxi province. China Econ. Trade Her. (01), 117–118.
Liu, L., Liu, T., and Jin, X. (2022). The discussion of calculation method of electric vehicle carbon emission and tracking evaluation. Intern. Combust. Engine and Parts (01), 196–198. doi:10.19475/j.cnki.issn1674-957x.2022.01.063
Liu, W., Ding, M., and Zhao, R. (2017). Research on total factor productivity of industries based on carbon emission. Resour. Dev. Mark. 33 (03), 322–326+333.
Research on China’s Sustainable Development Energy and Carbon Emission Scenarios (2003). Research on China's sustainable development energy and carbon emission Scenarios. Energy China 2003 (06), 5–11.
Wang, S., Ma, Y., and Geng, M. (2017). Study on impact factors of regional carbon emissions under background of urbanization in jiangsu province. Resour. Dev. Mark. 33 (12), 1444–1448+1427.
Wang, Z. (2021). Impact of electric vehicle strategies on carbon emissions: take the Maryland PRESTO model application as an example. Urban Transp. China 19 (05), 66–72+16. doi:10.13813/j.cn11-5141/u.2021.0505
Xi, Y., Ma, T., Liu, M., and Wang, W. (2023). Analysis on influencing factors of road traffic carbon emission oriented to vehicle electrification substitution. Mod. Electr. Power, 1–10. doi:10.19725/j.cnki.1007-2322.2022.0106
Xie, T., and Wang, J. (2011). Comparative study on carbon emissions from transportation industry. China Transp. Rev. (08), 20–24.
Yuan, L., and Pan, J. (2013). Kaya disaggregation of carbon emission drivers in Kaya identity and its limitations with regard to policy implications. Clim. Change Res. 9 (03), 210–215.
Zhang, G., and Su, Z. (2020). Analysis of influencing factors and scenario prediction of transportation carbon emissions in the yellow river basin. Manag. Rev. 32 (12), 283–294. doi:10.14120/j.cnki.cn11-5057/f.2020.12.022
Zhang, L., and Liu, S. (2021). Research on influencing factors of Beijing - 'tianjin - hebei carbon emissions under carbon neutral target—empirical analysis based on quantile regression and VAR model. Resour. Dev. Mark. 37 (09), 1025–1031.
Zhang, X., Yang, X., Yan, Y., Shi, J., Zheng, X., Jiang, A. T., et al. (2014). Synergic silencing of costimulatory molecules prevents cardiac allograft rejection. China Soft Sci. 12 (6), 142–150. doi:10.1186/1479-5876-12-142
Zhao, M., Zhang, W., and Yu, L. (2009). Resident travel modes and CO2emissions by traffic in Shanghai CityJ. Res. Environ. Sci. 22 (6), 747–752.
Keywords: electrified, transportation field, factor analysis, LMDI decomposition method, carbon emission
Citation: Zhang P, Chen J, Zhan Z, Wang L and Zhang L (2024) Analysis of factors influencing carbon emissions in the evolution of road electrification in Beijing. Front. Energy Res. 12:1352083. doi: 10.3389/fenrg.2024.1352083
Received: 07 December 2023; Accepted: 21 May 2024;
Published: 13 June 2024.
Edited by:
Jiaoyue Wang, Chinese Academy of Sciences (CAS), ChinaReviewed by:
Wenjie Zhang, Nanjing University of Science and Technology, ChinaLi Wang, Henan Agricultural University, China
Copyright © 2024 Zhang, Chen, Zhan, Wang and Zhang. This is an open-access article distributed under the terms of the Creative Commons Attribution License (CC BY). The use, distribution or reproduction in other forums is permitted, provided the original author(s) and the copyright owner(s) are credited and that the original publication in this journal is cited, in accordance with accepted academic practice. No use, distribution or reproduction is permitted which does not comply with these terms.
*Correspondence: Peng Zhang, emhhbmdwZW5nMTk4NEB0anUuZWR1LmNu