 Congying Wei
 Longwen Jia
 Xiongwei Wang1
 Siyang Liao
- 1Dispatching and Control Center, Central China Branch of State Grid Corporation of China, Wuhan, China
- 2School of Electrical Engineering and Automation, Wuhan University, Wuhan, China
Against the backdrop of increasing renewable energy penetration, frequent power network congestion has become a key issue limiting the available transfer capability of trading channels. In order to avoid power network congestion while improving the overall utilization of trading channels, we propose a method for calculating the available transfer capability of a trading channel based on power network congestion forecasting. First, this study uses a histogram-based gradient tree boosting (HGTB) model to forecast the severity and probability of power network congestion, which enables power system operators to determine the specific circumstances of congestion occurrence. Second, we analyze the sensitivity of the power trading network and generating units to transmission lines, aiming to calculate the available transfer capability of the trading channel on the basis of taking into account the control of transmission line congestion and the balance of supply and demand in the power market. Finally, the validity of the validation methodology is verified based on a case study of the power system in central China.
1 Introduction
The rapid development of renewable energy sources, such as wind power and photovoltaic, is an important driving force to promote the energy transition of the power system. They are highly clean, renewable, and sustainable, can effectively reduce the dependence on traditional fossil energy, reduce the impact of energy consumption on the environment, and are of great significance in realizing the global green and low-carbon development goals (Zhou et al., 2018; Yang et al., 2023). The installed capacity of intermittent renewable energy sources such as wind power and photovoltaic in the power system has been increasing every year. This trend has led to a considerable rise in uncertainty in the power system, and the power network transmission congestion problem has gradually gained attention (Zhang et al., 2016). On the other hand, on the load side, the increased interactive demand of devices such as electric vehicles, heat pumps, and flexible buildings may also cause congestion problems (Hanif et al., 2017; Li et al., 2020a). Forecasting congestion is the key to solving the congestion problem, and many studies have applied data-driven control methods, such as support vector machines (Niu et al., 2006), decision trees (Li et al., 2005), random forests (Li et al., 2020b; Wu et al., 2015), and neural networks (Lu et al., 2019; Chen et al., 2020; Rafi et al., 2021), in the prediction of load and new energy sources for power systems. In terms of power system stability assessment, data-driven control strategies can use machine learning algorithms, such as supervised learning, unsupervised learning, and reinforcement learning, to learn the power system operation data and forecast whether the power system will be destabilized (Yang et al., 2022). The application of data-driven control strategies in power systems has become more and more widespread, and in the future, with the continuous development of data science and artificial intelligence technology, data-driven control strategies will become an important means of power system intelligence and adaptability (Xue et al., 2015; Bi et al., 2002).
In a study of calculating the available transfer capability (ATC) based on the power market, Ding et al. (2018) discussed key technologies, such as the technical support platform, out-clearing method, model data management, and others, under the general framework of the power spot market. Zou et al. (2014) summarized the universal law in the process of spot market construction and analyzed the internal logic of spot market construction by comparing and analyzing the latest practices of electricity market construction in different countries. Xia and Guo (2009) discussed the market function and positioning of the spot electricity market from the perspective of market functionality and structure on the basis of a coordinated electricity market trading system. Zeng et al. (2020) measured the sensitivity of DC receiver and generator nodes to AC lines and proposed a simplified method of AC–DC hybrid network and an ATC-based inter-provincial transaction clearing model. Cheng et al. (2022) described the research and development of inter-provincial medium- and long-term trading systems taking the ATC into account. The above studies focus on analyzing the power market mechanism and the method of market clearing under the assumption that the channel ATC is known; however, studies on ATC calculation are lacking. Part of the literature considered the uncertainty of new energy generation (Bai et al., 2020; Li et al., 2022) and the deviation of load forecast (Liu et al., 2023), based on which Zhang et al. (2007) and Huang et al. (2013) accomplished the calculation of probabilistic ATC from the perspective of risk and return. However, the above studies focus on inter-provincial trading channels and simplify the network structure within the provincial network, which leads to the risk of congestion of intra-provincial transmission lines during trade execution.
In summary, for the risk of transmission line congestion during transaction execution, through a data-driven strategy, we propose an optimization method for the available transfer capability of trading channels based on power network congestion prediction, aiming to calculate the available transfer capability of trading channels on the basis of taking into account the control of transmission line congestion and the balance of supply and demand in the power market. First, data processing and characterization are performed to extract effective information for predicting power network transmission congestion from redundant data and features. Second, a histogram-based gradient tree boosting (HGTB) multi-classified probabilistic prediction of power network transmission congestion is proposed to predict the severity and probability distribution of congestion. Finally, a network coupling model based on the power distribution factor is proposed to consider the impact of the trading volume of the trading channel on the congestion line, and a quadratic objective function is designed to maximize the spot trading capacity and power transfer capacity. Compared with existing studies, the main contributions of this paper are as follows:
1) A multi-classified probabilistic prediction model of power network transmission congestion based on HGTB is proposed. The proposed model obtains knowledge directly from data, thus avoiding the physical modeling challenges for large and complex power systems. The real-time power system information is fully utilized to accurately predict the probability and trend of future power network transmission congestion.
2) An optimization method for the available transfer capability of trading channels is proposed. By calculating the equivalent sensitivity, the coupling relationship between the trading network and the provincial transmission lines is modeled, and the impact of the trading volume on the provincial transmission lines is analyzed. Taking into account congestion control and supply–demand balance, a normalized quadratic objective function is established to improve the overall utilization rate of the trading channel while avoiding excessive restrictions on the available transfer capability of some trading channels.
The rest of this paper is organized as follows: Section 2 introduces the HGTB-based multi-classified probabilistic prediction model for power network transmission congestion. Section 3 presents the calculation method for the available transfer capability of the trading channel. Section 4 gives the simulation results. Section 5 concludes the paper.
2 Multi-classified probability prediction of power network transmission congestion
This section implements a data-driven approach to real-time prediction of power network transmission congestion in power systems by combining the feature selection theory and the gradient boosting tree theory.
2.1 Feature selection
Due to the large number of feature variables in an actual power grid, filtering out redundant variables before making predictions can greatly improve computational efficiency. At the same time, the power network transmission congestion prediction puts forward the requirement of multi-classification for feature extraction, so we choose the Relief-F algorithm based on the expansion of the Relief algorithm. The specific steps of the Relief-F algorithm are as follows:
1) Initializing the relevant parameters: We set the dataset
2) We randomly select a sample
3) For each feature
4) We repeat steps (2) and (3) until the loop exit condition is satisfied.
5) We sort the features according to their weights
2.2 Histogram-based gradient tree boosting
A decision tree is a weak learner, as shown in Figure 1. Gradient tree boosting (GTB) is a boosting integration algorithm that boosts the decision tree into a strong learner by means of integration. In the process of boosting, the latter learner will successively pay attention to the samples where the prediction result of the previous learner differs greatly from the actual result. For power network transmission congestion caused by system uncertainty, additional learning on misjudged samples enables the model to gradually improve its prediction accuracy.
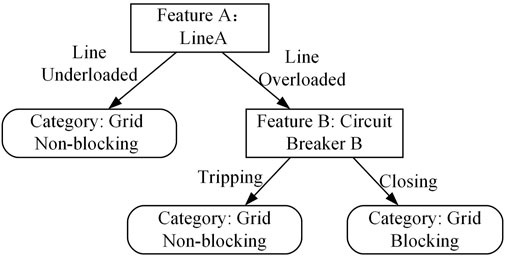
FIGURE 1. Structure of the decision tree model.
GTB first predicts the target value or category label of a sample using a combination of all the current weak learners and then calculates the error between the predicted value and the true value. GTB then uses these errors as the target value to train the next weak learner, and this process is repeated until a preset number of iterations or a stopping criterion is reached. The set of all trained weak learners becomes a strong learner, represented by an additive model:
where
As shown in Figure 2, HGTB is a boosted tree method that reduces model complexity and improves model generalization using the histogram data sealing method. Compared with GTB, HGTB converts continuous eigenvalues into discrete data boxes by means of histogram boxing, which drastically reduces computation and memory consumption, and especially performs better when dealing with large-scale data.
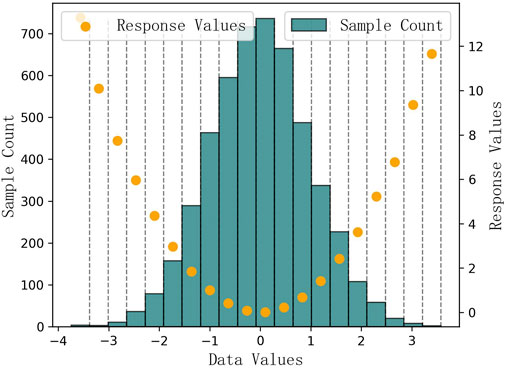
FIGURE 2. Histogram-type data sealing method.
In the figure, the height of the squares indicates the number of samples in the box, and the scatter indicates the response values of the individual boxes. After the histogram closure process, the response values of all the boxes can be used as predictions.
2.3 HGTB-based multi-classification prediction
The HGTB-based multi-classification prediction method provides not only the future congestion stall but also the probability of occurrence of each congestion stall. The training method for the HGTB-based multi-classification probabilistic prediction model is as follows:
1) For a K-class classification problem, it is first transformed into K binary classification problems.
2) Histogram blocking is performed on each continuous feature of the dataset.
3) Initializing the model: For each category k, we use the CART algorithm on the training dataset to construct a regression tree
4) Updating the model.
The K-predicted scores,
We calculate the negative gradient and fit a new regression tree to update the model parameters by minimizing the cross-entropy loss function:
where N denotes the number of samples in the training set. The cross-entropy loss function measures the difference between the probability distribution predicted by the model and the true distribution; the smaller the value of cross-entropy, the closer the prediction is to the true label.
We stack the regression tree
Iterating the above process, we will output a trained integrated tree model for multi-classified probabilistic prediction of power network transmission congestion. This integrated model actually outputs the probability distribution of the samples, taking the category with the highest probability as the predicted category.
2.4 Method application
This section theoretically proposes a power network transmission congestion prediction method that can meet real-time scheduling requirements. First, using a Relief-F-based feature selection method for multi-classification problems, the relevance of feature variables to the classification task can be derived, and then, the feature variables that are most conducive to labeling line congestion can be selected. The selected feature variables are fed to the prediction model as labeled historical data can equip the model with the ability to classify and predict the power network transmission congestion state at future moments. Second, following the above ideas, this paper chooses GTB as the basis of the prediction model, which is characterized by interpretability, efficient training, and high accuracy. The HGTB model is formed by the method of histogram data sealing box, which improves the generalization ability of the model and makes the prediction model more applicable to the power network transmission congestion prediction problem in the real-time scheduling process.
3 Calculation method of the available transfer capability of a trading channel
The current inter-provincial power trading network does not take into account the structure of the provincial transmission lines, which leads to inconsistency between the trading network and the physical transmission network and the risk of congestion of the provincial transmission lines during trade execution. In this regard, the constraints of transaction execution are formed by calculating the sensitivity of the transaction channel and the sensitivity of the generating unit to the transmission line, based on which the calculation method of the available transfer capability of the transaction channel that takes into account the congestion of the intra-provincial transmission line is proposed.
3.1 Sensitivity calculation formula
By performing the power flow calculation by Newton’s method, the Jacobi matrix can be obtained as follows:
where
The sensitivity matrix
where
The sensitivity of each node to the provincial transmission line is shown as follows:
1) Sensitivity of the trading channel to the provincial transmission line
Specifying the positive direction of power transmission as the direction of incoming power to the province, the sensitivity
where
2) Sensitivity of critical generating units to provincial transmission lines
We consider the role of the critical generating unit on the provincial transmission line, where the sensitivity
where
3) Sensitivity of non-critical generating units to provincial transmission lines
Since the power system operator usually does not give additional instructions to non-critical generating units when the line is congested, it can be assumed that the power output of non-critical generating units no longer changes. Therefore, the non-critical generating units in the province can be weighted and aggregated into an equivalent generating node, which has the following sensitivity
where x denotes the number of the non-critical generating units,
3.2 Coupling relationship between the trading network and provincial transmission lines
The generation and consumption balance relationship of the provincial grid can be expressed as follows:
where
Based on the above equation, the sensitivity of the inter-provincial physical link and the critical generating units within the province after considering the non-critical generating units is expressed as follows:
where
The coupling relationship between the trading network and the provincial transmission lines can be expressed as follows:
where
3.3 Calculation of the available transfer capability of the trading channel
China’s inter-provincial power spot market uses the ATC model, so power system operators need to calculate the upper and lower limits for each trading channel. Different trading channels have different sensitivities to the intra-provincial transmission lines, and it is necessary to make the calculated channel ATC as close as possible to the maximum transmission limit and appropriately adjust the ATC of certain inter-provincial channels in order to avoid the congestion of intra-provincial lines. As shown in Figure 3, the outer green portion indicates the feasible region under physical network constraints, and the inner orange portion indicates the available transfer capacity range. It is worth noting that each ATC is determined by the upper and lower limits filled in by the scheduler, and therefore, the available transfer capacity range can only be represented as a rectangle in the two-dimensional plane formed by the two trading channels.
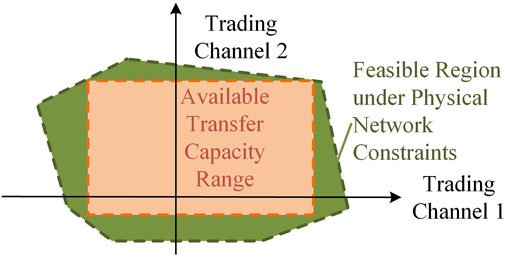
FIGURE 3. Transfer capacity of the trading network.
In this regard, the objective function shown in Eq. 19 can be designed to normalize the inter-provincial trading channels according to their capacities and then sum up the squares, which can not only guarantee the utilization rate of the trading channels but also make the distribution of the ratio of the ATC of the inter-provincial trading channels to the corresponding maximum limit nearly uniform.
where
The constraints on the trading channel power are shown as follows:
The critical generating unit output is also required to meet the following equations:
where
4 Example and result
4.1 Description of the example
The study is based on a provincial grid H with the highest load level in central China, focusing on 12 intra-provincial transmission lines, 5 key power plants, and 2 trading corridors. The data time starting point is 1 March 2021, and the end point is 31 December 2022. In the process of resampling, the resampling frequency is set to 5 min/time, considering that the time scale of the forecast is within hours. The data content includes not only electrical variables but also non-electrical variables. It includes the output of the whole network units (thermal power units, hydropower units, and new energy units), the transmission power and transmission limit of critical generating units, the total power generation, the total power receiving, the new energy generation in each region, the critical bus voltages of 500 kV and above, and the six elements of meteorology at each meteorological station in the region.
Power network transmission congestion is defined as the transmission of power by a line in excess of the specified capacity that the line can carry. A measure of power network transmission congestion can be expressed in terms of line loading factor (LLF), which is calculated as follows:
where
The categorization of congestion events is defined as shown in Table 1, where category 0 denotes no congestion and 1, 2, and 3 denote minor, moderate, and severe congestion, respectively.
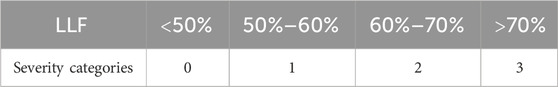
TABLE 1. Power network transmission congestion severity categories.
The statistics show that more than 150 congestion events occurred in the fourth quarter of 2021, and more than 50% of the critical lines have congestion events. Among them, the HX line had more than 20 power network transmission congestion events in 3 months, as shown in Figure 4. Therefore, the HX line was chosen as the test object for the subsequent prediction part of the calculus.

FIGURE 4. Frequency of congestion events on critical transmission lines.
4.2 Example results
The data of feature variables are preprocessed, interpolated, corrected, and then normalized. The HX line power is selected as the target variable, and feature selection is performed by the Relief-F algorithm.
As shown in Figure 5, the importance ranking of some power system feature variables is demonstrated, with the name of each feature in the horizontal coordinate and the importance score of the corresponding feature in the vertical coordinate. Here, “_R” denotes new energy, “_L” denotes load, and “_G” denotes total regional generation. If a feature is not underlined “_,” it means it is a line power variable. TW, XXX_R, and KSH_R are the most important features, followed by ZZXN_G and PDSN1_G, and the more the features at the top of the list, the more the impact on the target variable. There are some features with lower importance scores, and these features have less impact on the target variable and can be considered eliminated. In this case, the 100 variables with the highest importance scores are selected as the feature variables to be subsequently used for categorical prediction.
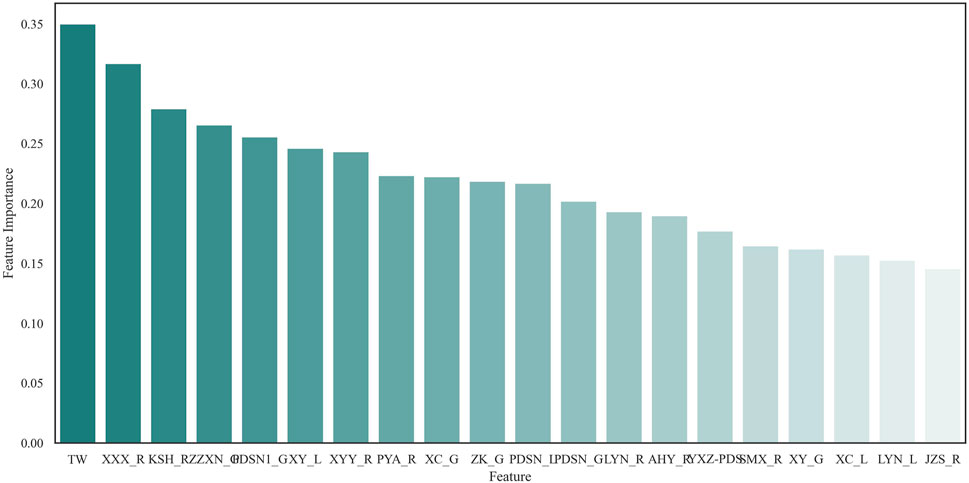
FIGURE 5. Relief-F feature importance ranking for HX line congestion events.
After selecting the feature variables, the HGTB algorithm is used to classify the power prediction of the line. As shown in Figure 6, the HZ line has a high probability of moderate congestion before 02:20 on 10 November 2021. After 02:20, the power network transmission congestion will be transformed into severe congestion.
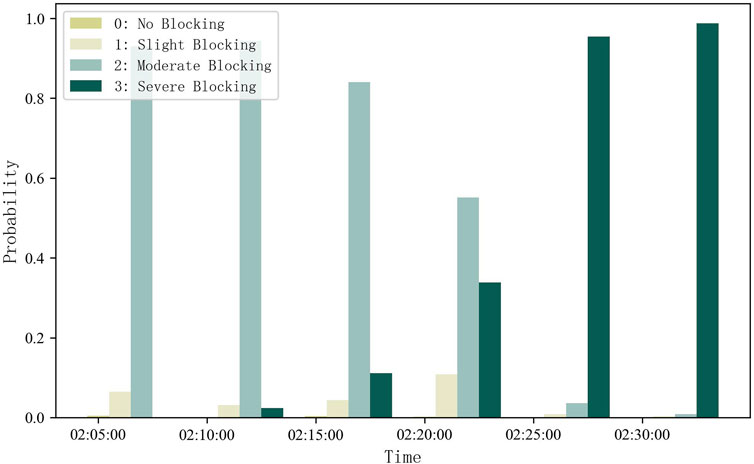
FIGURE 6. Multi-categorical prediction of power network transmission congestion events.
Table 2 gives the multi-classification prediction accuracies of the different algorithms for different time scales over a 30-min period, as well as the time taken for training and prediction.
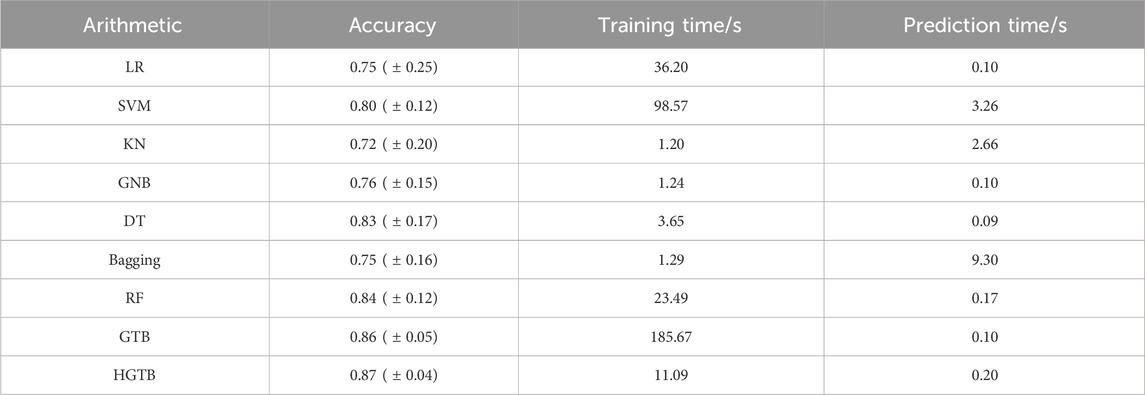
TABLE 2. Comparison of accuracy and computational efficiency.
For the power network transmission congestion multi-classification problem, this paper compares the computational efficiency and accuracy of HGTB with other machine learning algorithms. The compared algorithms include logistic regression (LR), support vector machine (SVM), k neighbors (KN), Gaussian Naïve Bayes (GNB), and decision tree (DT). HGTB is a robust integration algorithm. This paper also compares different integration ideas: bagging and random forest (RF). The accuracy rate in the table is the ratio of the number of samples correctly classified by the classification model in the test dataset to the number of all samples in the test dataset. The value outside the parentheses denotes the mean of the accuracy rate of each validation in the cross-validation process, and the brackets denote the variance.
It can be seen that HGTB has the highest accuracy, and its predictions are the most stable compared to the other algorithms, with an average accuracy of 0.87 and a variance of only 0.04 in 10-fold cross-validation.
We select the data before 02:00 on 10 November 2021 for simulation and calculate the available transfer capability of the two trading channels in the next half hour, where channel 1 is an AC line and channel 2 is a DC line. The direction of power sink into province A is specified as the positive direction. Using the HGTB algorithm, 12 lines with a high probability of severe congestion are selected as constraints, shown in Eq. 18. Equation 19 is used as the optimization objective, and Eq. 18 and Eqs 20–23 are used as constraints. YALMIP/GUROBI is chosen to solve the problem.
Figure 7 illustrates the available transfer capability of the two trading channels. By analyzing the calculation results of channel 1, we can learn that, regardless of the positive or negative direction, even if a large number of transactions are carried out in this trading channel, it does not exacerbate the congestion on the provincial lines. The calculation results of channel 2 show that although there is a large amount of tradable space in this channel, the calculated available transfer capability does not reach its upper limit value after taking into account the congestion of the transmission lines in the province. Specifically, since the sensitivity of trading channel 1 to congestion lines in the positive direction is small, the trades generated by this channel in the positive direction do not adversely affect the provincial lines. Therefore, more flexible trading arrangements can be made on this basis. At the same time, the transactions of transaction channel 1 in the opposite direction can also alleviate congestion on the transmission lines in the province. Therefore, in the event of congestion of the provincial lines, the outward transmission of electricity through trading channel 2 can be used to alleviate the congestion of the provincial lines. Channel 2, on the other hand, has ample tradable space in the forward direction, but the available transfer capability is limited due to the congestion of the transmission lines in the province. It is worth noting that this channel is a DC line and only exists to trade in the positive direction, hence the absence of negative values on the histogram for channel 2. These limitations need to be fully considered before market clearing in order to avoid the overloading of provincial lines during actual implementation. Therefore, in order to ensure the stable operation of the system, it is recommended to refine the analysis of provincial transmission lines prone to congestion in the market operation so as to better reflect the actual situation and formulate a reasonable trading strategy.
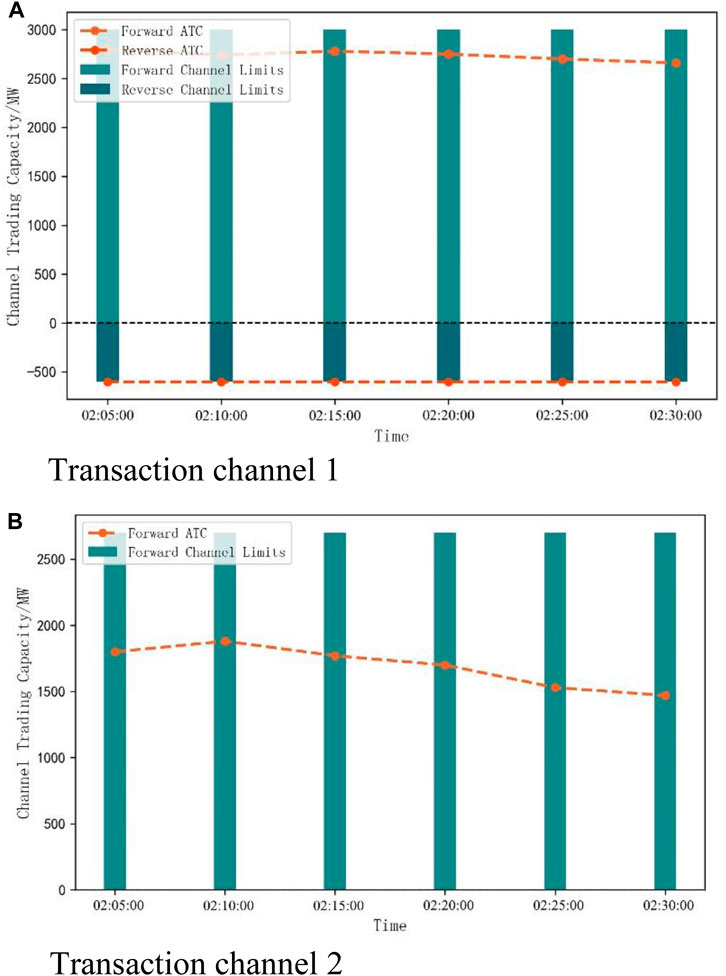
FIGURE 7. Available transfer capability for trading channels. The text “Trading Channel 1” and “Trading Channel 2” at the bottom of the image corresponds to the titles of images (A) and (B), respectively.
5 Conclusion
In this paper, a method for calculating the available transfer capability of trading channels based on power network congestion prediction is proposed. First, this study conducted feature selection based on the Relief-F algorithm to extract effective information for predicting power network transmission congestion from redundant data and features, and the input variables of the prediction model were dimensionally reduced. Next, the severity and probability of power network congestion were calculated using the HGTB prediction model. Then, considering the impact of the trading volume of the trading channel on the congestion line, the sensitivity of the power trading channel as well as the generating units to the transmission line was calculated, and the model of the coupling relationship between the trading network and the transmission line in the province was clarified, while the normalized quadratic objective function was established for taking into account the congestion control and the balance of supply and demand. Finally, a simulation was carried out using actual data from central China, comparing this paper’s prediction algorithm with other algorithms to verify the accuracy of the prediction algorithm. The ATC results calculated in the simulation illustrate that the consideration of intra-provincial congestion lines will lead to the decrease in some of the available transfer capability of the trading corridor, and the analysis of intra-provincial congestion-prone transmission lines should be taken into account in the operation of the market. On the basis of the research in this paper, the uncertainty brought by the new energy output can be further considered to assess the risk of the deviation of the trading volume in the power market.
Data availability statement
The original contributions presented in the study are included in the article/Supplementary Material; further inquiries can be directed to the corresponding author.
Author contributions
CW: funding acquisition, project administration, and writing–review and editing. LJ: conceptualization, methodology, and writing–review and editing. XW: data curation, investigation, and writing–review and editing. YC: formal analysis, methodology, validation, and writing–original draft. YiH: visualization and writing–review and editing. YaH: software and writing–review and editing. SL: methodology and writing–review and editing.
Funding
The authors declare that financial support was received for the research, authorship, and/or publication of this article. This work was supported by the technology project of the Central China Branch of the State Grid Corporation of China (52140023000J).
Conflict of interest
Authors CW, XW, YC, YiH, and YaH were employed by the Central China Branch of the State Grid Corporation of China.
The remaining authors declare that the research was conducted in the absence of any commercial or financial relationships that could be construed as a potential conflict of interest.
The authors declare that this study received funding from the technology project of the Central China Branch of the State Grid Corporation of China (52140023000J). The funder had the following involvement in the study: they provided the study design.
Publisher’s note
All claims expressed in this article are solely those of the authors and do not necessarily represent those of their affiliated organizations, or those of the publisher, the editors, and the reviewers. Any product that may be evaluated in this article, or claim that may be made by its manufacturer, is not guaranteed or endorsed by the publisher.
References
Bai, S., Zhang, J., Bao, Y., et al. (2020). On-line limit power calculation of correlative transmission section considering new energy consumption. Power Syst. Technol. 44 (10), 3717–3724. doi:10.13335/j.1000-3673.pst.2020.0473
Bi, T., Ni, Y., Wu, F., et al. (2002). A novel neural netowrk approach for fault section estimation. Proc. Chin. Soc. Electr. Eng. (2), 74–79. doi:10.13335/j.1000-3673.pst.2020.0473
Chen, Z., Liu, J., Li, C., et al. (2020). Ultra short-term power load forecasting based on combined LSTM-XGBoost model. Power Syst. Technol. 44 (2), 614–620. doi:10.13335/j.1000-3673.pst.2019.1566
Cheng, H., Yang, C., Liu, S., et al. (2022). Optimization clearing and system development of inter-provincial medium and long term trade considering ATC base on path combination. Power Syst. Technol. 46 (12), 4762–4770 . doi:10.13335/j.1000-3673.pst.2022.0875
Ding, Q., Chang, L., and Tu, M. (2018). Key technologies of technical support system for electricity spot market. Automation Electr. Power Syst. 42 (23), 1–8. doi:10.7500/AEPS20180509006
Hanif, S., Massier, T., Gooi, H. B., Hamacher, T., and Reindl, T. (2017). Cost optimal integration of flexible buildings in congested distribution grids. IEEE Trans. Power Syst. 32 (3), 2254–2266. doi:10.1109/TPWRS.2016.2605921
Huang, Y., Yang, Y., Wen, F., et al. (2013). Coordinated probabilistic optimal decision-making model for multi-area ATC with risk control. Electr. Power Autom. Equip. 33 (03), 84–89. doi:10.3969/j.issn.1006-6047.2013.03.014
Li, R., Liu, Y., Li, J., et al. (2005). Study on the daily characteristic load forecasting based on the optimizied algorithm of decision tree. Proc. Chin. Soc. Electr. Eng. 25 (23), 36–41. doi:10.13334/j.0258-8013.pcsee.2005.23.007
Li, Y., Jia, Y., Li, L., et al. (2020b). Short term power load forecasting based on a stochastic forest algorithm. Power Syst. Prot. Control 48 (21), 117–124. doi:10.19783/j.cnki.pspc.191594
Li, Z., Wu, L., Xu, Y., and Zheng, X. (2022). Stochastic-weighted robust optimization based bilayer operation of a multi-energy building microgrid considering practical thermal loads and battery degradation. IEEE Trans. Sustain. Energy 13 (2), 668–682. doi:10.1109/tste.2021.3126776
Li, Z., Xu, Y., Fang, S., Wang, Y., and Zheng, X. (2020a). Multiobjective coordinated energy dispatch and voyage scheduling for a multienergy ship microgrid. IEEE Trans. Industry Appl. 56 (2), 989–999. doi:10.1109/tia.2019.2956720
Liu, W., Zhang, T., Yang, X., et al. (2023). Multi-objective optimal allocation of TCSC for a power system for wind power and load randomness. Power Syst. Prot. Control 51 (5), 58–69. doi:10.19783/j.cnki.pspc.220615
Lu, J., Zhang, Q., Yang, Z., et al. (2019). Short-term load forecasting method based on CNN-lstm hybrid neural network model. Automation Electr. Power Syst. 43 (8), 131–137. doi:10.7500/AEPS20181012004
Niu, D., Gu, Z., Xing, M., et al. (2006). Study on forecasting approach to short-term load of SVM based on data mining. Proc. Chin. Soc. Electr. Eng. 26 (18), 6–12. doi:10.13334/j.0258-8013.pcsee.2006.18.002
Rafi, S. H., Nahid-Al-Masood, H., Deeba, S. R., and Hossain, E. (2021). A short-term load forecasting method using integrated CNN and LSTM network. IEEE Access 9, 32436–32448. doi:10.1109/access.2021.3060654
Wu, X., He, J., Zhang, P., et al. (2015). Power system short-term load forecasting based on improved random forest with grey relation projection. Automation Electr. Power Syst. 39 (12), 50–55. doi:10.7500/AEPS20140916005
Xia, Q., and Guo, W. (2009). Research on coordinative operation mechanism of electricity transaction system. Electr. Power 42 (1), 1–6.
Xue, H., Zhang, K., Li, B., et al. (2015). Fault diagnosis of transformer based on the cuckoo search and support vector machine. Power Syst. Prot. Control 43 (8), 8–13.
Yang, B., Chen, Y., Yao, W., et al. (2022). Review on stability assessment and decision for power systems based on new-generation artificial intelligence technology. Automation Electr. Power Syst. 46 (22), 200–223. doi:10.7500/AEPS20220114001
Yang, Y., Li, Z., Mandapaka, P. V., and Lo, E. Y. M. (2023). Risk-averse restoration of coupled power and water systems with small pumped-hydro storage and stochastic rooftop renewables. Appl. Energy 339, 120953. doi:10.1016/j.apenergy.2023.120953
Zeng, D., Yang, Z., Feng, S., et al. (2020). Inter-provincial power exchange optimization modeling considering ATC constrains of hybrid AC/DC power system. Power Syst. Technol. 44 (10), 3893–3899. doi:10.13335/j.1000-3673.pst.2020.0111
Zhang, L., Liu, J., Liu, Y., et al. (2016). Probabilistic forecast of transmission congestion with wind speed correlation. Power Syst. Technol. 40 (06), 1696–1702. doi:10.13335/j.1000-3673.pst.2016.06.013
Zhang, Q., Han, X., and Xu, J. (2007). Probabilistic optimal decision-making model and solution for available transfer capability. Automation Electr. Power Syst. (23), 15–18.
Zhou, X., Chen, S., Lu, Z., et al. (2018). Technology features of the new generation power system in China. Proc. Chin. Soc. Electr. Eng. 38 (07), 1893–1904doi:10.13334/j.0258-8013.pcsee.180067
Keywords: feature selection, power network congestion, decision tree, trading channel, available transfer capability
Citation: Wei C, Jia L, Wang X, Cai Y, Huang Y, Huang Y and Liao S (2024) Calculation of the available transfer capability of trading channels based on power network congestion forecasting. Front. Energy Res. 12:1351306. doi: 10.3389/fenrg.2024.1351306
Received: 06 December 2023; Accepted: 17 January 2024;
Published: 06 February 2024.
Edited by:
Zhengmao Li, Aalto University, FinlandReviewed by:
Tao Chen, Southeast University, ChinaYingjun Wu, Hohai University, China
Xiaolong Jin, Technical University of Denmark, Denmark
Copyright © 2024 Wei, Jia, Wang, Cai, Huang, Huang and Liao. This is an open-access article distributed under the terms of the Creative Commons Attribution License (CC BY). The use, distribution or reproduction in other forums is permitted, provided the original author(s) and the copyright owner(s) are credited and that the original publication in this journal is cited, in accordance with accepted academic practice. No use, distribution or reproduction is permitted which does not comply with these terms.
*Correspondence: Longwen Jia, MjI5NDY4MzI5NkBxcS5jb20=