 Li Jinbao
- School of Civil Engineering and Architecture, Anhui University of Science and Technology, Huainan, China
The study of cable support density’s impact on the stability of rock in mine roadways is vital for personnel safety, equipment protection, and mining operations continuity. This research examines a typical engineering scenario within the 11th mining area pedestrian downhill roadway of Yindonggou Mine. A numerical model is devised, accounting for post-peak evolution of mechanical parameters in the surrounding rockmass, represented by a plastic shear strain-dependent multi-segment linear function. Factors such as vertical displacement of the roof and floor, cable axial force, and changes in the plastic zone were scrutinized to decipher the influence of anchor cable support density on roadway stability. The study revealed the following results: 1) The displacement pattern of the roadway roof initially decreases at a decreasing rate before stabilizing with an increase in calculation time step. However, the floor displacement increases first at a diminishing rate before achieving stability with increased calculation time. 2) As a result of the pulling effect caused by deformation and movement of roof’s surrounding rock, the axial force of the anchor cable initially rises with a declining rate before reaching a virtually constant value with increased computation time. 3) Analysis of the vertical displacement field of the model illustrates that with the rise in support density, the maximum displacement of the model’s top plate sinking and bottom plate elevation gradually reduces. 4) With the increment in support density, the number of units showing a plastic shear strain greater than 0.2, 0.1, and 0.05 tends to decrease, indicating increased stability of the roadway. Furthermore, it was observed that the probability of plastic shear yielding at the junction of the roadway floor and side is high while the shoulder of the roadway reflects a lower probability.
1 Introduction
The anchor cable support system, characterized by its significant anchoring depth, high bearing capacity, cost-effectiveness, and simplicity of implementation, is extensively applied in roadway support (Yang et al., 2020; Jia et al., 2021; Wu et al., 2022; Zhou et al., 2023). However, setting a rational and consistent density for anchor cable support poses a substantial challenge for engineering and design practitioners. Insufficient anchor cable density may not provide adequate restraining force to the surrounding rock, leading to excessive deformation. Such a situation could escalate to severe roof fall or collapse accidents, posing a threat to the safety of underground personnel and equipment. Conversely, an excessively high anchor cable density might result in over-support within the roadway. This over-support can trigger unnecessary manpower and material expenses, thereby inflating support costs (Wang et al., 2021; Gong et al., 2022; Yang J. et al., 2023; Ming et al., 2023; Wu et al., 2024). Given these potential issues, it becomes imperative to conduct thorough research on the relationship between the density of anchor cable support and the stability of the surrounding rock within the roadway. Understanding this relationship will balance the concerns regarding the safety of the roadway and efficient utilization of resources.
Xiao and Dong (2016) conducted an analysis of the deformation of surrounding rock under various anchor bolt support densities, resulting in the determination of an optimal support density solution for geological conditions at the II632 working face of Hengyuan Coal Mine in the northern Anhui mining area. Men (2023) and Li et al. (2023), through simulation analysis, examined the stress and deformation of surrounding rock supported by different anchor rod densities, highlighting the existence of an optimal value to ensure roadway support safety. Shi et al. (2023b); Shi et al. (2024) considered the influence of fracture distribution and analyzed the interaction between the rock bolt and rock mass through the simulation of bolt pull-out tests. Osgoui and Unal (2009) designed and modified the anchor bolt density through experimental and theoretical methods to evaluate the convergence of the tunnel. Yang X. et al. (2023) analyzed the stress field in the mining area and proposed a combined support method that includes increasing the density of anchor rod support, grouting transformation, and stress reduction, providing a new idea for stabilization control of roadway at different depths. Yuan et al. (2019) investigated the reasonable support density for deep thick coal seam mining roadways, focusing on the geological conditions of the 630 mining area in Tangkou coal mine with significant burial depth and thick top coal. The study confirmed a reasonable spacing between anchor bolts of 1000 mm × 1000 mm. Furthermore, Zhang et al. (2015) and Dong et al. (2023) devised a testing system for anchored composite bearing bodies and explored their bearing characteristics under varying anchor support densities using physical similarity simulation experiments. In a comprehensive analysis, Greco and Cuomo (2012) detailed the method for determining support density in the support system of coal mining working faces, encompassing factors affecting support density, calculation of working face roof pressure, selection of individual hydraulic props, and the determination of support density. These research outcomes hold significant value in comprehending the influence of support density on surrounding rock stability. Presently, most research predominantly concentrates on anchor bolts, with limited studies exploring the density of anchor cable support (Reda et al., 2017; Li et al., 2021; Sasaki et al., 2022). Furthermore, it is crucial to highlight that existing research mostly provides phenomenological analysis, neglecting an in-depth exploration into the underlying mechanisms that elucidate the influence of support density.
In this study, a numerical model was developed, taking into account the evolution of mechanical parameters of the surrounding rock post-peak, using plastic shear strain as a multi-segment linear function. This model is tailored to reflect the specific engineering circumstances of the pedestrian downhill roadway in the 11th mining area of Yindonggou mine. Through tracking the vertical displacement of the roof and floor, the axial force of the anchor cable, and the distribution and progression of the plastic zone, the effect of varying densities of anchor cable supports on the stability of the roadway was investigated.
2 Project overview
The Yindonggou mine field is situated in the northern part of the Wangwa mining area within Pengyang County, Ningxia Hui Autonomous Region. Geographically, the mine field spans approximately 5.19 km in length from north to south and 3.75 km in width from east to west, covering a total area of 13.60 km2. Notably, it encompasses a significant coal bearing area of 11.19 km2. The terrain of this region belongs to the eroded hilly area of the Loess Plateau, characterized by an average elevation of 1600 m at the erosion base of the gully. Within the mine field, the presence of vertical joints in the loess formations often results in the formation of steep walls on both sides of the valley. Continuous water flow erosion further contributes to the vertical and horizontal cutting of the valley, reaching maximum depths of up to 300 m.
This study specifically examines the 11th mining areas, where pedestrians descend through a layered roadway. The false roof of the roadway exhibits significant development, and the lithology consists of interbedded sandstone, argillaceous sandstone, and mudstone, which possess low robustness. When exposed to water, these strata are prone to softening and delamination, resulting in roof leakage and caving. To address these challenges, a combined support scheme utilizing anchor cables and shotcrete has been primarily implemented considering local resources, equipment, personnel, and technological advantages. However, due to the weak lithology, high ground stress, and intense mining disturbances, roadway collapse, rock fragmentation, and floor heave are common occurrences, adversely affecting both mine production efficiency and posing severe safety risks to personnel and equipment. Given that the existing support system fails to meet the design requirements, there is an urgent need to verify the effectiveness of reinforcing the anchor cable support through increased encryption.
3 Establishment of numerical model
FLAC3D, a software specializing in continuous medium mechanics analysis, is utilized. This software possesses a robust capability to address intricate mechanical problems and finds extensive application in simulating large deformations and designing support systems within geotechnical and mining engineering (Zhao et al., 2012; Shi et al., 2019; Wang et al., 2023; Zheng et al., 2024). Notably, its usage facilitates the establishment of roadway and support structure models while enjoying industry-wide recognition for the reliability of its simulation results (Zhao et al., 2012; Shi et al., 2019; Gao et al., 2023; Wang et al., 2023). Given that the advantages of FLAC3D align closely with the objectives of this study, it was sfelected as the preferred software.
3.1 Numerical model and its boundary conditions
3.1.1 Model size and rock layer division
Based on the specific conditions observed in the pedestrian downhill roadway of the 11th mining areas under study, a numerical model was established with dimensions of 40 m × 50 m × 55 m (length × width × height), as depicted in Figure 1. The model consists of a total of 751,935 units and encompasses six rock layers: mudstone 1, argillaceous sandstone, mudstone 2, fine sandstone, siltstone, and mudstone 3, arranged from top to bottom. The thickness of each rock layer is approximated based on measured data, measuring 10, 3, 2, 14, 10, and 16 m, respectively, as illustrated in Figure 1A. The pedestrian downhill roadway features a slope of 15°, exhibiting a straight wall arch section as depicted in Figure 1A. The roadway possesses a width of 4600 mm, with a straight wall height of 1900 mm and a total height of 4200 mm, as shown in Figure 1B. The lower section of the roadway adopts a reverse arch configuration, characterized by a curvature radius of 5 m. The preservation of roadway boundaries and reverse arches is accomplished through the usage of preset grids.
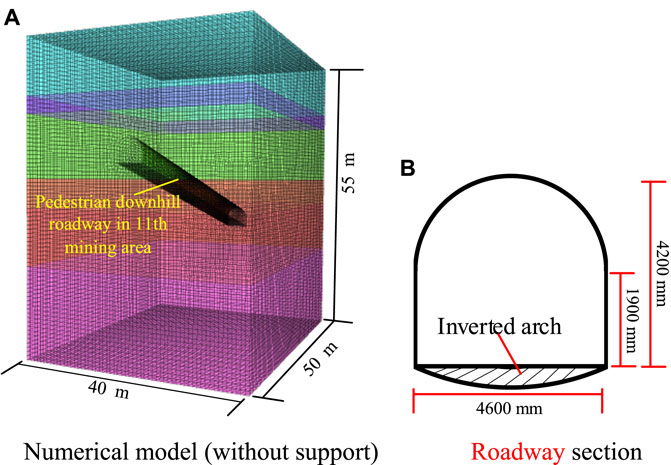
FIGURE 1. Numerical model and roadway section.
3.1.2 Model boundary constraints
The studied section of the roadway exhibits a burial depth of approximately 500 m. However, the Yindonggou coal mine is situated at the mountain border, resulting in significant compression of the underlying strata due to the overlying rock. Based on the ground pressure values measured on-site, a uniformly distributed load of 12.6 MPa is applied at the top of the model, while an internal lateral pressure of 18.6 MPa is incorporated within the model. Furthermore, horizontal and vertical displacement constraints were implemented around and at the bottom of the model.
3.2 Mechanical model and physical and mechanical parameters of the model
3.2.1 Strain softening model
The pedestrian downhill roadway within the 11th mining area of Yindonggou coal mine has encountered significant deformations and damages due to high ground stress and severe mining disturbances. Despite multiple repair attempts, these efforts have proven unsuccessful. Consequently, studying the surrounding rock of the roadway necessitates an examination of the post-peak failure process while considering changes in the corresponding physical and mechanical parameters of the surrounding rock. To address these complexities, this study employs the strain softening model as the mechanical model for the numerical model depicted in Figure 1. This model is based on the Mohr-Coulomb model with non-correlated shear and correlated tensile flow rules. In comparison to the Mohr-Coulomb model, the strain softening model allows for the softening or hardening of parameters after specimen yield, as illustrated in Figure 2. Furthermore, the model indicates that prior to plastic yielding, only elastic strain occurs in the rock. However, after reaching the yield strength, the total strain comprises both elastic and plastic components. The strain softening model enables the definition of parameters such as cohesion and internal friction angle as piecewise linear functions with plastic shear strain serving as the internal variable (Shi et al., 2019).
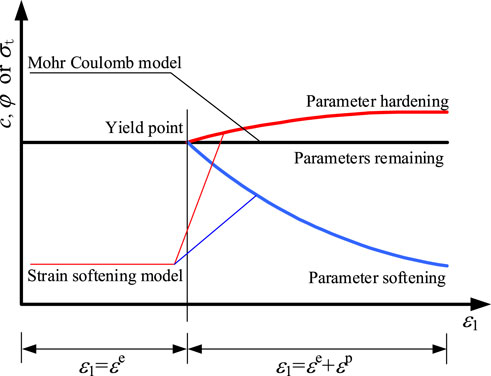
FIGURE 2. Change of mechanical parameters in the Mohr-Coulomb model and strain softening model.
The expression for Hooke’s law concerning principal stress and strain in the strain softening model is provided below (Shi et al., 2019):
where, the incremental expressions of strain are denoted as
The expression for the shear yield function in the strain softening model is as follows (Shi et al., 2019):
where,
The equation representing the tensile yield strength is given by Gao et al. (2023):
In general, it is assumed that the total strain increment can be decomposed into two components: elastic and plastic. The flow law governing plastic yielding can be expressed as follows (Shi et al., 2019):
where i = 1, 3,
where,
The tensile yield component of the potential function is represented by
The plastic strain increment associated with shear failure can be expressed in the following form (Zheng et al., 2024):
The correction equation for shear failure stress can be derived by incorporating Eq. 8 into Eq. 1, resulting in the following expression (Zheng et al., 2024):
where, the superscripts
3.2.2 Physical and mechanical parameters of the model
By consulting the exploration data of the Yindonggou mine field and incorporating relevant geological data from the Ningxia mining area, it is possible to approximately determine the physical and mechanical parameters for each rock layer. These parameters are summarized in Table 1.
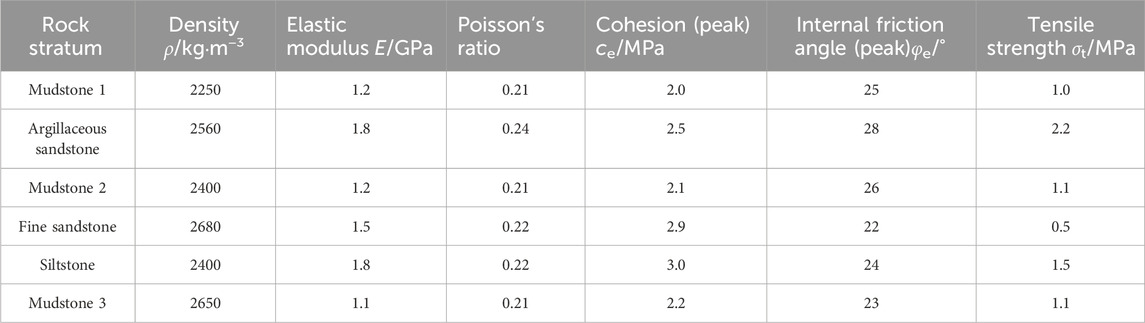
TABLE 1. Physical and mechanical parameters of each rock strata in numerical model.
The post-peak softening model utilized in Section 3.2.1 necessitates a pre-simulation analysis to determine the evolution of cohesion, internal friction angle, and tensile strength for each rock layer within the numerical model, considering the actual deformation observed in the on-site roadway. These determined values are then incorporated as segmented functions into the FLAC3D software, enabling customization of the parameter evolution specifically for the post-peak softening model. The resulting softening piecewise linear functions for the six rock mechanics parameters determined in this study are illustrated in Figure 3. Analysis of the functions reveals that as the plastic shear strain increases from 0 to 0.2, there is a consistent decrease in cohesion, internal friction angle, and tensile strength, indicating a gradual reduction in the bearing capacity of the rock mass. Once the plastic shear strain reaches 0.2, the parameters have diminished to significantly low levels and remain constant thereafter. This signifies the occurrence of rock rupture, primarily in the form of rock blocks.
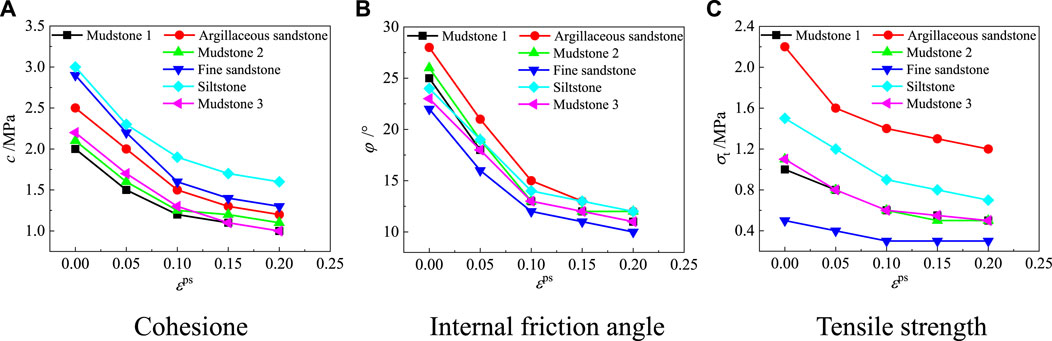
FIGURE 3. Evolution of cohesion, internal friction angle, and tensile strength with plastic shear strain.
4 Anchor cable layout and research plan
4.1 Anchor cable layout
The roadway site is supported by a combination of anchor cables and spray layers. In this study, the FLAC3D software utilizes structural units to simulate the anchor cables, while solid units are employed to represent the rock mass. The interaction between the anchor cables and the rock mass is depicted in Figure 4. To account for the shear characteristics of the anchor-rock interface, bonding and friction parameters are set, and a spring slider is implemented at the anchor-rock connection node (Shi et al., 2019), as illustrated in Figure 4A. With an increase in axial force applied to the anchor cable, relative displacement
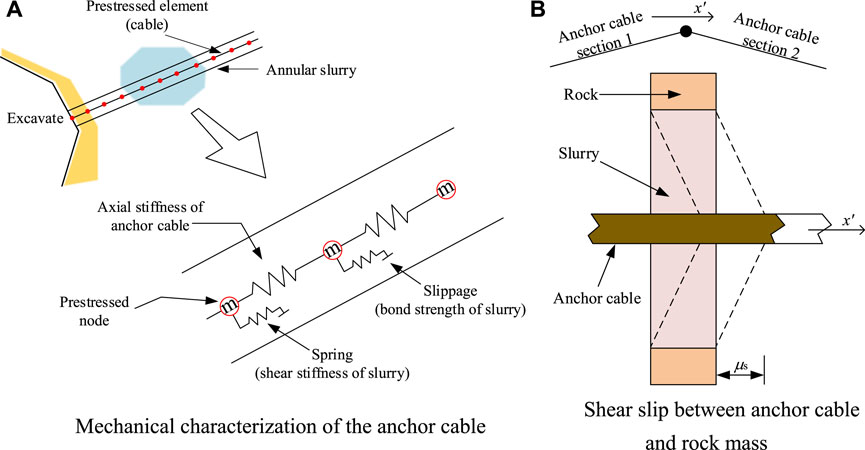
FIGURE 4. Interaction of the cable, grout and rock.
This study primarily focuses on examining the influence of varying anchor cable support densities on the stability of the pedestrian downhill area in the 11th mining zone. 4 distinct support densities were employed, with corresponding anchor cable spacing intervals and array pitches of 1.2 m × 1.2 m, 0.8 m × 0.8 m, 0.4 m × 0.8 m, and 0.4 m × 0.4 m, as depicted in Figure 5.
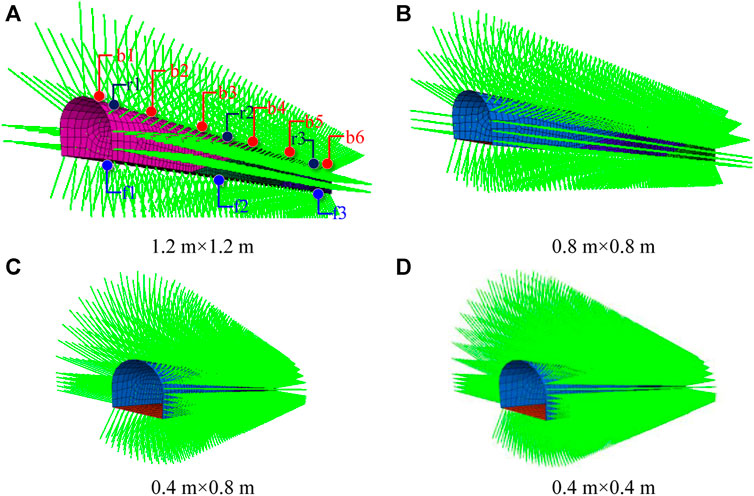
FIGURE 5. Layout of cable support and measurement points.
For the sake of convenience in analysis, this study assigns names to the models based on their spacing intervals and array pitches. Specifically, Model 1 corresponds to a spacing interval and array pitch of 1.2 m × 1.2 m, Model 2 to 0.8 m × 0.8 m, Model 3 to 0.4 m × 0.8 m, and Model 4 to 0.4 m × 0.4 m. Correspondingly, the total number of anchor cables included in Models 1-4 is calculated as 602, 1365, 2600, and 5160, respectively. Additionally, all anchor cables possess a prestressing force of 300 kN with a length of 6.2 m. The length of the free section is 5.2 m, while the anchoring section measures 1 m. Other anchoring parameters can be found in Table 2.
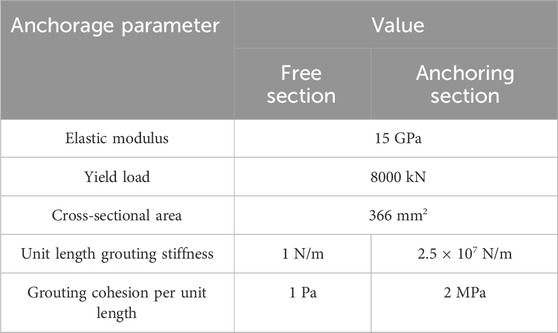
TABLE 2. Anchorage parameters of cable.
4.2 Research plan
Firstly, the displacement and velocity fields are reset after achieving the initial balance of the model. Subsequently, the roadway (including the inverted bottom arch) is excavated in a single operation while implementing support based on the four types of anchor cable arrangements illustrated in Figure 5. Simultaneously, measurement points for anchor cable stress as well as top and bottom plate displacement are strategically placed following the configuration shown in Figure 5A. Finally, the inverted arch is reconstructed, and balance calculations are performed to analyze the stability of the roadway from the perspectives of anchor cable stress and deformation and failure of the surrounding rock.
5 Simulation results and analysis
This study extracted the evolution of the top and bottom plate displacement and anchor cable axial force at the measurement points with the calculation time step after the model was balanced; The vertical stress and displacement fields of the model were obtained by exporting data through the FLAC-Tecplot interface; By compiling the FISH program, the plastic zone of the surrounding rock of the model was extracted within different plastic shear strain thresholds.
5.1 Analysis of displacement evolution of roadway roof
The evolution of roadway roof displacement, measured at points r1, r2, and r3 in Figure 5A with respect to the calculation time step, is depicted in Figure 6. The displacement at measurement points r1 and r3 initially exhibits a decreasing trend with a decreasing rate, eventually stabilizing as the calculation time step increases. During the initial calculation (timestep 0), the roadway excavation causes the numerical model to enter an unstable state. Consequently, the surrounding rock, especially at the free face, transitions from its original three-dimensional compression equilibrium state to a bidirectional compression state, leading to a redistribution of internal stress. This corresponds to deformation in the surrounding rock units adjacent to the roadway, causing movement towards the roadway space due to the overall loss of support. Notably, the closer a unit is to the roadway space, the greater the extent of movement observed (refer to Figure 6). As the surrounding rock deforms, the concentration coefficient of internal stress gradually diminishes. Under the combined influence of self-supporting capacity of the surrounding rock and increasing constraints provided by anchor support, the rate of surrounding rock deformation is controlled and gradually reduces until it reaches a stable state.
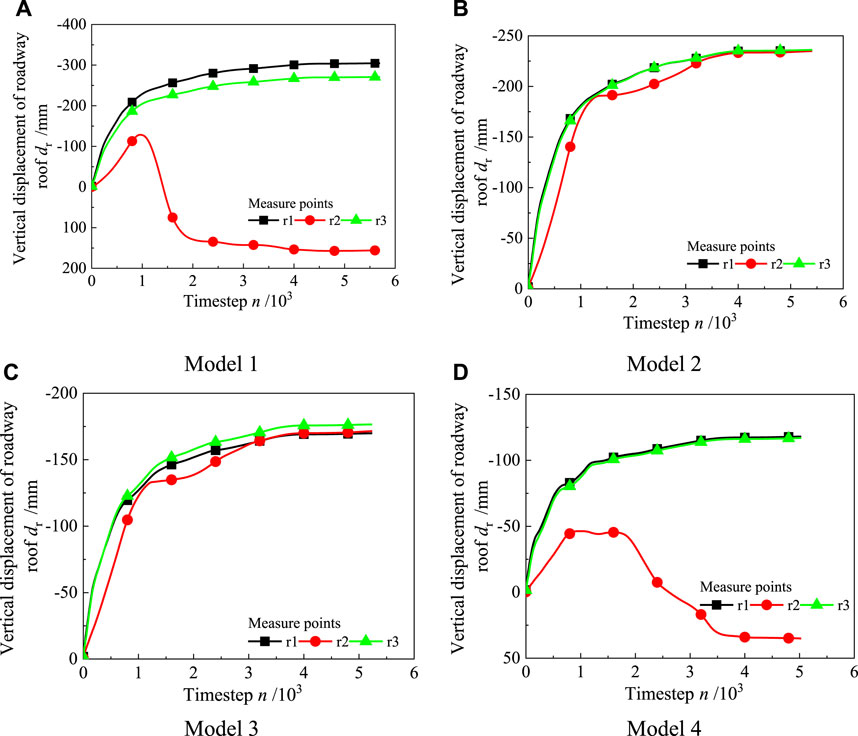
FIGURE 6. Evolution of roof displacement at measurement point with calculation time-step.
The results obtained from the r2 measurement points align with the evolution patterns observed at the r1 and r3 measurement points in Model 2 and Model 3. However, in both Model 1 and Model 4, the top plate at the r2 measurement point experiences a pattern of initial sinking followed by rising. This phenomenon is unlikely to occur at engineering sites and can be attributed to inherent numerical transfer component defects.
In FLAC3D, the damage and failure of the roadway roof units do not manifest as they would in actual engineering scenarios. Instead, these effects are reflected through the weakening of mechanical parameters within the units, which will not have a significant impact on the effectiveness of the simulation results. When significant, uneven subsidence occurs in the roof units, tension or compression arises between the nodes, resulting in the formation of “folds” in the surrounding rock of the roadway’s free face, as illustrated in Figure 7. In other words, due to the squeezing force exerted by the surrounding rock, some of the confining pressure increases upward.
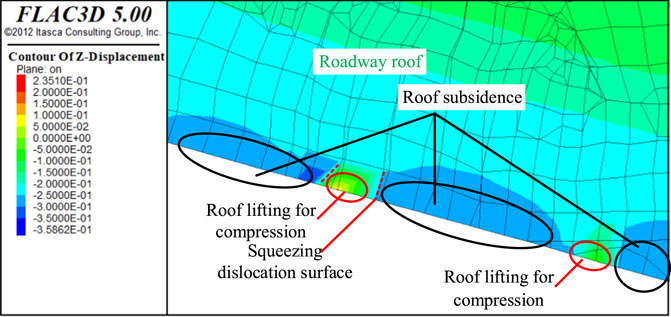
FIGURE 7. “Folding” phenomenon of roadway roof.
After completing the model balance calculation, the vertical displacement data of the roof in Figure 6 was extracted to plot the displacement evolution with varying anchor cable spacing intervals and array pitches, as depicted in Figure 8. With the exception of the abnormal displacement evolution at the r2 measurement point caused by “folding” of the roadway roof, the subsidence displacement at the r1 and r3 measurement points demonstrates a linear decrease as the support density increases. This observation suggests that higher densities of anchor cable support lead to improved support effects on the surrounding rock. Ultimately, substituting rock material with anchor cable material noticeably enhances the rock lithology to a certain extent.
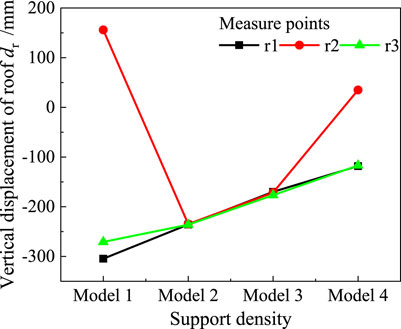
FIGURE 8. Relationship between vertical displacement of top plate and spacing between cables.
5.2 Analysis of displacement evolution of roadway floor
The evolution of roadway floor displacement, measured at points f1, f2, and f3 in Figure 5A with respect to the calculation time step, is illustrated in Figure 9. The displacement of the bottom plate at each measuring point initially exhibits an increasing trend, followed by a decreasing rate, and eventually stabilizes as the calculation time step increases. Similar to the roof displacement evolution, roadway excavation alters the stress state of the surrounding rock at the free face, causing the roadway floor to shift towards the roadway space due to support loss. However, the deformation speed of the floor’s surrounding rock is controlled and gradually decreases until it reaches a stable state, influenced by both the self-supporting capacity of the surrounding rock and the growing constraints provided by anchor cable support.
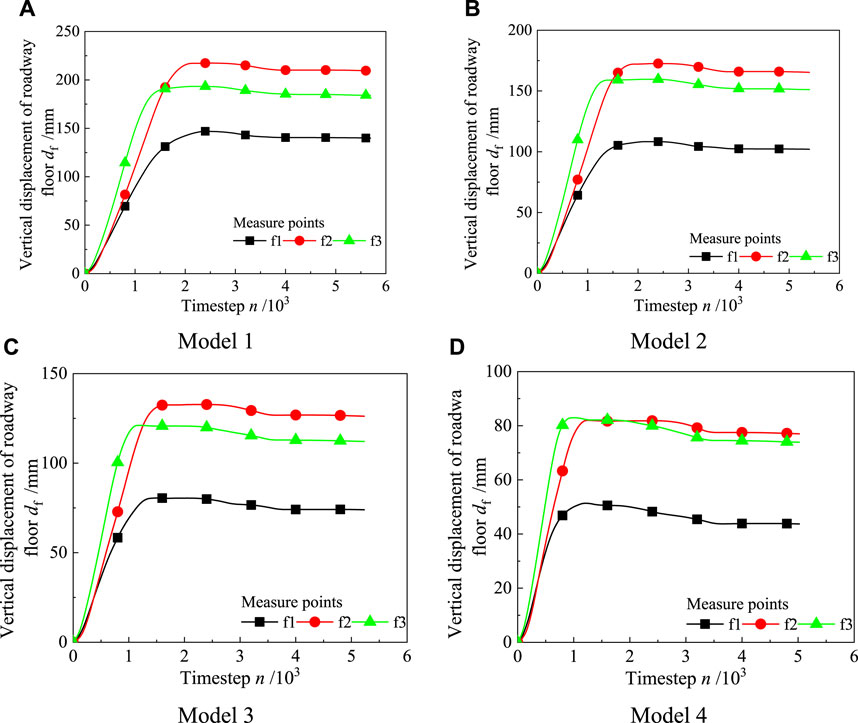
FIGURE 9. Evolution law of floor displacement at measurement point with calculation time-step.
In contrast to the roof’s surrounding rock, the displacement of the floor’s surrounding rock is significantly affected by burial depth. Particularly, when the measuring point has a small burial depth (as observed at f1), the upward displacement of the bottom plate is notably smaller. Conversely, for measuring points with greater burial depth (as seen at f2 and f3), the disparity in upward displacement diminishes. In fact, even in Model 1, Model 2, and Model 3, the rise displacement at f2 slightly exceeds that at f3.
After completing the model balance calculation, the vertical displacement data of the roadway floor in Figure 9 was extracted to plot the evolution of rise displacement with varying anchor cable spacing intervals and array pitches, as depicted in Figure 10. The upward displacement of the roadway floor, obtained from measuring points f1, f2, and f3, exhibits a nearly linear decreasing trend as the support density increases. This finding reaffirms the conclusion that higher densities of anchor cable support lead to improved support effects on the surrounding rock.
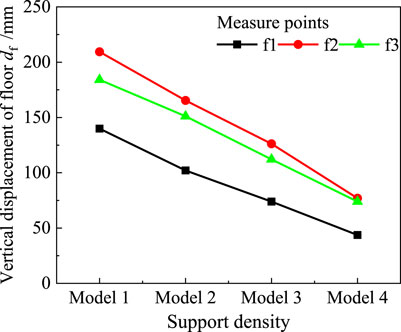
FIGURE 10. Relationship between vertical displacement of roadway floor and support density of anchor cables.
5.3 Analysis of evolution of anchor cable load
The evolution of axial cable load, extracted from six measurement points (as seen in Figure 5A), in Models 1-4 is presented in Figure 11. The overall axial force of the anchor cable demonstrates an evolutionary pattern characterized by initial increase with a decreasing rate, followed by a relatively stable trend as the calculation timestep increases. This pattern resembles the sinking behavior observed in the roof displacement (see Figure 6). The deformation of the roof’s surrounding rock and the tensile deformation of the moving traction anchor cable contribute to the gradual increase in axial load (Jahromi et al., 2011; Li et al., 2019; Shi et al., 2019). However, under the combined influence of the self-supporting capacity of the surrounding rock and the growing constraints provided by anchor cable support, the deformation speed of the surrounding rock is controlled and exhibits a gradual decrease (see Figure 6), corresponding to a reduction in the rate of increase for the axial load of the anchor cable. The support load interacts with the structural deformation until reaching an equilibrium state.
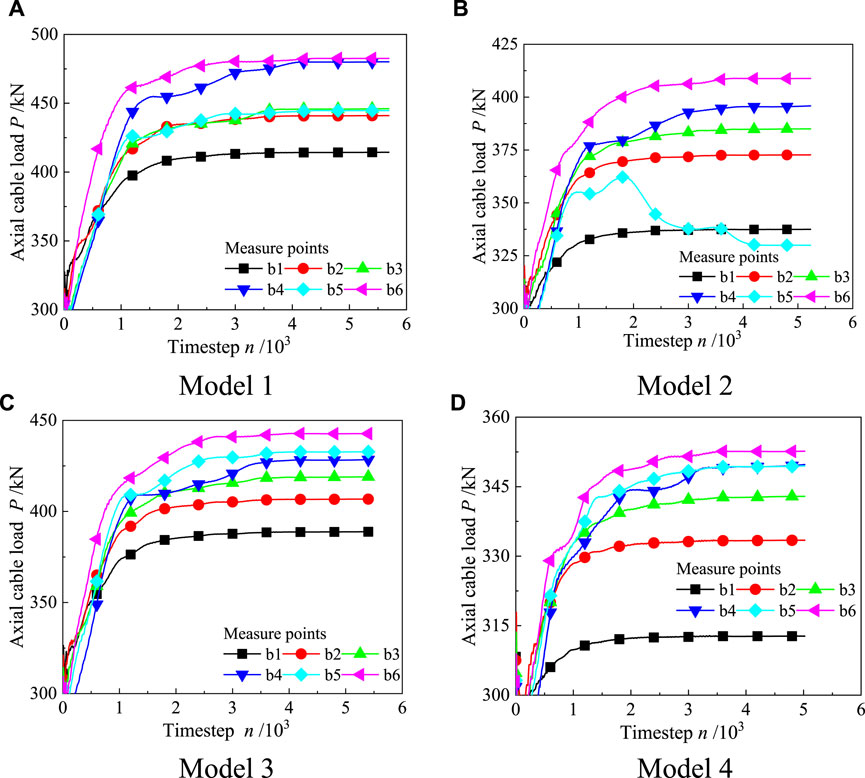
FIGURE 11. Evolution of cable axial force at measurement point with calculation time-step.
Moreover, it is noted that greater burial depth at a particular measuring point results in a higher axial force of the corresponding anchor cable after achieving model equilibrium, along with a longer corresponding time step during equilibrium. Higher burial depths correspond to higher internal stress within the surrounding rock. Consequently, the deformation and displacement of the roadway’s surrounding rock under high stress levels are notably greater than those under low stress conditions, leading to increased pulling effects on the anchor cable (Wang et al., 2022; Chai S. B. et al., 2023).
After completing the model balance calculation, the axial force data presented in Figure 11 was extracted to plot the evolution of anchor cable axial force with varying anchor cable spacing intervals and array pitches, as depicted in Figure 12. With the exception of the abnormally small results obtained at point b5 in Model 3, the axial force of the anchor cable measured at the other 5 measuring points demonstrates a nearly linear decrease as the support density increases. This finding further supports the conclusion that higher densities of anchor cable support result in improved support effects on the surrounding rock. However, it is important to note that the simulation effect may differ from the actual situation. The on-site installation of anchor cables involves drilling, which can cause certain damage to the rock mass. While this damage can be disregarded when the spacing between anchor cables is large, it becomes amplified due to interaction when the spacing is small. Consequently, this effect cannot be accurately reflected in the simulation conducted in this study.
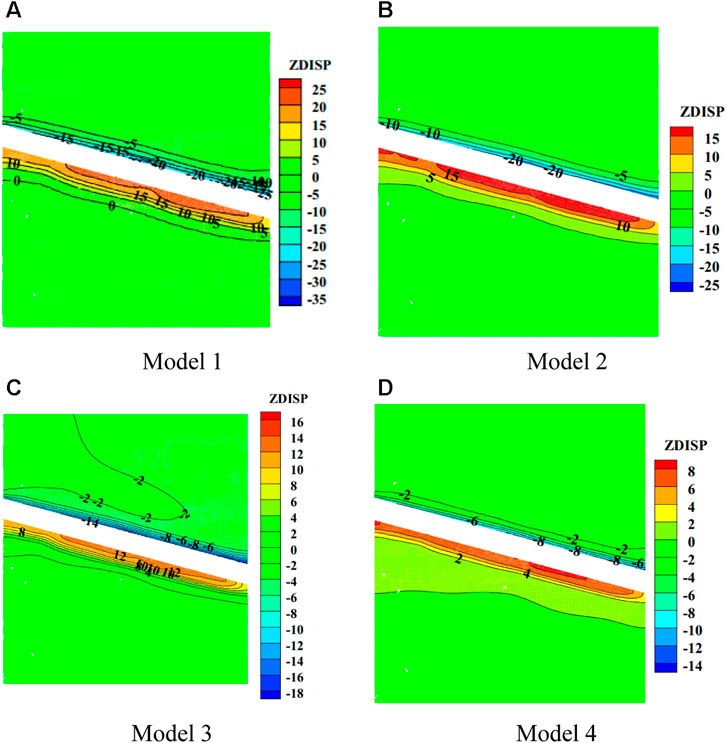
FIGURE 12. Correspondence between the axial force of cables and the spacing between cables. Vertical displacement field of the model.
5.4 Analysis of vertical displacement field of the model
The displacement field of the four models, obtained by slicing along the center of the roadway, is depicted in Figure 13. Overall, as the support density increases, the maximum displacement of the top plate sinking and bottom plate rising gradually decreases. Specifically, for models 1-4, the maximum subsidence displacement of the top plate measures 35, 25, 18, and 14 cm, respectively, while the maximum uplift displacement of the bottom plate measures 25, 15, 16, and 8 cm, respectively.
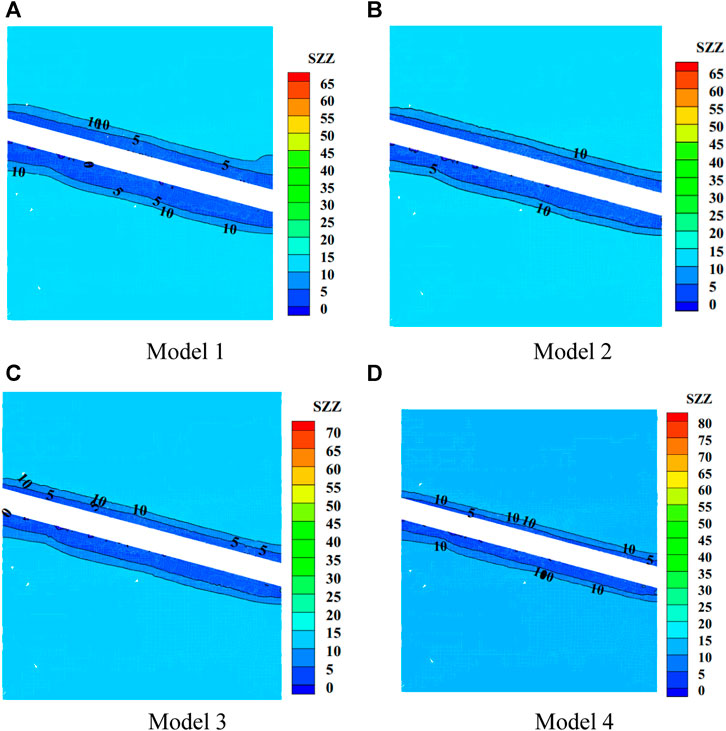
FIGURE 13. Vertical stress field of the model.
Additionally, it is evident that the loose deformation zone of the roof’s surrounding rock extends approximately between 2 m and 5 m. Considering the anchor cable length of 6.2 m, it remains capable of providing suspension support within this range. Moreover, the overall disturbance range diminishes with increasing support density and expands with increasing burial depth. However, for the floor, the disturbance deformation range exceeds the span of anchor cable support (6.2 m) and reduces with increasing burial depth. Furthermore, a higher burial depth correlates to a greater degree of floor heave.
5.5 Vertical stress field analysis of the model
The vertical stress fields of the four models, obtained by slicing along the center of the roadway, are illustrated in Figure 13. With an increase in support density, the maximum vertical stress in the model exhibits a rising trend. Specifically, the maximum vertical stresses for models 1-4 measure 65, 65, 70, and 80 MPa, respectively. However, these maximum stresses occur sporadically within the disturbed area of the surrounding rock. This phenomenon arises because as the density of anchor cable support increases, its restraining effect on the surrounding rock gradually intensifies, making it challenging to release the accumulated stress or deformation energy within the rock mass (Shi et al., 2020a; Shi et al., 2020b; Shi et al., 2022; Shi et al., 2023a). Consequently, concentrated loads manifest only in limited regions of the disturbed area.
Moreover, it is notable that the stress reduction area in the surrounding rock aligns closely with the loosening and deformation area observed in the roof’s surrounding rock. However, there is minimal variation in the stress reduction area of the floor’s surrounding rock with changes in burial depth.
5.6 Evolution of plastic zone
After balancing the four models, elements exhibiting plastic shear strains
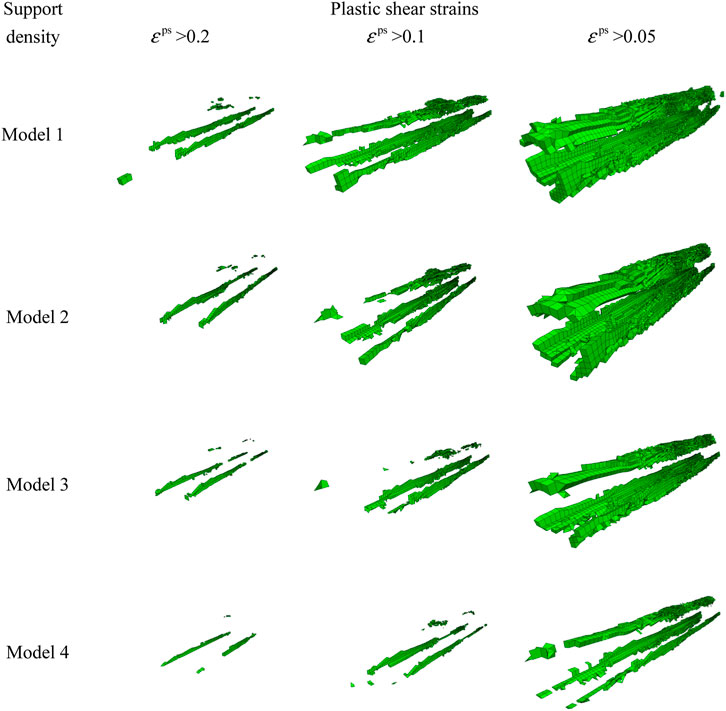
FIGURE 14. Model plastic zone.
Using FISH language programming, the evolution of the number of elements experiencing plastic shear strain with varying support density in Figure 14 can be further analyzed, as demonstrated in Figure 15. It is evident that as the spacing between anchor cables increases from 1.2 m × 1.2 m–0.4 m × 0.4 m, the number of elements exhibiting plastic shear strains greater than 0.2, 0.1, and 0.05 follows a nearly linear decreasing trend. This trend aligns with changes observed in the axial load of the anchor cable and the vertical displacement of the roof and floor after model balancing, providing strong confirmation of the beneficial role of enhanced anchor cable support in improving roadway stability.
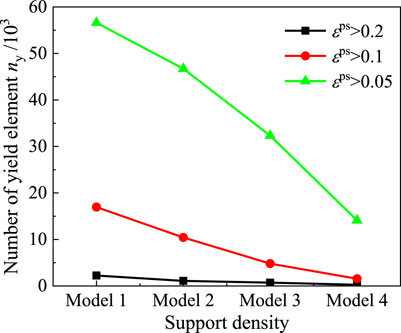
FIGURE 15. Correspondence between the number of plastic elements and the spacing between cables.
6 Conclusion
Drawing upon the specific engineering context of the pedestrian downhill roadway in Yindonggou Mine’s 11th mining area, this research formulated a numerical model. This model takes into consideration the evolution of mechanical parameters of the surrounding rock post-peak, describing plastic shear strain via a multi-segment linear function. Analyses were conducted based on several factors, including the vertical displacement of top and bottom plates, the axial force of anchor cables, and the distribution and development of the plastic zone. The study examined the effect of four support densities—1.2 m × 1.2 m, 0.8 m × 0.8 m, 0.4 m × 0.8 m, and 0.4 m × 0.4 m—on the stability of the roadway. The key findings are as follows:
(1) The displacement of the roadway roof manifests a pattern where it initially decreases at a declining rate, and then maintains stability as the calculation time step increases. Conversely, the floor displacement initially shows an ascending trend at a decreasing rate before stabilizing with increased calculation time step. Furthermore, both the upward displacement of the roof and the downward displacement of the floor demonstrate a nearly linear decline with increasing support density.
(2) Owing to the tensile effects from the deformation and movement of the surrounding rock of the roof, the axial force of the anchor cable follows an evolutionary trajectory. It first rises at a declining rate before maintaining a virtually constant value as the calculation time step grows.
(3) Examination of the vertical displacement field of the model reveals that an increase in support density leads to a gradual decrease in the maximum displacement observed in both the top plate’s sinking and the bottom plate’s rising. Concurrently, the vertical stress field indicates an escalating trend in the maximum vertical stress of the model with augmenting support density.
(4) Correlating to increased support density is a diminishing trend in the number of units exhibiting plastic shear strains greater than 0.2, 0.1, and 0.05, indicative of heightened roadway stability. Moreover, it is more likely to witness plastic shear yielding at the intersection of the roadway floor and side, while the prospect of such yielding at the roadway shoulder appears lower.
Data availability statement
The raw data supporting the conclusion of this article will be made available by the authors, without undue reservation.
Author contributions
LJ: Data curation, Formal Analysis, Funding acquisition, Writing–original draft, Writing–review and editing.
Funding
The author(s) declare that no financial support was received for the research, authorship, and/or publication of this article.
Conflict of interest
The author declares that the research was conducted in the absence of any commercial or financial relationships that could be construed as a potential conflict of interest.
Publisher’s note
All claims expressed in this article are solely those of the authors and do not necessarily represent those of their affiliated organizations, or those of the publisher, the editors and the reviewers. Any product that may be evaluated in this article, or claim that may be made by its manufacturer, is not guaranteed or endorsed by the publisher.
References
Chai, L. Z., Chai, S. B., Li, P., Liu, J. B., Song, B. Y., and Li, X. P. (2023a). Analysis of P-wave propagation in filled jointed rock mass with viscoelastic properties. Geomech. Geophys. Geo. 9, 102. doi:10.1007/s40948-023-00642-z
Chai, S. B., Liu, H., Song, L., Li, X. P., Fu, X. D., and Zhou, Y. Q. (2023b). Static pressure and dynamic impact characteristics of filled jointed rock after frozen-thaw cycle damage. Front. Ecol. Evol. 11, 1222676. doi:10.3389/fevo.2023.1222676
Dong, H., Li, T., and Chen, C. (2023). Pretension design of a flexible support cable net structure with high node position precision. J. Mech. Sci. Technol. 37, 3017–3025. doi:10.1007/s12206-023-0527-1
Gao, H., Zhai, Y., Wang, T., Li, Y., Meng, F., Zhang, H., et al. (2023). Compression failure conditions of concrete-granite combined body with different roughness interface. Int. J. Min. Sci. Techno. 33, 297–307. doi:10.1016/j.ijmst.2022.12.002
Gong, W. J., Tao, Z. G., He, M. C., and Hou, H. J. (2022). Feasibility analysis on the support of rock slopes against flexural toppling failure using the DDA Method-A case study. KSCE J. Civ. Eng. 26, 3847–3862. doi:10.1007/s12205-022-2331-3
Greco, L., and Cuomo, M. (2012). On the force density method for slack cable nets. Int. J. Solids Struct. 49, 1526–1540. doi:10.1016/j.ijsolstr.2012.02.031
Jahromi, A. N., Li, Z., Kuffel, J., Fenger, M., and Levine, J. (2011). Load-cycling test of high-voltage cables and accessories. IEEE Electr. Insul. M. 27, 14–28. doi:10.1109/MEI.2011.6025365
Jia, H., Wang, Y., Liu, S., Wang, L., Zhi, G., Peng, B., et al. (2021). Experimental study of stirring and Resin-Blocking devices for improving the performance of Resin-Anchored cable bolts. Rock Mech. Rock Eng. 54, 3995–4008. doi:10.1007/s00603-021-02470-7
Li, G., Hu, Y., Tian, S., Weibin, M., and Huang, H. (2021). Analysis of deformation control mechanism of prestressed anchor on jointed soft rock in large cross-section tunnel. B Eng. Geol. Environ. 80, 9089–9103. doi:10.1007/s10064-021-02470-5
Li, G., Zhu, C., He, M., Zuo, Y., Gong, F., Xue, Y., et al. (2023). Intelligent method for parameters optimization of cable in soft rock tunnel base on longitudinal wave velocity. Tunn. Undergr. Sp. Tech. 133, 104905. doi:10.1016/j.tust.2022.104905
Li, X., Mickaël, L., and Lallart, M. (2019). Load transfer characteristics of a cable bolt in DEPT. Shock Vib. 2019, 2106741. doi:10.1155/2019/2106741
Men, S. (2023). Analysis on the effect of anchor density on roadway support for rock support in dug-in enclosure. Mech. Manag. Dev. 38, 42–43+46. (in Chinese). doi:10.16525/j.cnki.cn14-1134/th.2023.01.016
Ming, W., Yang, X., Pan, Y., Mao, Y., Wang, X., He, M., et al. (2023). Field test and numerical simulation of initial support effect of negative Poisson's ratio anchor cable under strong impact and vibration. Tunn. Undergr. Sp. Tech. 133, 104955. doi:10.1016/j.tust.2022.104955
Osgoui, R. R., and Unal, E. (2009). An empirical method for design of grouted bolts in rock tunnels based on the geological strength index (GSI). Eng. Geol. 107, 154–166. doi:10.1016/j.enggeo.2009.05.003
Reda, A., Howard, I. M., Forbes, G. L., Sultan, I. A., and Mckee, K. K. (2017). Design and installation of subsea cable, pipeline and umbilical crossing interfaces. Eng. Fail. Anal. 81, 193–203. doi:10.1016/j.engfailanal.2017.07.001
Sasaki, T., Sato, F., Risch, B. G., and Weimann, P. A. (2022). Ultrahigh fiber count and high-density cables, deployments, and systems. IEEE 110, 1760–1771. doi:10.1109/JPROC.2022.3199645
Shi, H., Chen, W., Zhang, H., and Song, L. (2023a). A novel obtaining method and mesoscopic mechanism of pseudo-shear strength parameter evolution of sandstone. Environ. Earth. Sci. 82, 60. doi:10.1007/s12665-023-10748-y
Shi, H., Chen, W. L., Zhang, H. Q., Song, L., Li, M., Wang, M. J., et al. (2023b). Dynamic strength characteristics of fractured rock mass. Eng. Fract. Mech. 292, 109678. doi:10.1016/j.engfracmech.2023.109678
Shi, H., Song, L., Chen, W. L., Zhang, H. Q., Wang, G. Z., Yuan, G. T., et al. (2020a). New non-destructive method for testing the strength of cement mortar material based on vibration frequency of steel bar: theory and experiment. Constr. Build. Mater. 262, 120931. doi:10.1016/j.conbuildmat.2020.120931
Shi, H., Song, L., Zhang, H., Chen, W., Lin, H., Li, D., et al. (2022). Experimental and numerical studies on progressive debonding of grouted rock bolts. Int. J. Min. Sci. Techno. 32, 63–74. doi:10.1016/j.ijmst.2021.10.002
Shi, H., Zhang, H., Song, L., and Wu, Y. (2019). Variation of strata pressure and axial bolt load at a coal mine face under the effect of a fault. Arch. Min. Sci. 64 (2), 351. doi:10.24425/ams.2019.128688
Shi, H., Zhang, H. Q., Chen, W. L., Song, L., and Li, M. (2024). Pull-out debonding characteristics of rockbolt with prefabricated cracks in rock: a numerical study based on particle flow code. Comput. Part. Mech. doi:10.1007/s40571-023-00607-9
Shi, H., Zhang, H. Q., Song, L., Yang, Z., Yuan, G. T., Xue, X. R., et al. (2020b). Failure characteristics of sandstone specimens with randomly distributed pre-cracks under uniaxial compression. Environ. Earth. Sci. 79, 193. doi:10.1007/s12665-020-08933-4
Wang, T., Chang, J., and Wang, H. (2023). A study of the deformation law of the surrounding rock of a laminated roadway based on FLAC3D secondary development. Appl. Sci-Basel 13, 6077. doi:10.3390/app13106077
Wang, X., Li, J., Zhao, X. B., and Liang, Y. (2022). Propagation characteristics and prediction of blast-induced vibration on closely spaced rock tunnels. Tunn. Undergr. Sp. Tech. 123, 104416. doi:10.1016/j.tust.2022.104416
Wang, X., Wang, G., Wu, B., Liu, S., Zhijie, Z., and Zhu, Z. (2021). Study on the lagging support mechanism of anchor cable in coal roadway based on FLAC3D modified model. Adv. Civ. Eng. 2021, 1–12. doi:10.1155/2021/9919454
Wu, J. Y., Jing, H. W., Gao, Y., Meng, Q. B., Yin, Q., and Du, Y. (2022). Effects of carbon nanotube dosage and aggregate size distribution on mechanical property and microstructure of cemented rockfill. Cem. Concr. Comp. 127, 104408. doi:10.1016/j.cemconcomp.2022.104408
Wu, J. Y., Wong, H. S., Zhang, H., Yin, Q., Jing, H. W., and Ma, D. (2024). Improvement of cemented rockfill by premixing low-alkalinity activator and fly ash for recycling gangue and partially replacing cement. Cem. Concr. Comp. 145, 105345. doi:10.1016/j.cemconcomp.2023.105345
Xiao, G., and Dong, M. (2016). Effect analysis of bolt support density on roadway surrounding rock deformation. Coal Technol. 35, 89–91. (in Chinese). doi:10.13301/j.cnki.ct.2016.10.036
Yang, J., Lin, J., and Jiang, P. (2023a). True triaxial test and research into bolting support compensation stresses for coal roadways at different depths. Processes 11, 3071. doi:10.3390/pr11113071
Yang, X., Ming, W., Gong, W., Pan, Y., He, M., and Tao, Z. (2023b). Support characteristics of flexible negative Poisson’s ratio anchor cable response to blasting impacts. Undergr. Space 8, 162–180. doi:10.1016/j.undsp.2022.04.010
Yang, Z., Li, S., Yu, Y., Liu, X., and Hu, Y. (2020). Study on the variation characteristics of the anchor cable prestress based on field monitoring in a foundation pit. Arab. J. Geosci. 13, 1269. doi:10.1007/s12517-020-06264-z
Yuan, P., He, B., Zhang, L., Yuan, Z., and Ma, X. (2019). Pretension design of cable-network antennas considering the deformation of the supporting truss: a double-loop iterative approach. Eng. Struct. 186, 399–409. doi:10.1016/j.engstruct.2019.02.007
Zhang, Y. D., Cheng, L., Yang, J. F., Ji, M., and Li, Y. H. (2015). Bearing characteristic of composite rock-bolt bearing structure under different bolt support density. J. Min. Saf. Eng. 32, 305–309+316. (in Chinese). doi:10.13545/j.cnki.jmse.2015.02.021
Zhao, B. Y., Liu, D. Y., Zheng, Y. R., and Dong, Q. (2012). Secondary development and slope application discussion of the non-linear visco-elastic plastic creep model in flac3d software. Disaster. Adv. 5, 1231–1236. doi:10.1038/ncomms2112
Zheng, Q. Q., Qian, J. W., Zhang, H. J., Chen, Y. K., and Zhang, S. K. (2024). Velocity tomography of cross-sectional damage evolution along rock longitudinal direction under uniaxial loading. Tunn. Undergr. Sp. Tech. 143, 105503. doi:10.1016/j.tust.2023.105503
Keywords: anchor cable, support density, pedestrian downhill roadway, stability of surrounding rock, top and bottom plate displacement, plastic zone
Citation: Jinbao L (2024) Analysis of stability in pedestrian downhill roadway at Yindonggou 11th coal mine area: the impact of anchor cable support density. Front. Energy Res. 12:1347795. doi: 10.3389/fenrg.2024.1347795
Received: 01 December 2023; Accepted: 15 February 2024;
Published: 04 March 2024.
Edited by:
Shaobo Chai, Chang’an University, ChinaReviewed by:
Jingna Guo, Chengdu University of Information Technology, ChinaJiangyu Wu, University of Oxford, United Kingdom
Copyright © 2024 Jinbao. This is an open-access article distributed under the terms of the Creative Commons Attribution License (CC BY). The use, distribution or reproduction in other forums is permitted, provided the original author(s) and the copyright owner(s) are credited and that the original publication in this journal is cited, in accordance with accepted academic practice. No use, distribution or reproduction is permitted which does not comply with these terms.
*Correspondence: Li Jinbao, MTM4NzkyNzIzNzBAMTYzLmNvbQ==