 J. S. Tumuluru
 C. Igathinathane
 D. Archer3
- 1Southwestern Cotton Ginning Research Laboratory, United States Department of Agriculture-Agricultural Research Service, Las Cruces, NM, United States
- 2Department of Agricultural and Biosystems Engineering, North Dakota State University, Fargo, ND, United States
- 3Northern Great Plains Research Laboratory, United States Department of Agriculture-Agricultural Research Service, Mandan, ND, United States
- 4Biofuels and Renewable Energy Division, Idaho National Laboratory, Idaho Falls, ID, United States
The distance a solid biomass feedstock could be used to transport the feedstock when used as biobased fuel is critical information for transportation analysis. However, this information is not available. The break-even transportation distance (BTD) of various fuels from biomass feedstocks and fossil sources was analyzed for truck, rail, and ship transport modes based on bulk density, moisture content, and specific energy. Fourteen different biomass feedstocks, such as crop residues (e.g., corn stover), woody biomass (e.g., wood chips), including thermally pretreated (torrefied) and densified forms (pellets), cattle feedlot compost, and three standard fossil fuels, namely, coal, lignite, and diesel, were considered for BTD analysis and comparison. The BTD values were derived by comparing the energy content of biomass feedstocks with the energy expended in transporting the fuels through selected transportation modes. For ready reference, an alternative derivation of BTD equations and example calculations were also presented. Among the biomass feedstocks, torrefied pellets had the highest BTD (4.16 × 10⁴, 12.47 × 10⁴, and 54.14 × 10⁴ km), and cattle feedlot compost had the lowest BTD (1.29 × 10⁴, 3.88 × 10⁴, and 9.23 × 10⁴ km), respectively, for truck, rail, and ship. Higher bulk density and higher specific energy of the biomass feedstocks increased the BTD for all modes of transport. Transport is most efficient when mass-limited. Biomass feedstock bulk densities where transportation becomes mass-limited are 223, 1,480, and 656 kg/m3 for truck, rail, and ship, respectively. Truck transport is typically mass-limited (payload limit restriction; increased BTD), whereas rail transport is entirely volume-limited (cargo space restriction; decreased BTD), and ship transport is mostly volume-limited for biomass feedstocks and mass-limited for densified biomass feedstocks. Ship transport is the most efficient, followed by rail and truck; on average for the materials (17) studied, rail is 3.1 times and ship is 9.2 times the truck’s BTD. Based on the bulk density and higher specific energy of the biomass feedstocks, regardless of the refinery location, interstate truck transport of these feedstocks is not a limiting factor in the bio-refining process., with the studied biomass feedstock BTD per truckload representing between 0.89 and 2.88 times the US perimeter.
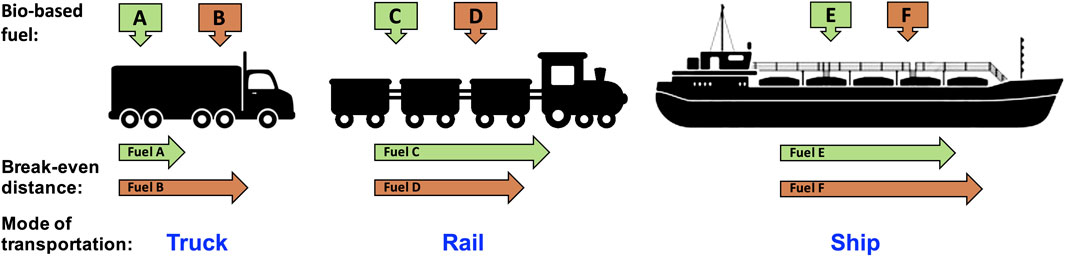
GRAPHICAL ABSTRACT | Illustration of the concept of BTDs of biomass feedstocks as bio-based fuel and the modes of transportation studied (Note: A–F are model bio-based fuels of varying energy contents. The length of the horizontal arrows symbolically represents the BTD of the selected bio-based fuels).
1 Introduction
Biomass feedstock is gaining importance due to its increased usage as a bio-based fuel in power plants and biorefineries to produce liquid and gaseous fuels. A major challenge facing the biomass industry is viable transport options for the various biomass feedstocks and products. The distance a given amount of biomass feedstock can be transported while still providing a net energy yield is crucial to the long-term implementation of biomass-related technologies. Understanding the trends associated with various biomass feedstock types is vital for biomass resource managers, transportation companies, producers, and other players in the supply chain, which has been the topic of recent investigations (Mahmudi and Flynn, 2006; Wiegmans and Konings, 2015). As ultimately energy translates to cost, energy saved leads to increased profits and subsequently promotes increased biomass feedstock usage, which in turn leads to reduced dependence on fossil fuels and a reduction of greenhouse gas emissions.
Biomass is currently the largest provider of domestic renewable energy (accounting for 47%) and supplies over 3% of total energy consumption in the United States (Perlack et al., 2011). Biomass feedstocks derived from agricultural resources, such as cereal crops and oilseeds, as well as from perennial crops as potential feedstocks for idle acres and dedicated energy crops represent an abundant feedstock resource. Given this status, the United States is well poised to make biomass a sustainable and significant part of domestic renewable energy production feedstock. Furthermore, the recent United Nations Paris Framework Convention on Climate Change called for mitigating global annual emissions of greenhouse gasses by 2020 and to hold the increase in the global average temperature to well below 2 °C from the pre-industrial levels by aggregating emission pathways (FCCC, 2015). Recently, the Intergovernmental Panel on Climate Change (IPCC) Fifth Assessment Report framed the context, knowledge base, and assessment approaches used to understand the impacts of 1.5 °C global warming above pre-industrial levels and related global greenhouse gas emission pathways (Allen et al., 2018). Among the various renewable resources available, biomass could significantly meet global energy demands and greenhouse gas mitigation goals. The vast inventory of biomass feedstocks derived from agricultural and forestry activities can be processed through established pathways to produce biofuels, bioenergy, and bioproducts, with low greenhouse gas emissions, unlike fossil fuels.
Bio-based fuels derived from various biomass feedstocks are to be transported from processing plants/refineries/fueling stations to the location of use. With fixed energy contents of different biomass feedstocks, it will be necessary to evaluate how far these feedstocks can be transported, with reference to their energy content—the proposed concept of break-even transportation distance (BTD), through various modes of transport while using the fossil fuel as transportation energy in the analysis. Given the low energy content of the biomass, one general concern/question from the user is “whether more energy is expended in transporting the biomass than the energy it contains?” Therefore, we define the BTD of biomass feedstocks (various raw biomass feedstocks and preprocessed products considered in this study) as the distance these feedstocks as bio-based fuel can travel utilizing its total available energy in a given mode of transport (e.g., truck, rail, and ship). Graphical Abstract illustrates the concept of BTD and modes of transportation considered in the study. Knowing the BTDs of different biomass feedstocks, the bio-based fuel producers or transportation logistics firms can select the suitable mode of transportation based on the available energy.
Moisture content, bulk density (kg/m3), and energy content (specific energy, J/kg) affect the biomass feedstock quality significantly; hence, transportation logistics decisions should be made based on these quality attributes. When transporting high-moisture biomass feedstocks, the water content adds to the mass and/or volume restrictions, and the moisture also reduces the specific energy. Therefore, higher and lower heating values (HHV and LHV, respectively), which are functions of moisture contents, should be used when calculating the biomass energy potential (Bradley et al., 2014). As both bulk density and specific energy rationally have a significant impact on the BTDs, improving these properties allows transportation costs to be reduced.
Mechanical densification and thermal treatment processes, such as torrefaction, were shown to improve the bulk density and specific energies of the biomass feedstocks (Tumuluru et al., 2011; 2021; Tumuluru, 2015; Pradhan et al., 2018; Picchio et al., 2023; Tumuluru, 2023). Torrefied and densified biomass reduced the shipping costs due to increased bulk density and specific energy (Searcy et al., 2014). It was also found that the torrefied biomass costs less to transport per unit energy compared to wood chips and white pellets in ship transport. The International Energy Agency (IEA) report concludes that currently, only wood pellets are traded over a long distance in large volumes, and substantial cost reduction can be realized in the wood pellet supply chain compared to raw biomass transport (Bradley et al., 2014). For example, wood pellets, torrefied wood, and pyrolysis oil have different physical, chemical, and energy characteristics, and changes in these properties impact their transportation distances.
Every mode of transport has its own overall efficiency of transporting the payload, which is taken into account via the fuel efficiency values (e.g., truck km/L or mpg), and this reflects on the biomass feedstocks’ BTDs. The standard container volume limitations and prevailing roadway mass limitations (e.g., truck transport) will impose further restrictions on the transport. Therefore, the two situations arise, namely, i) volume-limited: when the entire transport container volume was used, and its mass did not exceed the permissible limit; and ii) mass-limited: when the allowed mass limit was reached before the transport container was completely filled, are to be considered in the analysis.
The BTDs of biomass feedstocks directly influence the cost of transportation and are crucial to enable the further growth of the bioprocessing industry. The major limitations of road transportation are environmental problems, such as air pollution, congestion, and accidents, whereas inland waterway transportation is a more cost-efficient and environmentally friendly alternative (Lu and Yan, 2015). Furthermore, it was observed that usually the most critical factors in selecting the mode of freight transportation and road congestions are issues when biomass feedstock is transported, especially by trucks (Mahmudi and Flynn, 2006). Therefore, researchers suggested that rail transport can help overcome transportation costs and congestion issues (Mahmudi and Flynn, 2006; Lu and Yan, 2015).
An earlier study focused on the economics of shipping biomass feedstocks from truck to rail in a North American setting and discussed the minimum economic shipping distance for selected feedstocks (Mahmudi and Flynn, 2006). However, literature specifically relating to the concept of BTDs of various biomass feedstocks and the effect of biomass quality attributes, such as moisture content, bulk density, and energy content, on transportation logistics are not currently available, hence worth an investigation. Therefore, the overall objective of the present study was to evaluate the BTDs for various forms of biomass feedstocks based on their energy contents. Specific objectives of this research were to i) evaluate and compare the BTDs of various raw and preprocessed biomass feedstocks, such as herbaceous and woody raw biomass feedstocks, and thermally and mechanically preprocessed products with respect to the fossil fuels used in various respective standard modes of transport and ii) determine the feasibility of transporting these biomass feedstocks around the United States with a truck.
2 Materials and methods
2.1 Materials considered
For this work, 17 bio-based fuels comprising 14 potential biomass feedstocks (raw, densified, and torrefied and densified) along with three traditional fossil fuels for comparison (Table 1) were considered. It should be noted that these biomass feedstocks cannot be directly used in modern transportation vehicles, but the study is concerned about the energy content of these biomass feedstocks for the BTD calculation. All these 17 bio-based fuels are solid fuels, except diesel fuel which is a drop-in liquid fuel with reference to which the BTDs of the rest (16) were calculated. Reported values for bulk densities and specific energies of biomass feedstocks often differ (e.g., baled biomass); therefore, averages of published values were used. Referenced bales were rectangular with dimensions of 0.91 × 1.22 × 2.44 m.
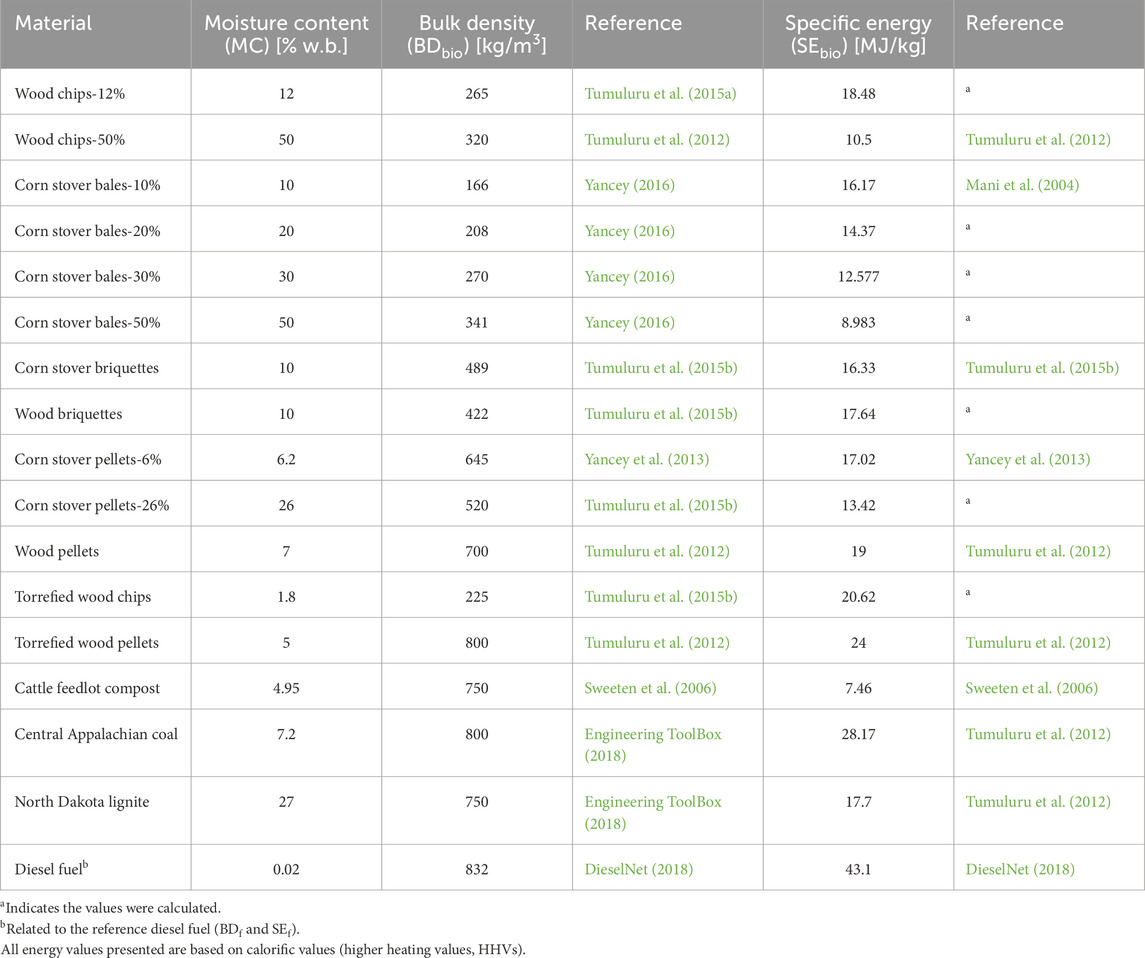
Table 1. Bulk density and specific energy data for different biomass feedstocks and fossil fuels used in the analysis.
Specific energies (energy per unit mass) for some biomass feedstocks were calculated to maintain consistency throughout similar materials and mitigate discrepancies. Corn stover pellet (6.2% wet basis (w.b.) moisture) was used as the necessary reference material in specific energy calculation for the corn stover pellet (26% w.b.) and corn stover briquettes (Table 1). Similarly, corn stover bale (10% w.b.) was used as a reference for the other three corn stover bales with varying moisture contents (20–50% w.b.). Wood chips-50% were used as the reference for wood chips-12% and torrefied wood chips. Cattle feedlot compost was taken as the soil-surfaced feed pen, code HA-FB (Sweeten et al., 2006). Mass densities of Central Appalachian coal and North Dakota lignite were taken as the average values reported for bituminous coal and lignite, respectively (Engineering ToolBox, 2018).
2.2 Bulk density and specific energy calculations based on biomass moisture
Relevant biomass feedstock properties considered in this work, such as the bulk densities and specific energies at specific moisture contents, derived from published reports are presented in Table 1. Among the various biomass feedstocks, corn stover is one of the major feedstocks currently used for bio-based fuel production. Therefore, corn stover bales with different moisture contents were considered in the present study as different harvesting methods such as single- and multi-pass and wet and dry storage systems result in corn stover with moisture content in the range of 10–50% w.b. (Shinners et al., 2007). Furthermore, corn stover bales with moisture content in the range of 10–33% (w.b.) can be processed and used for pellet production (Tumuluru, 2023). In the case of pellets, two different types of pellets were considered: i) the conventional pelleting process produces pellets with a moisture content of about 6% w.b. (Tumuluru et al., 2010), whereas ii) the high-moisture pelleting process developed by the Idaho National Laboratory produces wood pellets with higher moisture content of typically approximately 26% w.b. before low-temperature drying (Tumuluru, 2016).
For some of the biomass feedstocks at several moisture contents, the material properties were calculated from the reported values by following the two steps: i) converting properties from the reference to bone dry moisture content (Eq. 1) and ii) obtaining the desired property through conversion from the bone dry to the desired moisture content (Eq. 2).
In such calculations, a simple linear variation of the properties with moisture was assumed without considering biomass’s volume swell/shrinkage due to moisture variation. The logic followed in the calculation was that the bone dry matter bulk density is considered directly proportional and the specific energy is considered inversely proportional to the dry matter component of biomass (1 − MCref) (Boundy et al., 2011) as expressed in the following relationship:
where BDdry is the bone dry bulk density (kg/m3), BDref is the reference bulk density (kg/m3), MCref is the reference moisture content (w.b., decimal), SEdry is the bone dry specific energy (MJ/kg), and SEref is the reference specific energy (MJ/kg). Then, these material properties at the required new moisture content using Eq. 1 are calculated as
where BDbio is the biomass feedstock bulk density at the new moisture content (kg/m3), MC is the new moisture content (w.b., decimal), and SEbio is the specific energy of the biomass feedstock at MC (MJ/kg). From Eq. 2, the effect of moisture content on biomass feedstocks can be observed as the higher moisture contents result in higher mass densities and lower specific energies.
Biomass feedstock properties (Table 1) remain unchanged for the calculations with each mode of transportation. For each biomass feedstock, the energy in the feedstock was compared to the energy of the conventional fuel required to transport the biomass feedstock. The BTD is unique for each biomass feedstock and must incorporate the volume and mass limitations, as outlined previously, for each mode of transportation. The energy content of the transported biomass feedstock is calculated as
where Ebio is the energy content of the biomass feedstock transported (MJ), V is the volume limit of the transportation mode (m3), and PL is the legal payload limit (kg). Eq. 3 appropriately selects the right quantity of biomass feedstock transported based on existing volume or mass limitations.
2.3 Derivation of BTDs for different transportation modes
The bulk densities and specific energies of the considered biomass feedstocks (BDbio and SEbio, respectively) and those of the transportation diesel fuel (BDf and SEf, respectively) were used to derive the energy required and BTDs of the selected modes of transport. Characteristic to the particular transport, different units were employed for the parameters (e.g., km/L for truck fuel consumption). Each mode of transport has a payload limit, and even though more mass can be transported in the available volume, this payload limit comes into effect based on the biomass feedstock transported. In this study, we have selected the truck and ship configurations that are commonly used for biomass transport. The focus of this research is to derive equations and understand BTD for various modes of transport. Although different units were employed for different parameters, the units of transport energy and BTDs were evaluated as “MJ” and “km,” respectively, for consistency. An alternative way of deriving the BTD, while showing the units, involved is presented in Supplementary Section S1.
2.3.1 Truck transport
Many types, makes, and models of tractor-drawn trucks are used to transport goods. In general, the road type, areas, and weather have a great impact on fuel economics. The study conducted by Anttila et al. (2022) evaluated fuel consumption and CO2 emissions for 13 typical log trucks under operating conditions in Finland. These authors modeled the effects of season, transportation distance, mass, vehicle and road properties, and weather conditions on fuel consumption. They found that the fuel consumption and emissions of 68,000–76,000-kg trucks were at the same level per ton-kilometer and concluded that the highest fuel consumption was measured in January and the lowest in July. In the present study, we have used trucks with specific dimensions that are very commonly used for the transportation of various goods and meet the US Department of Transportation (DOT) payload requirements (Truckers Report Jobs, 2018). While considering specific fuel consumption efficiency, the impact of road types, geographical locations, and weather on fuel consumption is not considered in this initial study.
We have, in this study, selected the truck and ship configurations that are commonly used for biomass feedstock transport. There are seven main types of trucks, namely, semi-trailers, flatbeds, step decks, dry vans, reefers, box trucks, and tankers, used for transporting different types of cargo (https://drstrucks.com/7-common-types-of-freight-trucks-what-they-haul/). Flatbeds are commonly used for transporting biomass bales, but trailers with hopper bottoms can also be used for biomass transport. In the case of densified biomass such as pellets, we expect that these hopper bottom trailers can be more efficient for transport and unloading.
In the present study, a common wedge trailer with dimensions similar to a flatbed trailer in length (1.46 m or 48 feet) with DOT payload limit was considered for analysis. For this analysis, the volume of a tractor-drawn truck was set at 101 m3. This is consistent with the average trailer dimensions for a 14.6-m wedge trailer (Mode Transportation, 2018). In the present study, we have assumed that the truck’s fuel consumption was 2.76 km/L when fully loaded with a maximum payload of 22,500 kg (Davis et al., 2014), where the gross vehicle weight is in the range of 14,969 to 36,287 kg. In general, a heavier truck encounters a greater rolling friction, but the truck is more profitable when cargo capacity is high; hence, the weight of the vehicle is critical. Franzese and Davidson (2011) investigated the relationship between the weight of the vehicle and the fuel efficiency and found that fuel efficiency decreases with an increase in the vehicle weight. For vehicle weight in the range of 9,072–22,680 kg, the fuel efficiency is approximately 4.04 km/L, whereas increasing the vehicle weight from 22,680 kg to 36,287 kg, the fuel efficiency decreases from 3.66 km/L to 3.36 km/L.
Therefore, in this study, the equipment weight of the trailer was assumed to be 13,787 kg, which makes the payload limit of 22,500 kg according to the US DOT limit of 36,287 kg combined weight for tractor-drawn trucks (Truckers Report Jobs, 2018). Using this information, the energy required for truck transport is derived as
where Etruck is the energy consumed in truck transportation using conventional fuel (MJ), D is the transported distance (km), SEf is the specific energy of the diesel fuel (MJ/kg), BDf is the bulk density of the diesel fuel (kg/m3), ηt is the fuel efficiency of the truck (km/L), and 1000 is the conversion factor involved in the fuel volume in L and m3 to have the Etruck unit as MJ.
Equating both the biomass feedstock and diesel fuel energies (Eqs 3, 4) and solving for D derive the BTD for truck transport of biomass feedstocks, BTDtruck (km), as
The payload limit (22,500 kg) is critical in road transport. The mass of material that can be fitted in the truck volume can easily exceed the payload limit. So most often the mass of material transported by the truck is restricted by this limit, which also makes the truck transport a “full-capacity” operation.
2.3.2 Rail transport
For rail transport, it was assumed that each railcar can carry 104,780 kg and has a volume capacity of 70.8 m3 (CFCL Co, 2018). The 2014 reported fuel efficiency of 186,284 kg km/L is used to calculate the diesel fuel consumption (CSX Corporation, 2018). This large value is a result of large quantities of freight moved over large distances, and rail transport is mass-limited. Rail transport can use as little as 5 gal/h and up to 200 gal/h depending on the grade they are traveling on, the weight of items being transported, wind speed and direction, and how many engines are being used to pull the load. The efficiency reported by Chessie Seaboard Consolidated (CSX) Corporation is given in units of kg km/L as the systemwide network distances and mass of material moved are available (CSX Corporation, 2018). The energy required for transporting biomass feedstocks using rail is expressed as
where Erail is the energy consumed in rail transport using conventional fuel (MJ) and ηr is the fuel efficiency of the rail transport (kg km/L). As done previously, equating the biomass feedstocks and rail energies (Eqs 3, 6) and solving for the distance D derive the BTD of rail transport of biomass feedstock, BTDrail (km), as
It should be noted that the BTD equation for rail transport does not have the same form as the BTD equation for truck and ship transport. The reason for this is the difference in the fuel efficiency of rail transport and its units (ηr).
The term “min (V ×BDbio, PL)” in the energy equation for rail transport (Eq. 6) will subsequently cancel out when Erail is substituted by equivalent energy of biomass feedstock transported by railcar Ebio, as shown in Eq. 3. Furthermore, ηr contains the mass component. The same treatment is not considered for truck transport in this work because i) the reported truck fuel efficiency is in the units of “km/L” and ii) the fluctuation in fuel efficiency for a semi-truck loaded with low-bulk-density material (e.g., corn stover bales at 10% w.b. with bulk density = 166 kg/m3) vs. high-bulk-density material (e.g., torrefied wood pellets with bulk density = 800 kg/m3) is negligible. It should be noted that railcars can carry a heavy load limit of 104,780 kg, based on the volume limitations and low bulk densities of materials, and the payload transported is always smaller than the mass-based load limit.
2.3.3 Ship transport
Ships were considered for transporting biomass feedstocks (bulk material transport) across the sea or along a coastline. The fuel efficiency and consumption of a ship depend on many stochastic variables that are impossible to state with exact precision. Such variables are wind speed, current flow, and parasitic drag, among others. Simplifying assumptions were made for this analysis that made the problem tractable; however, a more detailed future analysis can be very beneficial for a better understanding of the actual fuel usage for this mode of transportation.
In general, bulk products such as wood pellets from North America are transported to Europe using Panamax class ship (Portz, 2016). The ship has a fuel consumption (ηs) of 1,500 kg/h (36 t/d) at a vessel velocity of 27.78 km/h (15 knots) (Goulielmos, 2021). The study concluded that by increasing the speed of a Panamax ship from 11 to 15 knots (36.4% increase in speed), the fuel consumption has increased by 157% (from 14 to 36 t/d). According to the American Association of Port Authorities (AAPA, 2009), the physical dimensions of Panamax vessels are, in general, 294 m long, 32 m beam (vessel width that is critical to passing through the Panama Canal), and 12 m draft (vessel submerged depth).
According to the Soy Transportation Coalition (STC, 2023), the Panamax vessel has a deadweight of 55,000–80,000 metric tons, seven cargo holds, and each holds 300,000 bushels of soybean. However, the cargo intake of Panamax is usually restricted to 52,500 metric tons on the Panama Canal draft (Loyd’s Register, 2023). The bulk density of four cultivars of soybean ranged from 691 kg/m3 to 739 kg/m3, with a moisture content range of 0.12–0.32 (d.b.) (Hauth et al., 2018). From these data, the mass of soybean transported in the seven cargo holds is 57,152,550 kg (300,000 bushel/hold × 27.2155 kg/bushel × 7 holds), and the range of volume available to transport the bulk material of equivalent mass, based on soybean bulk densities range (Hauth et al., 2018), is 77,338–82,710 m3, with an average volume of 80,024 m3. However, based simply on the physical dimensions of the vessel (AAPA, 2009), the vessel volume is 121,896 m3, and the cargo volume available for transporting bulk material should be less. This is to accommodate the vessel’s structural and functional components, members, fuel storage, and other crew amenities.
In this study, this Panamax class ship was considered for the bulk transport of selected biomass feedstock’s BTD calculation with the aforementioned data.
where Eship is the energy consumed in ship transportation using conventional fuel (MJ), ηs is the fuel consumption of the ship (kg/h), and v is the velocity of ship transport (km/h). Similarly, using the component equations (Eqs 3, 8) and solving for the BTD of ship transport, BTDship (km) is evaluated as
It should be noted that ships have large volumes, but with an allowed payload limit of 67.5 × 10⁶ kg, several materials could exceed this limit, and more often this payload limit will become the allowable mass transported. This also means that ships and trucks are most often operated at full payload capacities, unlike railcars.
2.4 Fuel efficiency data
The fuel efficiency and consumption values considered for each mode of transportation in the analysis along with their sources are provided in Table 2. The fuel efficiency data taken in the study incorporate the vehicle weight, air drag, and rolling friction for trucks and rails, or skin friction for ship transport. The rolling friction between asphalt and rubber was significantly higher than that for steel on steel; thus, rail transport gained efficiency by lower steady-state resistances and not stopping for long stretches. Larger rail freight capacities operate for a much longer stretch without stopping, improving fuel efficiency and making the rail transport of the cargo more efficient. These factors were considered when taking the fuel consumption of the transportation modes tested in this study.
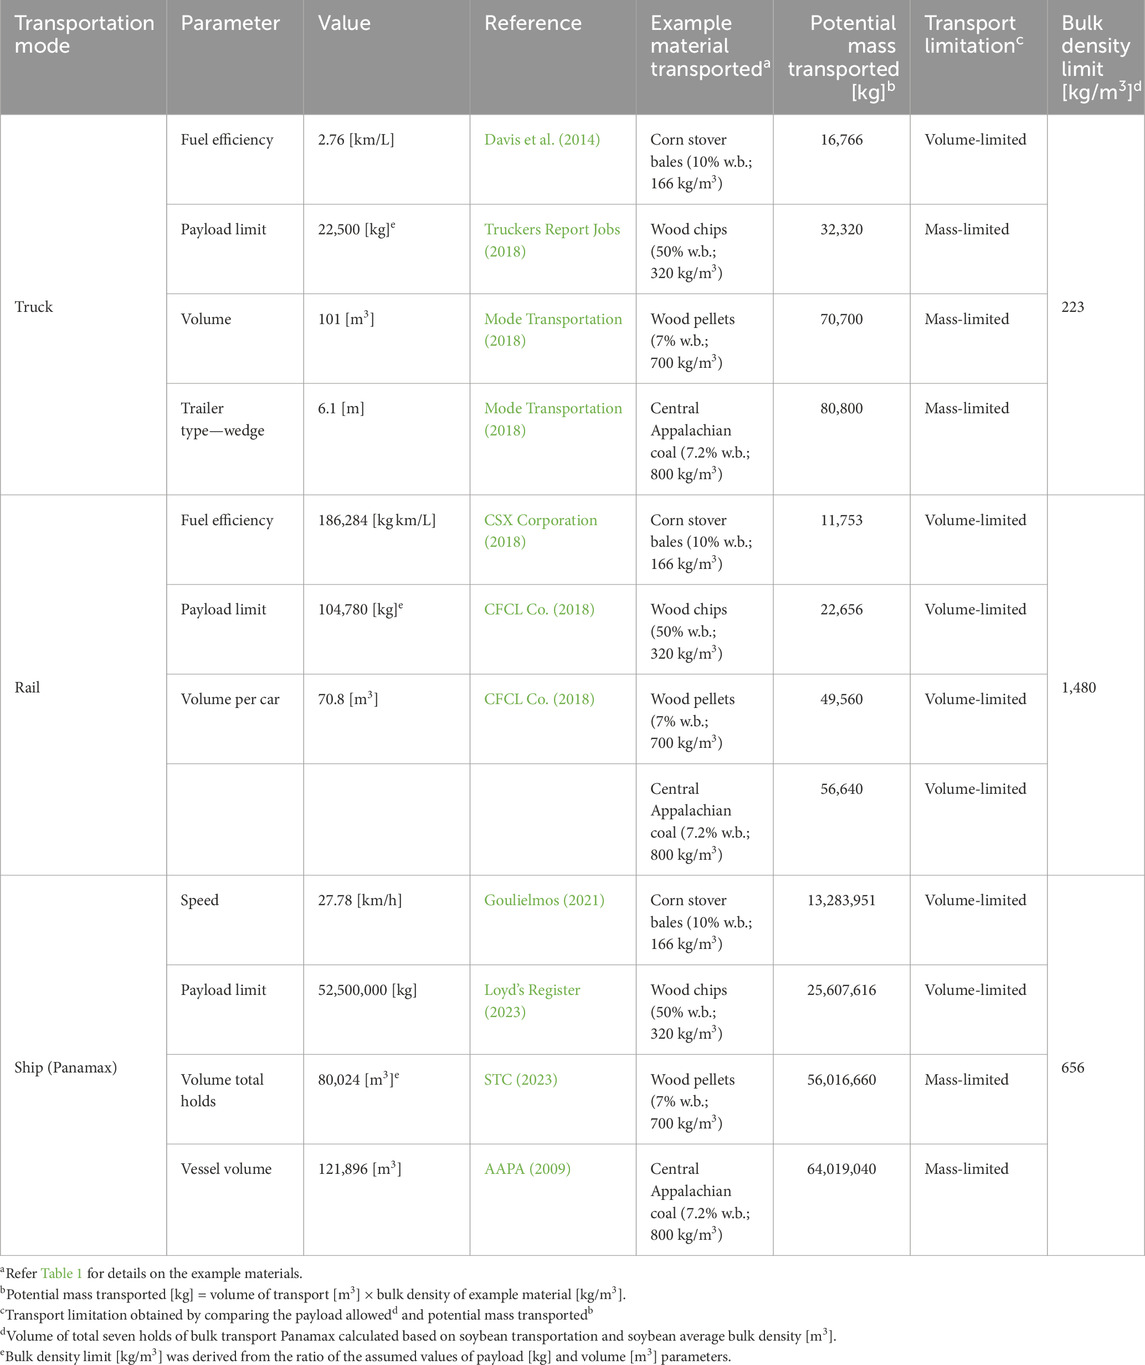
Table 2. Assumptions for each mode of transportation considered in this study and transport limitations for selected feedstocks.
2.5 Limiting transportation factors
The common modes of biomass feedstock transport are ship, train, truck, barge, ocean carrier, or a combination of various transportation modes. For example, when transporting biomass feedstocks over land, railroads tend to offer a lower cost per ton-mile, can handle large volumes, and can be the most environmentally responsible transportation mode. Exporting biomass feedstocks requires more than one shipping mode. Oftentimes, railroads will ship these products to ports where they are loaded onto ocean carriers for transport overseas. For example, wood pellets from the production site are transported to shipping terminals by rail and further transported to various domestic and international markets by ships (Searcy et al., 2014). The location of the biorefinery has a great impact on the supply chain logistics. Some of the biorefineries that use agricultural residues which are low in bulk density and specific energy are close to biomass production areas to reduce transportation costs, whereas some of the biomass feedstocks such as pellets which are high in bulk density and specific energy are not close to biomass production areas, but the higher bulk density and specific energy make them economical to transport to longer distances by truck, ship, or rail.
Volume and mass legal restrictions influence the transportation logistics. When the available transport volume is completely filled with feedstock and the weight limit has been reached or exceeded, then the transportation is said to be mass-limited, and the mass transported must be reduced. Conversely, when the available transport volume is completely filled with feedstock and the mass limit has not been exceeded, then the transportation is volume-limited as there is no room for more material despite the payload limit allowing to carry more. Therefore, in general, mass-limited transport (fully utilized) has greater potential for payload transfer, as it utilizes the maximum allowed payload, than volume-limited transport (underutilized).
The type of transport limitation is predominantly influenced by the bulk density of the transported material because the volume available and the allowed payloads are typically fixed for each type of transport. Thus, any biomass feedstock bulk density smaller than these limits will make the transport volume-limited and greater than these limits will make it mass-limited. It can be seen that a transport mode can be both mass- and volume-limited based on the biomass feedstocks transported, as illustrated by truck and ship modes presented in Table 2. The derived “bulk density limit” of the material transported from the payload allowed and volume data available as 223, 1,480, and 656 kg/m3 for truck, rail, and ship, respectively, can be used to readily identify the type of transport limitations given the bulk density of a biomass feedstock. Therefore, based on the rail bulk density limit of 1,480 kg/m3, which is greater than any biomass feedstock’s bulk density (Table 1), the rail transport will always be volume-limited (underutilized), while the truck and ship will be mass-limited for biomass feedstocks having moderate or higher densities (e.g., ≤410 kg/m3).
3 Results and discussion
3.1 Evaluated BTDs for the three modes of transportation
From the evaluated BTDs using Eqs 5, 7, 9 (example BTD calculations are shown in Supplementary Section S2), the ship was by far the most energy-efficient, despite being mass-limited for dense biomass feedstocks, with the largest BTDs (approximately two orders of magnitude difference) among transportation modes considered (Figure 1). This might be counterintuitive due to the large size of cargo used in ship transport (Table 3). The energy efficiency of ship transport was due to the freight capacity and the extended time taken for the trip. Ship transport takes significantly longer time than truck or rail, during which biomass feedstocks may degrade, and this time effect was not considered in the analysis. The results also show that rail transport was more efficient than trucks from the BTD standpoint.
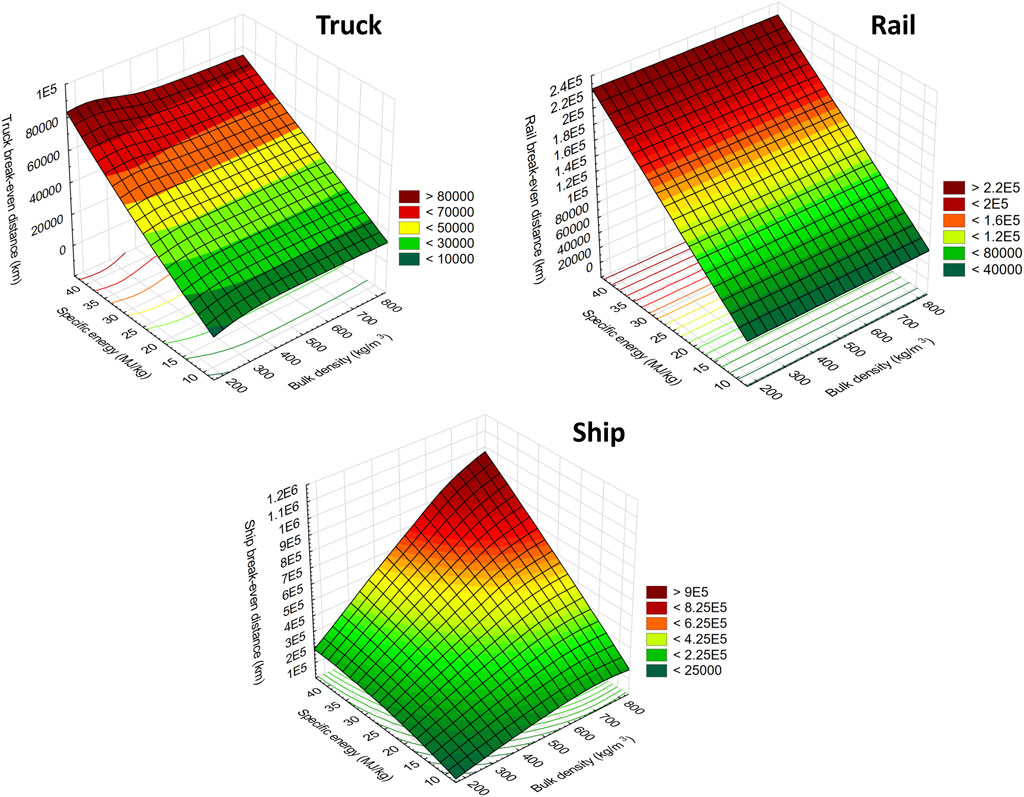
Figure 1. Overall trend of BTDs of biomass feedstocks and fossil fuels tested as a function of specific energy and bulk densities for all three modes of transportation. Note that the scales of y-axis are different.
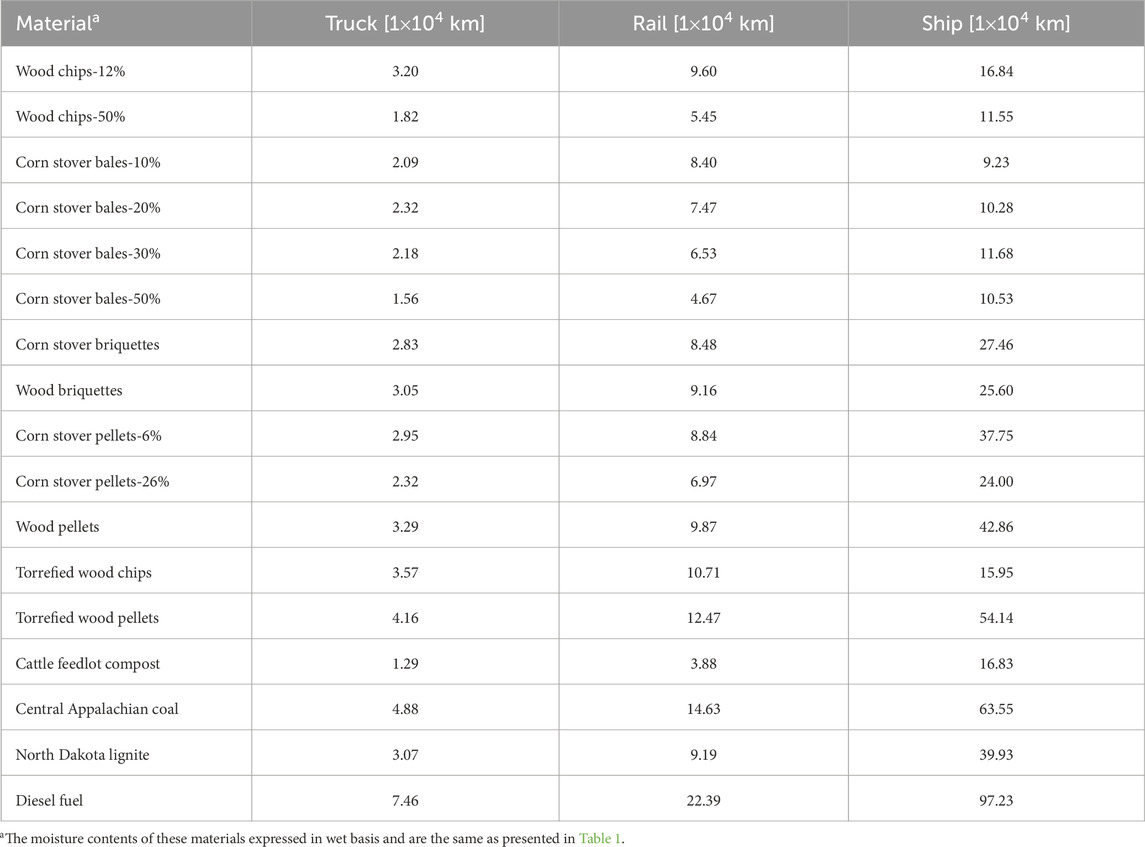
Table 3. BTDs of the bio-based and fossil fuels tested for each mode of transportation at their reference capacity limits and moisture contentsa.
Biomass feedstock properties, such as specific energy and bulk density, affect the BTD to a varying extent (Figure 1). Among all the transportation modes, the specific energy showed the obvious trend of direct variation with the BTD. However, the increased bulk density of the biomass feedstocks only contributed positively to the BTD in the initial range for truck (approximately ≤223 kg/m3) and ship (approximately ≤656 kg/m3) as these transports are both mass- and volume-limited depending on the bulk density of the biomass feedstock being transported. Rail transport, however, being only volume-limited, the BTD is not affected by bulk densities (Figure 1). This can also be seen from the unit of “kg km/L” for rail transport efficiency. The figure for rail transport shows no dependence on bulk density for BTD. This goes back to the explanation given previously that the BTD for rail transport does not depend on payload mass due to the mass being included in the efficiency term. Based on Eq. 7, only specific energy will affect the BTD for rail transport.
3.2 Bulk density and specific energy impact on BTD
The surface plot of bulk density to specific energy and its impact on the BTD of the truck indicated that with an increase in the bulk density of the biomass feedstock up to 300 kg/m3, the BTD is higher, whereas further increasing the bulk density does not affect the BTD. On the other hand, increasing the specific energy increases the BTD at different bulk densities of the biomass feedstocks. In the case of rail transport, which is volume-limited, the bulk density does not impact the BTD, but the specific energy significantly impacts the BTD. The results for ship transport indicated that both bulk densities and specific energies significantly impact the BTD of biomass feedstocks, where increased bulk densities and specific energy increased the BTD transportation of the material.
The BTD profiles and patterns of the different biomass feedstocks and fossil fuels in the three modes of transportation show that truck and rail BTD profiles were similar, but these were different from the BTD profiles for ship, as shown in Figure 2. These BTD profiles clearly show the scale (how the three transportation modes compare among themselves—showing the dominance of ship) and the pattern (how studied biomass feedstocks compare with others—similarity between truck and rail) with each transportation mode.
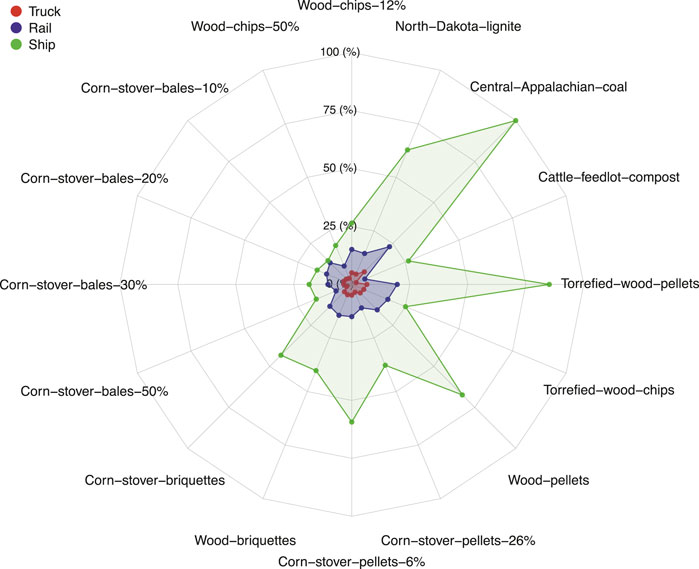
Figure 2. BTD (km) profiles of various biomass feedstocks and fossil fuels showing the scale and pattern among the modes of transportation. The numbers after the biomass feedstocks indicate moisture content in % w.b. In the scale, 100% corresponds to the maximum distance of 63.6 × 10⁴ km, and 25% corresponds to 15.9 × 10⁴ km.
On average, the rail can transport approximately 3 times farther and the ship can transport approximately 10 times farther than the truck. Compared to trucks, the larger rail freight capacities and their operation for a much longer stretch without stopping contribute to their efficiency. Given that the “start-up” after each “stop” was the most energy-intensive part of any transport and building momentum also consumed energy, rail transport reduced these energy losses better than trucks. However, maintaining momentum was much less energy-intensive and only involved overcoming the steady-state resistances. These include air drag and rolling friction for trucks and rails, or skin friction for ship transport. It follows the intuition that rolling friction between asphalt and rubber was significantly higher than that for steel on steel; thus, rail transport gained efficiency by lower steady-state resistances and not stopping for long stretches.
Given the results and overall ranking of the BTD of different biomass feedstocks and their properties (Figure 2; Table 2), the efficient transportation between the start and end destinations should be a combination of modes of transportation based on feasibility (geographical and existing transportation network). It makes sense that rail transport is not ideal for only a few miles of transport. It should be realized that with the ship, and sometimes with the rails, truck transport may be added to deliver the biomass feedstocks to the biorefinery. Future analysis is needed to optimize the transportation methods by integrating the three modes of transportation based on their availability and the distance the biomass feedstocks is transported involving the existing transportation network.
3.3 Moisture impact on BTD
In order to quantify the effect of changing moisture of biomass feedstocks on the BTDs (Figure 3), the case of corn stover bales between 10% and 50% w.b. moisture contents was considered (Table 1). The corn stover bales data were further analyzed to understand the impact of moisture on BTD using trucks, rail, and ships. Figure 3 shows how the BTD changes with the moisture content for the corn stover bales in the moisture content range of 10–50% w.b. The changes in the bulk density (BDbio) and specific energy (SEbio) in the corn stover bales were calculated based on Eqs 1, 2. These equations calculate the bulk density and specific energy based on simple linear variation with respect to moisture content but do not consider the biomass’s volume swell/shrinkage due to moisture variation. It is clear from Table 1 that the bulk density of the corn stover biomass increases with an increase in the moisture content, whereas the specific energy decreases. These changes in the bulk density and specific energy with moisture (considered in the calculation) have impacted the BTD of the corn stover bales (Figure 3).
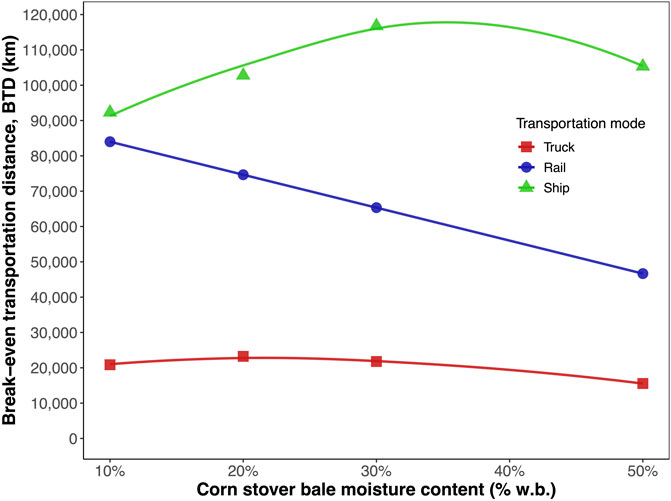
Figure 3. Effect of the moisture content of corn stover bales on BTD of different modes of transportation.
From the results, it is very clear that for the ship, which is volume-limited, the BTD increases with an increase in the moisture content of up to 30% w.b. (an increase of approximately 26%), whereas further increasing the corn stover bale moisture content to 50% w.b. decreases the BTD values (a decrease of approximately 9.8% from the moisture content of 30–50% w.b.). Regarding rail, which is volume-limited, the BTD decreases by approximately 45% with an increase in the corn stover bale moisture content from 10 to 50% w.b. For truck transportation, which is mass-limited, the increase in the corn stover bale moisture content from 10 to 40% w.b. increases the BTD values from 20,866 to 21,780 km (4.3% increase), and further increasing the corn stover bale moisture content to 50% w.b. decreases the BTD values to approximately 15,556 km [a decrease of approximately 28% compared to BTD values at 10% w.b. moisture content]. The BTD data calculated with respect to moisture should be further cross-validated with the actual bulk and specific energy of the corn stover bales at different moisture contents.
Since trucks and ships were influenced by both mass and volume limitations, with moisture content affecting these, an optimum moisture content might exist for efficient biomass feedstock transport. For these modes with corn stover, when the moisture is too low, the transport is volume-limited, and the total material transported is lower than the full payload capacity. When the moisture is too high, the transport is mass-limited for truck and ship transport, where the material transported is lower than the full volume capacity of the transportation mode. Overall, efficient transportation occurs when the mass- and volume-limited transportation modes coincide, maximizing the amount of material that is being transported.
Rail transport is impacted by moisture due to the inclusion of mass in the efficiency (units: kg km/L) as high moisture increases the overall mass and reduces the net dry matter transported and the biomass feedstock energy content. Thus, the rail transport being volume-limited, a specified volume of biomass feedstock will represent a certain mass and its corresponding BTD, based on the nature of the biomass feedstock, irrespective of the bulk density. By increasing the moisture of the biomass feedstock, the specific energy (SEbio) is reduced (Table 1), which eventually reduces the fuel efficiency of rail transport (ηr). According to Eq. 7, the BTD or rail decreases linearly with decreased rail transport efficiency.
As observed with corn stover bales (Figure 3), similar results for other biomass feedstocks with moisture variation can be expected. The corn stover bale moisture content and BTD were further modeled, which can help predict the BTD values of corn stover bales in the moisture content range of 10–50% w.b. The fitted polynomial models (Table 4) have adequately described (R2 ≥ 0.92) the BTD with the three transportation modes as a function of moisture content. These models can be useful in calculating the BTD of the corn stover, most abundant agricultural feedstock, at commonly occurring moisture contents of this feedstock.
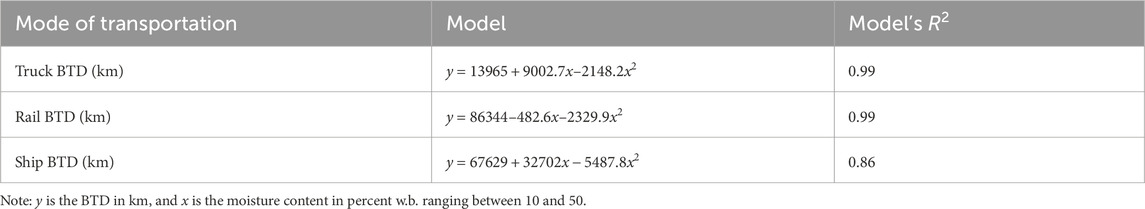
Table 4. Models for BTD for corn stover bales with varying moisture contents.
3.4 Limiting transportation factors
The limiting factors for each combination of moisture, biomass feedstock, and transportation method influence the logistics decision (Figure 4). For example, corn stover bales are volume-limited for moisture contents less than 20% w.b., whereas above this moisture content for truck transport, the transportation is mass-limited. Torrefied wood chips, however, are mass-limited for truck transport and volume-limited for ship and rail transport. All feedstocks considered were volume-limited for rail transport. This was because of the large payload limits on railcars. In the case of commercial wood pellets and torrefied wood pellets, both the truck and ship are mass-limited, whereas the rail is volume-limited. Fossil fuels such as different coals (Central Appalachian coal and North Dakota lignite) and diesel fuel also have similar trends like commercial and torrefied wood pellets. For instance, a railcar can carry materials with a bulk density of up to approximately 1,500 kg/m3, and no biomass feedstocks will reach this density and thus represent the underutilization of rail transport. For volume-limited transport, any pretreatment (e.g., torrefaction) resulting in higher densities will increase the BTD, representing a logistic opportunity. The underutilized transportation space needs to be optimized for better logistics advantage.
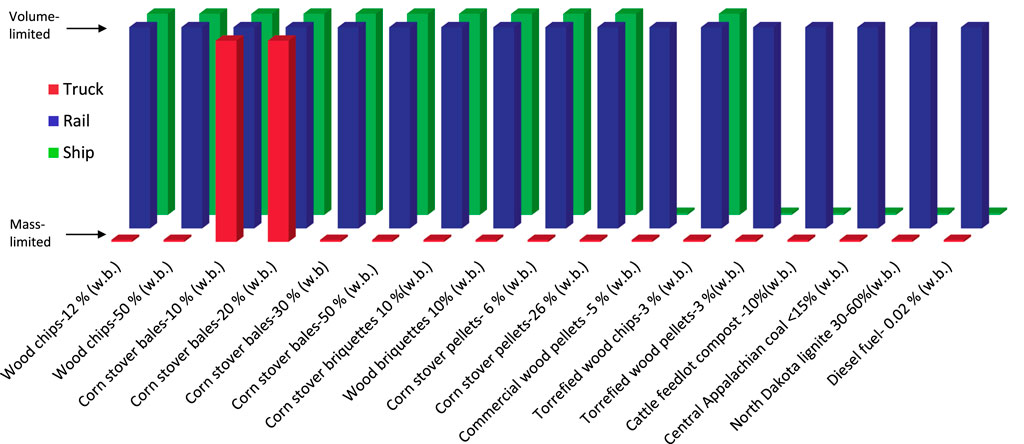
Figure 4. Mass-limited or volume-limited transport for the combinations of biomass feedstocks and fossil fuels and transportation modes. Lowered bars/tiles are mass-limited, and tall bars are volume-limited.
3.5 Truck transport analysis of the biomass feedstocks in the US
Biomass feedstock is typically grown in regions with low population densities. These regions can be far from the refineries or power plants. A comparison of the BTDs of truck transport for a truck filled to its allowable limit using various biomass feedstocks within the perimeter of the US was performed. This analysis was useful for understanding the feasibility of transporting various biomass feedstocks to the stakeholder’s processing facility locally within a state or transported interstate (Figure 5). For this analysis, the US perimeter was considered 14,452 km (Beaver, 2018), which is the approximate coastline of the 48 contiguous US states excluding Alaska and Hawaii. The results present the BTD pattern for 1 US ton as well as a whole truckload of bio-based fuels considered in terms of direct distance (km) and US perimeter to allow for easy unit mass (1 US ton and whole truckload) comparison. Interestingly, the BTD pattern was different for cases of the volume-limited biomass feedstocks, such as corn stover bales-10% w.b. and -20% w.b. (low bulk density materials), compared to a similar pattern (Figure 5) otherwise for mass-limited transport.
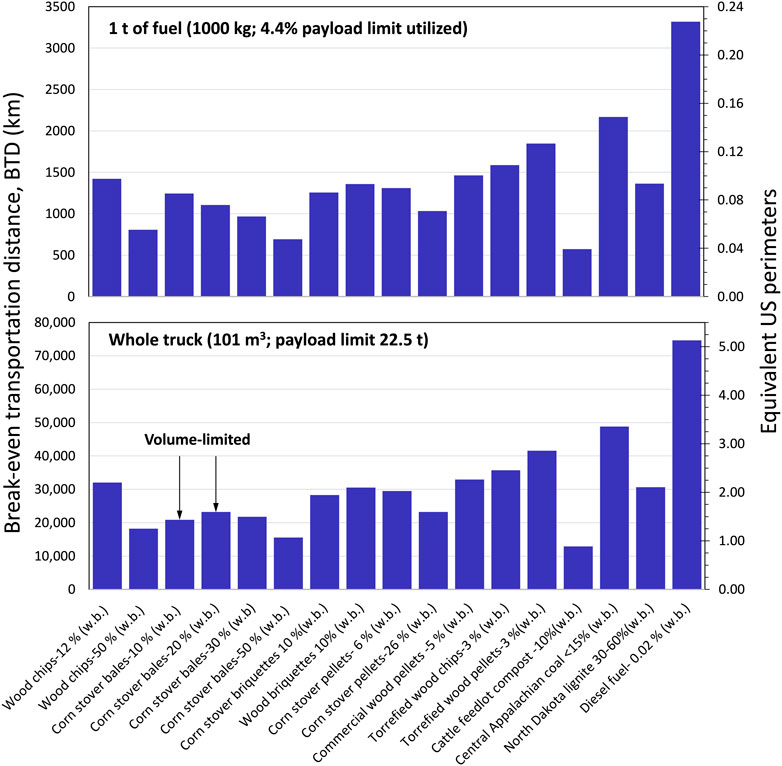
Figure 5. BTDs for transporting biomass feedstocks and fossil fuels with trucks, both for 1 metric ton of biomass feedstock and diesel and for whole truck transport. Changes in profile shapes are marked with an arrow due to volume-limited transportation.
Among the biomass feedstocks considered, the torrefied pellets had the highest BTD and therefore can be transported around the US perimeter the most, namely, 2.88 times. This was mainly due to the relatively high specific energy and high bulk density of torrefied pellets. As bales, pellets, and briquettes have nearly the same specific energies, the driving factor in their comparison was the bulk density. Feedlot compost has the lowest specific energy and was mass-limited for trucks as shown previously (Figure 4). Even with these considerations, feedlot compost can be transported approximately 0.9 times around the US perimeter before reaching its BTD. This means that the feedlot compost originating in the Central US can be transported anywhere in the US and still have a net calorific value.
Overall, for the biomass feedstocks considered (14), excluding coal, the equivalent US perimeter transport distance varies from 0.9 to 2.88 times (Figure 5). This conceptual result also demonstrates that interstate biomass feedstock transport is highly practical based on the BTDs as interstate distances are significantly lower than the US perimeter. Thus, biomass-derived bio-based fuels in loose and all densified forms considered could be transported practically to all 48 contiguous US states. Furthermore, the location of biorefineries can be optimized to minimize the hauling distances, resulting in increased net energy in logistics. Regardless of the location of the biorefinery, interstate truck transport, as a single mode of transportation based on net energy in the biomass feedstock, was found not to be a limiting factor.
In the present study, the estimated BTDs presented for various biomass feedstocks and fossil fuels were based on inroad transportation logistics only. The inclusion of other energies of related biomass harvesting, preprocessing, and pretreatments like baling, densification, torrefaction, storage, handling, and biofuel conversion will make the analysis more comprehensive and reflective of the whole supply chain. The results of the present study may not provide rational upper bounds on the distances that biomass feedstocks may be economically transported; however, these data should help in making informed decisions as transportation economics are directly influenced by BTDs. In addition, the results should help identify limitations on biomass feedstock transport, leading to biomass utilization feasibility.
Based on this research, it can be concluded that each biomass feedstock has an optimum bulk density for transportation. If the biomass feedstock is dried too much (less bulk density), the transportation is volume-limited, and when the material is too wet (higher bulk density), the transportation is mass-limited. Mass-limited transportation, satisfying the payload limitation, is the most efficient mode. Therefore, the material should be processed (e.g., densification) so as to make the transportation mass-limited, whereas the volume-limited transportation represents underutilization of the allowable payload. Thoreson et al. (2014) suggested that bulk densities of approximately 270–370 kg/m3 are necessary to fill the truck full to its load capacity. The conventional pelleting process which produces pellets with densities of approximately 650–700 kg/m3 may not be the right technology to transport pelleted biomass using trucks. Although it reduces the transportation cost, it may not offset the pelleting costs incurred during the conventional pelleting process (Schill, 2014).
To overcome these limitations, novel energy-efficient biomass preprocessing and pretreatment technologies should be developed to reduce the preprocessing cost and make transportation more energy-efficient. Tumuluru (2023) recently tested high-moisture pelleting at pilot and commercial scales on corn stover bales and found that the process reduces the pelleting production energy by approximately 70% compared to conventional technology followed by the industry but can help produce pellets which can meet the transportation requirements by trucks. This will coincide with the concept of minimum energy required to dry the material in preparation for transport. Furthermore, the thermal pretreatment technologies, such as torrefaction, pyrolysis, and gasification, which make bio-based fuels high in specific energy, can help improve transportation efficiencies. Future research should consider the optimum moisture and density the raw biomass material should have and incorporate factors such as material degradation and storage time requirements.
Knowledge and understanding of the transportation BTD of various biomass feedstocks help plan the layout of the biorefineries to increase sustainability and optimize the cost of transportation during their design phase. The BTD analysis provided in this paper can help the policymakers understand how the energy content in the biomass and transportation BTD calculation can be factored into the net-zero emissions in the complete supply chain analysis. The BTD of various biomass feedstocks can help plan the carbon debt that can be incurred by the transportation of biomass-based material from managed forests, cropland, and other preprocessing satellite locations.
3.6 Future research opportunities
To make better sense of the truck-based BTD results, they have to be overlaid on the existing road network, and this may constitute another practical future study. Likewise, rail transport should be evaluated on the existing railway infrastructure. Combining modes of transportation will provide a more accurate transportation profile that can then be optimized. Future studies should include the energy required for preparing the biomass materials, including processes such as harvesting, drying, chipping, grinding, densification, torrefaction, and other preprocessing and pretreatment technologies that are used to make the biomass into a ready-to-convert feedstock for bio-based fuels and biopower generation. Future studies on BTD calculations should also be focused on the material losses due to material degradation, and combining the different modes of transport can help maximize the distance transported with minimum energy. Furthermore, the impact of fuel efficiency of trucks as well as specific road conditions, weather, and truck size should be evaluated in the future. Studies related to how trucks and ships with varying sizes and efficiencies impact the BTD can be part of future studies.
In this initial study, we have designed the framework for understanding the transportation BTD of various biomass feedstocks. It is believed that the introduction of the concept and understanding of BTD, developed in this study, serves the purpose of the initial outcome. Future analysis should include how biomass preprocessing and pretreatment technologies impact the transportation BTD and sensitivity analysis of significantly influencing factors. Regarding truck transport, specific types of trucks (semi-trailers, flatbeds, step decks, dry vans, reefers, box trucks, and tankers) will be best suited to a specific type of biomass feedstock (e.g., loose crop residues, wood chips vs. densified pellets, and briquettes), and a more complete analysis of the combinations of truck and biomass feedstock types should be considered for future research. Another aspect of practical interest is the economics component; similar to BTD, a break-even cost can be derived for the different biomass feedstocks. Such a logistical economic analysis will eventually influence the decision on the biomass feedstock selection, and the mode of transport should be considered for future research. A full-scale sensitivity analysis that incorporates inter-variable dependence, such as fuel properties and fuel efficiency, needs to be performed to understand the sensitivity of the various factors influencing the BTDs of various biomass feedstocks.
4 Conclusion
The BTDs of 14 biomass feedstocks and three fossil fuels, the distance at which the energy in these bio-based fuels equals the energy in the conventional fuel used for transportation, were evaluated for various modes of transport (truck, rail, and ship). The various biomass feedstock properties (bulk density and specific energy) and transporting parameters (fuel efficiency, payload limits, volume, and velocity of transport) affected the BTD of the biomass feedstocks and fossil fuels tested. Overall, the mass-limited transportation is more efficient than the volume-limited mode. From the fuel efficiency and the cargo volume available, the biomass feedstocks’ bulk density limits from which the transportation becomes efficient mass-limited are 223, 1,480, and 656 kg/m3 for truck, rail, and ship, respectively. The torrefied wood pellets and the Central Appalachian coal in solid fossil fuels had the highest BTDs, whereas feedlot compost and corn stover bales with 50% w.b. had the least BTDs for all modes of transportation. The results indicated high bulk density and specific energy of biomass feedstocks, as well as low moisture content, increased the BTD values. Polynomial models for corn stover (most abundant agricultural feedstock) bales have adequately described (0.86 ≤ R2 ≤ 0.99) the BTD as a function of moisture content (10–50% w.b.) for all three modes of transportation.
Ranking of the different transportation modes based on their BTDs indicated that truck was the least efficient, followed by rail, and ship was the most efficient mode of transportation. On average, the rail gives 3.1 times and ship gives 8.4 times the BTD with respect to the least efficient truck for values were 3.1 and 9.2 for all the biomass feedstocks including the three fossil fuels. The US perimeter-based logistical results indicate that interstate transport of various biomass feedstocks was highly viable based on BTDs as the energy available in a truckload of feedstock was sufficient to go around the perimeter of the US for approximately 0.9–2.88 times for different biomass feedstocks studied. Future studies might look into the effects of overlaying the road network, road conditions, weather, varying truck or ship sizes, material degradation, preprocessing energy, impact of pretreatment technologies, optimum moisture, and sensitivity analysis on fuel efficiency as well as economic considerations in the BTD analysis.
Data availability statement
The original contributions presented in the study are included in the article/Supplementary Material; further inquiries can be directed to the corresponding author.
Author contributions
JT: conceptualization, data curation, formal analysis, funding acquisition, investigation, methodology, resources, validation, visualization, writing–original draft, and writing–review and editing. CI: conceptualization, funding acquisition, methodology, project administration, resources, supervision, writing–original draft, and writing–review and editing. DA: conceptualization, funding acquisition, methodology, resources, and writing–review and editing. RM: formal analysis, methodology, writing–original draft, and writing–review and editing.
Funding
The author(s) declare that financial support was received for the research, authorship, and/or publication of this article. This work was supported by the Department of Energy, Office of Energy Efficiency and Renewable Energy, under the Department of Energy Idaho Operations Office Contract DE-AC07-05ID14517, and the USDA National Institute of Food and Agriculture, under Hatch Project ND01493. This research was a contribution from the Long-Term Agroecosystem Research (LTAR) network, and LTAR is supported by the United States Department of Agriculture, under Fund No. FAR0036174.
Conflict of interest
The authors declare that the research was conducted in the absence of any commercial or financial relationships that could be construed as a potential conflict of interest.
Publisher’s note
All claims expressed in this article are solely those of the authors and do not necessarily represent those of their affiliated organizations, or those of the publisher, the editors, and the reviewers. Any product that may be evaluated in this article, or claim that may be made by its manufacturer, is not guaranteed or endorsed by the publisher.
Author disclaimer
Mention of trade names or commercial products in this publication is solely for the purpose of providing specific information and does not imply recommendation or endorsement by the US Department of Agriculture and NDSU. USDA and NDSU are equal opportunity providers and employers. This work was prepared as an account of work sponsored by an agency of the US government. Neither the US government nor any agency thereof, nor any of their employees, nor any of their contractors, subcontractors, or their employees, makes any warranty, express or implied, or assumes any legal liability or responsibility for the accuracy, completeness, or usefulness of any information, apparatus, product, or process disclosed, or represents that its use would not infringe privately owned rights. References herein to any specific commercial product, process, or service by trade name, trademark, manufacturer, or otherwise, do not necessarily constitute or imply its endorsement, recommendation, or favoring by the US government or any agency thereof, or its contractors or subcontractors. The views and opinions of authors expressed herein do not necessarily state or reflect those of the US government or any agency thereof. Accordingly, the publisher, by accepting the article for publication, acknowledges that the US government retains a non-exclusive, paid-up, irrevocable, worldwide license to publish or reproduce the published form of this manuscript or allows others to do so for US government purposes.
Supplementary material
The Supplementary Material for this article can be found online at: https://www.frontiersin.org/articles/10.3389/fenrg.2024.1347581/full#supplementary-material
References
AAPA (2009). American association of port Authorities. Comparison between Panamax and post-panamax container vessels. Alexandria: Institute for Trade and Transportation Studies.
Allen, M., Dube, O., Solecki, W., Aragón-Durand, F., Cramer, W., Humphreys, S., et al. (2018). Framing and context. Cambridge, UK and New York, NY, USA: Cambridge University Press, 49–92. chap. Global Warming of 1.5 °C. An IPCC Special Report on the impacts of global warming of 1.5 °C above pre-industrial levels and related global greenhouse gas emission pathways, in the context of strengthening the global response to the threat of climate change, sustainable development, and efforts to eradicate poverty. doi:10.1017/9781009157940.003
Anttila, P., Nummelin, T., Väätäinen, K., Laitila, J., Ala-Ilomäki, J., and Kilpeläinen, A. (2022). Effect of vehicle properties and driving environment on fuel consumption and CO2 emissions of timber trucking based on data from fleet management system. Transp. Res. Interdiscip. Perspect. 15, 100671. doi:10.1016/j.trip.2022.100671
Beaver, J. (2018). U.S. International boarders: brief facts. Available at: https://www.ilw.com/immigrationdaily/news/2007,1115-crs.pdf.
Boundy, B., Diegel, S., Wright, L., and Davis, S. (2011). Biomass energy data book. 4th edn. United States: U.S. Department of Energy.
Bradley, D., Hektor, B., Wild, M., Deutmeyer, M., Schouwenberg, P. P., Hess, J. R., et al. (2014). “Low cost, long distance biomass supply chains,” in IEA bioenergy task 40. Editors C. S. Goh, and M. Junginger
CFCL Co (2018). CFCL Co., Chicago Freight car leasing Co. Railcar types. Available at: http://www.crdx.com/Services/OpenTop.
CSX Corporation (2018). CSX Corporation. Fuel efficiency. Available at: https://www.csx.com/index.cfm/about-us/the-csx-advantage/fuel-efficiency/.
Davis, S., Diegel, S., Boundy, R., and Moore, S. (2014). TruckEfficiency 2014 vehicle technologies market report. Oak Ridge, TN, USA: Oak Ridge National Laboratory.
DieselNet (2018). DieselNet. Available at: https://www.dieselnet.com/standards/eu/fuel_reference.php.
Engineering ToolBox (2018). The engineering ToolBox. URL: http://www.engineeringtoolbox.com/classification-coal-d_164.html.
FCCC (2015). United Nations framework convention on climate change, Paris, France, 30. Available at: http://unfccc.int/resource/docs/2015/cop21/eng/l09.pdf.
Franzese, O., and Davidson, D. (2011). Effect of weight and roadway grade on the fuel economy of class-8 freight trucks. Tennessee, USA: Oak Ridge National Laboratory.
Goulielmos, A. M. (2021). When in shipping, do as greeks do: for a successful creation and management of a shipping company dealing with tankers and/or bulk carriers. Mod. Econ. 12, 1537–1562. doi:10.4236/me.2021.1210078
Hauth, M. R., Botelho, F. M., Hoscher, R. H., Botelho, S. d. C., and de Oliveira, G. H. (2018). Physical properties of different soybean cultivars during drying. Eng. Agrícola 38, 590–598. doi:10.1590/1809-4430-eng.agric.v38n4p590-598/2018
Loyd’s Register (2023). Loyd’s Register. InfoSheet No. 30. Modern ship size definitions. London, UK: Information Centre.
Lu, C., and Yan, X. (2015). The break-even distance of road and inland waterway freight transportation systems. Marit. Econ. Logist. 17, 246–263. doi:10.1057/mel.2014.14
Mahmudi, H., and Flynn, P. (2006). Rail vs truck transport of biomass. Appl. Biochem. Biotechnol. 129, 88–103. doi:10.1385/abab:129:1:88
Mani, S., Tabil, L., and Sokhansanj, S. (2004). Grinding performance and physical properties of wheat and barley straws, corn stover and switchgrass. Biomass Bioenergy 27, 339–352. doi:10.1016/j.biombioe.2004.03.007
Mode Transportation (2018). Mode transportation. Available at: http://www.jillamy.com/pdfs/Truck_Sizes_LTL.pdf.
Perlack, R., Eaton, L., Turhollow, A., Langholtz, M., Brandt, C., Downing, M., et al. (2011). US billion-ton update: biomass supply for a bioenergy and bioproducts industry.
Picchio, R., Di Marzio, N., Cozzolino, L., Venanzi, R., Stefanoni, W., Bianchini, L., et al. (2023). Pellet production from pruning and alternative forest biomass: a review of the most recent research findings. Materials 16, 4689. doi:10.3390/ma16134689
Pradhan, P., Arora, A., and Mahajani, S. M. (2018). Pilot scale evaluation of fuel pellets production from garden waste biomass. Energy Sustain. Dev. 43, 1–14. doi:10.1016/j.esd.2017.11.005
Schill, S. R. (2014). Ethanol Producer Magazine, BBI International. Available at: https://ethanolproducer.com/articles/stover-pellets-pack-in-the-pounds-11434.
Searcy, E., Hess, J. R., Tumuluru, J., Ovard, L., Muth, D. J., Trømborg, E., et al. (2014). “Optimization of biomass transport and logistics” in International Bioenergy Trade. Lecture Notes in Energy. Editors M. Junginger, C. Goh, and A. Faaij (Dordrecht: Springer) 17. doi:10.1007/978-94-007-6982-3_5
Shinners, K. J., Binversie, B. N., Muck, R. E., and Weimer, P. J. (2007). Comparison of wet and dry corn stover harvest and storage. Biomass Bioenergy 31, 211–221. doi:10.1016/j.biombioe.2006.04.007
STC (2023). Soy Transportation Coalition. Classes of vessels and cargo capacity. Available at: https://www.soytransportation.org/Stats/Ocean_VesselClasses.pdf.
Sweeten, J., Heflin, K., Annamalai, K., Auvermann, B., McCollum, F., and Parker, D. (2006). Combustion-fuel properties of manure or compost from paved vs un-paved cattle feedlots. United States: American Society of Agricultural and Biological Engineers.
Thoreson, C. P., Webster, K. E., Darr, M. J., and Kapler, E. J. (2014). Investigation of process variables in the densification of corn stover briquettes. Energies 7, 4019–4032. doi:10.3390/en7064019
Truckers Report Jobs (2018). Truckers report. Facts about trucks — everything you want to know about eighteen wheelers. Available at: http://www.thetruckersreport.com/facts-about-trucks/.
Tumuluru, J. (2015). Comparison of chemical composition and energy property of torrefied switchgrass and corn stover. Front. Energy Res. 3, 46. doi:10.3389/fenrg.2015.00046
Tumuluru, J., Hess, J., Boardman, R., Wright, C., and Westover, T. (2012). Formulation, pretreatment, and densification options to improve biomass specifications for co-firing high percentages with coal. Ind. Biotechnol. 8, 113–132. doi:10.1089/ind.2012.0004
Tumuluru, J., Lim, C., Bi, X. T., Kuang, X., Melin, S., Yazdanpanah, F., et al. (2015a). Analysis on storage off-gas emissions from woody, herbaceous, and torrefied biomass. Energies 8, 1745–1759. doi:10.3390/en8031745
Tumuluru, J., Wright, C., Hess, J., and Kenney, K. (2011). A review of biomass densification systems to develop uniform feedstock commodities for bioenergy application. Biofuels, Bioprod. Biorefin. 5, 683–707. doi:10.1002/bbb.324
Tumuluru, J. S. (2016). Specific energy consumption and quality of wood pellets produced using high-moisture lodgepole pine grind in a flat die pellet mill. Chem. Eng. Res. Des. 110, 82–97. doi:10.1016/j.cherd.2016.04.007
Tumuluru, J. S. (2023). High-moisture pelleting of corn stover using pilot-and commercial-scale systems: impact of moisture content, L/D ratio and hammer mill screen size on pellet quality and energy consumption. Biofuels, Bioprod. Biorefin. 17, 1156–1173. doi:10.1002/bbb.2519
Tumuluru, J. S., Dansie, T., Johnson, I., and Conner, C. (2015b). Specific energy consumption and quality of briquettes produced using woody and herbaceous biomass. New Orleans, LA: American Society of Agricultural and Biological Engineers Annual International Meeting.
Tumuluru, J. S., Ghiasi, B., Soelberg, N. R., and Sokhansanj, S. (2021). Biomass torrefaction process, product properties, reactor types, and moving bed reactor design concepts. Front. Energy Res. 9, 728140. doi:10.3389/fenrg.2021.728140
Tumuluru, J. S., Sokhansanj, S., Lim, C. J., Bi, T., Lau, A., Melin, S., et al. (2010). Quality of wood pellets produced in British Columbia for export. Appl. Eng. Agric. 26, 1013–1020. doi:10.13031/2013.35902
Wiegmans, B., and Konings, R. (2015). Intermodal inland waterway transport: modelling conditions influencing its cost competitiveness. Asian J. shipp. Logist. 31, 273–294. doi:10.1016/j.ajsl.2015.06.006
Yancey, N. (2016). Bale density information. Personal communication. Sens. Basel 23, 1778. doi:10.3390/s23041778
Yancey, N., Tumuluru, J., and Wright, C. (2013). Drying, grinding and pelletization studies on raw and formulated biomass feedstock’s for bioenergy applications. J. Biobased Mater. Bioenergy 7, 549–558. doi:10.1166/jbmb.2013.1390
Nomenclature
Keywords: biomass, energy, logistics, transportation, fossil fuel, by-products
Citation: Tumuluru JS, Igathinathane C, Archer D and McCulloch R (2024) Energy-based break-even transportation distance of biomass feedstocks. Front. Energy Res. 12:1347581. doi: 10.3389/fenrg.2024.1347581
Received: 01 December 2023; Accepted: 26 February 2024;
Published: 02 April 2024.
Edited by:
Nawa Baral, The Joint BioEnergy Institute, United StatesReviewed by:
Kai Lan, North Carolina State University, United StatesVandit Vijay, Sardar Swaran Singh National Institute of Bio-Energy, India
Copyright © 2024 Tumuluru, Igathinathane, Archer and McCulloch. This is an open-access article distributed under the terms of the Creative Commons Attribution License (CC BY). The use, distribution or reproduction in other forums is permitted, provided the original author(s) and the copyright owner(s) are credited and that the original publication in this journal is cited, in accordance with accepted academic practice. No use, distribution or reproduction is permitted which does not comply with these terms.
*Correspondence: C. Igathinathane, aWdhdGhpbmF0aGFuZS5jYW5uYXllbkBuZHN1LmVkdQ==