- Department of Electrical and Computer Engineering, Logan, UT, United States
Robust charging schedules for a growing market of battery-electric bus (BEB) fleets are critical to successful adoption. In this paper, we present a BEB charging scheduling framework that considers spatiotemporal schedule constraints, route schedules, fast and slow charging options, and battery dynamics, modeled as a mixed-integer linear program (MILP). The MILP is based on the berth allocation problem (BAP), a method that optimally assigns vessels for service, and is adapted in a modified form known as the position allocation problem (PAP), which assigns electric vehicles (EVs) for charging. Linear battery dynamics are included to model the charging of buses while at the station. To account for the BEB discharges over their respective routes, we assume that each BEB experiences an average kWh charge loss while in transit. The optimization coordinates BEB charging to ensure that each vehicle maintains a state-of-charge (SOC) above a specified level. The model also minimizes the total number of chargers utilized and prioritizes slow charging for battery health. The validity of the model is demonstrated using a set of routes sampled from the Utah Transit Authority (UTA) for 35 buses and 338 visits to the charging station. The model is also compared to a heuristic algorithm based on charge thresholds, referred to as the Qin-modified method. The results show that the MILP framework encourages battery health by assigning slow chargers to BEBs more readily than the Qin-modified method. The MILP utilized one fast charger and six slow chargers, whereas the Qin-modified method utilized four fast chargers and six slow chargers. Moreover, the MILP maintained a specified minimum SOC of 25% throughout the day and achieved the required minimum SOC of 70% at the end of the working day, whereas the Qin-modified method failed to maintain the SOC above 0% without any constraints applied. Furthermore, it is shown that the spatiotemporal constraints are met while considering the battery dynamics and minimizing both the charger count and consumption cost.
1 Introduction
The public transportation system is crucial in any urban area; however, the increased awareness and concern over the environmental impacts of petroleum-based public transportation have fueled efforts to reduce the pollution footprint (De Filippo et al., 2014; Xylia and Silveira, 2018; Guida and Abdulah, 2017; Li, 2016). One key solution is the electrification of public bus transportation via battery power, i.e., battery-electric buses (BEBs), which has received significant attention (Li, 2016). Although this technology provides benefits beyond a reduction in emissions, such as lower driving costs, lower maintenance costs, and reduced vehicle noise, battery-powered systems introduce new challenges, such as higher upfront costs and, potentially, long “refueling” periods, which can last several hours (Xylia and Silveira, 2018; Li, 2016). Furthermore, the problem is exacerbated by the constraints of the transit schedule to which the fleet must adhere, the limited number of chargers available, and the adverse effects of fast charging on battery health (Lutsey and Nicholas, 2019). This paper aims to remedy these problems by presenting a framework for optimally assigning BEBs to charging queues, assuming fixed routes, while considering multiple charger types and utilizing linear charging dynamics. This method also ensures that the state-of-charge (SOC) remains above a specified percentage throughout the day and ensures a minimum SOC at the end of the working day.
Recently, many efforts have been made to simultaneously solve the problems of route scheduling, charging fleets, and determining the infrastructure upon which they rely (Wei et al., 2018; Sebastiani et al., 2016; Hoke et al., 2014; Wang X. et al., 2017). Several simplifications are made to make these problems computationally feasible. Simplifications to the charge scheduling model include utilizing only fast chargers while planning (Wei et al., 2018; Sebastiani et al., 2016; Wang Y. et al., 2017; Zhou et al., 2020; Yang et al., 2018; Wang X. et al., 2017; Qin et al., 2016; Liu and Ceder, 2020). If slow chargers are used, they are only used at the depot and not at the station (He et al., 2020; Tang et al., 2019). Some approaches also simplify by assuming that full charge is always achieved (Wei et al., 2018; Wang X. et al., 2017; Zhou et al., 2020; Wang Y. et al., 2017). Others have assumed that the charge received is proportional to the time spent on the charger (Liu and Ceder, 2020; Yang et al., 2018), which can be a valid assumption when the battery SOC is below 80% (Liu and Ceder, 2020).
This work builds upon the position allocation problem (PAP) (Qarebagh et al., 2019), a modification of the well-studied berth allocation problem (BAP), as a means to schedule the charging of electric vehicles (Buhrkal et al., 2011; Frojan et al., 2015; Imai et al., 2001; Rodrigues and Agra, 2022). The BAP is a continuous time model that solves the problem of allocating space for incoming vessels to be berthed and serviced. Each arriving vessel requires both time and space for service and, thus, must be carefully assigned to avoid delay (Imai et al., 2001). Vessels are lined up parallel to the berth to be serviced and are horizontally queued, as shown in Figure 1. As the vessels are serviced, they move from left to right, creating space for the queued vessels, which move vertically downward into their respective berthing locations. The PAP utilizes this queuing concept for scheduling vehicles to be charged, as shown in Figure 2. The vehicles are queued in several lines and move from left to right to receive their charge before exiting the system. The PAP is formulated as a rectangle packing problem and assumes that each vehicle has a predefined charge time, and the number of vehicles that can be charged at any given moment is limited by the physical width of each vehicle and the length of the charging block. The PAP also assumes that each vehicle in the system is unique (Qarebagh et al., 2019).
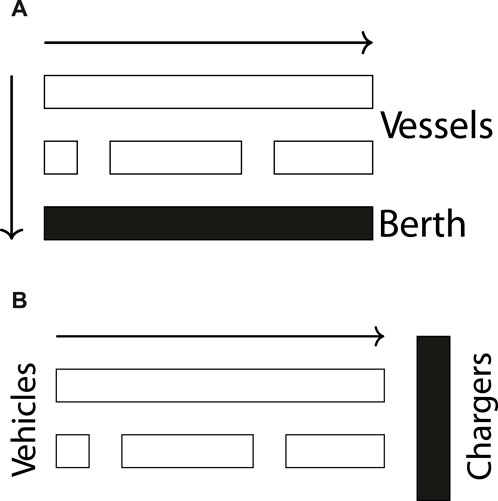
Figure 1. (A) Example of berth allocation. Vessels are docked in berth locations (horizontal) and queued over time (vertical). The vertical arrow represents the movement direction of the queued vessels, and the horizontal arrow represents the direction of departure. (B) Example of position allocation. Vehicles are placed in queues to be charged and move in the direction indicated by the arrow.
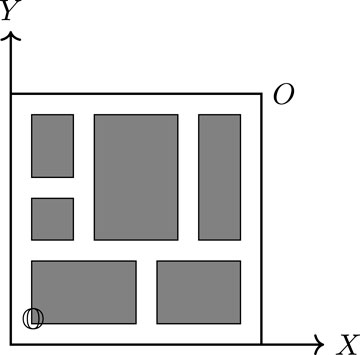
Figure 2. Example of the rectangle packing problem. The large square represented by
The main contribution of this work is the extension of the PAP’s novel approach to BEB charger scheduling. This incorporates a proportional charging model into the mixed-integer linear program (MILP) framework, considers multiple charger types, and considers each route in the schedule. The last contribution is of importance because both the BAP and PAP consider each arrival to be unique; thus, the tracking of battery charge from one visit to the next must be considered. Furthermore, the input parameters for the model can be predefined in such a manner as to minimize the number of fast and slow chargers utilized and minimize the energy consumption. That is, the model will simultaneously minimize the number of chargers and the total consumed energy. The result is a MILP formulation that coordinates charging times and charger type for every visit while considering a dynamic charge model with scheduling constraints.
The remainder of the paper is structured as follows: in Section 2, the PAP is introduced with a formulation of the resulting MILP; Section 3 constructs the MILP for BEB scheduling, including modifications to the PAP queuing constraints and the development of a dynamic charging model; Section 4 demonstrates an example of using the formulation to coordinate 35 buses over 338 total visits to the station; and Section 5 presents the concluding remarks.
2 Position allocation problem
This section provides a brief overview of the BAP and a detailed formulation of the PAP, as presented by Qarebagh et al. (2019).
2.1 Overview of the BAP
The BAP is a rectangle packing problem where a set of rectangles, denoted as
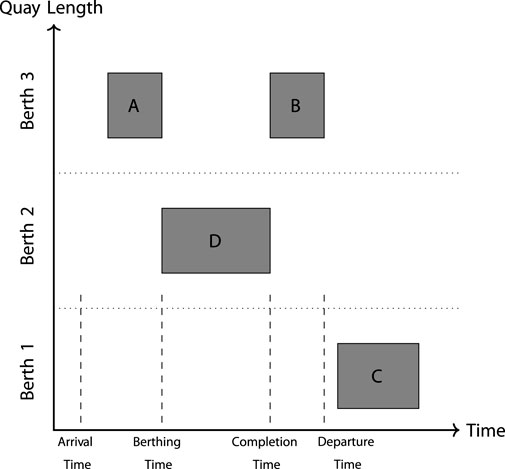
Figure 3. Representation of the berth–time space. The x- and y-axes represent time and space, respectively. Along the y-axis, the dashed lines represent discrete berthing locations. These locations may be chosen to be continuous. The shaded rectangles represent scheduled vessels to be serviced. The height of each shaded rectangle represents the space taken on the berth, and the width represents the time required to service the said vessel. The vertical dashed lines are associated with vessel D and represent the arrival time, berthing time, service completion time, and departure time. Note that the arrival time may be before the berthing time and the completion time may be before the departure time.
The BAP solves the problem of optimally assigning incoming vessels to berthing positions in order to be serviced, as shown in Figure 1. To relate to the rectangle packing problem, the width and height of
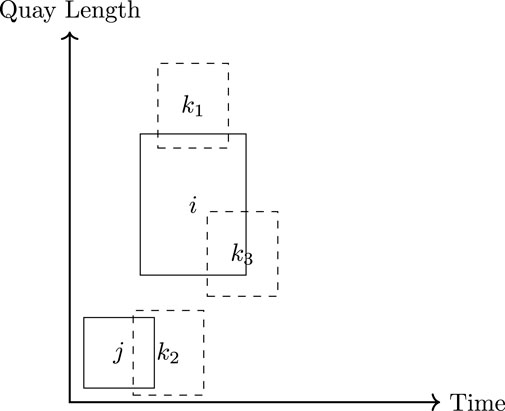
Figure 4. Examples of different methods of overlapping. Space overlap:
2.2 PAP formulation
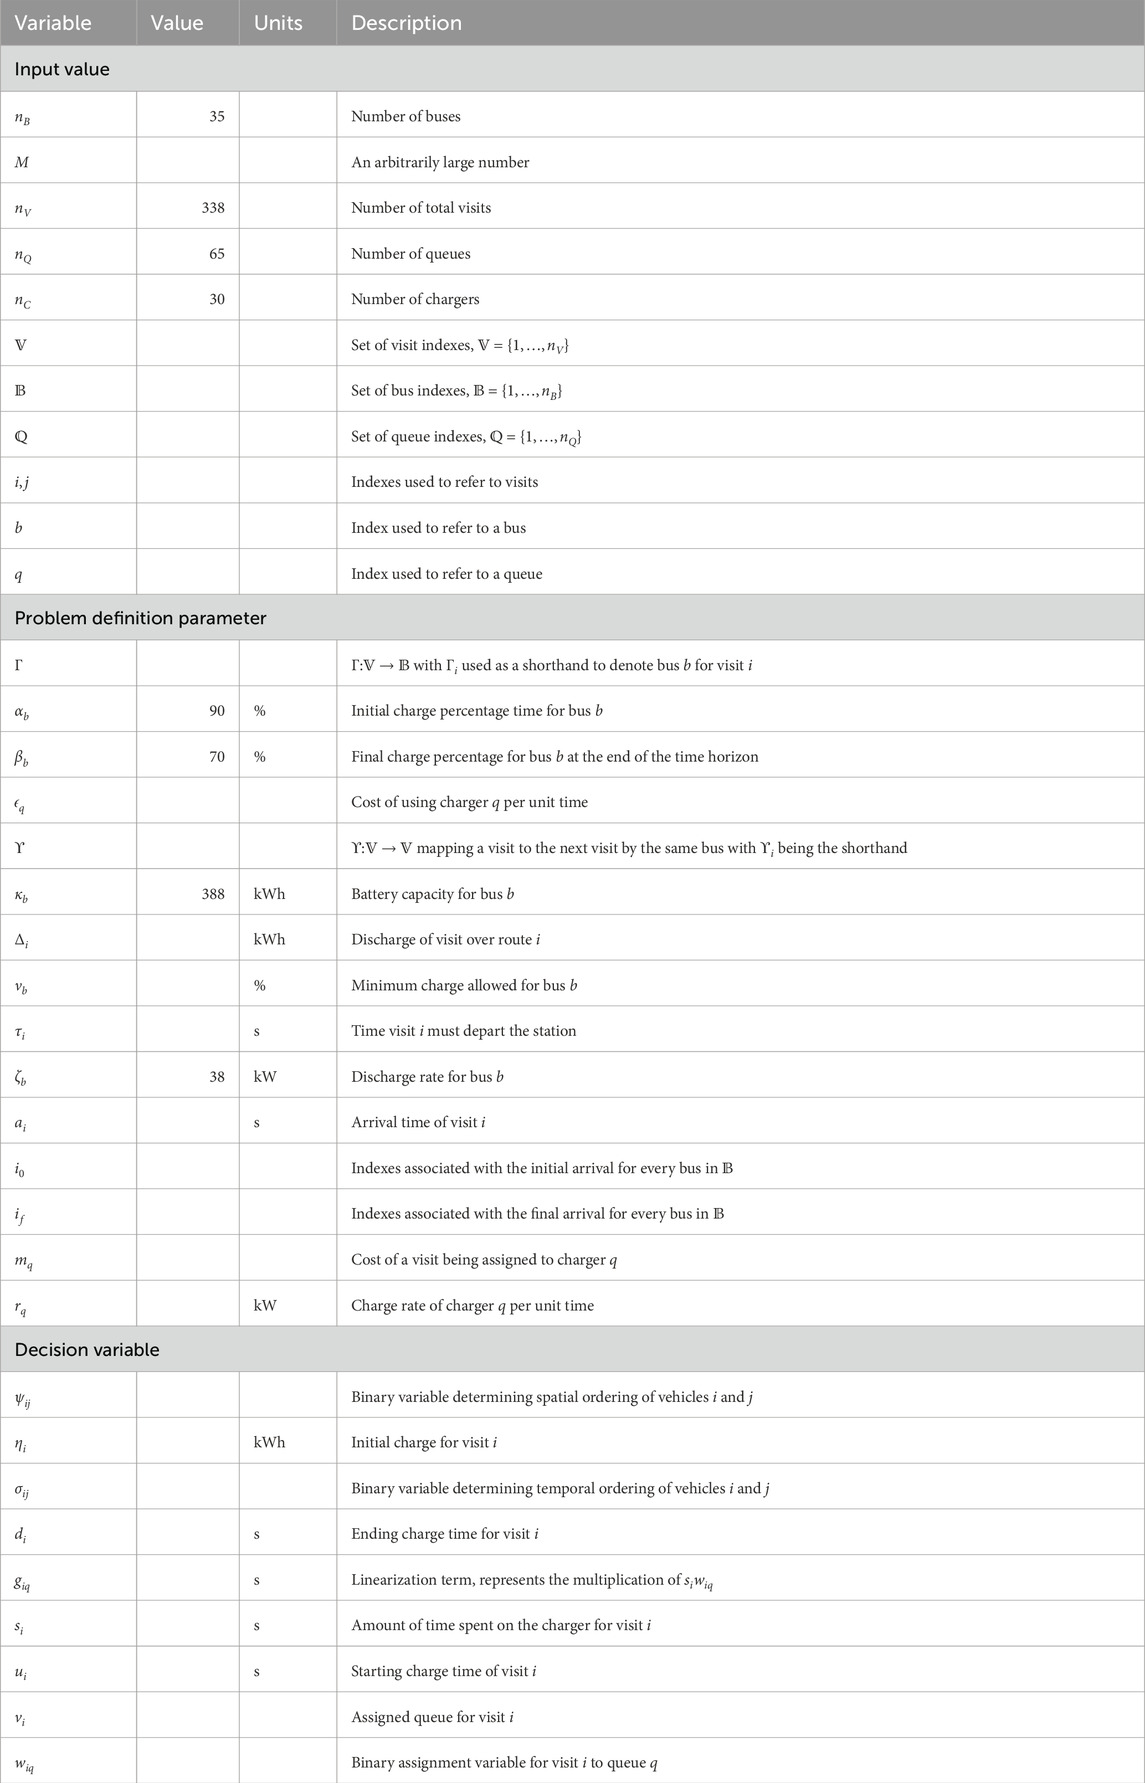
The BAP forms the basis of the PAP; however, there are some differences in the way the variables are interpreted. The relevant variables are given in Table 1. The starting service time,
The PAP formulation’s parameters can be divided into two categories: input parameters and decision variables. The following parameters are assumed to be known inputs for the MILP.
The decision variables provide the means by which the solver may optimize the problem. The initial and final charge times for vehicle
To determine the values for each of these decision variables, a MILP was formulated by Qarebagh et al. (2019). The formulation is shown in its entirety for completeness. The problem to be solved is
subject to
The objective function, Equation 1, minimizes the idle and service time by summing over the differences between the departure time,
Equations 2a–e are used to ensure that individual rectangles do not overlap. In terms of the PAP, this implies that there are no conflicts in the schedule spatially or temporally. Equation 2a establishes temporal ordering when active
The last constraints force relationships between arrival time, initial charge time, and departure time. Equation 2f states that the initial charge time,
3 Rectangle packing formulation for BEB charging
Applying the PAP to BEB charging requires four fundamental changes. The first is that the time that a BEB spends charging must be allowed to vary. That is,
A few assumptions are made in the derivation of the algorithm. As this work is not focused on estimating the discharge of a BEB during its route, the discharge for each route will be pre-calculated by assuming a fixed discharge rate kW multiplied by the route duration in hours. Second, it is assumed that the initial SOC of each BEB at the beginning of the day,
The discussion of the four changes is separated into two sections. Subsection 3.1 discusses the changes in the spatiotemporal constraint formulation to form a queuing constraint. Subsection 3.2 discusses the addition of bus charge management. This section ends with a brief discussion of a modified objective function and the statement of the full problem in Subsection 3.3. The notation is explained throughout and summarized in Table 1.
3.1 Queuing constraints
The queuing constraints ensure that the buses entering the charging queues are assigned feasibly. There are three sets to differentiate between different entities.
The actual physical dimensions of the BEB are ignored, and it is assumed that each BEB will be assigned to charge at a particular charger. Because of this assumption, the PAP spatial variable,
The constraint in Equation 3a is nearly identical to Equation 2b, but rather than viewing the charger as a continuous strip of length
3.2 Battery charge dynamic constraints
This section introduces the battery dynamic constraints. Two constraints are enforced on the SOC for each BEB: the SOC must always remain above a specified percentage to guarantee sufficient charge to execute their respective routes, and each bus must end the day with a SOC above a specified threshold, in preparation for the next day.
The SOC upon arrival for visit
To define the time spent on the charger,
It is assumed that the charge received is proportional to the time spent charging. The rate for charger
The binary decision variable
Where Equation 4a represents the SOC for the next visit of BEB
The choice of queue for visit
Maximum and minimum values for the charges are included to ensure that the battery is not overcharged and guarantee sufficient charge for subsequent visits. The upper and lower battery charge bounds for bus
Equation 6a ensures that the BEB SOC does not exceed the battery capacity, and Equation 6b ensures that the initial SOC for each visit is above the threshold of
Equation 7 can be expressed as a mixed-integer constraint using big-M notation with the following four constraints:
where
3.3 BEB charging problem
The goal of the MILP is to utilize chargers as little as possible to reduce energy costs, with fast charging being penalized more to avoid its adverse effects on battery health and to account for the higher usage costs. Thus, assignment cost
subject to the constraints
Equations 10a–i are reiterations of the queuing constraints from Equation 2; Equation 3. Equations 10g–m provide the battery charge constraints. Equations 10n–q define the charge duration of every visit/queue pairing. Equations 10r, 10s are reiterations of Equation 4b and Equation 5, respectively. Equations 10t–v define the sets of valid values for each variable.
4 Example
We present an example to demonstrate the utility of the developed MILP charge scheduling technique. A description of the scenario is first presented, followed by a description of an alternative heuristic-based planning strategy called Qin-modified method, which is used as a comparison with the MILP PAP. The results are then presented, analyzed, and discussed for each of the planning strategies.
4.1 BEB scenario
To display the capabilities of the model, an example scenario is presented. The scenario was run over a time horizon of
To encourage the MILP PAP to utilize the fewest number of chargers, the value of
Another heuristic-based optimization strategy, referred to as the Qin-modified method, is also used to compare the results of the MILP PAP. The Qin-modified strategy is based on the threshold strategy proposed by Qin et al. (2016). The strategy has been modified slightly to accommodate the case of multiple charger types without an exhaustive search for the best charger type. The heuristic is based on a set of rules that revolve around the initial SOC of the bus visit
The total number of constraints resulted in 7,511 continuous and 328,282 integer/binary constraints. The optimization was performed using the Gurobi MIP solver (Gurobi Optimization, LLC, 2021) on a machine equipped with an AMD Ryzen 9 5900 × 12 Processor (24 core) running at 4.95 GHz. The solver was allowed to run for
4.2 Results
The schedule generated by the Qin-modified strategy and the MILP PAP is shown in Figures 5A, B, respectively. The x-axis represents the time in hours. The y-axis represents the assigned charging queue. Rows between 0 and 14 are active times for slow chargers, and rows in the range of 15 and 29 are active times for fast chargers. The unique color/symbol-styled vertices represent the starting charge time for a bus
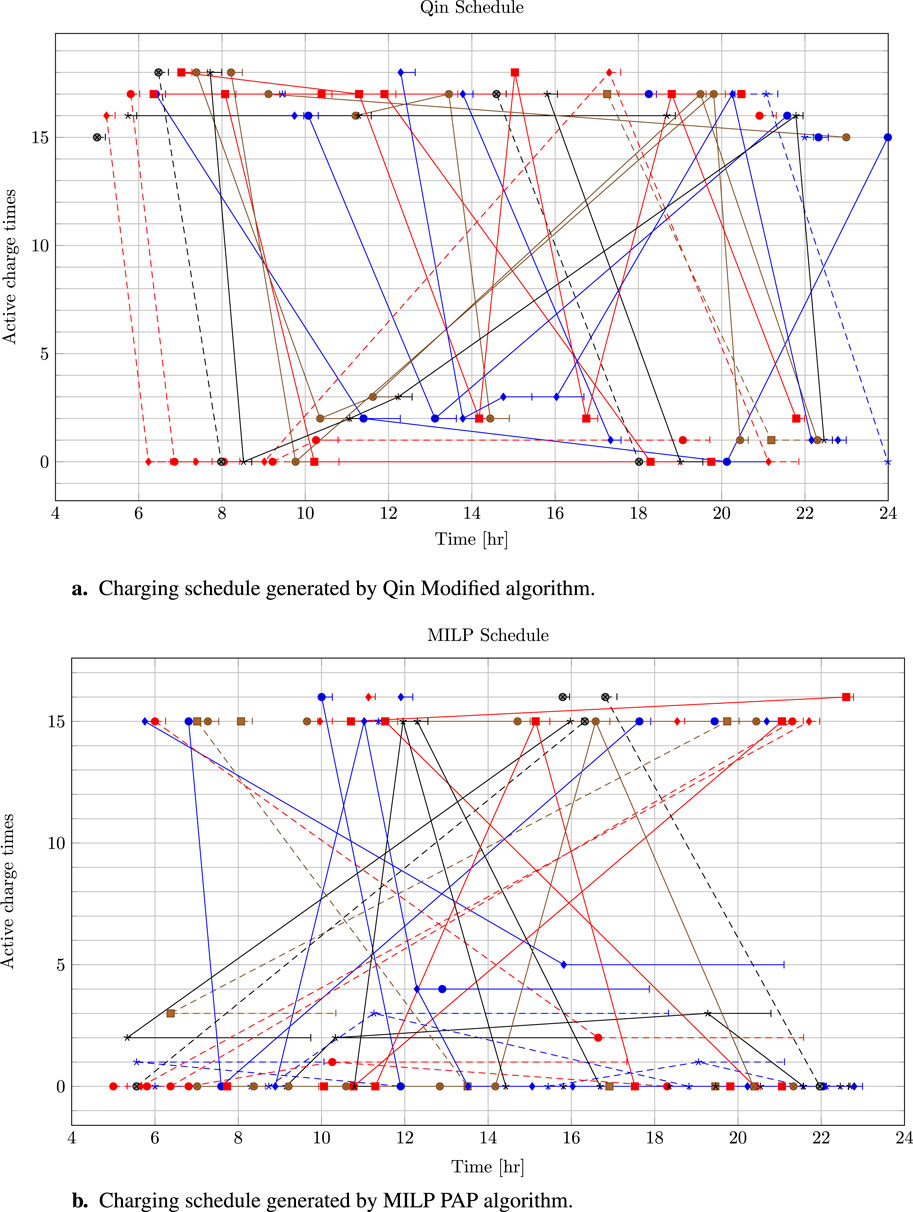
Figure 5. (A) Charging schedule generated by the Qin-modified algorithm. (B) Charging schedule generated by the MILP PAP algorithm.
The first observation is in the choice of preferred chargers between the Qin-modified and MILP scheduler. Figures 6A, B show that the Qin-modified schedule uses at most four fast chargers and three slow chargers at the same time, whereas the MILP schedule uses at most one fast charger and six slow chargers at the same time. Both the Qin-modified and MILP schedule used the fast chargers in short bursts (˜0.2–0.5 h). The main difference lies in the utilization strategy of the slow chargers. The Qin-modified method, for the most part, opted for shorter bursts for the slow chargers (˜0.3–0.7 h), most heavily placed on the first slow charger. The MILP utilized the slow chargers in short bursts; however, the solver recognized moments where a BEB being placed in a slow-charging queue for a longer duration was more cost-effective (with respect to the objective function) than the BEB placed in a fast-charging queue. Although one of the objectives of the MILP was to minimize the amount of chargers used, the Qin-modified schedule ended up using fewer chargers than the MILP. Note that the MILP schedule packed the first queue for the fast and slow chargers more effectively than the Qin-modified schedule. Although both schedules generated are valid, no comparison of the quality of the schedule can be made directly from Figures 5A, B.
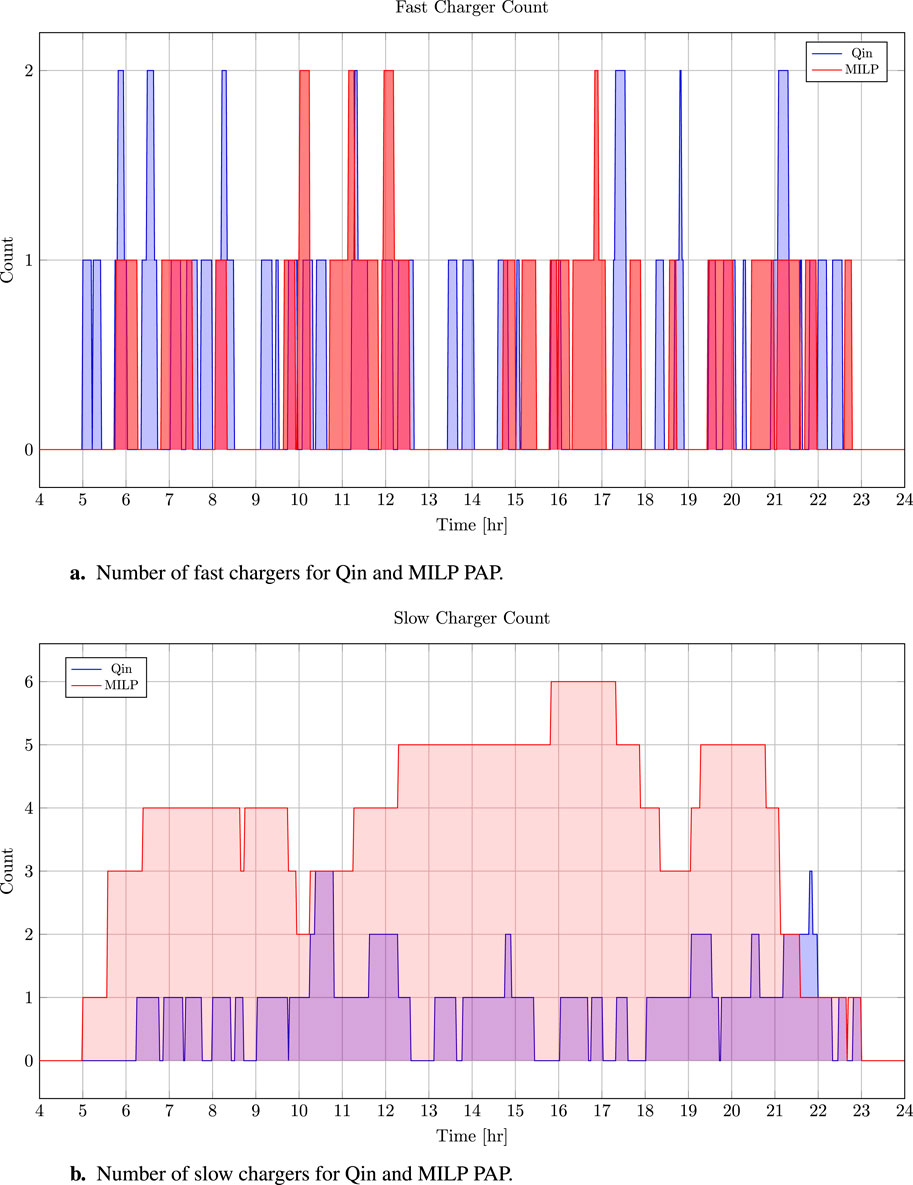
Figure 6. (A) Number of fast chargers for Qin-modified and MILP PAP methods. (B) Number of slow chargers for Qin-modified and MILP PAP methods.
Figures 7A, B depict the charge for every bus over the time horizon for the Qin-modified and MILP schedules, respectively. Every vehicle begins with a SOC of
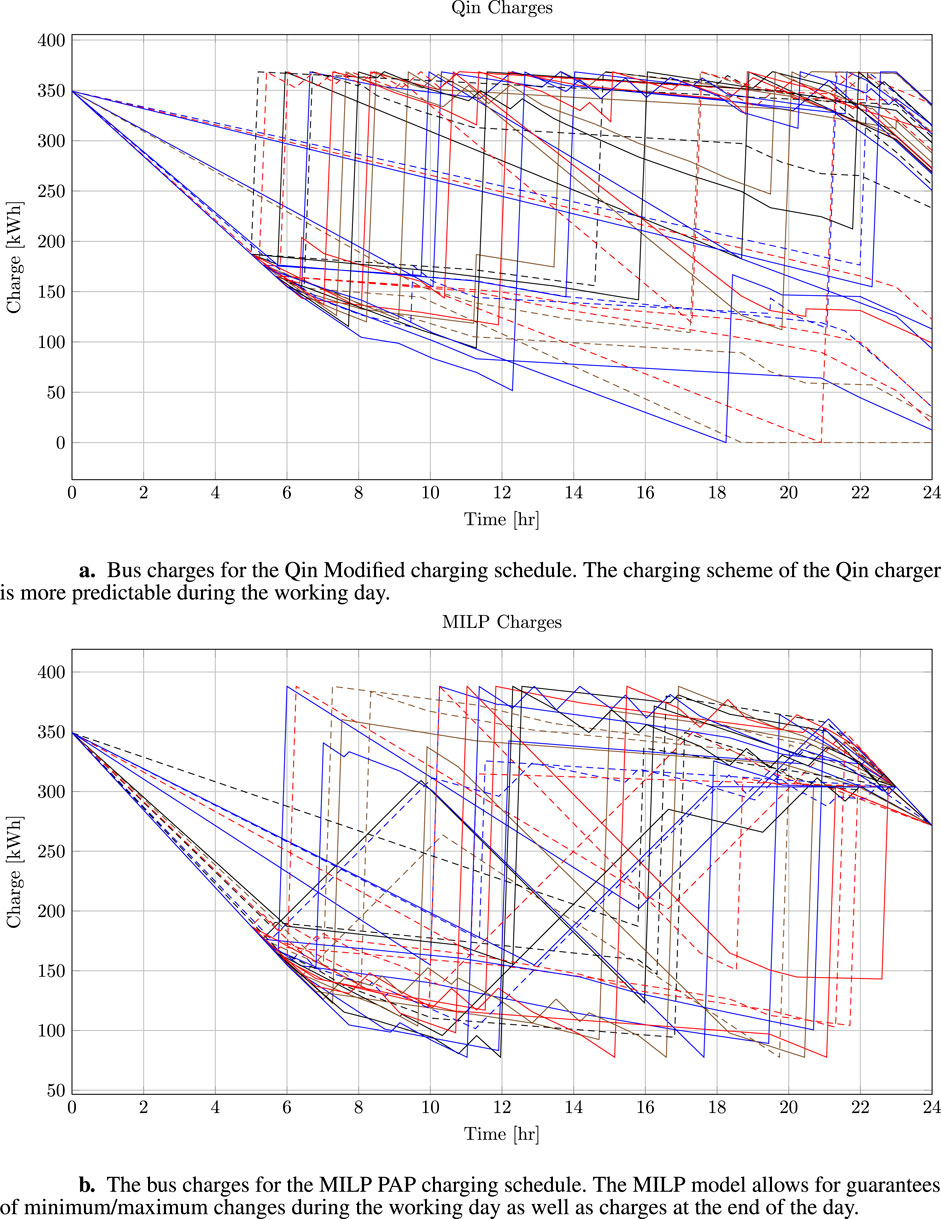
Figure 7. (A) Bus charges for the Qin-modified charging schedule. The charging scheme of the Qin charger is more predictable during the working day. (B) Bus charges for the MILP PAP charging schedule. The MILP model allows for guarantees of minimum/maximum changes during the working day and charges at the end of the day.
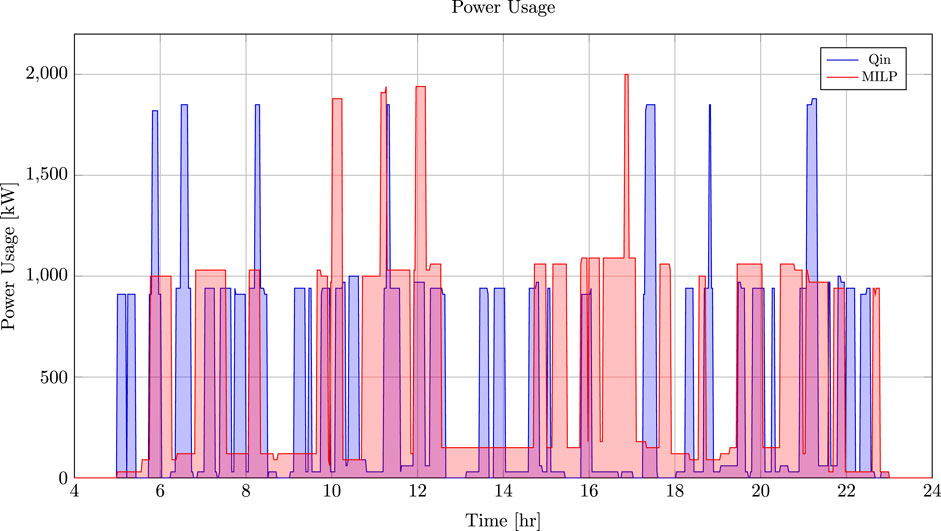
Another important measure for the chargers is to compare the amount of power and energy consumed. Figure 8 depicts the power consumption throughout the time horizon. It can be seen that the Qin-modified power consumption is steadily less or the same as that of the MILP schedule. This can be accounted for by the MILP’s constraints to keep the bus SOC above 20% and to reach a final SOC of 70% at the end of the working day. Similarly, the accumulated energy consumed is shown in Figure 9. The MILP schedule is more efficient up until about the 11th hour. Again, this can be accounted for by the fact that the MILP accommodates the extra constraints. Due to these constraints, the MILP PAP consumes approximately
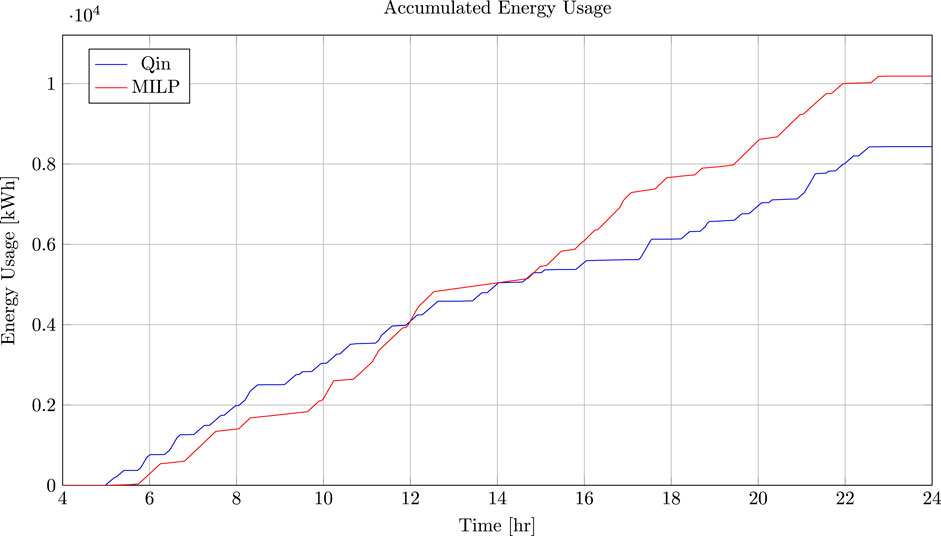
Figure 9. Total accumulated energy consumed by the Qin-modified and MILP schedules throughout the time horizon.
5 Conclusion
This work developed a MILP scheduling framework that optimally assigns fast and slow chargers to a BEB fleet, assuming a constant schedule. The BAP was briefly introduced, followed by a description and formulation of the PAP. The PAP was modified to allow the charge time to be variable. Because the modified PAP no longer requires a predefined charge time, linear battery dynamics were introduced to model the propagation of each BEB’s SOC. Additional constraints were also introduced to provide upper and lower limits for the battery dynamics.
An example of the MILP PAP formulation was then presented and compared to a heuristic-based schedule, referred to as the Qin-modified method. The MILP PAP optimization was run for 7,200 s to a non-optimal solution. The Qin-modified and MILP schedule utilized four and one fast charger(s), respectively. Furthermore, the MILP and Qin-modified method utilized the fast chargers for similar durations ranging from approximately 0.2 to 0.5 h; however, the MILP schedule demonstrated battery health considerations by recognizing visits that could utilize slow chargers for longer durations while satisfying the constraints. The MILP PAP schedule utilized approximately
Further fields of interest include utilizing the formulation (Equation 9; Equation 10) with nonlinear battery dynamics, calculation and utilization of the demand and consumption cost in the objective function, and utilizing this formulation in a metaheuristic solver. Furthermore, “fuzzifying” the initial and final charge times is of interest to allow flexibility in the arrival and departure times.
Data availability statement
The original contributions presented in the study are included in the article/Supplementary Material; further inquiries can be directed to the corresponding author.
Author contributions
AB: conceptualization, software, and writing–original draft. GD: supervision and writing–review and editing. JG: supervision and writing–review and editing.
Funding
The author(s) declare that financial support was received for the research, authorship, and/or publication of this article. This work was supported in part by the Department of Energy through a Prime Award with ABB Ltd., under Grand DE-EE0009194, and in part by PacifiCopr Under Contract 3590. The funder had no involvement in the study design, data collection and analysis, or preparation of the manuscript. They did review and approve the publication prior to the decision to publish.
Conflict of interest
The authors declare that the research was conducted in the absence of any commercial or financial relationships that could be construed as a potential conflict of interest.
Publisher’s note
All claims expressed in this article are solely those of the authors and do not necessarily represent those of their affiliated organizations, or those of the publisher, the editors, and the reviewers. Any product that may be evaluated in this article, or claim that may be made by its manufacturer, is not guaranteed or endorsed by the publisher.
Supplementary material
The Supplementary Material for this article can be found online at: https://www.frontiersin.org/articles/10.3389/fenrg.2024.1347442/full#supplementary-material
References
Buhrkal, K., Zuglian, S., Ropke, S., Larsen, J., and Lusby, R. (2011). Models for the discrete berth allocation problem: a computational comparison. Transp. Res. Part E Logist. Transp. Rev. 47, 461–473. doi:10.1016/j.tre.2010.11.016
de Bruin, F. (2013). Rectangle Packing. Master’s thesis. Amsterdam (Netherlands): University of Amsterdam.
De Filippo, G., Marano, V., and Sioshansi, R. (2014). Simulation of an electric transportation system at the Ohio state university. Appl. Energy 113, 1686–1691. doi:10.1016/j.apenergy.2013.09.011
Frojan, P., Correcher, J. F., Alvarez-Valdes, R., Koulouris, G., and Tamarit, J. M. (2015). The continuous berth allocation problem in a container terminal with multiple quays. Expert Syst. Appl. 42, 7356–7366. doi:10.1016/j.eswa.2015.05.018
Guida, U., and Abdulah, A. (2017). ZeEUS eBus Report# 2-An updated overview of electric buses in Europe. Tech. Rep. 2, International Association of Public Transport (UITP)
He, Y., Liu, Z., and Song, Z. (2020). Optimal charging scheduling and management for a fast-charging battery electric bus system. Transp. Res. Part E Logist. Transp. Rev. 142, 102056. doi:10.1016/j.tre.2020.102056
Hoke, A., Brissette, A., Smith, K., Pratt, A., and Maksimovic, D. (2014). Accounting for lithium-ion battery degradation in electric vehicle charging optimization. IEEE J. Emerg. Sel. Top. Power Electron. 2, 691–700. doi:10.1109/JESTPE.2014.2315961
Imai, A., Nishimura, E., and Papadimitriou, S. (2001). The dynamic berth allocation problem for a container port. Transp. Res. Part B Methodol. 35, 401–417. doi:10.1016/s0191-2615(99)00057-0
Li, J.-Q. (2016). Battery-electric transit bus developments and operations: a review. Int. J. Sustain. Transp. 10, 157–169. doi:10.1080/15568318.2013.872737
Liu, T., and Ceder, A. (2020). Battery-electric transit vehicle scheduling with optimal number of stationary chargers. Transp. Res. Part C Emerg. Technol. 114, 118–139. doi:10.1016/j.trc.2020.02.009
Lutsey, N., and Nicholas, M. (2019). Update on electric vehicle costs in the United States through 2030. The International Council on Clean Transportation 2.
Murata, H., Fujiyoshi, K., Nakatake, S., and Kajitani, Y. (1995). “Rectangle-packing-based module placement,” in Proceedings of IEEE international conference on computer aided design (ICCAD), 472–479. doi:10.1109/.ICCAD.1995.480159
Qarebagh, A. J., Sabahi, F., and Nazarpour, D. (2019). “Optimized scheduling for solving position allocation problem in electric vehicle charging stations,” in 2019 27th Iranian conference on electrical engineering (ICEE), 593–597. doi:10.1109/IranianCEE.2019.8786524
Qin, N., Gusrialdi, A., Paul Brooker, R., and T-Raissi, A. (2016). Numerical analysis of electric bus fast charging strategies for demand charge reduction. Transp. Res. Part A Policy Pract. 94, 386–396. doi:10.1016/j.tra.2016.09.014
Rodrigues, F., and Agra, A. (2022). Berth allocation and quay crane assignment/scheduling problem under uncertainty: a survey. Eur. J. Operational Res. 303, 501–524. doi:10.1016/j.ejor.2021.12.040
Rodriguez, M. A., and Vecchietti, A. (2013). A comparative assessment of linearization methods for bilinear models. Comput. Chem. Eng. 48, 218–233. doi:10.1016/j.compchemeng.2012.09.011
Sebastiani, M. T., Lüders, R., and Fonseca, K. V. O. (2016). Evaluating electric bus operation for a real-world brt public transportation using simulation optimization. IEEE Trans. Intelligent Transp. Syst. 17, 2777–2786. doi:10.1109/TITS.2016.2525800
Tang, X., Lin, X., and He, F. (2019). Robust scheduling strategies of electric buses under stochastic traffic conditions. Transp. Res. Part C Emerg. Technol. 105, 163–182. doi:10.1016/j.trc.2019.05.032
Wang, X., Yuen, C., Hassan, N. U., An, N., and Wu, W. (2017a). Electric vehicle charging station placement for urban public bus systems. IEEE Trans. Intelligent Transp. Syst. 18, 128–139. doi:10.1109/TITS.2016.2563166
Wang, Y., Huang, Y., Xu, J., and Barclay, N. (2017b). Optimal recharging scheduling for urban electric buses: a case study in davis. Transp. Res. Part E Logist. Transp. Rev. 100, 115–132. doi:10.1016/j.tre.2017.01.001
Wei, R., Liu, X., Ou, Y., and Fayyaz, S. K. (2018). Optimizing the spatio-temporal deployment of battery electric bus system. J. Transp. Geogr. 68, 160–168. doi:10.1016/j.jtrangeo.2018.03.013
Xylia, M., and Silveira, S. (2018). The role of charging technologies in upscaling the use of electric buses in public transport: experiences from demonstration projects. Transp. Res. Part A Policy Pract. 118, 399–415. doi:10.1016/j.tra.2018.09.011
Yang, C., Lou, W., Yao, J., and Xie, S. (2018). On charging scheduling optimization for a wirelessly charged electric bus system. IEEE Trans. Intelligent Transp. Syst. 19, 1814–1826. doi:10.1109/TITS.2017.2740329
Keywords: berth allocation problem, position allocation problem, mixed-integer linear program, battery-electric bus, scheduling
Citation: Brown A, Droge G and Gunther J (2024) A position allocation approach to the scheduling of battery-electric bus charging. Front. Energy Res. 12:1347442. doi: 10.3389/fenrg.2024.1347442
Received: 30 November 2023; Accepted: 30 October 2024;
Published: 22 November 2024.
Edited by:
Umberto Desideri, University of Pisa, ItalyReviewed by:
Naresh Susarla, Keylogic Systems, United StatesGiovanni Bove, University of Salerno, Italy
Copyright © 2024 Brown, Droge and Gunther. This is an open-access article distributed under the terms of the Creative Commons Attribution License (CC BY). The use, distribution or reproduction in other forums is permitted, provided the original author(s) and the copyright owner(s) are credited and that the original publication in this journal is cited, in accordance with accepted academic practice. No use, distribution or reproduction is permitted which does not comply with these terms.
*Correspondence: Alexander Brown, YTAxNzA0NzQ0QHVzdS5lZHU=
 Alexander Brown
 Greg Droge
 Jacob Gunther