Abstract
To enhance the resilience of power distribution networks against extreme natural disasters, this article introduces a robust fault recovery strategy for multi-source, flexible interconnected power distribution networks, particularly under scenarios of extreme disasters. Initially, the comprehensive risk of system failure due to ice load on distribution lines and poles is fully considered, and a model for the overall failure rate of lines is constructed. This model addresses the diverse failure scenarios triggered by various meteorological conditions. Through the use of information entropy, typical extreme disaster failure scenarios are identified, and lines with high failure rates under these scenarios are determined. Subsequently, a box-type interval model is developed to represent the uncertainty in the output of distributed generation (DG), and on this basis, a robust fault recovery model for multi-source power distribution networks interconnected through soft open points (SOPs) is established, and use the Column and Constraint Generation (C&CG) algorithm to solve the problem. Finally, the fault recovery model and strategy proposed are validated through an illustrative example based on a modified IEEE 33-node interconnected system.
1 Introduction
In recent years, the frequency and intensity of extreme weather events, such as severe ice and snow storms, hurricanes, and floods, have significantly increased (Nasri et al., 2022). The complexity of their operating environments and the vulnerability of numerous components to external conditions make distribution networks particularly susceptible to these extreme weather phenomena, often resulting in widespread power outages (Jufri et al., 2019). While existing research on power distribution network fault recovery has predominantly focused on the electrical characteristics of the networks, it has largely overlooked the comprehensive impact of meteorological conditions and natural disasters. This includes a notable gap in integrating collected weather data with early warning systems for accidents, which is crucial for enhancing response strategies and reducing the vulnerability of these networks to such catastrophic events.
To mitigate the impacts of extreme natural disasters on distribution networks, scholars from around the world have developed specific disturbance event models tailored to extreme weather conditions (Dehghani et al., 2021). For example, Ref. (Zhou et al., 2018). explored the influence of typhoon conditions on the fault rates of distribution network lines, establishing a model that correlates typhoon wind speed and direction with line fault rates. Similarly, other research has formulated models to assess the fault rates of distribution networks during severe ice, snow, and earthquake conditions (Yang et al., 2020; Yan et al., 2021). In an effort to bolster the resilience of distribution networks, researchers have proposed a variety of response strategies, focusing on network planning and operational scheduling. These strategies encompass both preventive measures before disasters strike and recovery actions post-disaster (Gazijahani et al., 2022). However, existing research mainly focuses on post-disaster recovery measures aimed at prioritizing the restoration of power supply to users. Although traditional distribution networks can restore power supply to outaged areas through network reconfiguration, their capabilities are limited in cases of main network disconnection or multiple faults caused by extreme disasters. According to the IEEE 1547-2003 standard (Standards Coordinating Committee, 2003), improving the reliability of power supply requires users to implement local DG islanding operation under technical compliance, to maximize the recovery of lost loads. Within this framework, researchers are delving into post-disaster fault recovery strategies for active distribution networks through various innovative approaches. These include heuristic algorithms (Gao et al., 2016), multi-agent systems (Li et al., 2020b), artificial intelligence algorithms (Wang et al., 2018), and mathematical programming methods (Li et al., 2019).
Regarding recovery strategies, Ref. (Yin et al., 2023). introduced a novel approach for fault recovery in active distribution networks, focusing on networks with reducible loads. Ref. (Liu et al., 2020). developed a two-step fault recovery methodology that initially reconfigures the main network before segmenting the remaining unrecovered sections into isolated islands. Ref. (Li et al., 2020b). further integrated the concepts of island partitioning and network reconfiguration, presenting a comprehensive fault recovery strategy for active distribution networks. Due to the uncertainty of DG output that can affect the effectiveness of fault recovery, it is necessary to consider this uncertainty in the active distribution network fault recovery model. Common methods to handle this uncertainty include interval optimization (Wang et al., 2020), stochastic optimization (Lu et al., 2020), and robust optimization (Chen et al., 2016). Robust optimization has been widely applied due to its ability to operate without describing probability distributions, with main solution methods including the Benders decomposition method (Han Gao and Zhengshuo Li, 2021) and the C&CG algorithm (Chuan He et al., 2017). Considering the uncertainty of load and DG output, a two-stage robust fault recovery strategy was proposed in (Zhao et al., 2020). Another study considered the uncertainty of wind and photovoltaic unit output and proposed a robust island recovery strategy for distribution networks using electric vehicles as emergency dispatch resources (Chen et al., 2018).
However, the above fault recovery strategies have not effectively modeled the fault rate of distribution networks under extreme natural disasters, and thus cannot fully address the impact of extreme natural disasters on distribution networks (
Li et al., 2023). Particularly, as a flexible power electronic device, the SOP can provide necessary voltage support in the event of a fault, effectively expanding the possibilities for fault recovery and significantly enhancing the self-healing capability of the distribution network (
Ali Arefifar et al., 2023). This role was verified in a study where the SOP was shown to play a key role in the recovery of distribution system faults, significantly enhancing the supply range and overall resilience of the system (
Li et al., 2020a). In light of this, the primary objective of this study is to bolster the resilience of power distribution networks against extreme natural disasters and to expedite the restoration of power to areas impacted by outages. This research endeavors to investigate fault recovery strategies for distribution networks under extreme weather conditions. Through the lens of case study analysis, the efficacy of the proposed model and strategies in quickly reinstating critical loads within distribution networks under severe disaster scenarios has been corroborated. The principal contributions of this paper are delineated as follows:
(1) A model to predict fault rates in lines and poles under severe weather conditions has been developed, employing the information entropy method to pinpoint scenarios with an increased likelihood of failure. This method effectively tackles the myriad of fault scenarios arising in complex meteorological conditions, thereby enhancing the reliability of the distribution network.
(2) A comprehensive fault recovery model for a multi-sourced distribution network, interconnected through the use of SOPs, has been established. Tailored recovery strategies for lines prone to frequent faults were devised, aiming for swift restoration of service following power outages by implementing pre-designed recovery plans in the event of actual faults.
(3) A box-type interval model has been formulated to encapsulate the uncertainty inherent in DG outputs. The advanced robust fault recovery strategy, which prepares for the most adverse DG output scenarios, outperforms traditional deterministic approaches by offering enhanced recovery effectiveness and greater resilience to the unpredictability in DG outputs.
The remainder of the paper is organized as follows: Section 2 involves the construction of a fault model and the filtration of fault scenarios. Section 3 develops a robust fault recovery model for a multi-sourced distribution network interconnected with SOPs. Section 4 provides a detailed description of the solution methodology. Section 5 conducts a case study analysis, and Section 6 concludes the paper with a summary of its findings.
2 Fault model construction and scenario filtering
2.1 Fault rate model
During extreme natural disasters, the ice load on power lines is considered to gradually increase over time. When the ice layer becomes overloaded, significant bending occurs in the line. Excessive bending deformation can lead to line breakage. The ice overload or breakage of lines results in an increase in unbalanced loads on the poles. If the acting load exceeds the pole’s maximum load-bearing capacity, the crossarms may be damaged, leading to bending and twisting of the pole itself, eventually causing breakage and collapse.
2.1.1 Ice load on distribution lines
Many factors influence the ice load on distribution lines, including the intensity and duration of the disaster, as well as the distance from the center of the storm. By establishing a mathematical model using a coordinate system with the root node of the distribution feeder as the origin, the variation in ice thickness over time for a particular segment of the line j can be deduced and represented as Eqs 1, 2:where indicates the ice growth rate on the line, i.e., the change in ice coverage per unit length of line per unit time, expressed as Eq. 3:where is the ice growth rate factor, affected by disaster factors such as temperature, wind speed, and precipitation rate, expressed as Eq. 4:
2.1.2 Ice load on tower
When considering the ice load on poles, several factors need to be taken into account: the impact of wind on ice accumulation on poles, the effect of the swaying of power lines hung on the poles, and the calibration of more straightforward design equations. In the ice-loading model for the tower-line system, the ice loads on insulator strings and poles are relatively minor compared to their own structural loads and can be neglected. Therefore, the focus is on calculating the ice loads on the conductors and ground wires. The unit ice load on power lines is as Eq. 5:
The ice load exerted on the poles by the power lines hanging at both ends primarily arises from the tension in the lines. In the case of uniform, windless conditions, it's necessary to calculate the vertical load borne by the pole, as Eq. 6:where and represent the horizontal tension in the lines on either side of the pole. and are the span lengths on both sides of the pole. and denote the difference in height between the suspension points on either side of the pole, with a positive value indicating the neighboring pole is higher, and negative if it is lower.
2.1.3 Overall line fault rate
The aim of the component damage assessment method is to evaluate how weather conditions affect various components of the distribution network. The damage probability to the distribution network from extreme natural disasters is represented by fault rate curves, with the existing fault probability of distribution support structures approximated as an exponential function using historical data. The ice load ratio, described as the ratio of ice load to the design load of the distribution network, is used in conjunction with the relationships between line ice thickness, pole load, and line fault rate to establish a mathematical model for line fault rate, as Eq. 7:
In severe weather conditions like ice and snow, multiple faults can occur along most lines, and the fault rate of a distribution line can be considered as the sum of the fault rates of each line and pole along that line. To facilitate the simulation of multiple faults along a line under extreme weather conditions, the lines can be divided into multiple segments based on span length and then connected in series. The overall fault rate of the line is given as Eq. 8:
2.2 Selection of typical fault scenarios
The primary impact of extreme weather on distribution networks is manifested in the significant increase in line fault rates and the occurrence of multiple line faults. Given the multitude of distribution network lines and the vast number of fault scenarios corresponding to different meteorological conditions, each with varying line fault rates, it is feasible to select typical fault scenarios based on their randomness. These scenarios can then provide the line fault rates necessary for research on distribution network fault recovery. Information entropy is a method used to quantify the disorder in a system (Shannon, 1948). The selection of typical fault scenarios based on the fault rates of distribution network lines involves choosing scenarios with a high probability of occurrence. The information entropy is represented as Eq. 9:
Each fault scenario corresponds to an vector, representing the entropy value of the system under that scenario. The occurrence probability of a typical fault scenario is relatively high, so its information entropy should not be too large or too small and must satisfy the Eq. 10:
By calculating the entropy values of the distribution network under different scenarios and selecting typical fault scenarios based on reasonable entropy value limits, the fault lines corresponding to these entropy values can be identified. These identified fault lines are then used for the next step in the study of distribution network fault recovery measures.
2.3 Fault recovery process for distribution networks under extreme weather scenarios
The fault recovery process for distribution networks under extreme weather scenarios is illustrated in Figure 1.
FIGURE 1

Fault recovery process of distribution network under extreme weather scenarios.
Step 1: Input meteorological parameters for the extreme weather scenario and relevant data about the distribution network structure.
Step 2: Calculate the distribution of fault rates for each line under the current meteorological parameters using the ice load-based line fault rate model.
Step 3: Generate multiple fault scenarios by changing meteorological parameters, and calculate the corresponding entropy values using the information entropy formula.
Step 4: Determine whether the selected scenario is a typical fault scenario. If it is, select the high fault rate lines in that scenario and formulate a fault recovery strategy for them. if not, return to Step 2.
3 Robust fault recovery strategy for multi-source distribution networks interconnected with SOPs
3.1 Objective function
The objective is to minimize the sum of the load shedding amount, network loss cost, and DG operating cost, which is represented as:
Analyzing Eq. 11, it's evident that the objective function of the proposed robust fault recovery strategy is a min-max-min problem: The first layer min problem uses as the decision variable, aiming to generate a network topology with the least load shedding. The second layer max problem uses as the decision variable to find the worst-case fluctuation scenario for DG injection power within the given uncertainty set . The third layer min problem uses as the decision variable.
3.2 Constraints
The constraints of the robust fault recovery strategy include power flow equations, system operational safety constraints, SOP operation constraints, and radial network configuration constraints. This paper constructs the distribution network branch power flow equations based on the second-order cone programming model proposed in literature (
Farivar and Low, 2013), which include node injected power balance Eq.
12and branch voltage drop Eq.
13. The specific forms are as follows:
(1) Node Injected Power Balance Equation
(2) Branch Voltage Drop Equation
During the fault recovery process, changes in the distribution network topology necessitate the relaxation of the branch flow voltage equation using the big-M method. When a branch
is open, i.e.,
= 0, the branch flow voltage equation need not be satisfied. Conversely, when a branch
is closed, i.e.,
= 1, the branch voltage drop equation must be strictly adhered to. The revised Eq.
13is as follows:
(3) System Operational Safety Constraints
System operational safety constraints include node voltage Eq. 15 and branch capacity Eq. 16. Node voltage constraints ensure that the voltage at each node remains within a safe operating range during the fault recovery period. The constraint is represented as Eq. 15:
Branch capacity constraints ensure that the power in each branch does not exceed limits. The constraint is represented as Eq.
16:
(4) SOP Operating Constraints
(5) Description of DG Output Uncertainty
Instead of representing DG output with a single deterministic forecast value, a box-type interval model is constructed as Eq. 22:where is the “uncertainty parameter” for the possible values of the uncertain quantity, which can be chosen from the set {0, −1, 1}.
To contrast with the robust fault recovery model proposed in this paper, a deterministic fault recovery model is established as follows. The objective function of the deterministic model is to minimize the load shedding amount, network loss, and DG operating costs, specifically formulated as Eq. 23:
The constraint conditions, aside from the node injected power balance constraint, are the same as those in the robust fault recovery model. In the deterministic recovery model, the uncertainty of DG output is not considered, and the node injected power balance Eq. 12 is modified to Eq. 24:
In summary, the objective function of the robust fault recovery model proposed in this paper is represented by Formula 11, with constraints including node injected power balance Eq. 12, branch voltage drop Eq. 14, node voltage Eq. 15, branch capacity Eq. 16, SOP operating Eqs 17–21, and DG uncertainty set (22). This model is a two-stage robust optimization form of a min-max-min problem with certain constraints and belongs to a large-scale combinatorial optimization problem, which is challenging to solve directly. The robust fault recovery model Eqs 11–22 and the deterministic model Eqs 13–21, 23, 24 provide a comprehensive framework for addressing fault recovery in power distribution networks under uncertain conditions.
4 Model transformation and solution
4.1 Compact form of the model
To better illustrate the algorithm’s process, the two-stage robust optimization model Eqs 11–22 are integrated into the following compact form:
Model Eqs 25–28 present a two-stage optimization problem that is challenging to solve directly. To address this, the C&CG algorithm is employed to decompose the two-stage robust optimization model into a master problem and sub-problems, which are then solved iteratively.
4.2 Master problem
The master problem decides the network topology under the condition that the output power of each DG unit, , is already determined. The expression for the master problem is:
A real variable is introduced to replace the max-min problem in Eq. 25, and Eq. 31 is added to obtain a relaxed problem as shown in Eqs 29–34.
4.3 Subproblem
The subproblem, solved after determining the network topology in the first phase, finds the worst-case fluctuation scenario of distributed generation . The subproblem is described as Eqs 35–37:
The subproblem is a max-min, two-layer optimization problem, which is difficult to solve directly. To address this, dual theory is applied to transform the inner min problem into its corresponding max problem, which is then combined with the outer max problem to form a single-layer max problem. The transformed subproblem expression is:where are the dual variables for Eqs 36, 37. is the dual variable for Eq. 38.
The objective function of the subproblem (39) contains the nonlinear, bilinear term , which needs to be processed for easier solving of the model. The big-M method can be used to linearize as follows:where is a new variable introduced, which represents the dot product of the corresponding elements of the variables and .
4.4 C&CG algorithm
The basic principle of robust optimization is to transform the original robust optimization model into a two-stage optimization problem, which is then solved using the C&CG algorithm. The algorithm iteratively solves the master and subproblems, adding the columns generated by the subproblem to the constraints of the master problem. The optimal result is output when both the upper and lower bounds meet the convergence precision. The model-solving process of the C&CG algorithm is illustrated in Figure 2.
FIGURE 2
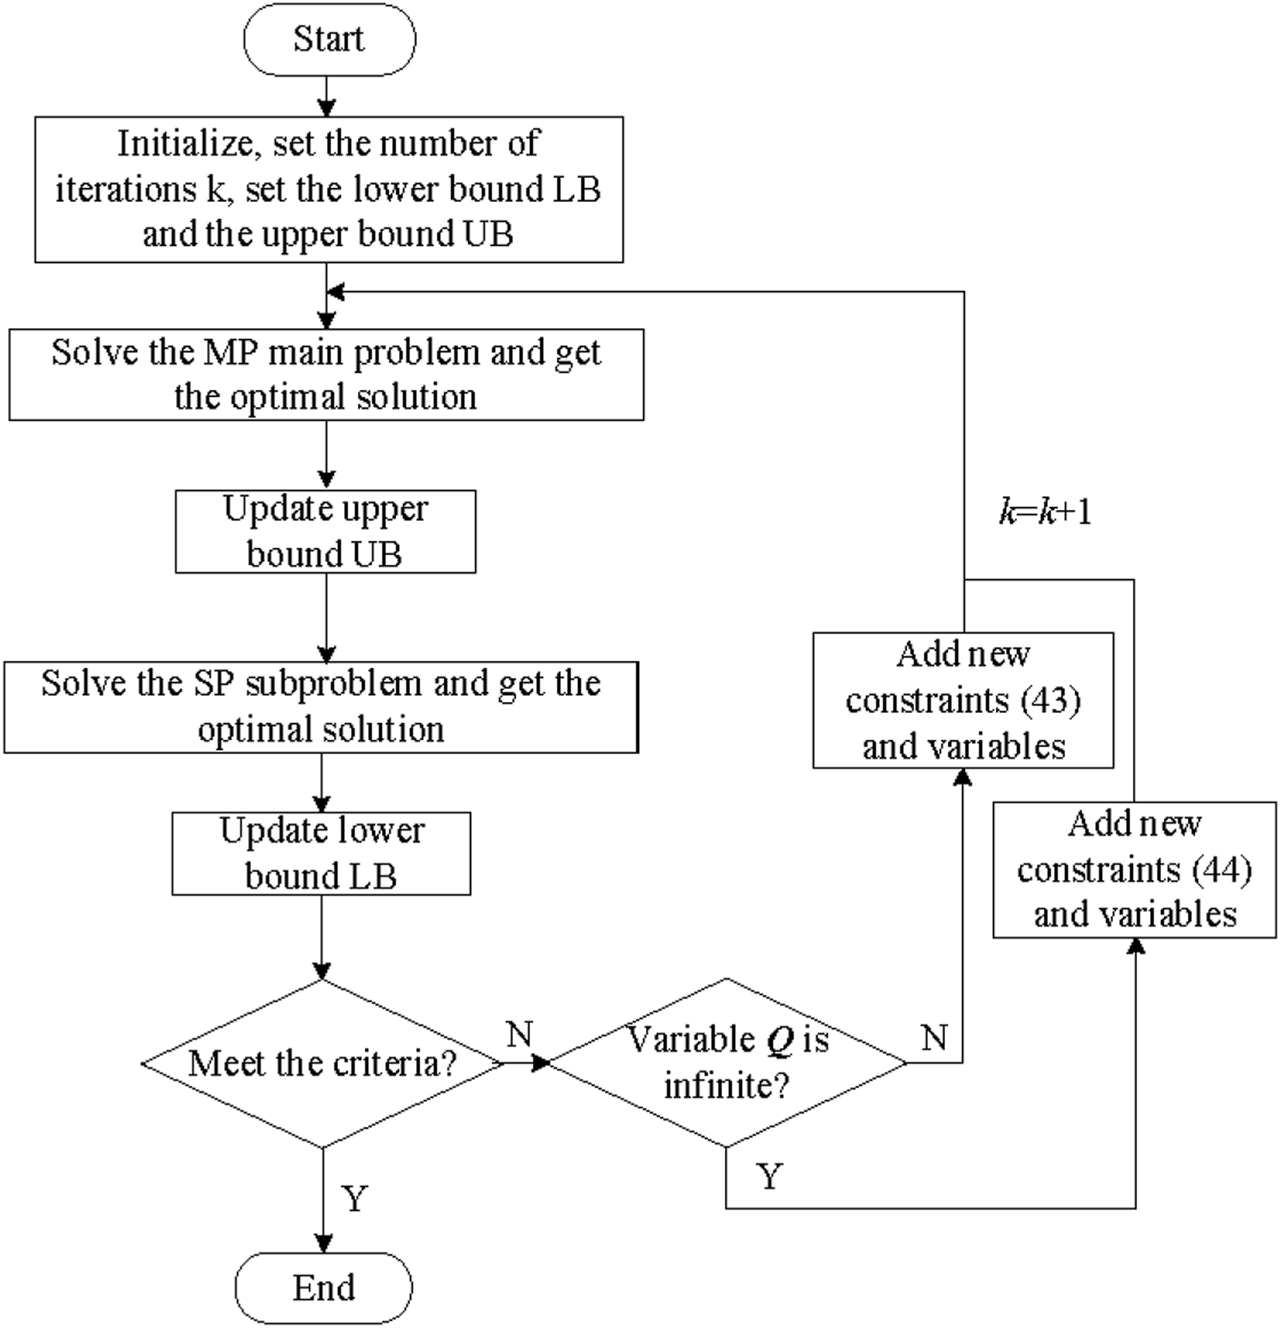
Model solving process of C&CG algorithm.
The specific iterative process is as follows:
Step 1: Initialize data, set the upper and lower bounds of the objective, let , = 0, and set O as an empty set.
Step 2: Solve the master problem Eqs 29–34, obtaining the optimal solution , and update the lower bound of the original problem.
Step 3: Substitute the given from the master problem into the subproblem Eqs 39–42, solve the worst-case scenario and the optimal objective function value , and update the upper bound of the original problem.
Step 4: Check if the convergence condition
is met. If yes, the iteration is complete, and the current optimal solution is output. If not, proceed as follows:
where
is the optimal value from Step 4). Set
,
, and return to Step 2.
(2) If , create a new decision variable , add the Eq. 44 to the master problem:
Update the constraint set accordingly. Set and return to Step 2.
5 Case analysis
To analyze the fault recovery of distribution networks under extreme weather scenarios, a test was conducted using an interconnected distribution system based on SOPs. This system consists of three IEEE 33-node systems interconnected with SOPs (Yuduo Zhao et al., 2022). The initial topology, as shown in Figure 3, illustrates that the tie switches, represented by dashed lines, are initially open. A coordinate system is established with node 1 of Distribution Network A as the origin. The load data and line impedance for each IEEE 33-node system are referenced from (Shaheen et al., 2021).
FIGURE 3
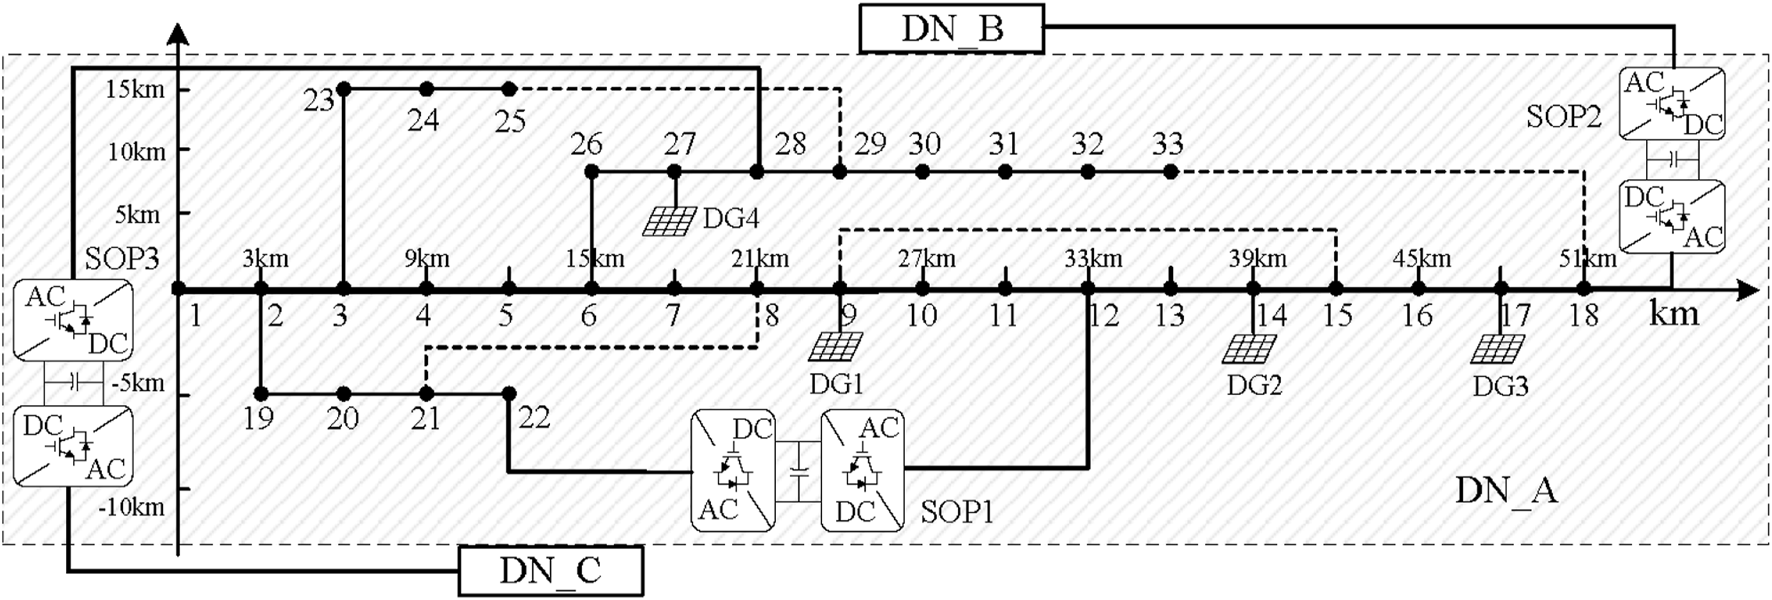
Modified IEEE 33-node distribution system based on SOP interconnection.
Following the method proposed in (Lu Zhang et al., 2018), the positions for integrating DG and SOPs were determined. Four DG units were integrated into Distribution Network 1 at nodes 9, 14, 17, and 27, each with a predicted active power output of 150 kW and a power factor set at 0.9 (Zhu et al., 2017). The loads were classified according to their importance levels, with each load level and its corresponding weight settings presented in Table 1. SOP1 was connected between nodes a12 and a22 of Distribution Network 1, SOP2 between node a18 of Distribution Network 1 and node b18 of Distribution Network 2, and SOP3 between node a28 of Distribution Network 1 and node c28 of Distribution Network 3. All SOPs were set with a capacity of 200 kVA and a loss coefficient of 0.02. The permissible voltage fluctuation range at the nodes was set between 0.95 and 1.05 p.u. In the objective function, and were set to 100 and 1, respectively.
TABLE 1
| Load level | Node number | Total load/kW | Load weight |
|---|---|---|---|
| Primary load | 1–3, 9–11, 14, 32, 33 | 745 | 100 |
| Secondary load | 4, 5, 12, 15, 18–21, 25, 26, 29 | 1260 | 10 |
| Tertiary load | 6–8, 13, 16, 17, 22–24, 27, 28, 30, 31 | 1710 | 1 |
Grade and weight of load.
The effectiveness of fault recovery was assessed using the load recovery rate, defined as the ratio of the restored load to the total load lost before restoration. The recovery rates for primary, secondary, and tertiary loads were denoted as , , with the total load recovery rate also represented by . This case study aims to evaluate the performance of the proposed fault recovery strategies in restoring different levels of loads in the interconnected distribution network under adverse weather conditions.
5.1 Line fault rate analysis in typical fault scenarios
In the simulated scenario, the distribution network is under snowstorm conditions with an ambient temperature of −5°C, wind speed of 10 km/h, and precipitation rate of 40 mm/h. The center of the snowstorm, located at coordinates (−150 km, −150 km), moves towards the distribution network at a speed of 4.2 km/h in the 45° direction along the x-axis. The climate impact radius R is set at 130 km, with R values of 0.4 for line ice coverage fault rate, 0.18 for line fault rate, and 0.1 for pole ice coverage fault rate, increasing to 0.46 and 0.43, respectively, as conditions worsen. Over time, both the ice thickness and the line-pole fault rates change. Figure 4 illustrates the ice thickness and line-pole fault rates for this fault scenario.
FIGURE 4
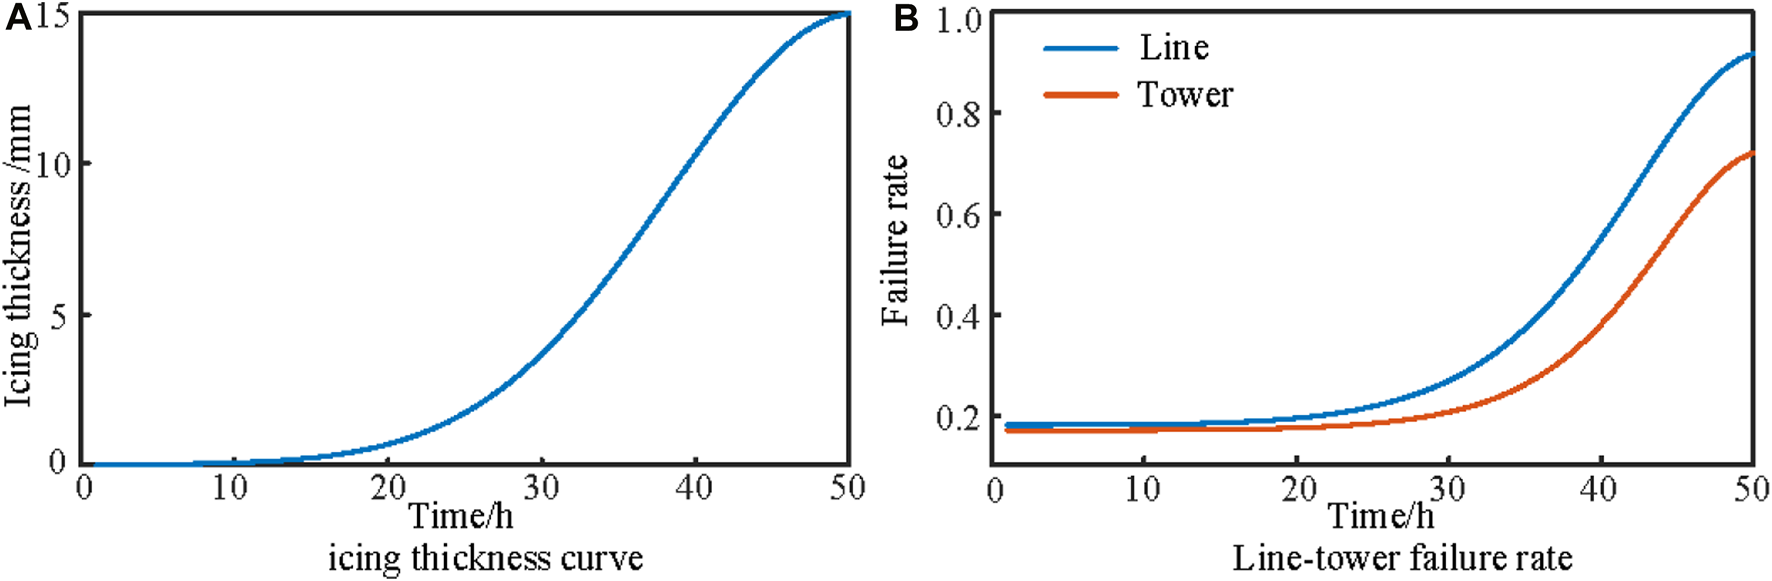
Icing thickness curve and line-tower failure rate. (A) Icing thickness curve; (B) Line-tower failure rate.
Figure 4A shows that as the snowstorm center moves closer to the distribution network, the ice layer thickness on the lines rapidly increases. Figure 4B indicates that with the increase in ice layer thickness, the fault rates of lines and poles first experience a slow growth, then the line fault rate exhibits an exponential increase after 20 h, and the pole fault rate rises rapidly after 30 h. Line breakage may occur if the ice thickness exceeds the line’s load-bearing capacity.
By varying environmental temperature, precipitation rate, snowstorm center location, and movement speed, various extreme ice and snow disaster scenarios can be simulated. The entropy value corresponding to each scenario can be calculated using Eq. 9, with the probability distribution of the system’s information entropy shown in Figure 5. The higher the probability of occurrence of an entropy value, the more likely the scenario is considered a typical fault scenario.
FIGURE 5
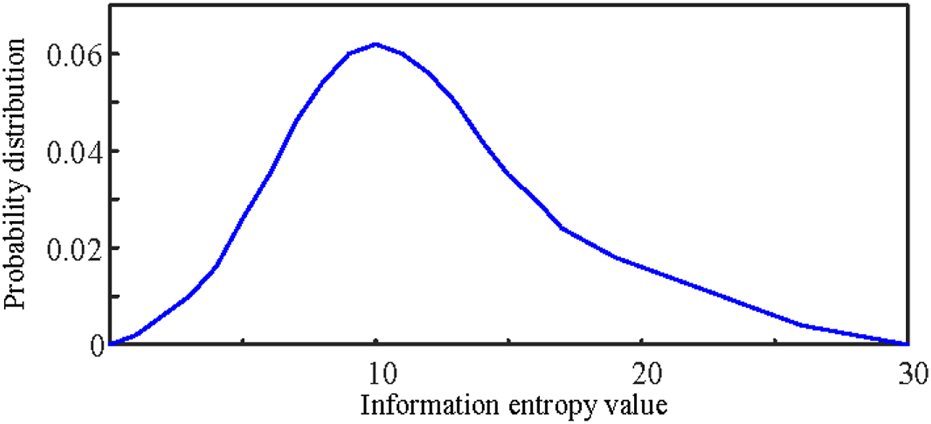
Entropy probability distribution.
For this simulation, the fault rates of each line in Distribution Network 1 are shown in Figure 6. The entropy value calculated for this scenario using Eq. 9 is 14.71. According to Figure 5, this entropy value has a high probability of occurrence, marking it as a typical extreme ice and snow fault scenario. Figure 6 reveals that Lines 1 (a1-a2) and 18 (a2-a19) in Distribution Network 1 have higher fault rates than other lines, indicating that these lines are relatively vulnerable within the system and more prone to faults due to ice and snow disasters. Consequently, the fault recovery strategies proposed in this paper will be applied specifically to these two high-fault-rate lines to formulate fault recovery plans.
FIGURE 6
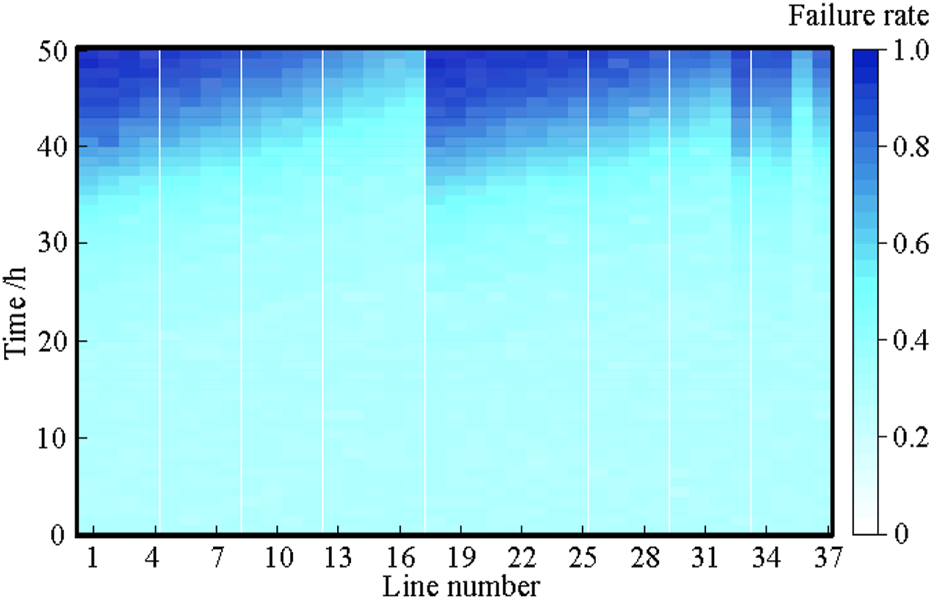
Failure rate of each line.
5.2 Impact of SOP integration on fault recovery effectiveness
For Distribution Network 1, Lines 1 and 18 were selected as fault lines, leading to the cessation of all loads from nodes a2 to a33, resulting in a substantial active power loss of up to 3715 kW. To analyze the impact of SOP integration on fault recovery, three SOP integration scenarios were tested:
Scenario 1: Fault recovery through internal SOP1 and network reconfiguration in Distribution Network 1. Scenario 2: Based on Scenario 1, connecting Distribution Network 2 through SOP2. Scenario 3: Based on Scenario 1, connecting Distribution Networks 2 and 3 through SOP2 and SOP3, respectively.
The fault recovery effects for these three scenarios are shown in Table 2.
TABLE 2
| Scheme | Loss of electric power node | Load shedding/kW | /% | /% | /% | /% |
|---|---|---|---|---|---|---|
| Before recovery | 2–33 | 3715 | 0 | 0 | 0 | 0 |
| 1 | 2–4, 7, 8, 14, 19, 23–25,29–32 | 2530 | 30.20 | 40.47 | 26.31 | 31.89 |
| 2 | 7, 8, 14, 24, 25, 29–32 | 2040 | 55.70 | 57.14 | 31.58 | 45.09 |
| 3 | 7, 8, 24, 25, 31–33 | 1660 | 63.75 | 66.67 | 43.27 | 55.31 |
Fault recovery effect of distribution network under three schemes.
Table 2 reveals that Scenario 1 has the lowest total load recovery rate at 31.89%. This is due to the disconnection of Distribution Network 1 from the main power source, with the required active power for loads being supplied only by internal DG and transmitted through internal SOP1, which also provides reactive power compensation. The fault recovery capacity in this scenario is limited. Comparing Scenarios 1 and 2, the total load recovery rate in Scenario 2 increases to 45.09%, indicating that connecting Distribution Network 1 with Network 2 through SOP2 allows flexible power transmission control, restoring more lost loads. Scenario 3 has the highest total load recovery rate at 55.31%, as the faulted distribution network is interconnected with Networks B and C through two SOPs, allowing two power sources to support power restoration in the outage area. However, not all loads are restored under this SOP capacity, as the capacity of SOP influences its power flow transfer ability and consequently affects the fault recovery outcome.
To analyze the impact of SOP capacity, Scenario 3 was tested under four different SOP capacities: 200, 400, 600, and 800 kVA, and the fault recovery conditions and SOP output powers were assessed. The influence of SOP capacity on fault recovery effectiveness is shown in Table 3.
TABLE 3
| SOP capacity/kVA | Loss of electric power node | Load shedding/kW | /% | /% | /% | /% |
|---|---|---|---|---|---|---|
| 200 | 7, 8, 24, 25, 31–33 | 1660 | 63.75 | 66.67 | 43.27 | 55.31 |
| 400 | 7, 24, 25 | 1040 | 100 | 66.67 | 63.74 | 72.01 |
| 600 | 24 | 420 | 100 | 100 | 75.44 | 88.69 |
| 800 | -- | 0 | 100 | 100 | 100 | 100 |
Effect of SOP capacity on fault recovery.
As indicated in Table 3, as the integrated SOP capacity in the system increases, the fault recovery capability of the distribution network continuously strengthens. With a single SOP capacity of 200 kVA, the total load recovery rate is relatively low at 55.31%, with a primary load recovery rate of only 63.75%, indicating poor recovery effectiveness. At 400 kVA, the total load recovery rate improves to 72.01%, with primary loads fully restored, and a slight increase in the tertiary load recovery rate. At 600 kVA, nodes a7 and a25 are restored, with a high total load recovery rate of 88.69%, including 100% recovery for primary and secondary critical loads. With 800 kVA, the total SOP capacity accounts for 64.60% of the load power, with strong power flow transfer capability, resulting in the restoration of all lost loads.
The active power outputs of SOPs under four different capacities are shown in Figure 7.
FIGURE 7
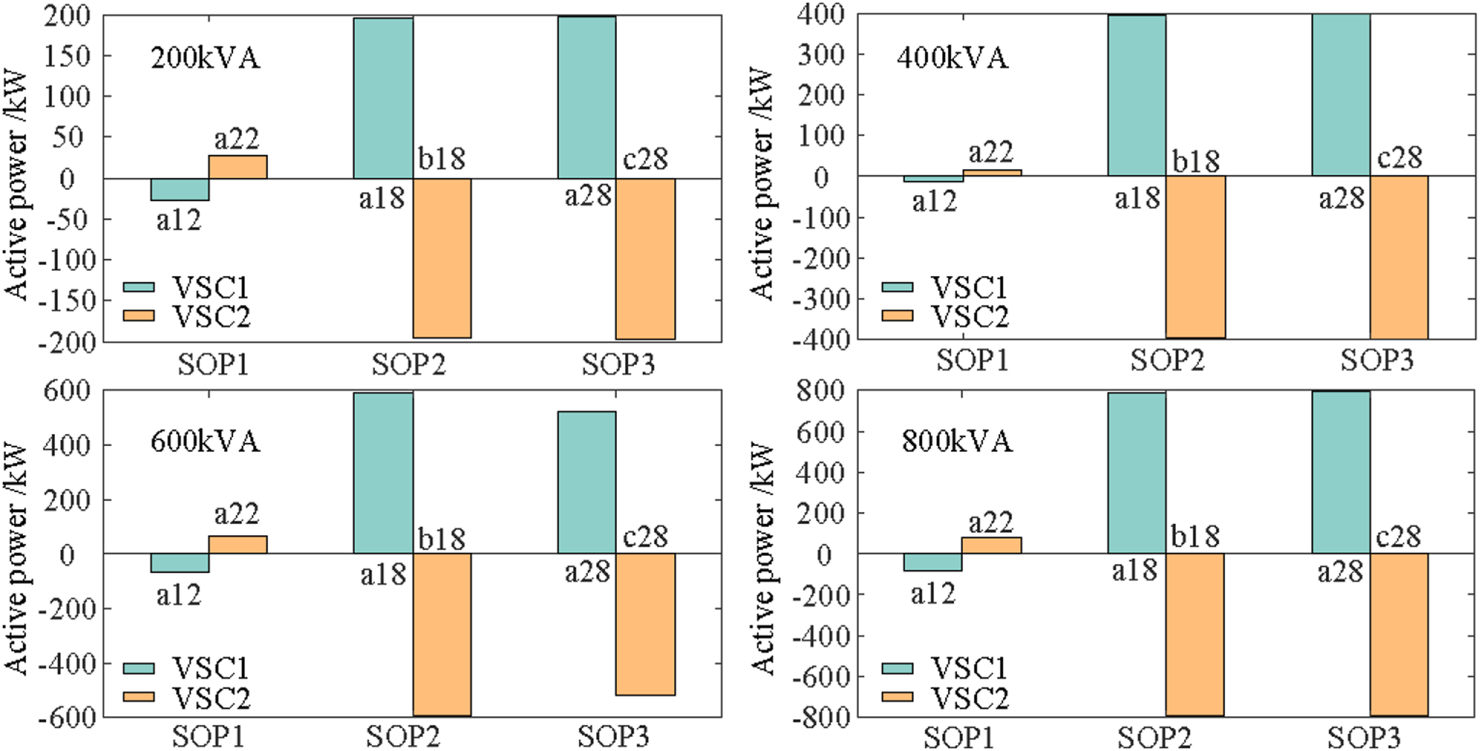
Active power output of SOP.
Figure 7 shows that for all four SOP capacities, the active power of VSC a12 in Distribution Network 1 is negative, while VSC a22’s is positive, indicating that the active power flow on the SOP is from node a12 to node a22. After Distribution Network 1 is disconnected from the main power source, VSC a12 obtains electrical energy from nearby DGs at nodes a9 and a14. VSC a22, lacking nearby DG resources, receives active power transmitted through SOP1 from node a12 to restore the lost loads 19–22. For SOP2 connecting Distribution Networks 1 and 2, the active power of VSC a18 is positive, and that of VSC b18 is negative, indicating active power flow from Network 2’s node b18 to Network 1’s node a18. Similarly, SOP3 injects active power from Distribution Network 3 into Network A’s node a28 to provide electricity for the lost loads.
5.3 Impact of DG injection power on fault recovery effectiveness
Considering that the integration of DG changes the system’s power flow distribution and affects the fault recovery outcome, this section analyzes the impact of DG integration on fault recovery. Based on the integration of three 200 kVA SOPs, a comparative analysis was conducted with different levels of DG injection power. The fault recovery effects under varying DG injection power levels are presented in Table 4.
TABLE 4
| Injected power of DG/kW | Loss of electric power node | Load shedding/kW | /% | /% | /% | /% |
|---|---|---|---|---|---|---|
| 150 | 7, 8, 24, 25, 31–33 | 1660 | 63.75 | 66.67 | 43.27 | 55.31 |
| 225 | 7, 8, 20–22, 24 | 1090 | 100 | 85.71 | 46.78 | 70.66 |
| 300 | 7, 8, 16 | 460 | 100 | 100 | 73.10 | 87.62 |
| 375 | -- | 0 | 100 | 100 | 100 | 100 |
Fault recovery effect under different DG injection Power.
Table 4 shows that with the increase in DG injection power, the total load recovery rate correspondingly rises from 55.31% to 100.0%. When the DG injection power is 150 kW, only 63.75% of primary load can be restored, indicating low power supply reliability. At a DG injection power of 225 kW, the recovery rate of primary load increases from 63.75% to 100%, and the recovery rates of secondary and tertiary loads also rise. With 300 kW of DG injection power, primary and secondary critical loads are fully restored, and the tertiary load recovery rate increases to 73.10%. At 375 kW, DG within the Distribution Network 1 accounts for 40.38% of the total load power, enabling the recovery of all loads. Thus, it is evident that DG injection power plays a positive role in fault recovery. DG injection power can locally meet the demands of nearby loads, enabling more loads to be restored.
5.4 Comparison of recovery effects between two fault recovery strategies
To demonstrate the effectiveness of the robust fault recovery strategy for distribution networks proposed in this paper, a comparison of fault recovery effects between deterministic and robust strategies was conducted. In the deterministic recovery strategy, DG power remains at the forecasted value, while in the robust strategy, DG output fluctuates within the range of an uncertainty set. With a single SOP capacity of 200 kVA and the same parameter settings, the fault recovery effects of the two strategies are shown in Table 5.
TABLE 5
| Strategy | Loss of electric power node | Load shedding/kW | /% | /% | /% | /% |
|---|---|---|---|---|---|---|
| Deterministic strategy | 7, 8, 24, 25, 31–33 | 1660 | 63.75 | 66.67 | 43.27 | 55.31 |
| Robust strategy | 7, 8, 21, 22, 24, 25 | 1420 | 100 | 59.52 | 46.78 | 61.78 |
Fault recovery effect of two fault recovery strategies.
As evident from Table 5, the recovery effect of the robust strategy is superior to that of the deterministic strategy. The deterministic strategy, which bases the network topology on the predicted values of DG, has weaker adaptability to uncertainties, resulting in a lower total load recovery rate of only 55.31%. In contrast, the robust strategy, considering the worst-case DG output samples, achieves an improved total load recovery rate of 61.78%. Furthermore, it ensures 100% recovery of primary loads, though the recovery rate of secondary loads is slightly reduced. It is apparent that the proposed robust strategy yields better recovery results than the deterministic strategy and possesses a superior ability to adapt to the uncertainties in DG output.
To verify the scalability of the proposed method in large-scale actual systems, an analysis was conducted using a 234-node system interconnected by SOPs. This system consists of three 78-node systems interconnected through SOPs (Ji et al., 2023). In Distribution Network A, 7 DGs were connected at nodes 5, 24, 29, 47, 52, 60, and 78, with each having a forecasted active power of 150 kW and a power factor set to 0.9. SOP1 connects to Distribution Network A at nodes a22 and a59, SOP2 connects Distribution Network A at node a18 and Distribution Network B at node b18, and SOP3 connects Distribution Network A at node a28 and Distribution Network C at node c28, with each having a capacity set to 1000kVA and a loss coefficient of 0.02. Two fault recovery strategies, deterministic recovery strategy and robust recovery strategy, were compared. Table 6 presents the recovery effects of the two fault recovery strategies under the same fault location and parameter settings.
TABLE 6
| Strategy | Loss of electric power node | Load shedding/kW | /% | /% | /% | /% |
|---|---|---|---|---|---|---|
| Deterministic strategy | 34, 35, 53, 57, 58, 69, 70, 76 | 1850.6 | 91.33 | 53.69 | 91.17 | 76.08 |
| Robust strategy | 34, 35, 50, 53, 57, 58 | 1440.4 | 100 | 59.96 | 91.17 | 81.38 |
Fault recovery effect of two fault recovery strategies.
From Table 6, it is evident that the robust strategy still outperforms the deterministic strategy in terms of load recovery effectiveness. The deterministic strategy exhibits a weaker adaptability to the uncertainty of DGs, with a total load recovery rate of 76.08%. In contrast, the robust strategy achieves an improved total load recovery rate of 81.38%, with critical loads being fully restored to 100%. Thus, in large-scale actual systems, the proposed robust strategy can achieve better recovery outcomes than the deterministic strategy.
6 Conclusion
To enhance the distribution network’s capability to cope with extreme ice and snow disasters, this paper proposes a robust fault recovery strategy for multi-source distribution networks under extreme weather conditions. Simulation analyses were conducted on systems with modified IEEE 33-node interconnected by SOPs, leading to the following conclusions:
(1) For lines with a high fault rate under typical extreme ice and snow disaster scenarios, pre-established fault recovery strategies enable the rapid restoration of lost loads after actual faults occur, thus improving the distribution network’s ability to handle extreme ice and snow disasters.
(2) The proposed fault recovery strategy makes full use of the flow control capabilities of SOPs and the power support of DGs. The coordination of SOPs with network reconstruction effectively restores power supply to lost loads, enhancing the fault recovery capability of the distribution network.
(3) The proposed strategy accounts for the uncertainty of DG output, demonstrating superior adaptability to the uncertainties of DG output compared to deterministic strategies.
Future research focuses only on fault scenarios related to ice and snow weather disasters. It will be more practically significant to consider a wider range of fault scenarios in future studies.
Statements
Data availability statement
The original contributions presented in the study are included in the article/Supplementary material, further inquiries can be directed to the corresponding author.
Author contributions
TB: Methodology, Writing–original draft. HL: Conceptualization, Writing–review and editing. ZL: Validation, Writing–review and editing. ZH: Resources, Writing–review and editing. WK: Validation, Writing–review and editing.
Funding
The author(s) declare that financial support was received for the research, authorship, and/or publication of this article. This research was funded by the Science and Technology Project of Hebei Electric Power Company of State Grid (SGHEXA00GDJS2250285).
Conflict of interest
Authors TB, HL, ZL, ZH, WK, and ZP were employed by the State Grid Xiongan New Area Electric Power Supply Company.
The authors declare that this study received funding from the Science and Technology Project of Hebei Electric Power Company of State Grid. The funder had the following involvement in the study: study design, data collection and analysis, decision to publish, or preparation of the manuscript.
Publisher’s note
All claims expressed in this article are solely those of the authors and do not necessarily represent those of their affiliated organizations, or those of the publisher, the editors and the reviewers. Any product that may be evaluated in this article, or claim that may be made by its manufacturer, is not guaranteed or endorsed by the publisher.
Nomenclature
| Indices | |
| Set of distribution network lines | |
| Set of all load nodes | |
| Set of all branches | |
| Set of uncertainties for dg output | |
| Number of iterations | |
| Parameters | |
| Ice load on the line | |
| Coordinate of line | |
| Movement speed of the snowy weather | |
| Ice growth rate on the line | |
| Outer diameter of the line | |
| Ice growth rate factor | |
| Ambient temperature | |
| Wind speed | |
| Precipitation rate | |
| Constant | |
| Thickness of ice covering the line | |
| Outer diameter of the line | |
| Design ice load of the line | |
| Constants used to calibrate the line ice fault rate and ice load ratio | |
| Weight coefficient of loads to distinguish between primary, secondary, and tertiary loads | |
| Active load demand at node | |
| Resistance of branch | |
| Cost coefficients of DG operation | |
| Resistance and reactance of branch | |
| Resistance and reactance of branch | |
| Maximum active power limit of branch | |
| Maximum reactive power limit of branch | |
| Square of the maximum allowable current in branch | |
| Weighting coefficients of the objective function | |
| Variables | |
| Coordinates of the blizzard center changing over time | |
| Load parameters corresponding to the and axes of the line, respectively | |
| Line ice fault rate | |
| Line ice load ratio | |
| Fault rate of line | |
| Fault rate of the m-th pole of line | |
| Fault rate of the n-th span of line | |
| Information entropy | |
| Time taken for the disaster to pass through the distribution network area | |
| Fault rate of line at moment | |
| Whether a fault occurs on line at moment , with 1 for a fault and 0 otherwise | |
| Binary variables | |
| On-off status of branch and indicating the load status of node | |
| Uncertain variable of DG output | |
| A vector of continuous variables related to distribution network flow optimization | |
| Square of the current magnitude in branch | |
| Active output of DG at node | |
| Active and reactive power flowing through branch , respectively | |
| Active and reactive power flowing through branch , respectively | |
| Square of the current magnitude in branch | |
| Active and reactive power injections at node | |
| Actual active and reactive power outputs of the DG at node | |
| Active and reactive power outputs of the SOP at node | |
| Predicted DG output | |
| Variation in output due to uncertainties | |
| Tangent of the power factor angle | |
| Square of the voltage magnitude at node | |
| Square of the voltage magnitude at node | |
| Active power losses at nodes and for the SOP. | |
| Active and reactive power outputs of the DG at node | |
| First-layer optimization variables | |
| Second-layer optimization variables | |
| Third-layer optimization variables | |
| Auxiliary variable of the C&CG algorithm |
References
1
Ali Arefifar S. Shahin Alam M. Hamadi A. (2023). A review on self-healing in modern power distribution systems. J. Mod. Power Syst. Clean. Energy11, 1719–1733. 10.35833/MPCE.2022.000032
2
Chen W. Zhou X. Li Y. Guo C. (2018). A robust islanding restoration policy for active distribution network considering optimal allocation of emergency electric vehicles. Proc. CSEE38, 58–67. 10.13334/j.0258-8013.pcsee.180968
3
Chen X. Wu W. Zhang B. (2016). Robust restoration method for active distribution networks. IEEE Trans. Power Syst.31, 4005–4015. 10.1109/TPWRS.2015.2503426
4
Dehghani N. L. Jeddi A. B. Shafieezadeh A. (2021). Intelligent hurricane resilience enhancement of power distribution systems via deep reinforcement learning. Appl. Energy285, 116355. 10.1016/j.apenergy.2020.116355
5
Farivar M. Low S. H. (2013). Branch flow model: relaxations and convexification—Part I. IEEE Trans. Power Syst.28, 2554–2564. 10.1109/TPWRS.2013.2255317
6
Gao H. Chen Y. Xu Y. Liu C.-C. (2016). Resilience-Oriented critical load restoration using microgrids in distribution systems. IEEE Trans. Smart Grid7, 2837–2848. 10.1109/TSG.2016.2550625
7
Gao H. Li Z. (2021). A Benders decomposition based algorithm for steady-state dispatch problem in an integrated electricity-gas system. IEEE Trans. Power Syst.36, 3817–3820. 10.1109/TPWRS.2021.3067203
8
Gazijahani F. S. Salehi J. Shafie-khah M. (2022). Benefiting from energy-hub flexibilities to reinforce distribution system resilience: a pre- and post-disaster management model. IEEE Syst. J.16, 3381–3390. 10.1109/JSYST.2022.3147075
9
He C. Wu L. Liu T. Shahidehpour M. (2017). Robust Co-optimization scheduling of electricity and natural gas systems via ADMM. IEEE Trans. Sustain. Energy8, 658–670. 10.1109/TSTE.2016.2615104
10
Ji X. Zhang X. Ye P. Zhang Y. Li G. Gong Z. (2023). Dynamic reconfiguration of three‐phase imbalanced distribution networks considering soft open points. Energy Convers. Econ.4, 364–377. 10.1049/enc2.12099
11
Jufri F. H. Widiputra V. Jung J. (2019). State-of-the-art review on power grid resilience to extreme weather events: definitions, frameworks, quantitative assessment methodologies, and enhancement strategies. Appl. Energy239, 1049–1065. 10.1016/j.apenergy.2019.02.017
12
Li P. Ji J. Ji H. Song G. Wang C. Wu J. (2020a). Self-healing oriented supply restoration method based on the coordination of multiple SOPs in active distribution networks. Energy195, 116968. 10.1016/j.energy.2020.116968
13
Li W. Li Y. Chen C. Tan Y. Cao Y. Zhang M. et al (2020b). A full decentralized multi-agent service restoration for distribution network with DGs. IEEE Trans. Smart Grid11, 1100–1111. 10.1109/TSG.2019.2932009
14
Li Y. Xiao J. Chen C. Tan Y. Cao Y. (2019). Service restoration model with mixed-integer second-order cone programming for distribution network with distributed generations. IEEE Trans. Smart Grid10, 4138–4150. 10.1109/TSG.2018.2850358
15
Li Z. Xu Y. Wang P. Xiao G. (2023). Coordinated preparation and recovery of a post-disaster Multi-energy distribution system considering thermal inertia and diverse uncertainties. Appl. Energy336, 120736. 10.1016/j.apenergy.2023.120736
16
Liu J. Qin C. Yu Y. (2020). Enhancing distribution system resilience with proactive islanding and RCS-based fast fault isolation and service restoration. IEEE Trans. Smart Grid11, 2381–2395. 10.1109/TSG.2019.2953716
17
Lu R. Ding T. Qin B. Ma J. Fang X. Dong Z. (2020). Multi-stage stochastic programming to joint economic dispatch for energy and reserve with uncertain renewable energy. IEEE Trans. Sustain. Energy11, 1140–1151. 10.1109/TSTE.2019.2918269
18
Nasri A. Abdollahi A. Rashidinejad M. (2022). Multi-stage and resilience-based distribution network expansion planning against hurricanes based on vulnerability and resiliency metrics. Int. J. Electr. Power and Energy Syst.136, 107640. 10.1016/j.ijepes.2021.107640
19
Shaheen A. M. El-Sehiemy R. A. Kamel S. Elattar E. E. Elsayed A. M. (2021). Improving distribution networks’ consistency by optimal distribution system reconfiguration and distributed generations. IEEE Access9, 67186–67200. 10.1109/ACCESS.2021.3076670
20
Shannon C. E. (1948). A mathematical theory of communication. Bell Syst. Tech. J.27, 379–423. 10.1002/j.1538-7305.1948.tb01338.x
21
Standards Coordinating Committee (2003). IEEE standard for interconnecting distributed resources with electric power systems. IEEE Std 1547-2003, 1–28. 10.1109/IEEESTD.2003.94285
22
Wang B. Zhang C. Dong Z. Y. (2020). Interval optimization based coordination of demand response and battery energy storage system considering SOC management in a microgrid. IEEE Trans. Sustain. Energy11, 2922–2931. 10.1109/TSTE.2020.2982205
23
Wang H. Zhou W. Qian K. Meng S. Chai C. Wong Y. D. et al (2018). Tri-level optimal hardening plan for a resilient distribution system considering reconfiguration and DG islanding. Appl. Energy210, 1266–1279. 10.1016/j.apenergy.2017.06.059
24
Yan M. Shahidehpour M. Paaso A. Zhang L. Alabdulwahab A. Abusorrah A. (2021). Distribution system resilience in ice storms by optimal routing of mobile devices on congested roads. IEEE Trans. Smart Grid12, 1314–1328. 10.1109/TSG.2020.3036634
25
Yang Z. Dehghanian P. Nazemi M. (2020). Seismic-Resilient electric power distribution systems: harnessing the mobility of power sources. IEEE Trans. Ind. Appl.56, 2304–2313. 10.1109/TIA.2020.2972854
26
Yin H. Wang Z. Liu Y. Qudaih Y. Tang D. Liu J. et al (2023). Operational reliability assessment of distribution network with energy storage systems. IEEE Syst. J.17, 629–639. 10.1109/JSYST.2021.3137979
27
Zhang Lu Shen C. Chen Y. Huang S. Tang W. (2018). Coordinated allocation of distributed generation, capacitor banks and soft open points in active distribution networks considering dispatching results. Appl. Energy231, 1122–1131. 10.1016/j.apenergy.2018.09.095
28
Zhao H. Lu Z. He L. Guo X. Li X. Xiao H. (2020). Two-stage multi-fault emergency rush repair and restoration robust strategy in distribution networks. Electr. Power Syst. Res.184, 106335. 10.1016/j.epsr.2020.106335
29
Zhao Y. Xiong W. Yuan X. Zou X. (2022). A fault recovery strategy of flexible interconnected distribution network with SOP flexible closed-loop operation. Int. J. Electr. Power and Energy Syst.142, 108360. 10.1016/j.ijepes.2022.108360
30
Zhou X. Ge S. Li T. Liu H. (2018). Assessing and boosting resilience of distribution system under extreme weather. Proc. CSEE38, 505–513. 10.13334/j.0258-8013.pcsee.162547
31
Zhu J. Gu W. Lou G. Wang L. Xu B. Wu M. et al (2017). Learning automata-based methodology for optimal allocation of renewable distributed generation considering network reconfiguration. IEEE Access5, 14275–14288. 10.1109/ACCESS.2017.2730850
Summary
Keywords
extreme disasters, fault recovery, robust, soft open point, Column and constraint generation
Citation
Baofeng T, Lei H, Lidong Z, Hongtao Z, Kang W and Pengliang Z (2024) Robust fault recovery strategy for multi-source flexibly interconnected distribution networks in extreme disaster scenarios. Front. Energy Res. 12:1345839. doi: 10.3389/fenrg.2024.1345839
Received
28 November 2023
Accepted
27 February 2024
Published
14 March 2024
Volume
12 - 2024
Edited by
Lu Zhang, China Agricultural University, China
Reviewed by
Haiwen Chen, Hebei University of Technology, China
Na Zhang, Inner Mongolia University of Technology, China
Shouxiang Wang, Tianjin University, China
Ghaeth Fandi, Czech Technical University in Prague, Czechia
Updates
Copyright
© 2024 Baofeng, Lei, Lidong, Hongtao, Kang and Pengliang.
This is an open-access article distributed under the terms of the Creative Commons Attribution License (CC BY). The use, distribution or reproduction in other forums is permitted, provided the original author(s) and the copyright owner(s) are credited and that the original publication in this journal is cited, in accordance with accepted academic practice. No use, distribution or reproduction is permitted which does not comply with these terms.
*Correspondence: Tang Baofeng, bftang2023@163.com
Disclaimer
All claims expressed in this article are solely those of the authors and do not necessarily represent those of their affiliated organizations, or those of the publisher, the editors and the reviewers. Any product that may be evaluated in this article or claim that may be made by its manufacturer is not guaranteed or endorsed by the publisher.