 Gang Xu1
 Jie Hu
- 1School of Electrical and Electronic Engineering, North China Electric Power University, Beijing, China
- 2State Grid Economic and Technological Research Institute Co., Ltd., Beijing, China
Effective anomaly detection in power grid engineering is essential for ensuring the reliability of dispatch and operation. Traditional anomaly detection methods based on manual review and expert experience cannot be adapted to the current rapid increases in project data. In this work, to address this issue, knowledge graph technology is used to build an anomaly detection dataset. Considering the over-smoothing problem associated with multi-level GCN networks, a deep skip connection framework for anomaly detection on attributed networks called DIET is proposed for anomaly detection on ultra-high voltage (UHV) projects. Furthermore, a distance-based object function is added to the conventional object function, which gives DIET the ability to process multiple attributes of the same type. Several comparative experiments are conducted using five state-of-the-art algorithms. The results of the receiver operating characteristic with the area under the curve (ROC-AUC) indicator show a 12% minimum improvement over other methods. Other evaluation indicators such as precision@K and recall@K indicate that DIET can achieve a better detection rate with less ranking. To evaluate the feasibility of the proposed model, a parameter analysis of the number of GCN layers is also performed. The results show that relatively few layers are needed to achieve good results with small datasets.
1 Introduction
In recent years, the Chinese economy, industry, and society have progressed significantly. This has led to a tremendous growth in power consumption. Meanwhile, to meet environmental protection demands, carbon peaking and carbon neutralization targets have been proposed (Cao et al., 2023; L; Li et al., 2023; Zhang et al., 2023), which have led to important changes in both electricity production and transmission. The reliability remains an important topic for both power systems and multi-energy systems. However, traditional reliability improvement methods mainly focus on the operation progress, the other important aspect called construction progress which concerns power grid structure and equipment is less studied. Among the whole construction progress, a process called the review of power transmission and transformation projects which exists between the initial design and construction stage is the key to ensure the reliability of power systems. The main purpose of the review step is to find design flaws, and the step is carried out jointly by relevant power design institutes and project review institutes. It mainly consists of four stages: the collection and verification of review data, an evaluation by professionals, the formation of review opinions, and the archiving of project data into a database. An effective anomaly detection method is needed to find unusual features in design plans. At present, the specific processes and details of the review step are relatively complete, but the following problems remain to be addressed:
1) The review documents often contain problems including errors, omissions, and irregular writing. For example, some equipment attribute specifications are incompletely filled in, which can cause problems in the construction stage.
2) There are still deficiencies in the standardization of the review working process, which mainly relies on the experience of professionals. It is less efficient and prone to errors.
3) There are still deficiencies in the handling of new technologies, new equipment, and special engineering environments.
In order to address these problems, studies on the auxiliary review system for power transmission and transformation projects have been conducted. Most researchers process data based on browser-server (B/S) architecture and SQL server databases. Compared with the traditional client-server (C/S) architecture, B/S architecture is highly distributed, simple to develop, highly shareable, and easily maintained. Intelligent review management platforms have been proposed for the design of power transmission and transformation projects above and below 110 kV (Huang, 2018; Li et al., 2021). These systems include key factor extraction, data platform selection, and data analysis. The difference between the two scenarios is the database types adopted, and it has been shown that relational databases can achieve better results in the intelligent review management platform for power transmission and transformation engineering design review. Systems already in operation, such as the Fujian power transmission and transformation project design review system, show that the B/S model system architecture can achieve its best results when handling the entire process of the feasibility study, preliminary design, construction drawing review, construction drawing budget, and completion settlement (Hong, 2014). Due to the flexibility of the architecture, the standardized management of review processes and the templated management of review documents have also been realized. Meanwhile, the China Electric Power Planning & Engineering Institute has established an expert decision-making system that can realize engineering information extraction, plan management, and carry out auxiliary decision-making and other functions based on its own business needs. As the scale of the power grid continues to expand, the efficiency of existing platforms in knowledge acquisition encounters the problem of low efficiency and an inability to meet knowledge reasoning needs.
With the development of artificial intelligence technology, knowledge graph technology, which has the advantages of high scalability, efficient query efficiency, and better visualization, has become an option for building the next-generation of power transmission and transformation engineering auxiliary review platforms. A knowledge graph is an auxiliary knowledge base originally proposed by Google to enhance search engine functions (Y. Song et al., 2023). It uses “entity-relationship-entity” triples to describe objects in the real world and the relationships between them (Pu et al., 2021). It has strong relationship expression, reasoning, and error correction capabilities which could provide strong support for applications in various fields (Ji et al., 2022). Existing research on this topic can be mainly divided into two aspects: knowledge graph construction and graph application. In terms of the construction of knowledge graphs, knowledge extraction based on different business needs is the key. For power systems, a framework for the application of knowledge graphs in power systems has been proposed and the key technologies required to build a domain-specific knowledge graph have been introduced (Pu et al., 2021). Several researchers have constructed knowledge graphs based on their own needs (Guo et al., 2021; Tian et al., 2022; Wang et al., 2023). Although the research objects and specific algorithm models differ, the key algorithms such as named entity recognition, relation extraction, and entity fusion are the same. In terms of graph application, different application cases in multiple fields such as natural disasters in power transmission and transformation lines, electricity consumption by power users, transformer status sensing, and assisted decision-making in distribution network faults have been studied (Ruan et al., 2021; Ye et al., 2022; Chen et al., 2023). At present, the applications of knowledge graphs in the power field mainly include power dispatching (Li et al., 2019; Zhou et al., 2019; Liu et al., 2020), operation and maintenance (Guo et al., 2021; Wang et al., 2021; Shu et al., 2023), and fault handling (Tian et al., 2022; Liu et al., 2023). However, there has been little research on knowledge graph construction based on power transmission and transformation projects.
The goal is to detect defects in power transmission and transformation projects, so a knowledge-graph-based anomaly detection algorithm is needed. As it is an attributed network, there has been a large amount of anomaly detection research based on the graph convolutional network (GCN). An attributed network consists of two components: an adjacency matrix that represents the structural information and an attribute matrix that contains the feature embedding of node attributes. Leveraging GCN as an encoder, DOMINAT has been proposed as a basic model to detect anomalies with a ranking mechanism using both structural and attribute information (Ding et al., 2019). Noticing that the nodes’ attributes are different, ALARM introduced multi-view data into the encoder-decoder framework (Peng et al., 2020). ResGCN, on the other hand, proposed a deep residual modeling approach (Pei et al., 2021). All the methods mentioned above are based on unsupervised learning, and HCM is a self-supervised anomaly detection method that considers the hop counts of global and local information. Moreover, a semi-supervised anomaly detection method has been proposed to tackle datasets with few labeled nodes (Kumagai et al., 2021). Although all the above algorithms achieve good results in their own domains, they all neglect the over-smoothing problem of the deep GCN network, which could reduce node specificity.
To solve the problems mentioned above, a deep skip connection framework for anomaly detection on attributed networks called DIET is proposed in this work. Specifically, to handle the over-smoothing problem, a skip connection mechanism is used, which leverages the former GCN output as input for the next hidden layer. Furthermore, noticing that all the nodes have the additional attribute of entity type, it is intuitive to cluster all the nodes with the same type and use a distance-based algorithm to find anomalies in the group. The rest of this article is structured as follows. A detailed analysis of the requirements for the review of power transmission and transformation projects is provided in Section 2, along with the construction method based on the UHV dataset. The proposed anomaly detection framework, DIET, is presented in Section 3, followed by a detailed case study to evaluate the feasibility of DIET in Section 4. Finally, a conclusion is presented in Section 5.
2 UHV knowledge graph
With the increasing demand for clean energy and the expanding scale of UHV projects, the digital transformation of power grid infrastructure projects is imminent. The review of transmission and transformation projects requires a great deal of professional knowledge, and the massive amounts of data have created challenges. Moreover, traditional intelligent platforms usually use relational databases for data storage, which leads to low knowledge reasoning ability. By constructing a UHV knowledge graph, unstructured historical engineering data can be stored as nodes and relations, making anomaly detection more effective. The construction of a UHV knowledge graph mainly includes three steps: demand analysis, data collection, and graph construction.
2.1 Demand analysis
The review of power transmission and transformation projects is one of the key processes in project construction. It has a direct impact on the equipment selection, the project quantity calculation, and the cost of power grid construction. Compared with general civil construction projects, the evaluation of power transmission and transformation projects is stricter. The main review process of power transmission and transformation projects includes a preliminary design review (including the budget, technical specifications, and safety topics), a construction drawing review (including a rough budget and major design changes), and other reviews of related topics. It involves many fields of power construction, such as primary electrical design, secondary electrical design, power line design, line structure, and substation electrical design. It requires strong professionalism, an understanding of complex processes, and significant experience from reviewers. It is completed jointly by an electric power design institute and a project review institute. The specific process is shown in Figure 1. Some of the key elements of substation, overhead line and cable projects are listed in Tables 1–3.
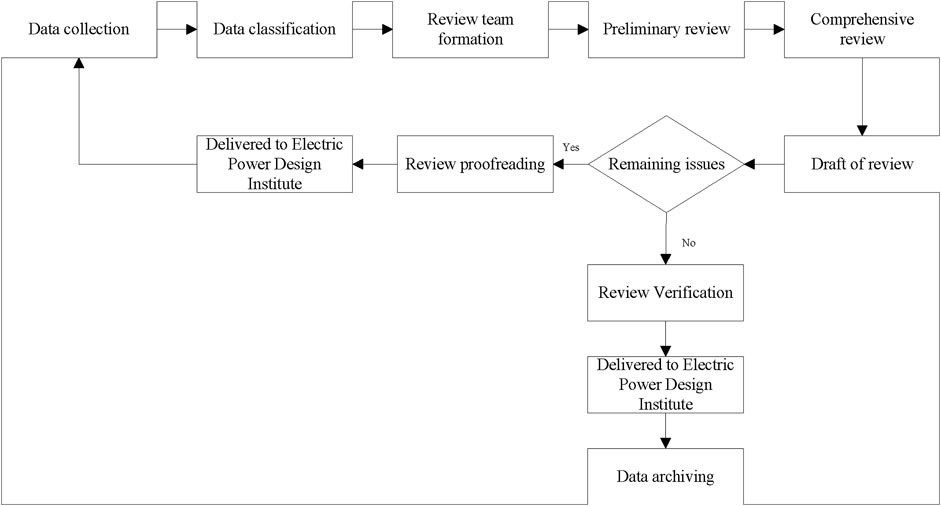
FIGURE 1. The power transmission and transformation project recheck flow chart.
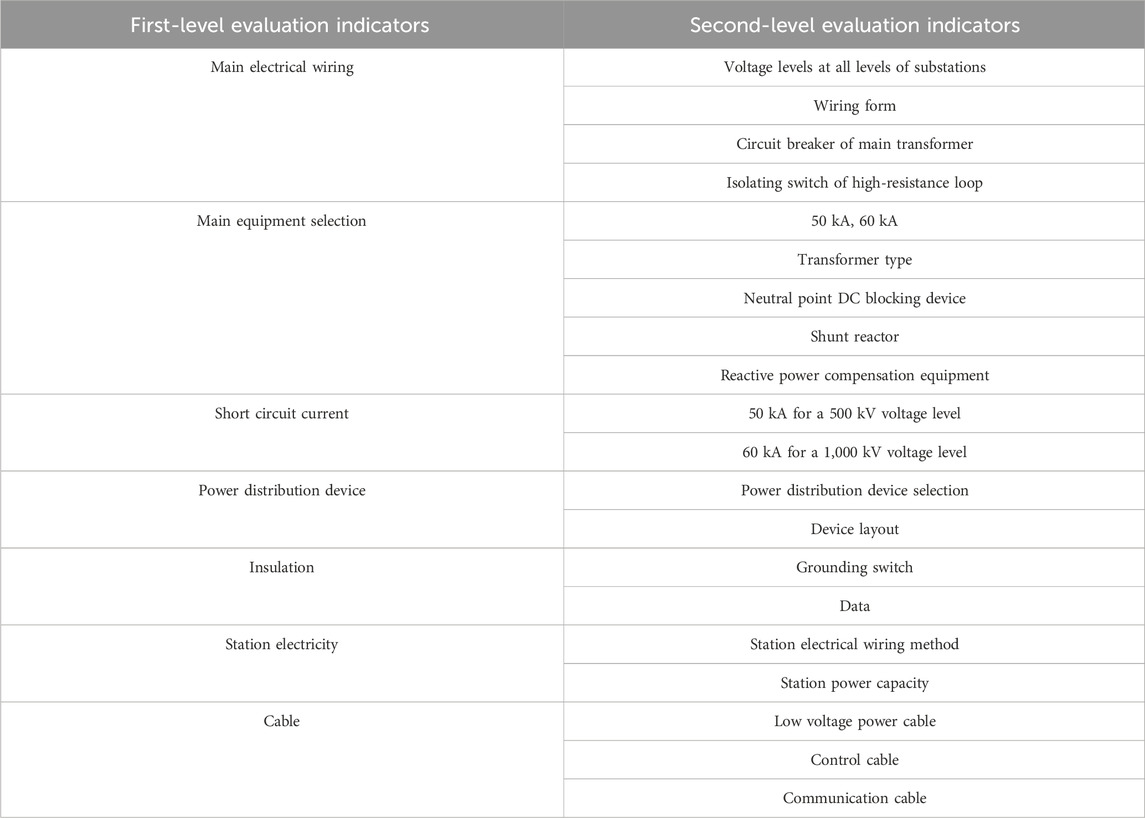
TABLE 1. Part of substation projects review key elements.
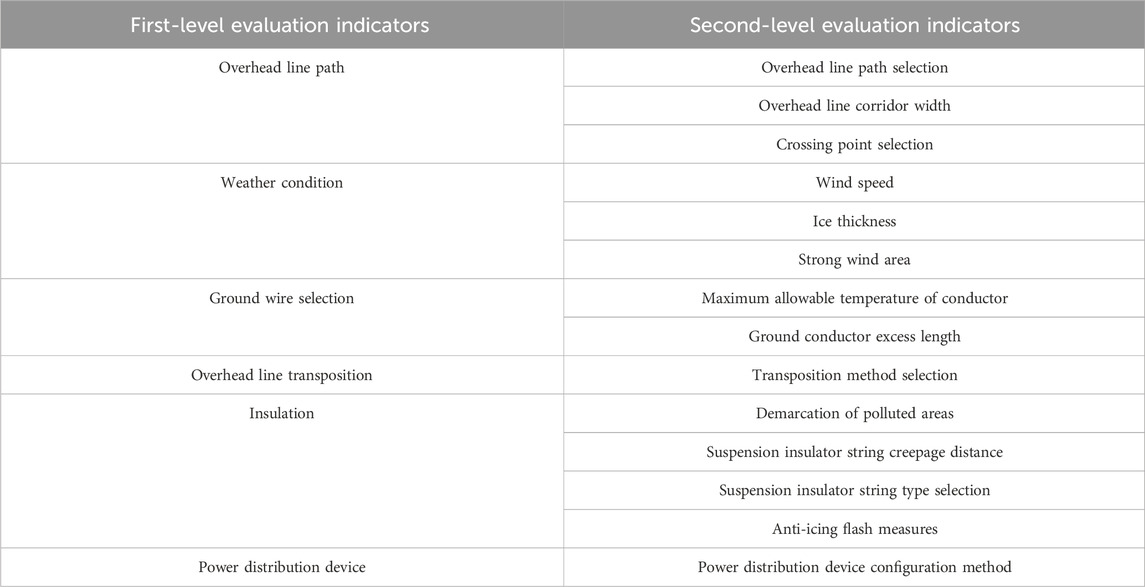
TABLE 2. Part of the overhead line projects review key elements.
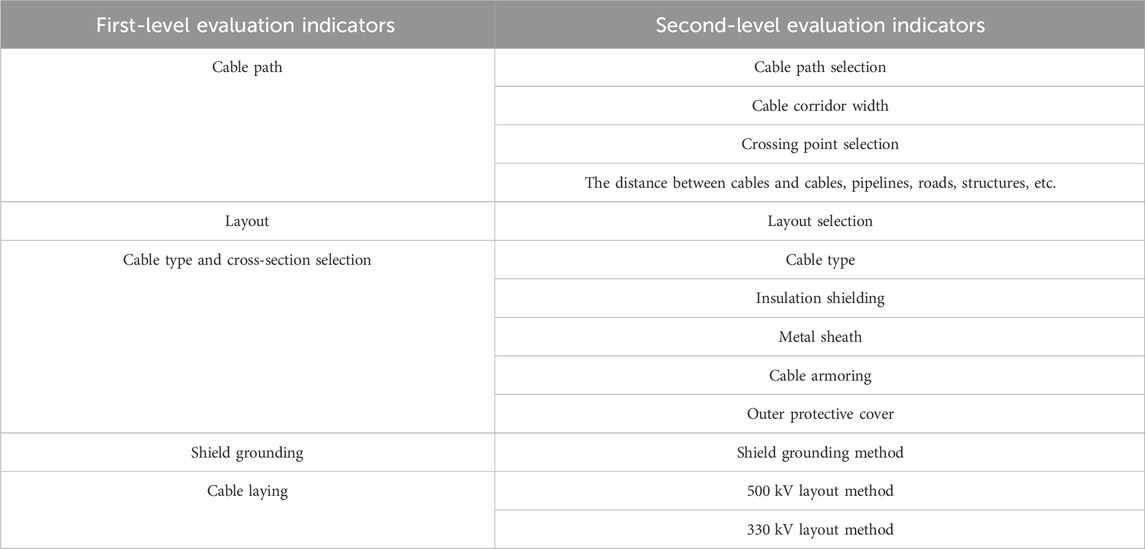
TABLE 3. Part of the cable projects review key elements.
2.2 Data collection
In a power transmission and transformation project, the dataset can be very large, stored in different formats, and from a variety of sources. In general, heterogeneous data can be divided into three types: a grid information model (GIM) that contains the device properties and graphics information, text data, which usually comes in Word or PDF format and contains almost all of the important design details, and images that usually come from the construction stage. According to existing storage regulations, data is stored in various databases, which are indexed differently and lack unified standards. Taking ultra-high voltage (UHV) projects as an example, the various data types are shown in Figure 2. Geographic information is the basis for constructing a substation or overhead lines. It mainly contains altitude information, lightning area, wind speed and so on. GIM model is a 3D visualization data. It is constructed based on Grid Information Model (GIM) standard. Design data is the data generated from the design progress. It mainly contains two types of data: preliminary design report and equipment inventory. Association hook relationship is an index type data which gives clear connection between a specific document and its storage name. Technical and economic data mainly concerns financial data in the whole construction progress. Engineering technical indicators are key specification in a project, such as rated voltage, quantity of transformers and so on. Engineering research materials are new technology and new equipment used in a specific project. Post-project evaluation data is an important part in the progress of project acceptance. It contains a check list of all the indicators for a project. Engineering features specifies the distinguish aspects from other projects, for example, a project is constructed in a high-altitude area. Considering reliability improvement for the energy system, not all these data are used.
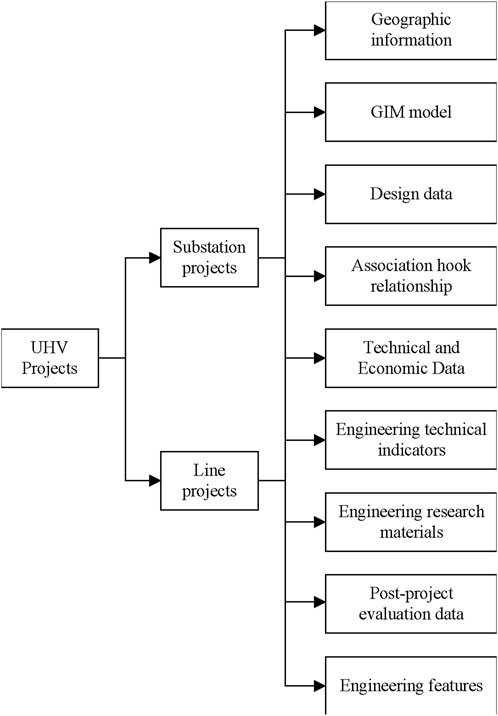
FIGURE 2. UHV project data types.
2.3 Graph construction
A knowledge graph is an undirected graph composed of nodes and edges. The nodes can store equipment and attribute variables, and the edges can store the relationships between variables. Constructing a knowledge graph mainly consists of two steps: ontology design and knowledge extraction. Ontology design defines the types of entities and relations in a conceptual view, defining multiple ideas, entity and relation types, and mapping rules between entities. It provides a guide for knowledge extraction. Knowledge extraction is the key technology used to construct the data layer of a knowledge graph and mainly consists of two steps: named entity recognition (NER) and relation extraction (RE). Named entity recognition, also known as proper name recognition or named entities, refers to the identification of entities with specific meanings in text, for example, the names of people, place names, and organization names, or properties such as quantity, length, and width. Relation extraction is a process of extracting triples such as (subject, relationship, object) from a text corpus. It has two tasks: identify subjects and objects in the text corpus and determine which relationship these two entities belong to. As shown in Figure 3, a knowledge graph contains two layers: a data layer that is the result of NER and RE, and a concept layer that represents the ontology design. Orange and blue ovals denote the entity types and instances, and straight lines with arrows denote relationship instances whose types are pre-defined in the concept layer. The remainder of this section will elaborate on the ontology design and knowledge extraction in UHV projects.
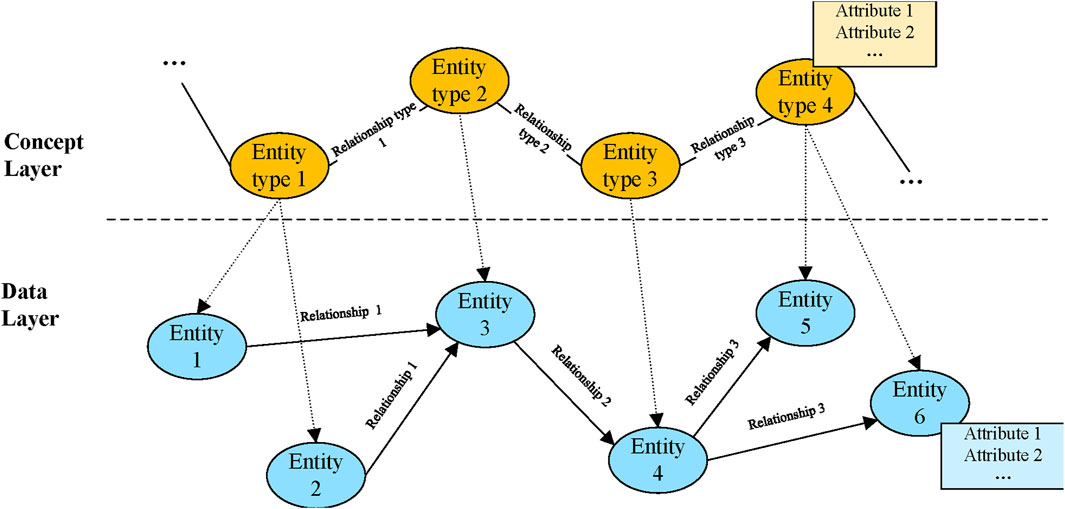
FIGURE 3. Two views of a knowledge graph.
There are generally three methods for constructing knowledge graph ontology: top-down, bottom-up, and a combination of the two. In the domain of UHV construction projects, a clear framework of data structure exits according to procedures and specifications issued by power grid companies. However, there are two problems which could affect the accuracy of the ontology: a rather rough framework and the gradually used new equipment. To achieve better knowledge extraction accuracy, a combination of the two methods is used to construct the UHV project knowledge graph ontology, also taking expert experience and data characteristics into consideration. Such knowledge graph ontology architecture is believed to provide better performance when it comes to meeting the needs of different downstream applications, such as searching and project reviewing. As shown in Figure 4, the ontology of UHV projects mainly consists of four parts: basic information, design company, substation, and line. The basic information includes the name of the project, the construction scale, the natural conditions, and the project classification, which are the properties of the project. The design company information describes the basic information related to the company that makes the preliminary design plan, which is important because different companies have different design preferences, though important information such as technical indicators should be contained in the knowledge graph. Substation and line are two key parts of the knowledge graph. According to current national, industry, and enterprise standards and other specifications, to evaluate the feasibility of a project, the most important consideration is the equipment type and quantity. Analysis of the preliminary design report shows that the main substation equipment can be divided into six categories: electrical primary parts, electrical secondary parts, relay protection, telecontrol equipment, heating, ventilation and air conditioning (HVAC) equipment, and communication equipment. The line part consists of power towers and overhead lines. All of these pieces of equipment should have two properties, equipment type and quantity, which are not shown in Figure 4. Table 4 shows some entity examples in a concept layer.

FIGURE 4. The ontology of the UHV project.

TABLE 4. Entity examples in a concept layer.
Knowledge extraction refers to extracting the knowledge contained in different data sources and storing it as triples in knowledge graphs. As shown in Figure 5, the initial step of knowledge extraction is data cleaning, whose purpose is to remove duplicate information, correct errors, and enforce data consistency. Since UHV project data comes from different sources, NER and RE are based on various data formats, which could be classified as structured data, semi-structured data, and unstructured data. Structured data refers to a kind of data that can be represented and stored in a two-dimensional form using a relational database. It is usually stored in row units, with one row of data representing the information on an entity, and the attributes of each row of data being the same. As the most important data form in UHV projects, structured data contains enormous amounts of information on equipment, particularly for properties such as equipment type and quantity. Semi-structured data is a form of structured data that does not conform to the data model structure associated with a relational database or another data table form, but contains relevant tags to separate semantic elements and classify records and fields. To extract entities and relations from these two kinds of data formats, various rules can be constructed based on expert experience. For unstructured data, deep learning methods should be used. As shown in Table 4, some entities in unstructured data are very long and an entity nesting problem can be observed. For example, the ‘Beijing 1,000 kV substation main transformer expansion project’ is an entity of the ‘Name’ type, while ‘Beijing’ could also be regarded as an entity of the ‘Location’ type. To handle this problem, nested NER algorithms should be taken into consideration, such as Global Pointer (Su et al., 2022). As for RE problem, we use a combination of rule-based method and supervised learning method. Considering some simi-structured data such as equipment inventory, we constructed several rules to extract relationships between entities. For example, a sentence describing the attributes of transformer may be like “The rated voltage of the transformer is 1000 kV”, then the relationship between “transformer” and its attribute “1000 kV” is “rated voltage”. For those relations that cannot be extracted by rules, we treated the RE problem as a classification problem. Specifically, a pair of entities could be classified to several pre-defined relation types including non-relation type. During this progress, the type of the entity should also be treated as an input which could improve the accuracy of the algorithm.
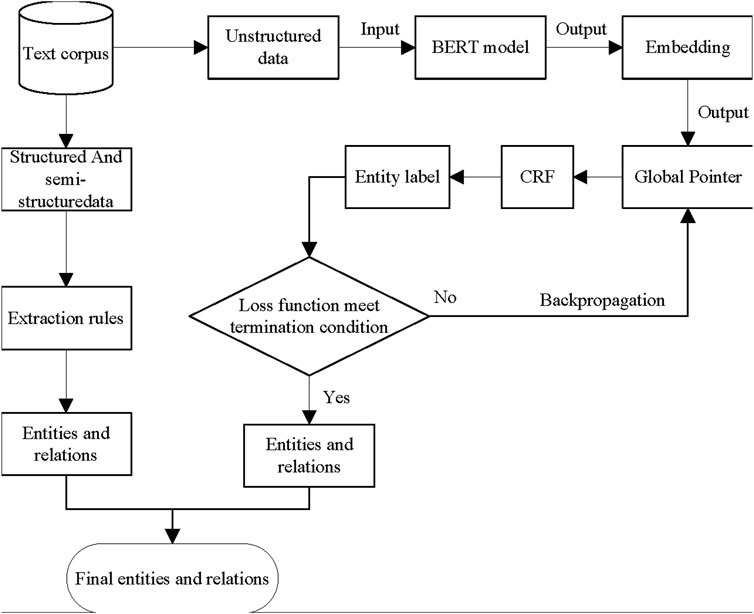
FIGURE 5. A UHV project knowledge graph knowledge extraction flowchart.
3 Anomaly detection based on DIET
In this section, the proposed anomaly detection framework DIET is elaborated on in detail. Its architecture is shown in Figure 6. As with conventional anomaly detection models, DIET is an unsupervised model based on GCN, which mainly consists of three components: (1) a representation layer, which leverages multiple GCN layers to embed the given attributed network based on a skip connection mechanism; (2) a decoder layer, which reconstructs structural information and attributes information from a unified representation generated from the representation layer; (3) an aggregator layer, which attempts to detect anomalous nodes by aggregating three components: restructure errors in the structure and attributes, and outlier characteristics within a specific node set. After multiple iterations, the nodes are ranked according to their anomaly scores. The larger the score is, the more likely the samples are to be anomalies.
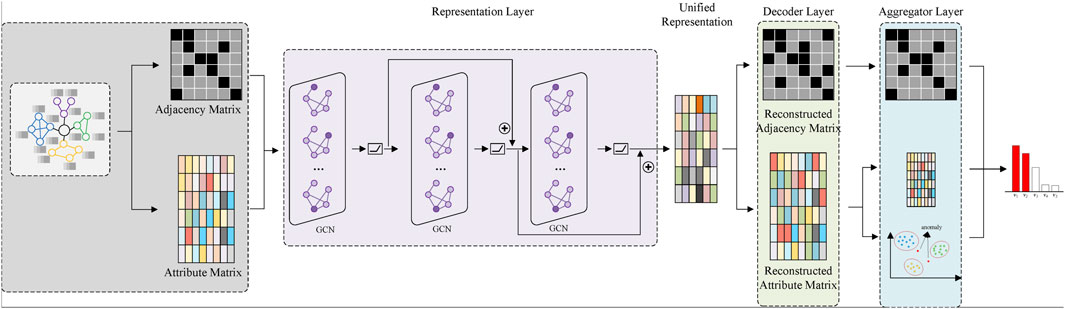
FIGURE 6. The proposed deep skip-connection framework DIET for anomaly detection on attributed networks.
3.1 Problem analysis and definitions
As elaborated on in Section 2, a knowledge graph is a digital structure that represents knowledge as concepts and relationships between concepts. It can be represented in two common ways: attributed networks and RDF triples. Considering the flexibility of representation and rich algorithms, attributed networks are used to model knowledge graphs. The search for knowledge graph errors is transformed into anomaly detection on attributed networks. Unlike conventional anomaly detection problems, subgraphs constructed on domain data often have similar structures and attributes, but nodes of the same type have no connections with each other. For example, the number of transformers in a 1,000 kV substation construction project in Beijing is the same as that in Shanghai, while the two nodes are separated in different sub-graphs. Moreover, deep GCN networks with multiple layers can lead to an over-smoothing problem, while a single GCN layer can only aggregate information from neighboring nodes. Taking these two problems into consideration, a deep skip connection framework for multi-type anomaly detection on attributed networks is proposed, called DIET for attributed networks. In this section, the attributed networks and anomaly detection problem are defined.
DEFINITION 1. (attributed network) An attributed graph G(V, E, X) consists of three components: (1) the set of nodes V = {v1, v2, v3,…, vn}∈ n; (2) the set of edges E, where |E| = m; and (3) the attribute matrix X, where the ith row denotes the feature vector of the attributes of node i. In addition, an adjacency matrix is defined as A of graph G, where aij = 0 if there is no edge between node vi and vj. Otherwise, aij = 1.
DEFINITION 2. (anomaly detection) Given an attributed graph G(V, E, X), the task is to detect nodes that differ from the majority of nodes in terms of structure and attributes. More formally, an order of nodes is generated as U = {u1,u2,…,u3} from the anomaly scores using a score function, which is used to classify the sample vi based on the threshold λ, as shown in Eq. 1:
where yi is the label of sample vi, 0 is the normal node, and 1 is the anomalous node.
3.2 Representation layer
GNN is a powerful deep-learning framework for solving image-related and graph-related problems. Each node in the graph sends its feature representation to nodes within its neighborhood, and after multiple iterations, a feature matrix is obtained for downstream tasks. One of the most eminent variants of GNN is the deep convolutional neural network known as GCN, the core idea of which is to update the feature vector of node vi denoted by hi via recursively aggregating information from its neighboring nodes vj. The process can be represented in the following Eq. 2:
where σ is a non-linear activation function such as RELU,
As shown in the above two equations, GCN-based neural networks are message-passing neural networks, which have a strong ability to embed nodes into a low-dimensional dense space. Several research results (Zhao and Akoglu, 2019; Huang et al., 2020; Yang et al., 2020) have shown that despite its outstanding feature expression ability, a GCN is unable to capture long-distance dependencies between nodes, which has led researchers to explore deep frameworks of multiple layers. However, GCNs and their variants are essentially low-pass filters for graph signals. As the number of layers increases, information can easily become over-smoothed and indistinguishable, which may affect the anomaly detection performance. Therefore, to address the problems mentioned above, a skip connection mechanism is applied in the framework. Specifically, the input of the (l+1)-th layer (l > 1) is a combination of the output of the l-th layer and the (l-1)-th layer, which can be represented as Eq. 4:
Obviously, an additional input can improve the representation ability.
3.3 Decoder layer
The output of the representation layer is a unified representation matrix Z, where each row Zi is a feature vector of node vi. To detect anomalous nodes in attributed networks, the network structure and attribute matrix are reconstructed to calculate residuals with the original matrices. Specifically, two decoders are designed: a structure decoder and an attribute decoder.
The structure decoder takes the latent representation of each node as input and then reconstructs an adjacency matrix
The attribute decoder aims to obtain the attribute matrix of the original knowledge graph based on the representation matrix Z. To be more specific, a simple fully-connected network as presented in Eq. 6 is used to obtain the original attribute information:
where
3.4 Aggregator layer
After obtaining the reconstructed adjacency matrix
Structural reconstruction error. Taking the original and reconstructed adjacency matrix A and
For a certain pair of nodes vi and vj, if their connective information can be estimated through the encoder-decoder process, there is a low probability of a structural anomaly. If the connectivity information is different between these two matrixes, it suggests that there may be an anomaly.
Attribute reconstruction error. Similar to the structural reconstruction error, the residual of X and
Mean error. Due to the different entity types of the nodes, such as transformers, isolating switches, and breakers, the attribute matrix is divided into multiple sets. Given
Until now, three components have been defined considering the reconstruction errors and mean errors within each group. To jointly determine the probability of whether a node is an anomaly or not, the objective function of the proposed deep GCN framework can be formulated as Eq. 10:
where
4 Case study
In this section, the proposed deep skip connection model DIET is performed on an attributed network that is constructed from a power grid infrastructure project dataset. The content mainly consists of four parts: dataset setup, experimental settings, experimental results, and parameter analysis.
4.1 Dataset setup
As was elaborated upon in Section 2, the UHV knowledge graph is transformed into an attribute network and is adopted as an input in the experiment. The UHV dataset contains 30 graph samples, which all represent new substation construction projects. Every graph represents a specific project, containing an average of 129 nodes and 128 edges.
As all the samples are unlabeled and there is no ground truth of anomalous nodes in the UHV knowledge graph, some anomalies need to be manually injected into the attributed network to get some negative samples. To be more specific, two anomaly injection methods are leveraged to generate structural anomalies and attribute anomalies separately. For structural anomaly injection, the method introduced by Ding et al. (2019) is adopted to inject small disturbances into the adjacency matrix. The idea behind this approach is that a fully connected subgraph has a higher probability of being a group of anomalous nodes. Thus, m nodes are selected randomly and aij = 1 is enforced in the new adjacency matrix. Considering the fact that the ratio of positive and negative samples could affect the accuracy of the experiment, this process is iteratively repeated n times, thus generating m×n structural anomalies in the adjacency matrix. To be more specific, the number of fully connected nodes m is fixed to 10, because analysis of the UHV knowledge graph shows that there is no complete graph whose size is larger than 10. The number of iterations n is set to 38, which ensures the proportion of structural anomalies is roughly 10%. For attribute anomaly injection, the method from Song et al. (2007) is improved to generate anomalies in the attribute matrix. Instead of picking nodes from the maximum Euclidean distance to the reference node, a statistical method is adopted to ensure the quality of anomalous nodes. Therefore, for each node vi, k nodes of the same type are randomly selected. To make sure that the number of attribute anomalies is equal to that of structural anomalies, k is fixed to m×n. Denoted as
where
4.2 Experiment settings
The goal is to detect anomalous nodes in attributed networks with higher accuracy and a lower false alarm rate, so several comparative experiments are conducted with five state-of-the-art algorithms to achieve outstanding results in anomaly detection. In addition, to better understand the proposed DIET method and evaluate the model performance properly, three commonly used evaluation matrices are adopted. A detailed analysis is provided below.
The proposed DIET framework is compared with the following anomaly detection algorithms.
DOMINANT (Ding et al., 2019) detects anomalous nodes with a three-layer GCN encoder without a skip connection mechanism. Similarly to the proposed DIET framework, it reconstructs structural and attribute information separately and then uses an anomaly score to rank nodes, considering nodes with rankings higher than a predefined threshold as anomalies.
RESGCN (Pei et al., 2021) leverages a residual-based attention mechanism to alleviate the over-smoothing issue of the multi-layer GCN network. Specifically, it uses several fully connected layers to embed an attribute matrix and output a residual matrix R to aggregate with the output of the GCN in each layer.
ALARM (Peng et al., 2020) takes multi-view characteristics into consideration, with each view embedded with one separate GNN encoder. A weighted aggregation method performs better than a concatenation aggregation method on most open-source synthetic datasets. Thus, the ALARM-weighted algorithm is used as a comparison algorithm.
COMGA (Luo et al., 2022) makes use of the community characteristic present in the attributed network and a tailored deep graph convolutional network is proposed to tackle this problem. The gateway module improves the model performance.
ANOMALYDAE (Fan, Zhang, and Li, 2020) follows the natural intuition that the fusion of structural and attribute information could lead to performance improvements. Therefore, a dual autoencoder structure is proposed in which the decoder process, node embedding, and attribute embedding are combined using the inner product.
To effectively evaluate each model, three evaluation indicators are used: the receiver operating characteristic with the area under the curve (ROC-AUC), precision@K, and recall@K.
ROC-AUC has been a frequently used evaluation indicator in most previous anomaly detection modules. The ROC curve is a curve on a two-dimensional plane, where the X-axis is the false positive rate (FPR) and the Y-axis is the true positive rate (TPR). The definitions of the FPR and TPR are elaborated on below in Equations 13, 14. The AUC is a number between 0.1 and 1 that represents the area under the ROC curve. The AUC can intuitively evaluate the quality of a model. A higher AUC indicates a method with better performance.
where FP is an abbreviation of false positive and represents the number of negative samples that are predicted as positive samples; TN is an abbreviation of true negative and represents the negative samples correctly predicted as negative samples; TP is an abbreviation of true positive, which represents the positive samples correctly predicted as positive samples; and FN is an abbreviation of false negative, which represents the number of positive samples that are predicted as negative samples.
Precision@K represents the precision of the first k items in the list, that is, the proportion of true samples in the top k ranking nodes. Considering the fact that a ranking mechanism is used to detect anomalies in the experiment, precision@K is a useful indicator for evaluating the performance of a model. With a range of 0–1, a larger precision@K represented in Eq. 15 indicates better performance of the model.
Recall@K represented in Eq. 16 is similar to precision@K, but represents the proportion of correct predictions among all results.
For all the comparison algorithms, the default hyperparameters are taken and a large number of experiments are conducted to achieve the best results. For the proposed DIET framework, the objective function is optimized with the Adam optimizer and trained for 100 epochs to fit the model parameters to the given dataset. The representation layer is made up of three GCN layers, in which the size of the trainable matrices of the three GCN layers are 192 × 64, 64 × 64, and 64 × 64. Note that 192 is the number of input dimensions of the feature matrix. In addition, the learning rate of the model is set to 0.005. All the experiments are conducted on a personal computer with an Intel i7-11800H CPU and an NVIDIA GeForce RTX 3070 Laptop GPU.
4.3 Experimental results
In this section, six experiments are conducted on a UHV-attributed network that includes five control groups and one experimental group. The results are as follows. First, the ROC-AUC results are presented in Figure 7. Then, the other two evaluation indicators, Precision@K and Recall@K, are illustrated in Tables 5, 6. As can be easily observed, the proposed DIET method outperforms all the other comparison algorithms. For the GCN over-smoothing problem, the DIET leverage skip connection mechanism is better than RESGCN, which uses a residual-based attention framework. This shows that an aggregation of the output from the former layer, which contains both structural and attribute information, can achieve better performance than using only the attribute matrix. Furthermore, the skip connection mechanism can alleviate the vanishing gradient problem to a certain extent. In addition, it can be seen from the original attributed network that the attributes of each node represent different aspects of the entity. For example, a node with the type transformer has two attributes that can be represented in a list: {“Quantity”: 4; “Device model”: “ODFPS-1000000/1000”}, in what was called a multi-view problem by Peng et al. (2020). Intuitively, obtaining the embeddings of each attribute separately could give the cascading GCN model a more precise input, thus achieving better performance. Results from the comparison of the proposed model with ALARM show that a attribute separation based on different characteristics could be ignored because a distance-based method which apdopts the residual to each type of nodes could achieve better results. Results from DOMINAT show that an encoder-decoder framework is suitable for anomaly detection problems. As the GCN has a strong ability to embed a graph-based dataset, it is better to take the whole attributed network with structural and attribute information as input rather than treating them separately.
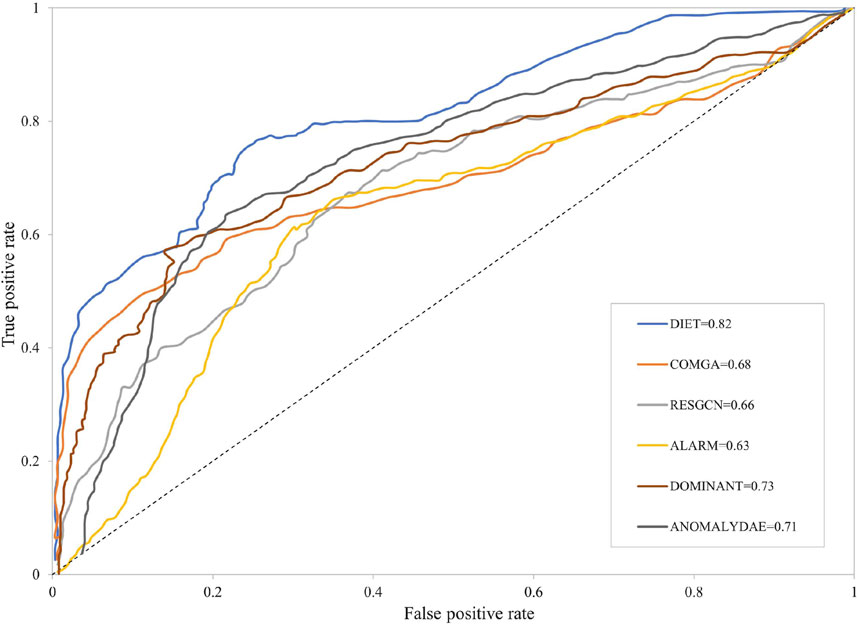
FIGURE 7. ROC curve and AOC values of all algorithms in the UHV dataset.
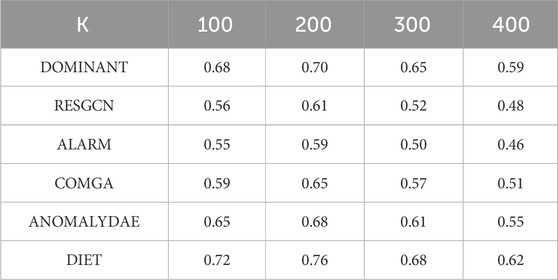
TABLE 5. Precision@K of different algorithms on the UHV dataset.
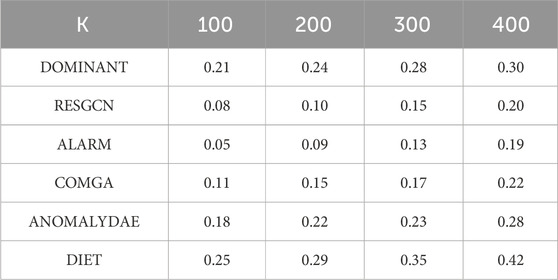
TABLE 6. Recall@K of different algorithms on the UHV dataset.
4.4 Parameter analysis
The reason that DIET achieves good performance is the introduction of the skip connection mechanism in the model. It enhances the information interaction between GCN layers and alleviates over-smoothing problems. In this section, the impact of different numbers of GCN layers is investigated and the result is shown in Figure 8. It can be concluded that as the number of GCN layers gradually increases, the AUC first gradually increases and then levels off. The highest AUC value appears when the number of layers is set to three. Although a study (Li et al., 2019) on the GCN depth showed that it could stack over 50 GCN layers and achieve a 3.7% boost in performance, the results of the experiments show that three layers of GCN can achieve the best results. This is probably because the dataset in the experiment is relatively simple, and three GCN layers are sufficient to get abundant information for anomaly detection.
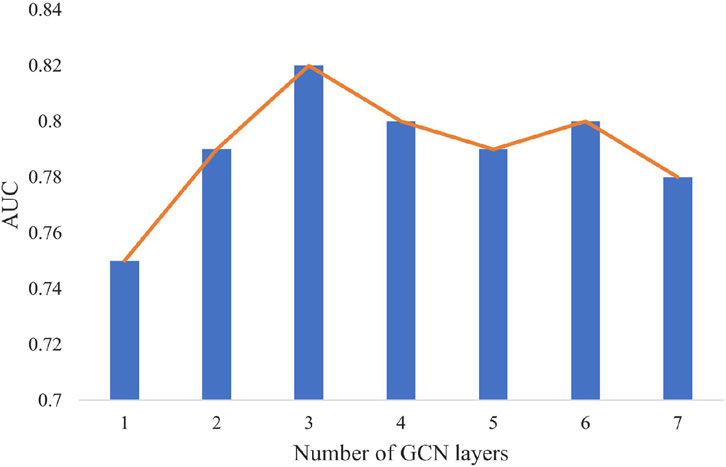
FIGURE 8. The impact of different numbers of GCN layers on the AUC.
5 Conclusion
With the rapid development of energy systems, reliability improvement is becoming an important topic. Traditional reliability improvement methods mainly contain two aspects: the analysis of power grid structure and the operation of power grid. Although many researchers have shown that the operation and scheduling affect the frequency and voltage fluctuation, which exert great influence in power supply reliability, the power grid structure and equipment are the hardware basics of energy systems. In this paper, considering the increasing amount of data accumulated from existing power grid projects, we proposed an artificial intelligence based method to deal with anomaly detection problem in order to improve reliability in the aspect of power grid structure. The main contributions are as follows:
1) A knowledge graph is used as the basis for data modeling and knowledge reasoning. Specifically, heterogeneous data accumulated from different sources are converted to structured data and modeled as a knowledge graph. This kind of data is also easy for downstream applications such as data search and inference.
2) A skip connection mechanism is leveraged. Multiple GCN layers could lead to over-smoothing problem. In this context, we use output from the layer Li-2 as input of Li.
3) A distance-based indicator is added to the objective function. This indicator could introduce the information from the same type of subgraphs and improve the accuracy of the algorithm.
To evaluate the performance of our proposed algorithm DIET, we compared it with five different GCN-based methods. DIET clearly achieves the highest AUC scores for the UHV dataset. An additional analysis of the depth of the hidden layers has shown that in some datasets with fewer samples, a simple three-layer-GCN network is sufficient to achieve better results than other algorithms. Specifically, the AUC from DIET for the UHV dataset is 0.82, which represents an improvement over other algorithms of more than 12%. Precision@K and recall@K show our method can detect anomalies more quickly than the other comparison algorithms. In conclusion, the proposed anomaly detection algorithm can help reduce data errors in energy systems and help in improving the reliability of energy systems.
Data availability statement
The raw data supporting the conclusion of this article will be made available by the authors, without undue reservation.
Author contributions
GX: Writing–review and editing. JH: Writing–original draft. XQ: Resources, Writing–review and editing. JR: Resources, Writing–review and editing.
Funding
The author(s) declare that no financial support was received for the research, authorship, and/or publication of this article.
Conflict of interest
Author JR was employed by State Grid Economic and Technological Research Institute Co., Ltd.
The remaining authors declare that the research was conducted in the absence of any commercial or financial relationships that could be construed as a potential conflict of interest.
Publisher’s note
All claims expressed in this article are solely those of the authors and do not necessarily represent those of their affiliated organizations, or those of the publisher, the editors and the reviewers. Any product that may be evaluated in this article, or claim that may be made by its manufacturer, is not guaranteed or endorsed by the publisher.
References
Cao, M., Xu, Y., Sun, Y., and Cang, D. (2023). Natural disasters, economic growth, and carbon emissions: empirical analysis of Chinese data based on a nonlinear auto-regressive distributed lag model. Sustainability 15, 15210. doi:10.3390/su152115210
Chen, L., Zhang, L., Song, H., Chen, K., Wu, B., Chen, S., et al. (2023). Natural disaster accident prediction of transmission line based on graph convolution network. Power Syst. Technol. 47, 2549–2557. doi:10.13335/j.1000-3673.pst.2021.2520
Ding, K., Li, J., Bhanushali, R., and Liu, H. (2019). “Deep anomaly detection on attributed networks,” in Proceedings of the 2019 SIAM International Conference on Data Mining, Calgary, Canada, 2-4 may 2019, 594–602.
Fan, H., Zhang, F., and Li, Z. (2020). “Anomalydae: dual autoencoder for anomaly detection on attributed networks,” in ICASSP 2020 IEEE International Conference On Acoustics, 4-8 May 2020. Speech And Signal Processing (ICASSP), 5685–5689.
Guo, R., Yang, Q., Liu, S., Li, W., Yuan, X., and Huang, X. (2021). Construction and application of power grid fault handing knowledge graph. Power Syst. Technol. 45, 2092–2100. doi:10.13335/j.1000-3673.pst.2021.0065
Hong, Y. (2014). Design and implementation of Fujian power transmission project design review system. Chengdu: Masters thesis, University of Electronic Science and Technology of China. October 27th, 2013.
Huang, J. (2018). Research on intelligent review management platform for 110 kV and below power transmission and transformation project design. Mod. Electron. Tech. 41, 112–115. doi:10.16652/j.issn.1004-373x.2018.04.028
Huang, W., Rong, Y., Xu, T., Sun, F., and Huang, J. (2020). Tackling over-smoothing for general graph convolutional networks. arXiv preprint arXiv:2008.09864.
Ji, S., Pan, S., Cambria, E., Marttinen, P., and Yu, P. S. (2022). A survey on knowledge graphs: representation, acquisition, and applications. IEEE Trans. Neural Netw. Learn Syst. 33, 494–514. doi:10.1109/TNNLS.2021.3070843
Kumagai, A., Iwata, T., and Fujiwara, Y. (2021). “Semi-supervised anomaly detection on attributed graphs,” in 2021 International Joint Confere# nce on Neural Networks (IJCNN), 18-22 July 2021, 1–8.
Li, G., Muller, M., Thabet, A., and Ghanem, B. (2019a). “Deepgcns: can GCNS go as deep as cnns?” in Proceedings of the IEEE/CVF International Conference on Computer Vision, Seoul, Korea, October 2019. 9267-9276, 27-28.
Li, G., Zhou, X., and Wang, B. (2021). Research on intelligent review and management platform for power transmission and transformation engineering design of 110kV and above. China Manage Inf. 24, 107–108.
Li, L., Xiang, Y., Fan, X., Wang, Q., and Wei, Y. (2023). Spatiotemporal characteristics of agricultural production efficiency in sichuan province from the perspective of water–land–energy–carbon coupling. Sustainability 15, 15264. doi:10.3390/su152115264
Li, W., Jia, R., Zhang, H., Liu, G., Zhao, H., Tang, Y., et al. (2019b). Research on power equipment quality integrated management system based on graph database. Distrib. Util. 36, 48–54. doi:10.19421/j.cnki.1006-6357.2019.11.007
Liu, G., Wang, J., Li, Y., Han, H., Tang, Y., Liu, T., et al. (2020). ‘One Graph of Power Grid’ spatiotemporal information management system. Electr. Power Inf. Commun. Technol. 18, 7–17. doi:10.16543/j.2095-641x.electric.power.ict.2020.01.002
Liu, L., Yan, X., and Li, G. (2023). Knowledge graph in distribution network fault handing: advances, challenges and prospects. Electr. Power Inf. Commun. Technol. 21, 19–26. doi:10.16543/j.2095-641x.electric.power.ict.2023.07.03
Luo, X., Wu, J., Beheshti, A., Yang, J., Zhang, X., Wang, Y., et al. (2022). “Comga: community-aware attributed graph anomaly detection,” in Proceedings of the Fifteenth ACM International Conference on Web Search and Data Mining, New York, United States, 21-25 February 2022, 657–665.
Pei, Y., Huang, T., Wernervan, I., and Pechenizkiy, M. (2021). “GCN: attention-based deep residual modeling for anomaly detection on attributed networks,” in Resources in (2021) IEEE 8th International Conference on Data Science and Advanced Analytics (DSAA), Porto, Portugal, 6-9 October 2021, 1–2.
Peng, Z., Luo, M., Li, J., Xue, L., and Zheng, Q. (2020). A deep multi-view framework for anomaly detection on attributed networks. IEEE Trans. Knowl. Data Eng. 34, 1. doi:10.1109/TKDE.2020.3015098
Pu, T., Tan, Y., Peng, G., Xu, H., and Zhang, Z. (2021). Construction and application of knowledge graph in the electric power field. Power Syst. Technol. 45, 2080–2091. doi:10.13335/j.1000-3673.pst.2020.2145
Ruan, C., Qi, L., and Wang, H. (2021). Intelligent recommendation of demand response combined with knowledge graph and neural tensor network. Power Syst. Technol. 45, 2131–2140. doi:10.13335/j.1000-3673.pst.2020.1701
Shu, S., Chen, Y., Zhang, Z., Fang, S., Wang, G., and Zeng, J. (2023). Construction method for transformer operating state portrait based on multidimensional capability and knowledge graph-multilayer Perceptron. Power Syst. Technol. doi:10.13335/j.1000-3673.pst.2022.2513
Song, X., Wu, M., Jermaine, C., and Ranka, S. (2007). Conditional anomaly detection. IEEE Trans. Knowl. Data Eng. 19, 631–645. doi:10.1109/TKDE.2007.1009
Song, Y., Li, W., Dai, G., and Shang, X. (2023). Advancements in complex knowledge graph question answering: a survey. Electronics 12, 4395. doi:10.3390/electronics12214395
Su, J., Murtadha, A., Pan, S., Hou, J., Sun, J., Huang, W., et al. (2022). Global pointer: novel efficient span-based approach for named entity recognition. arXiv preprint arXiv:2208.03054.
Tian, J., Song, H., Chen, L., Sheng, G., and Jiang, X. (2022). Entity recognition approach of equipment failure text for knowledge graph construction. Power Syst. Technol. 46, 3913–3922. doi:10.13335/j.1000-3673.pst.2021.1886
Wang, J., Yang, J., Pei, Y., Zhan, X., Zhou, T., and Xie, P. (2021). Distribution network fault assistant decision-making based on knowledge graph. Power Syst. Technol. 45, 2101–2112. doi:10.13335/j.1000-3673.pst.2020.1677
Wang, S., Zheng, S., Liu, Z., Liu, Y., Dong, P., Tao, C., et al. (2023). Entity relation extraction for construction of relay protection device defect knowledge graph in some certain area power grid. Power Syst. Technol. 47, 1874–1887. doi:10.13335/j.1000-3673.pst.2022.2110
Yang, C., Wang, R., Yao, S., Liu, S., and Abdelzaher, T. (2020). Revisiting over-smoothing in deep GCNs. arXiv preprint arXiv:2003.13663.
Ye, X., Shang, L., Dong, X., Liu, C., Tian, Y., and Fang, H. (2022). Knowledge graph for distribution network fault handling. Power Syst. Technol. 46, 3739–3749. doi:10.13335/j.1000-3673.pst.2022.0496
Zhang, S., Dong, H., Lu, C., and Li, W. (2023). Carbon emission projection and carbon quota allocation in the Beijing–Tianjin–Hebei region of China under carbon neutrality vision. Sustainability 15, 15306. doi:10.3390/su152115306
Zhao, L., and Akoglu, L. (2019). Pairnorm: tackling oversmoothing in gnns. arXiv preprint arXiv:1909.12223.
Keywords: reliability improvement, graph convolutional network, anomaly detection, skip connection mechanism, artificial intelligence
Citation: Xu G, Hu J, Qie X and Rong J (2024) Anomaly detection based on a deep graph convolutional neural network for reliability improvement. Front. Energy Res. 12:1345361. doi: 10.3389/fenrg.2024.1345361
Received: 27 November 2023; Accepted: 05 January 2024;
Published: 16 January 2024.
Edited by:
Minglei Bao, Zhejiang University, ChinaReviewed by:
Zhenglong Sun, Northeast Electric Power University, ChinaChenhui Song, Changsha University of Science and Technology, China
Copyright © 2024 Xu, Hu, Qie and Rong. This is an open-access article distributed under the terms of the Creative Commons Attribution License (CC BY). The use, distribution or reproduction in other forums is permitted, provided the original author(s) and the copyright owner(s) are credited and that the original publication in this journal is cited, in accordance with accepted academic practice. No use, distribution or reproduction is permitted which does not comply with these terms.
*Correspondence: Jie Hu, amhvbi5odUBvdXRsb29rLmNvbQ==