 Xiaobo Hao*Pengcheng LiuYanhui Deng
- Ningxia Hongdunzi Coal Ind, Ningxia, China
As the internet data centers are mushrooming, the energy consumption and carbon emission of data centers are increasing rapidly. To cut down the electricity cost and carbon emission of the data centers, we proposed an optimization method to reduce the electricity cost and carbon emission in geo-distributed multiple data centers. In the proposed method, the carbon tax is considered in the overall operation cost to optimize the carbon emission. The spatial and temporal flexibility of computational workload is fully utilized by considering the difference in renewable energy power output, local electricity and carbon emission of multiple geo-distributed data centers to achieve a better performance. Furthermore, the nonlinear characteristics of the power loss of uninterruptible power supply (UPS) are considered in the optimization. To verify the proposed optimization method, simulation of six cases is carried out with realistic data, and results have proved the proposed method can reduce the operational costs by 4.93%–12.7% and decrease carbon emissions by up to 10%.
1 Introduction
Carbon emissions, being an important cause of phenomena such as global warming, have garnered escalating attention worldwide (Carbon Tax Center, 2021). In response, an increasing number of countries have implemented carbon taxes to incentivize factories and enterprises to reduce their carbon emission. (World Bank Group, 2020). As a significant consumer of electricity, energy consumption and carbon emission of data centers have become increasingly prominent as the number of data centers increases, which pose a serious carbon emissions issue. As reported by the NRDC, U.S. data centers are forecasted to consume 140 billion kW hours of power by 2020, resulting in an electricity cost of nearly 13 billion dollars and emission of carbon dioxide 150 million tons (Delforge, 2014). The energy consumption and carbon emission have led to negative impacts on the environment, as well as great operational cost under the carbon tax policy (Liu et al., 2020). Therefore, reducing the electricity cost and carbon emission can meet the expectations of government and data center operators alike, which have drawn increasing attention from both academia and industry all over the world (Ni and Bai, 2017).
Most existing research on the aforementioned issue focuses on reducing the power consumption rather than carbon emission of data centers (Yu et al., 2014), which tried three main ways to reduce the energy consumption in the data centers. The first is to boost the power conversion efficiency of data center power supply system by improving the efficiency of power converters, such as power supply unit (PSU) or uninterruptible power supply (UPS) (Ahmed et al., 2017; Zhao et al., 2019). The second is to jointly optimize the computational workload scheduling with the micro grid operations in data centers, or optimize the planning of data center micro grid (Li et al., 2018). The third method is to optimize the workload distribution in multiple distributed data centers in different city and cut down operational cost by utilizing the local electricity cost and renewable energy output (Liu et al., 2012; Qi et al., 2019). Microsoft and Equinix have also introduced micro grid into data center (Peter, 2017). Yang et al. have built the prototype of waste heat recovery system, which has also been verified by commercial application (Luo et al., 2019). And the related data center testbed has been built at RISE ICE Datacenter in northern Sweden in order to perform experiments on load balancing, micro-grid interactions and the use of renewable energy sources (Brannvall, 2020). The aforementioned methods can effectively reduce energy consumption while simultaneously decreasing the accompanying carbon emissions. However, according to literature (Li et al., 2011; Na et al., 2022), there is a certain deviation between the optimal points of energy consumption and carbon emissions, therefore the research focused on energy consumption cannot guarantee the optimization of carbon emissions. Hence, in the optimization process, it is necessary to consider reducing carbon emissions as an optimization objective concurrently.
The reduction of carbon emissions in data centers can be achieved through two main methods: cutting down energy consumption in data centers and maximizing the utilization of renewable energy. Li et. al. proposed a data center micro grid planning method, which introduces the renewable energy devices into data center (Cui et al., 2016). However, carbon emission is not considered in the planning method. Ding proposed a multi objective method to reduce the carbon emission and electricity consumption, but research did not considered the scheduling of computational workload in multiple data centers, and the nonlinear characteristics of the power supply system inside of the data center (Ding et al., 2018). Ting et al. proposed a carbon reduction method in four data centers in different city, but the electricity consumption is not taken into account (Ting et al., 2022). Zhou et al. proposed an electricity consumption reducing method in geo-distributed data center micro grids with renewable energy, but the carbon emission are not directly taken into consideration (Zhou et al., 2016; Liu and Xu, 2023; Zhang et al., 2023 proposed several optimal planning methods of data centers considering carbon emission, however it achieves the optimal planning of single data center and ignores the spatial scheduling flexibility of workloads in data centers; Wu et al., 2023; Yang et al., 2023 proposed carbon emission aware scheduling method in multiple data center, while the UPS characteristics are ignored. Furthermore; Misaghian et al., 2023 proposed a carbon aware flexibility assessment method to estimate the operational flexibility of data centers, however it has not proposed the relevant scheduling method. In brief, the characteristics of power supply devices, such as uninterruptible power supply (UPS) are not considered in the exiting methods, which may lead to extra energy consumption and carbon emission.
In view of this, we proposed a hybrid operation optimization method to reduce the electricity cost and carbon emission in geo-distributed data center by jointly considering computational workload scheduling, carbon emission, micro grid operation and characteristics of UPSs. The proposed method reduced the operational cost and carbon emission by utilizing the degree of freedom in computational workload scheduling to limit the nonlinear growth of UPS power losses. To balance the electricity reduction and carbon emission reduction, the carbon tax is introduced as a parameter in the optimization object, which describes the carbon emission of both micro grid devices and the marginal carbon emission caused by electricity purchasing from the utility grid. Six cases are simulated on the Gurobi platform, and results have verified the effectiveness of the proposed method.
2 The influence of workload scheduling and UPS power on optimization objectives
The system architecture of a typical geo-distributed data centers is given in Figure 1. The proposed method can reduce the energy consumption and carbon emission simultaneously by jointly considering the scheduling flexibility of the computational workloads the data centers and the nonlinear characteristics of UPS power losses. Therefore, the relationship between workload scheduling and carbon emission is firstly analyzed, and then the relation between UPS characteristics and carbon emission is given. Furthermore, the necessity of incorporating both carbon emissions and operating costs as optimization objectives is discussed below:
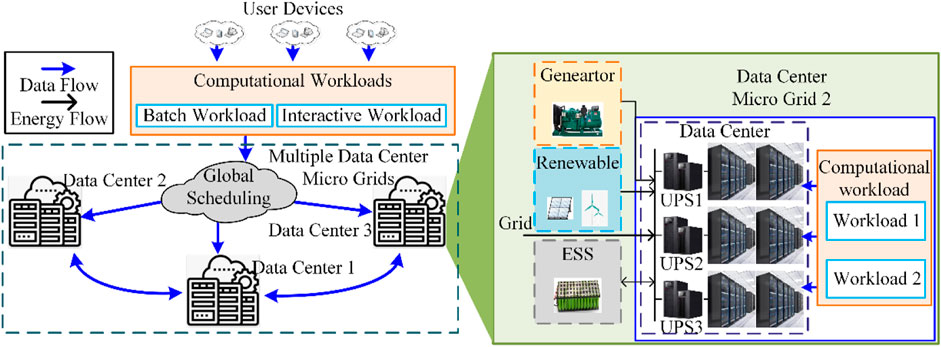
FIGURE 1. Multiple data center micro grid system.
2.1 The influence of computational workload scheduling on carbon emission
As shown in Figure 2, the real-time power of data center is decided by computational workload, which can be scheduled through the internet. Therefore, the most prominent feature of a data center micro grid, as opposed to a traditional micro grid, is its exceptional scheduling flexibility. On the one hand, computational workloads exhibit a high degree of flexibility, as they can be scheduled in both time and space dimensions, which can coordinate with renewable energy sources and electricity prices to minimize carbon emissions resulting from data center energy consumption. On the other hand, the devices within a data center micro grid, such as energy storage systems and conventional generator units, possess flexible regulation characteristics. The operation of these devices also affects the carbon emissions of the data center micro grid. In the following sections, we will analyze the flexibility of load scheduling and the data center carbon emissions separately.
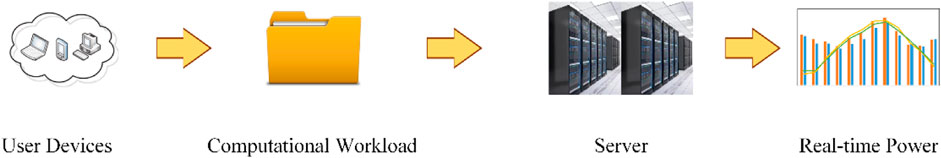
FIGURE 2. Relationship between computational workload and data center real-time power.
2.1.1 Scheduling flexibility of computational workload
The computational workload can be briefly divided into batch workload and interactive workload (Cao et al., 2019). The interactive workload, such as online shopping and game service, should be dealt in a short time delay, which is usually no more than minutes or seconds, as shown in Figure 3A. The service delay of this kind of workload will lead to high economic losses. So the interactive workload cannot be scheduled through different time period. Since the computational workloads are mainly data blocks, it can be scheduled between data centers in different cities with a small delay through the data network.

FIGURE 3. Computational workload; (A) Batch workload, (B) interactive workload.
The batch workload, such as processing of scientific research data and training of neural network, can endure an hourly responds delay, as shown in Figure 3B. Therefore, the batch workload can be scheduled spatially and temporally, which means the potentiality of participating in optimizing scheduling or demand response. Furthermore, the batch workload can also be scheduled through long distance with a small delay, which is negligible in the hourly scheduling, and the scheduling delay is mainly decided by network bandwidth.
Therefore, the computational workloads can be scheduled spatially and temporally in coordinated with renewable energy and conventional generators, whose output power can influence the carbon emission.
2.1.2 Composition and influencing factors of carbon emission
The carbon emissions resulting from the operation of a data center micro grid consist of two aspects: the carbon emissions caused by the operation of the conventional generators in the micro grid and the carbon emissions resulting from the electricity provided by the utility grid, which is generated by thermal power plants. In this paper, both aspects are considered and optimized.
The carbon emissions caused by the operation of the conventional generators in the data center micro grid are primarily determined by the fuel type and real-time power output (Ye and Gao, 2022), and the operation of coal-based generator units and oil-based generator units cause different levels of carbon emissions per unit of electricity produced.
The carbon emissions resulting from the electricity provided by the grid are mainly determined by the proportion of electricity generated by thermal power plants. As shown in Figure 4, the proportion of electricity generated by thermal power plants and renewable energy varies at different times within a day, resulting in difference of carbon emissions in each unit of the consumed electricity. Additionally, the differences in energy structure among different cities also lead to differences in carbon emissions when the same unit of electricity is consumed.
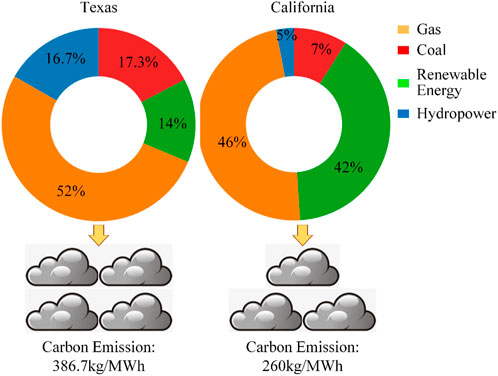
FIGURE 4. Relationship between computational workload and data center real-time power.
2.2 The influence of UPS power losses on carbon emission
In the exiting researches, few work is focused on the influence of the energy consumption characteristics of data center power supply equipment, such as UPS, in the data center scheduling optimization. However, the efficiency and power losses of UPSs do influence the energy consumption and carbon emission of data center micro grids. In implementation, the energy consumption of UPS varies depending on the model and load rate. On the one hand, the power supply efficiency and losses of different UPS equipment vary, which may lead to differences in power supply efficiency among different data centers. On the other hand, UPS energy consumption increases non-linearly with load rate, resulting in corresponding increases in power supply energy consumption and carbon emissions. To further optimize the data center consumption, the characteristics of UPS power losses and its influence on carbon emission are considered in the optimization and illustrated below.
2.2.1 Characteristics of UPS power losses
Uninterruptible Power Supplies (UPSs) play a critical role in ensuring the reliability of data center power supply. Essentially, UPSs consist of multi-stage converters. According to current research, UPS power losses contribute to around 5%–10% of total data center electricity consumption.
UPS power losses exhibit variability based on the load rate, as illustrated in Figure 4, featuring nonlinear curves. In practice, UPS power losses encompass three distinct components (Pratt et al., 2007):
Power losses independent of output power, such as those attributed to generating housekeeping power. These losses predominate during light loads.
Power losses linearly proportional to output power, including switching losses of power semiconductors, gate driver losses, and core losses in magnetics.
Power losses varying with the square of output power, arising from circuit resistance, encompassing conduction losses of power semiconductors and winding losses in magnetics. These losses are prominent under heavy loads.
2.2.2 Relationship between UPS power losses with data center carbon emission
The impact of uninterruptible power supply (UPS) on carbon emissions in data centers is mainly due to increased energy consumption. As illustrated in Figure 5, the efficiency of different UPS devices varies, resulting in differences in the additional energy consumption generated during the power supply process, and UPS energy consumption changes non-linearly with the load rate. Therefore, the distribution of loads on different UPS devices will affect the energy consumption generated by UPS devices, as shown in Figure 6, which thereby causes extra carbon emissions.
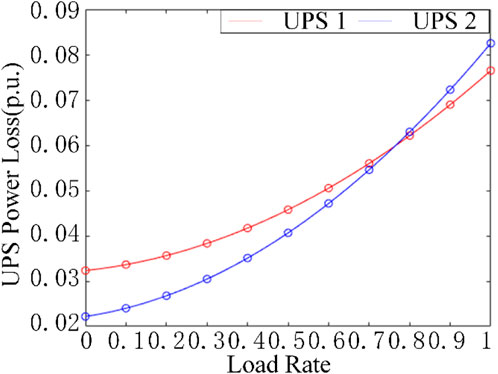
FIGURE 5. UPS power loss curve.
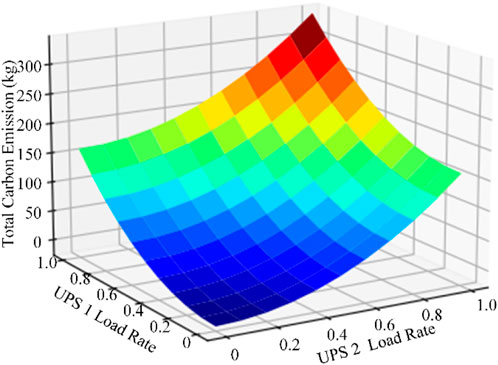
FIGURE 6. UPS load rate and carbon emission.
However, it should be noted that energy consumption is not the sole factor affecting carbon emissions in data centers. Due to the existence of new energy generation, energy storage, generator equipment, and real-time electricity purchase in micro grids, the optimization of carbon emissions should comprehensively consider factors such as micro grid operation and local energy structure.
3 System model and mathematical formulation
This section presents the system and mathematical models for the optimization problem. The depicted typical system architecture of geo-distributed data centers is outlined in Figure 1, wherein each data center operates within a micro-grid featuring renewable power sources, conventional generator units, and energy storage devices. Within each data center, multiple UPS nodes are deployed, corresponding to sets of UPS devices and a substantial number of servers. The system is discretely modeled in time, with equal-length time slots, each spanning 1 h.
The system is delineated into the power demand side and power supply side. On the power demand side, we construct models for workloads and UPS, elucidating the relationship between computational workloads and data center power consumption. On the power supply side, models for energy storage and conventional generator units are formulated, with power balance considerations. Ultimately, the optimization problem is formulated in this section, with the objective of minimizing operational costs and electricity bills across the entire system.
3.1 Power demand side
The energy consumption of power supply equipment is primarily composed of the energy consumption of servers and UPS devices. The energy consumption of servers is linearly determined by the computational load rate, which can be expressed as follows:
Furthermore, for each time slot
where
The power losses of UPS exhibit non-linear variations contingent upon the load rate, which is decided by server power and can be expressed as follows:
where
So the UPS input power is as follows:
3.2 Power supply side
In each micro grid, servers and UPS units derive power from a mix of solar and wind energy, conventional generators, and the utility grid. Energy storage devices are deployed to stabilize renewable energy variability and leverage daily electricity price fluctuations, reducing overall costs.
Conventional generator unit commitment decision model can be described as follows (Wang et al., 2012):
In the aforementioned equations, Eq. 9 outlines the generator capacity constraint, Eqs 10 and 11 outlines the unit minimum-up/down time constraints, Eqs 12 and 13 delineate the unit start-up and shut-down constraints, while (14)–(15) specify unit ramping up/down.
The ESS can be described by the following equations:
In the given equations, Eq. 17 characterizes the energy storage condition for each time slot, determined by the charging and discharging operations. Considering the conversion loss during power charging and discharging, energy conversion efficiency is incorporated in (17). Furthermore, the state of charge must fall within the specified maximum and minimum energy storage bounds, ensuring satisfaction of Eq. 18. Eqs 19 and 20 articulate the charge/discharge constraints, while (21)–(22) describe the constraints on maximum charging/discharging power.
Integrating the supply side and demand side, the power balance constraints can be derived as follows:
Given the spatial and temporal variability of electricity, the electricity bill within each micro grid can be formulated as:
The operational cost of conventional units is delineated in Eq. 25. As depicted in the equation, the operational cost of conventional units comprises no-load cost, marginal cost, as well as start-up and shut-down costs.
Also, since the proportion of renewable energy and thermal power is different in different geographical location, the carbon emission rate per kilo W hours is different. Furthermore, the operation of conventional generators in each data center micro grid also generate carbon dioxide. Therefore, the carbon emission in each micro grid can be expressed by:
In the above equations, (26) describes the carbon emission brought about by the electricity bought from the utility grid, (27) describe the carbon of conventional generator, and (28) describe the overall carbon tax in each data center micro grid.
3.3 Optimization problem
In order to address both the economic and environmental impact of energy consumption in data centers, we consider the operational cost and carbon emissions as optimization objectives and use a carbon tax as a proportionality factor to transform the bi-objective optimization problem into a single-objective optimization problem. Hence, the optimization problem can be formulated as follows:
As indicated above, the optimization objective is to minimize the system’s operational cost, comprising electricity costs, operational costs of conventional units, and carbon taxes. Constraints (30)–(37) pertain to the power demand side, while constraints (38)–(52) ensure the functionality of the power supply side. Eqs 53–57 detail the operational cost and carbon emissions. The decision variables for the optimization problem encompass the allocation of interactive and batch workloads, as well as the operational schedule of energy storage systems (ESS) and conventional generator units. The proposed resource planning model is formulated as a mixed-integer linear programming (MILP) problem.
4 Case study
In this section, a geo-distributed data center micro grid system sample is created to assess the proposed methodology outlined in this paper. All system modeling and solving algorithms are implemented in the Gurobi platform (CPLEX, 2009), a widely employed tool for solving binary programming or mixed-integer programming problems. The simulations are executed on a desktop computer equipped with an Intel Core i5-8400 CPU @ 2.80GHz and 8 GB memory.
4.1 Simulation setup
To separately verify the impact of UPS characteristics and multiple data center scheduling on the optimization objectives, this study sets up two simulation scenarios: one with a single data center to verify the effect of UPS characteristics, and the other with multiple data centers to verify the effectiveness of multiple data center scheduling and the proposed approach. Within each micro grid, two conventional generators (one coal-based and another gas-based), along with distributed solar and wind generation units, are employed. Additionally, an energy storage system is integrated. These micro grids are interconnected with the utility grid, and each micro grid serves as the power source for a designated data center. In each data center, three UPS nodes supply power to servers. The simulation encompasses three types of UPSs, and to maintain simplicity, the deployment of these UPS types is identical across the data centers, meaning each data center features one of each UPS type. For ease of representation, the type and number of servers powered by the UPS nodes are also uniform. The system parameters are detailed in Tables 1–4. In the experiment, the time horizon T is set to be 24 h, which is the maximum time to get a relatively accurate electricity price and load status.
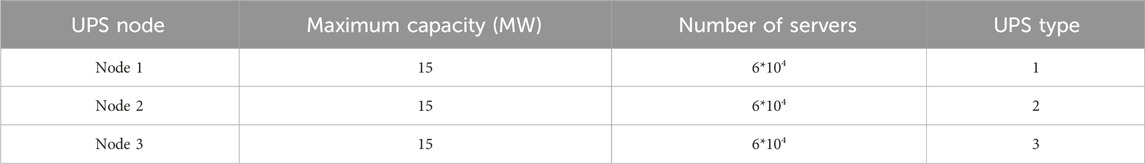
TABLE 1. Parameters of data centers.
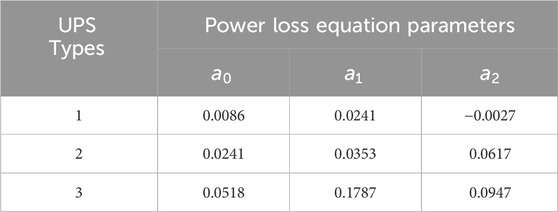
TABLE 2. UPS paramenters.

TABLE 3. Paramenters of conventional generator units.

TABLE 4. Paramenters of energy storage system.
The attributes of conventional generation units and the energy storage system are calibrated using data from ERCOT scheduling data (Cao et al., 2019). Workload data is derived from Hu’s (Hu et al., 2021) and Guo’s (Guo et al., 2019) research papers. For the simulation scenario, it is assumed that the three data centers are located in Texas, New York, and California. Real-time electricity price data, solar and wind power output data are sourced from ERCOT (ERCOT, 2023), CAISO (CAISO, 2023), and NYISO (NYISO, 2023), respectively. Furthermore, the proportion of coal and gas in local electricity generation is collected from the website of U.S. energy and information administration and listed in Table 5 (EIA, 2023).
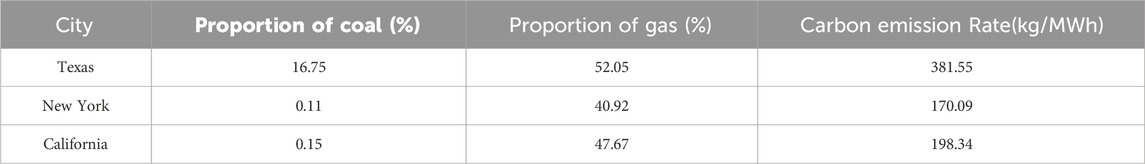
TABLE 5. Energy structure and carbon emission rate.
4.2 Case study in single data center
To avoid potential interaction effects between the two proposed improvements, we adopt the single-variable principle and conduct simulations separately. Specifically, we first set up a simulation with a single data center to verify the effectiveness of considering UPS characteristics in the process of reducing the operational cost and carbon emission. The simulation settings are as follows:
Case I. In a single data center, there are three groups of UPS with different supply efficiency and energy consumption characteristics. However, in the process of objective function calculating and scheduling optimization, the impact of UPS characteristics is not taken into account, and the computational workload is evenly distributed among the three UPS.
Case II. In a single data center, there are three groups of UPS with different supply efficiency and energy consumption characteristics. In the process of objective function calculating and scheduling optimization, the impact of UPS characteristics is taken into account, and the computational workload is optimally distributed among the three UPS.
4.3 Case study of multiple data center
To validate the effectiveness of the improvement that extending the optimization from single data center to multiple data center and takes the carbon tax and operational cost as dual-objective, we conducted simulation of three data centers system and established four scenarios as follows:
Case III. Three data centers are simulated, and the computational workload is evenly distributed among them, and the optimization objective is set to be the dual-objective of reducing the carbon tax and operational cost. Furthermore, the UPS characteristics are not considered in the process of objective function calculating and scheduling optimization.
Case IV. Three data centers are simulated, and the computational workload distribution among them is optimized, and the optimization objective is set to be the single-objective of reducing the carbon tax. Furthermore, the UPS characteristics are not considered in the process of objective function calculating and scheduling optimization.
Case V. Three data centers are simulated, and the computational workload distribution among them is optimized, and the optimization objective is set to be the dual-objective of reducing the carbon tax and operational cost. Furthermore, the UPS characteristics are not considered in the process of objective function calculating and scheduling optimization.
Case VI. Three data centers are simulated, and the computational workload distribution among them is optimized, and the optimization objective is set to be the dual-objective of reducing the carbon tax and operational cost. Furthermore, the UPS characteristics are considered in the optimization.
By comparing Case III and Case V, it can be shown that multiple data center scheduling has advantages over single IDC scheduling in terms of energy saving and carbon emission reduction. By comparing Case IV and Case V, it can be demonstrated that multi-objective optimization is superior to its counterpart which takes the carbon emission as the single optimization objective. By comparing Case V and Case VI, it can be shown that the combination of the proposed optimization methods can further improve the optimization results.
4.4 Result analysis
4.4.1 Result in single data center
The simulation results of Case I and Case II has been listed in Table 6. As can be seen in the table, the total operational cost has been reduced by 3.11%, and the carbon emission has been reduced by 3.48%. The total cost which includes the operational cost and carbon tax has been reduced by 3.24%.
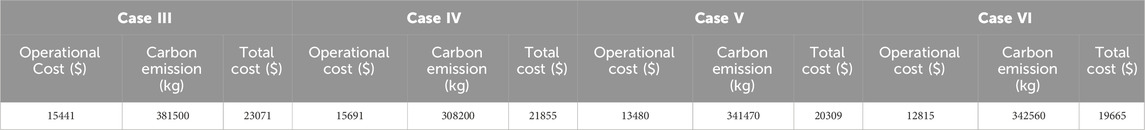
TABLE 6. Comparision of simulation results in three data centers.
To further demonstrate the impact of computation and UPS characteristics on optimization results, we compared the distribution of computing loads on UPS nodes between Case I and Case II, which has been plotted in Figure 7. It can be observed that in Case I, the computing load is evenly distributed, while in Case II, the computing load is mostly distributed on UPS1 and UPS2, which have higher power supply efficiency and lower operating energy consumption. This confirms that computation and UPS characteristics have an effect on computing load distribution.

FIGURE 7. Computational workload distribution in (A) Case I, (B) Case II.
In order to further compare the carbon emissions, the hourly carbon emissions of Case I and Case II were plotted in Figure 8. It can be seen that after optimization (Case II), carbon emissions are significantly reduced.
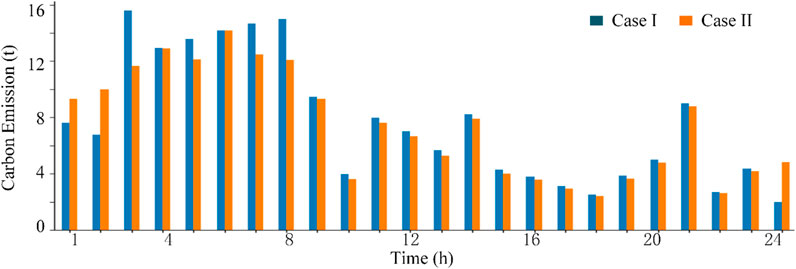
FIGURE 8. Hourly carbon emission in Case I and Case II.
4.4.2 Result in multiple data center
The simulation results of Case III to Case VI has been listed in Table. 7.
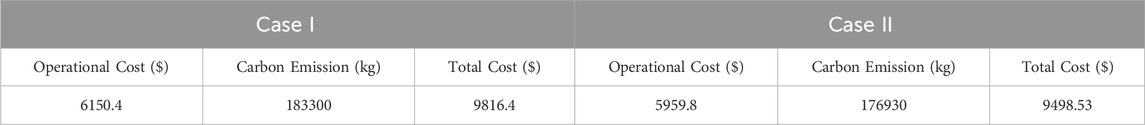
TABLE 7. Comparision of simulation results in single data center.
By comparing Case III and Case V, it can be shown that the operational cost, carbon emission and total cost in Case V decreased by approximately 12.7%, 10.5%, and 11.9% respectively, which has proved that the workload scheduling among multiple data center micro grids can bring about significant improvement in energy consumption and carbon emission reduction compared to single data center scheduling.
By comparing Case IV and Case V, it can be shown that the carbon emission has decreased by 10.76% compared to Case V, while the operational cost and total cost in increase 16.38% and 7.61% respectively, which has illustrated that the multi-objective optimization can perform better than the single-objective optimization.
Furthermore, by comparing Case V and Case VI, it can be concluded that Case VI resulted in a decrease of approximately 4.93%, 0.32%, and 3.17% for the operational cost, carbon emission, and total cost, respectively, compared to Case V. This has proved that considering UPS characteristics in the multiple data center scheduling can still reduce the total costs and carbon emission, and the Case VI which has adopted the proposed method performs better than any other cases.
4.4.3 Application and shortcomings
The proposed method can be easily implemented in the existing infrastructure without the need to add new hardware or change the platform since the self-contained network devices can sufficiently support the application of the proposed scheduling method.
Another difficulty that may hinder the application of our method is the control of the micro grid devices and the cooperative operation with data centers. However, the development of communication technology and automatic controllers makes such interaction conveniently (Cui, 2016). Therefore, this difficulty can be easily overcome in implementation.
The servers in this paper are modeled to be of the same type. However, in implementation, there are also data centers where the servers are heterogeneous. This method may not be applicable to heterogeneous data centers. The joint workload scheduling in heterogeneous data centers can be further explored in the future research.
5 Conclusion
This article proposes a dual-objective optimization method for the operational cost and carbon emission of a multi-data center micro grid that considers the characteristics of Uninterruptible Power Supplies (UPS) and load flexibility. The article improves the energy consumption model of UPS and fully utilizes the scheduling flexibility of computing loads in time and space dimensions. Carbon tax is used as a balancing criterion to compromise the optimization objectives of carbon emission and operational cost, achieving further optimization of both cost and carbon emission. Simulation results indicate that the proposed method effectively reduces operational costs by 4.93%–12.7%, decrease carbon emissions by up to 10%, and lower total costs by 3.17%–11.9%.
Data availability statement
The original contributions presented in the study are included in the article/Supplementary material, further inquiries can be directed to the corresponding author.
Author contributions
XH: Conceptualization, Methodology, Software, Writing–original draft. PL: Formal Analysis, Methodology, Software, Writing–original draft. YD: Conceptualization, Resources, Supervision, Visualization, Writing–review and editing.
Funding
The author(s) declare that no financial support was received for the research, authorship, and/or publication of this article.
Conflict of interest
Author H-GG was employed by Ningxia Hongdunzi Coal Ind.
The remaining authors declare that the research was conducted in the absence of any commercial or financial relationships that could be construed as a potential conflict of interest.
Publisher’s note
All claims expressed in this article are solely those of the authors and do not necessarily represent those of their affiliated organizations, or those of the publisher, the editors and the reviewers. Any product that may be evaluated in this article, or claim that may be made by its manufacturer, is not guaranteed or endorsed by the publisher.
References
Ahmed, M. H., Fei, C., Lee, F. C., and Li, Q. (2017). 48-V voltage regulator module with PCB winding matrix transformer for future data centers. IEEE Trans. Industrial Electron. 64 (12), 9302–9310. doi:10.1109/tie.2017.2711519
Brannvall, R. “EDGE: microgrid data center with mixed energy storage,” in Proceedings of the Eleventh ACM International Conference on Future Energy Systems, Sydney, Australia, June 2020, 466–473.
CAISO (2023). CAISO. http://www.caiso.com.
Cao, F., Wang, Y., Zhu, F., Cao, Y., and Ding, Z. (2019). UPS node-based workload management for data centers considering flexible service requirements. IEEE Trans. Industry Appl. 55 (6), 5533–5542. doi:10.1109/tia.2019.2933791
Carbon Tax Center, (2021). Where carbon is taxed. Available: http://www.carbontax.org/where-carbon-is-taxed/.
Cui, X., Wang, X., and Zhang, Y. (2016). Residential Appliances Direct load control in real-time using cooperative game. IEEE Trans. Power Syst. 31 (1), 226–233. doi:10.1109/tpwrs.2015.2391774
Delforge, P. (2014). Americas data centers consuming and wasting growing amounts of energy. New York, NY, USA: Natural Resource Defense Council.
Ding, Z., Xie, L., Lu, Y., Wang, P., and Xia, S. (2018). Emission-aware stochastic resource planning Scheme for data center microgrid considering batch workload scheduling and Risk management. IEEE Trans. Industry Appl. 54 (6), 5599–5608. doi:10.1109/tia.2018.2851516
EIA (2023). Available: https://www.eia.gov/.
ERCOT (2023). Available: http://www.ercot.com.
Guo, J. “Who limits the resource efficiency of my datacenter: an analysis of alibaba datacenter traces,' IWQoS '19,” in Proceedings of the International Symposium on Quality of Service, Phoenix, Arizona, June 2019, 39.
Hu, B., Cao, Z., and Zhou, M. (2021). Energy-minimized scheduling of real-time parallel workflows on heterogeneous distributed computing systems. IEEE Trans. Serv. Comput. 15 (5), 2766–2779. doi:10.1109/tsc.2021.3054754
Li, C., Liu, Y., Cao, Y., Tan, Y., and Tang, S., (2011). Consistency evaluation of low-carbon generation dispatching and energy-saving generation dispatching. Proc. CSEE 31 (31), 1–8.
Li, J., and Qi, W. (2018). Toward optimal operation of internet data center microgrid. IEEE Trans. Smart Grid 9 (2), 971–979. doi:10.1109/tsg.2016.2572402
Liu, J., Xu, Z., Wu, J., Liu, K., Sun, X., and Guan, X. (2023). Optimal planning of internet data centers decarbonized by hydrogen-water-based energy systems. IEEE Trans. Automation Sci. Eng. 20 (3), 1577–1590. doi:10.1109/TASE.2022.3213672
Liu, X., Xie, L., and Liu, W., (2012). Coordinated energy cost management of distributed internet data centers in smart grid. IEEE Trans. Smart Grid 3 (1), 50–58. doi:10.1109/tsg.2011.2170100
Liu, Y., Wei, X., Xiao, J., Liu, Z., Xu, Y., and Tian, Y. (2020). Energy consumption and emission mitigation prediction based on data center traffic and PUE for global data centers. Glob. Energy Interconnect. 3 (3), 272–282. doi:10.1016/j.gloei.2020.07.008
Luo, Y., Andresen, J., Clarke, H., Rajendra, M., and Maroto-Valer, M. (2019). A decision support system for waste heat recovery and energy efficiency improvement in data centres. Appl. Energy 250 (1), 1217–1224. doi:10.1016/j.apenergy.2019.05.029
Misaghian, M. S., Tardioli, G., Cabrera, A. G., Salerno, I., Flynn, D., and Kerrigan, R. (2023). Assessment of carbon-aware flexibility Measures from data centres using machine learning. IEEE Trans. Industry Appl. 59 (1), 70–80. doi:10.1109/TIA.2022.3213637
Na, H., Sun, J., Qiu, Z., Yuan, Y., and Du, T. (2022). Optimization of energy efficiency, energy consumption and CO2 emission in typical iron and steel manufacturing process. Energy 257, 124822. doi:10.1016/j.energy.2022.124822
Ni, J., and Bai, X. (2017). A review of air conditioning energy performance in data centers. Renew. Sustain. Energy Rev. 67, 625–640. doi:10.1016/j.rser.2016.09.050
Nyiso, (2023). Available: http://www.nyiso.com.
Peter, A. (2017). Data centers and advanced microgrids. Rueil-Malmaison, France: Schneider Electric.
Pratt, A., Kumar, P., and Aldridge, T., “Evaluation of 400V DC distribution in Telco and data centers to improveenergy efficiency,” in Proceedings of the 29th International Telecommunications Energy Conference, Rome, Italy, 32–39.
Qi, W., Li, J., Liu, Y., and Liu, C. (2019). Planning of distributed internet data center microgrids. IEEE Trans. Smart Grid 10 (1), 762–771. doi:10.1109/tsg.2017.2751756
Ting, Y., Jiang, H., Hou, Y., and Geng, Y., (2022). Study on carbon neutrality regulation method of interconnected multi-datacenter based on spatio-temporal dual-dimensional computing load migration. Proc. CSEE 42 (01), 164–177.
Wang, Q., Guan, Y., and Wang, J. (2012). A chance-constrained two-stage stochastic program for unit commitment with uncertain wind power output. IEEE Trans. Power Syst. 27 (1), 206–215. doi:10.1109/tpwrs.2011.2159522
World Bank Group (2020). State and trends of carbon pricing 2020. Available: https://openknowledge.worldbank.org/handle/10986/33809.
Wu, Z., Chen, L., Wang, J., Zhou, M., Li, G., and Xia, Q. (2023). Incentivizing the spatiotemporal flexibility of data centers toward power system coordination. IEEE Trans. Netw. Sci. Eng. 10 (3), 1766–1778. doi:10.1109/TNSE.2023.3234445
Yang, T., Jiang, H., Hou, Y., and Geng, Y. (2023). Carbon management of multi-datacenter based on spatio-temporal Task migration. IEEE Trans. Cloud Comput. 11 (1), 1078–1090. doi:10.1109/TCC.2021.3130644
Ye, G., and Gao, F., (2022). Coordinated optimization scheduling of data center and electricity retailer based on cooperative game theory. CPSS Trans. Power Electron. Appl. 7 (3), 273–282. doi:10.24295/cpsstpea.2022.00025
Yu, L., Jiang, T., Cao, Y., and Qi, Q. (2014). Carbon-aware energy cost minimization for distributed internet data centers in smart microgrids. IEEE Internet Things J. 1 (3), 255–264. doi:10.1109/jiot.2014.2322606
Zhang, Y., Zhang, B., Zhou, Y., Xu, H., and Liu, W., (2023). Research on interactive integration planning of data centers and distribution network driven by carbon emission reduction. Trans. China Electrotechnical Soc. 38 (23), 6433–6450.
Zhao, S., Khan, N., Nagarajan, S., and Trescases, O. (2019). Lithium-ion-capacitor-based distributed UPS architecture for reactive power mitigation and phase balancing in datacenters. IEEE Trans. Power Electron. 34 (8), 7381–7396. doi:10.1109/tpel.2018.2878682
Keywords: data center, multiple micro-grids, optimal scheduling, carbon emission, demand response
Citation: Hao X, Liu P and Deng Y (2024) Joint optimization of operational cost and carbon emission in multiple data center micro-grids. Front. Energy Res. 12:1344837. doi: 10.3389/fenrg.2024.1344837
Received: 26 November 2023; Accepted: 18 January 2024;
Published: 20 February 2024.
Edited by:
Rufeng Zhang, Northeast Electric Power University, ChinaReviewed by:
Weiqi Wang, Shandong University of Science and Technology, ChinaZhan Ma, RWTH Aachen University, Germany
Tao Xu, Shandong University, China
Copyright © 2024 Hao, Liu and Deng. This is an open-access article distributed under the terms of the Creative Commons Attribution License (CC BY). The use, distribution or reproduction in other forums is permitted, provided the original author(s) and the copyright owner(s) are credited and that the original publication in this journal is cited, in accordance with accepted academic practice. No use, distribution or reproduction is permitted which does not comply with these terms.
*Correspondence: Xiaobo Hao, Mzc0OTY5MDBAcXEuY29t