 Wei Xiao1
 Ruofu Xiao
 Ran Tao
- 1Pumped Storage Technology and Economy Research Institute of State Grid Xinyuan Company Ltd., Beijing, China
- 2College of Water Resources and Civil Engineering, China Agricultural University, Beijing, China
- 3Beijing Engineering Research Center of Safety and Energy Saving Technology for Water Supply Network System, China Agricultural University, Beijing, China
Pumped storage is an important component of electrified wire netting. The safe and stable operation of pump turbines is extremely important. Among them, pressure pulsation is one of the main causes of pump turbine vibration. The characteristics of pressure pulsation are relatively complex, and it is difficult to directly observe their temporal changes using commonly used FFT methods. The division of frequency characteristics is often vague. Meanwhile, it is difficult to explain some phenomena such as frequency doubling. This article focuses on a certain model of pump turbine and uses SST model to numerically simulate the runaway condition of the pump turbine. And the Hilbert Huang transform method is used to analyze the pressure pulsation in the vaneless region and draft tube. The results show that the main characteristic frequencies of the vaneless region are blade passing frequency 112.5 Hz and rotational frequency 12.5 Hz. The main characteristic frequencies of the draft tube are vortex rope frequency near 3 Hz which energy ratio is up to 50%, rotational frequency, and blade passing frequency. The pressure pulsation characteristics in the vaneless region have changed from a complex composition of double blade passing frequency and rotational frequency to a distribution dominated by blade passing frequency. In the passage of the guide vane, the pressure pulsation is almost only characterized by blade passing frequency. The frequency characteristics of the vaneless region between the runner and the guide vane become complex again. Meanwhile, the results show that the characteristic frequencies of the vaneless region and the draft tube propagate upstream and downstream.
1 Introduction
Due to environmental damage, traditional energy is gradually transitioning towards new energy. New energy sources such as solar energy, wind energy, and nuclear energy have been vigorously developed (Carlson and Davidson, 2021; Ji et al., 2022; Kong et al., 2022). However, it poses a huge burden on the safe and stable operation of the electrified wire netting (Quaranta et al., 2021). Therefore, pumped storage units, as a typical energy storage system, have been widely used in electrified systems (Li et al., 2019; Bahzad et al., 2022). The vibration problem of pumped storage power plants has always been an inevitable important problem. Unit vibration can reduce the operating efficiency of the unit, causing vibrations in the volute, inflow pipeline, and plant structure (Pei et al., 2014). The causes of typical hydraulic machinery vibration are divided into mechanical vibration, hydraulic vibration, and electromechanical vibration. During the operation of the “Anapo” pumped storage power plant in Sicily, Italy, there was significant vibration in the guide vanes, and the vibration mainly came from the vaneless region (Mauro et al., 2019). Egusquiza et al. (2012). Reported an investigation into a malfunction of a large pump turbine runner caused by rotor stator interaction. Further research has shown that the pressure pulsation in the vaneless region is the main cause of failure. The powerhouse structure of pumped storage power stations is mainly located underground. With the advancement of technology, pump turbines are required to develop towards the direction of high efficiency, high flow rate, and high operating range. The diverse operating conditions have made it easier for the unit to operate at deviations from the design point, resulting in increasingly severe harm caused by hydraulic vibration. Therefore, for the safety and economic considerations of personnel and equipment, vibration urgently need to be reduced.
At the turbine conditions of pump turbines, the stability problem of the transition process is mainly caused by the S characteristic (Trivedi et al., 2017; Suh et al., 2021). Due to the fact that reversible water pump turbines often have lower specific speeds, larger runner diameters, and stronger centrifugal effects. The inflow of the runner will quickly decrease due to inertia when passing through the runaway condition. Because of the obstruction of liquid, the runner rotation speed will decrease. When at the reverse pump condition, the runner rotation speed will increase again. The characteristic forming a curve shaped like “S", named as “S" characteristic. “S" characteristic may cause pump turbines into different condition, leading to significant instability. For example, Zeng et al. (2017) found that the water hammer pressure during load rejection of a pump turbine is highly correlated with the S characteristic. Zhang et al. (2020) found that the strong radial force on the runner may cause the shaft oscillation of the generator set at runaway condition.
In order to clarify the pressure pulsation and vibration characteristics, a large number of scholars have conducted relevant experimental and numerical simulation studies. The pressure pulsation in the vaneless region is mainly caused by the interaction between the runner blades and guide vanes, which is also known as rotor stator interaction. The phenomenon of rotor stator interaction is mainly caused by two factors. One is that the blades of the runner rotate periodically and interfere with the inviscid flow field in the vaneless region, resulting in periodic changes in the flow field. Secondly, the viscous effect of the fluid leads to unstable flow phenomena (Agnalt et al., 2019). Therefore, rotor stator interaction can be considered as inviscid interaction and viscous interaction (Zuo et al., 2015). Trivedi et al. (2013) found that the rotor stator interaction leads to unstable pressure pulsations, which are high-frequency pressure pulsations through experiments and numerical simulations. KC et al. (2014) and Goyal et al. (2016), Goyal et al. (2018) found that the pressure pulsation in the vaneless region is mainly caused by rotor stator interaction with a frequency several times number of the guide vanesSome scholars at home and abroad have studied the influence conditions of rotor stator interaction to control its amplitude. Trivedi (Chirag et al., 2014; Trivedi et al., 2014; Trivedi et al., 2016; Trivedi et al., 2018a; Trivedi et al., 2018b) has conducted long-term research on the transient process of mixed flow hydraulic turbines. During the research process, it was found that during the transient process, the amplitude of pressure pulsation in the vaneless region showed a significant increase, and there was a certain functional relationship between the amplitude of pressure pulsation and the opening of the guide vanes. When the transient process ends, the amplitude of pressure pulsation will sharply increase by 30 times. Laouari and Ghenaiet, (2019) demonstrated that the amplitude of pressure pulsation caused by rotor stator interaction increases with the increase of guide vane opening. And the pressure pulsation generated varies with the angle of rotation. Wallimann and Neubauer (2015) found comparison that found that the radial distance of the vaneless region affects its amplitude through three-dimensional unsteady calculations and experimental results.
As one of the typical characteristics of pressure pulsation, the vortex rope mainly appears in the draft tube at partial load conditions. Due to its generally low frequency, resonance is prone to occur. Baya et al. (2010) found that the frequency of the vortex rope in the draft tube is 0.2–0.4 times the rotational frequency at partial load conditions caused vibration. Yexiang et al. (2010) indicated that as the load increases from small to large, the pressure pulsation in the draft tube first increases, then decreases, and then increases again. Nicolet et al. (2010), Nicolet et al. (2011) and Kuznetsov et al. (2014) found that the vortex rope in the draft tube is the excitation source of resonance phenomenon, and due to the comprehensive excitation of rotation, cavitation, and fluid structure coupling effects of the vortex rope in the draft tube, a typical pressure pulsation characteristic of 1–3 times the rotational frequency was generated. Favrel et al. (2014) found that the resonance phenomenon is mainly caused by the precession frequency of the vortex rope in the draft tube. Duparchy et al. (2015) found that the synchronous component signal of vortex rope was amplified, causing severe vibration of the unit. Pasche et al. (2019) found that the synchronous component signal is the coupling between the draft tube vortex rope and the draft tube wall, which propagates upstream and downstream. Its source may be located at the impact of the draft tube wall and vortex rope. Favrel et al. (2016) also observed three forms of vortex rope in the draft tube through PIV technology and found that there is a sudden change in the vortex rope during the flow state change process, exacerbating instability.
This article focuses on the model machine of a certain model of water pump turbine. By using the Hilbert Huang transform method, analyze the pressure pulsation in the vaneless region and draft tube under runaway conditions. To explain and analyze the pressure pulsations in the vaneless region and draft tube under runaway conditions and the reasons for their formation. The innovation of this article is to use the HHT method to analyze the pressure pulsation characteristics under runaway conditions, clarify the main sources of pressure pulsation in each region, and prove its propagation characteristics towards upstream and downstream as the flow direction changes.
2 Research objective
2.1 Reversible pump-turbine model
In this study, the research objective is a reversible pump-turbine in model scale. The model is 1:9 times that of the prototype. As shown in Figure 1, the reversible pump-turbine has five components as follows: volute, stay vane, guide vane, runner and draft tube. The runner rotates around Z-axis. In turbine mode, the flow is from volute to draft tube and the runner rotates counterclockwise. In pump mode, the flow is from draft tube to volute and the runner rotates clockwise. The high-pressure side and low-pressure side diameters of runner are 560 mm and 300 mm, respectively. The width of runner high pressure side is 57.2 mm. The numbers of runner blade, guide vane blade and stay vane blade are 9, 20 and 20, respectively. The maximum angle of guide vane opening is 38°.
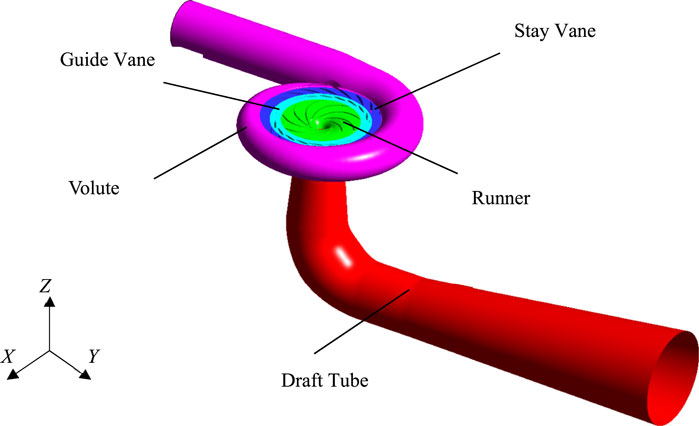
FIGURE 1. Components of the reversible pump-turbine model.
Unit speed n11 and unit discharge Q11 are defined as:
where
2.2 Model test rig and apparatus
The experimental study was conducted on the test rig shown in Figure 2. The components of test rig are as follows: test pump-turbine model, reservation tank, motor, cavitation tank, flow stabilization tank, flow meter, supply pump, pipe and valve. The test rig is designed for the experiment of pump-turbine. Based on the IEC-60193–1999, ‘S’ shape characteristics were measured. The maximum test head of test rig is 120 m. The maximum flow rate of test rig is 1.2 m3/s. The dynamometer output of test rig is 600 kw. The dynamometer maximum rotating speed of test rig is 1900rpm. The tailwater pressure of test rig is -85-250kpa.
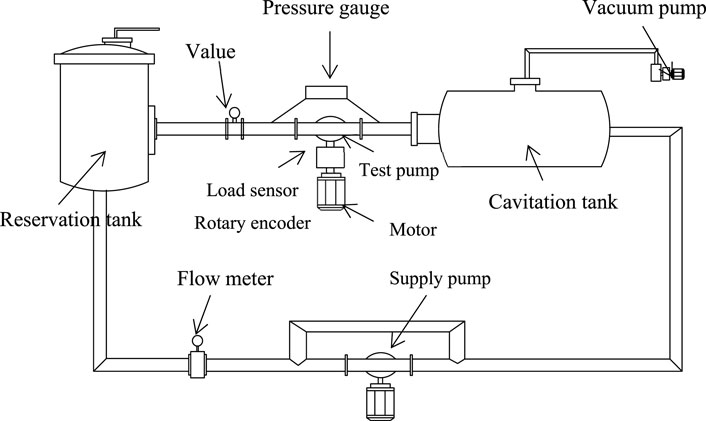
FIGURE 2. Schematic of the test rig.
Data acquisition is based on PXI (Peripheral Component Interconnection extensions for Instrumentation) system. The test parameters are measured by corresponding sensors. The apparatuses used for pump-turbine testing and the corresponding uncertainties are shown in Table 1. The flow rate is measured by using electromagnetic flowmeter with the uncertainty of ± 0.18%. The rotation speed is measured by using rotary encoder with the uncertainty of ± 0.02%. The head is measured by using differential pressure sensor with the uncertainty of ±0.05%. The Torque is measured by using load sensor with the uncertainty of ±0.05% and excitation amplifier with the uncertainty of ± 0.02%. The tailwater pressure is measured by using static pressure sensor with the uncertainty of ± 0.10%. The guide vane opening angle is measured by using angular displacement sensor with the uncertainty of ± 0.10°. The shaft power is calculated by torque and rotational speed. The efficient is calculated by the flow rate, head and shaft power, with uncertainty within ± 0.25%.
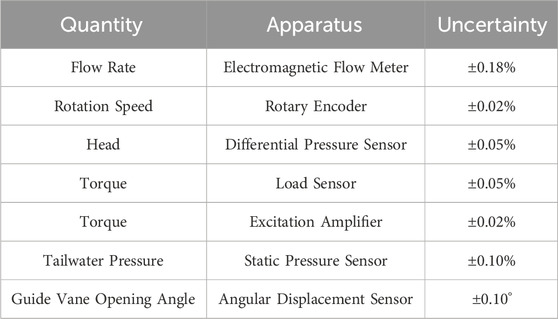
TABLE 1. Test apparatus and uncertainty.
3 Numerical method and setup
3.1 Numerical method for turbulent flow and energy dissipation
In this study, the numerical simulation is based on the CFD. The three-dimensional incompressible flow is simulated based on the Reynolds average Navier-Stokes (RANS) method. Because of the turbulent pulsation term, the equations are not closed. Therefore, it is necessary to construct a turbulence model to close the equations. In this paper, the SST k-ω model (Menter, 1994) is chosen to close by establishing the relationship between Reynold’s stress and eddy viscosity. This model has good simulation results for large curvature flow and separated flow. A large number of researches show that this model can be used in CFD simulation of engineering problems. The kinetic energy
where
The analysis method of Fourier transform is mainly based on the assumption of linearity and stationarity, but in most systems, the data is closer to including both nonlinearity and non-stationary. The signal of pressure pulsation is often complex and non-sinusoidal. Therefore, FFT often presents many fallacies or incorrect information. Meanwhile, non-periodic, time-varying or impulsive features are often hidden. HHT has effectively solved the above problems. Therefore, new methods are needed to address this type of data analysis. Hilbert Huang Transform (HHT) is an empirical data analysis method with adaptive expansion basis, which can obtain physically meaningful representations of nonlinear non-stationary data (Huang et al., 1998). HHT is divided into two parts: empirical mode decomposition (EMD) and Hilbert transform (HT). This method was proposed by Huang in 1998. Huang believes that any complex signal can be decomposed into a finite number of intrinsic mode functions (IMF), and then HT is performed on each IMF component to obtain physically meaningful instantaneous frequencies, Hilbert spectra, and energy distributions, in order to intuitively represent the time-frequency characteristics of each component of the original signal.
The IMF has two conditions:
1) In the entire data, the number of extreme points and zero crossing points is either equal or at most 1 difference.
2) The mean of the envelope defined by the local maximum and the envelope defined by the local minimum at any point is equal to 0.
Each IMF represents a simple oscillation mode, corresponding to a simple harmonic function, but it is more general: it replaces the constant amplitude and frequency in a simple harmonic function, and the IMF can have varying amplitude and frequency as a function of time. Usually, the original signal cannot meet the conditions of IMF, so Huang obtained IMF through empirical mode decomposition. According to the definition of the IMF, decomposition is carried out by identifying all local extremum values, obtaining the upper and lower envelopes using a cubic spline function. The upper and lower envelopes should cover all data, and then taking the mean of the envelopes to obtain the IMF. Subtract the obtained IMF from the original signal to obtain the intermediate signal, and then repeat the above steps. Stop decomposition until the requirements are met. In this way, the raw data can be decomposed into several IMF and one residual term Rn.
For a given IMF, the Cauchy principal value of the convolutional integral can be obtained through Hilbert transform to obtain the HT result:
Where t is the integral variable of HT, and p. v is the Cauchy principal value integral. By using the Hilbert transform, the analytical signal can be obtained as follows:
In the formula, ÅÅ t Å is the instantaneous phase, A (t) is the instantaneous amplitude, and their functional relationship with the original signal is as follows:
The instantaneous frequency ω(t) is the derivative of the instantaneous phase:
After obtaining the IMF and its HT results and corresponding analytical signals, correlation analysis of the Hilbert spectrum can be performed on them. After using the Hilbert transform, the obtained Hilbert amplitude spectrum H (ω,t) can be represented in the real part of the analytical signal:
Where K is the number of IMF. In order to further clarify the importance and proportion of each IMF in the signal, the energy ratio Ep is defined as follows
3.2 Setup of CFD
The CFD simulation was based on ANSYS CFX. In this study, the analyzed working condition is the runaway condition of the pump turbine. The multiple reference frame is adopted to analyze the rotating model. The impeller was defined as a rotating domain by 750 r/min and others were defined as stationary. General grid interface (GGI) is used for the data transfer between the two adjacent domains. In this case, environment variables are set as follows. The reference pressure is set as 101.325 kPa. The fluid medium is water under the reference temperature of 20°C, which is continuous fluid. The simulation con-siders the heat transfer. The turbulence model is chosen SST k-ω model. The steady simulation finishes in 1000 iterations.
The boundary conditions of steady RANS simulation are as follows. In pump mode, the draft tube inflow is set as mass flow rate inlet boundary. The value depends on the flow rate. Turbulence intensity on the inlet boundary is 5%. The draft tube outflow is set as the average static pressure outlet boundary, which relative pressure is 0 Pa. All the wall boundaries are set as no-slip wall where velocity on the wall is zero. The volute inflow is set as flow rate inlet boundary which values are based on the experiment. All the wall boundaries are set as no-slip wall where velocity on the wall is zero.
Because of the need of pressure pulsation analysis, the unsteady RANS simulation is conducted. The steady CFD result is set as the initial condition. The unsteady simulation conducts totally 10 runner revolutions which 1 revolution is divided for 360 steps. The one steps need 20 iterations. The convergence criterion was the root mean square residual (RMS) of the momentum equation and the continuity equation less than 5 × 10⁻⁵. Considering the stability of unsteady calculations, the last five cycles were selected as the results for analysis.
In this study, the arrangement of discrete monitoring points was used to study pressure pulsation as shown in the Figure 3. Due to the pressure pulsation of the pump turbine, the main sources are the vaneless region and the draft tube, seven monitoring points were selected in the draft tube and vaneless region. Five monitoring points are located in the middle of the flow streamline in the middle of the crown and ring of guide vane and stay vane. And two monitoring points are located 0.1 m away from the runner low pressure side in the draft tube.
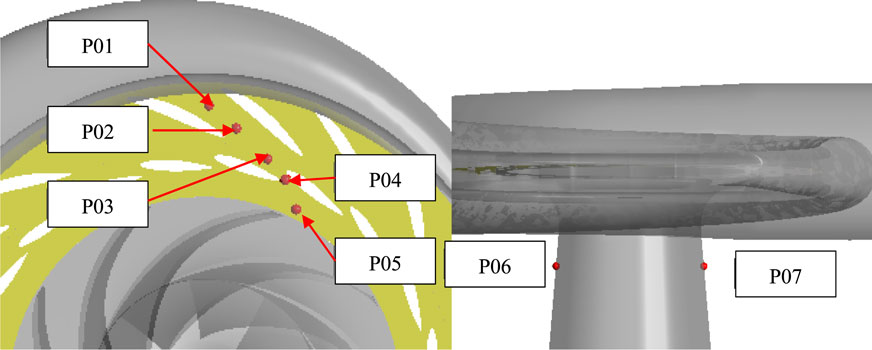
FIGURE 3. Schematic of monitoring points.
3.3 Grid preparation for CFD
To carry out CFD simulation, it is necessary to discretizes the convective domain, which is based on finite volume method. The number of grid elements has an obvious influence on the result. The type of grid has an obvious influence on the convergence and efficiency of calculation. Hence, the Hexahedral grid is selected to improve computational efficiency. The grid convergence index (GCI) (Celik and Karatekin, 1997)is used to check the three different grid schemes.
The fine, medium and coarse grids have 11056456, 5185591 and 2376580 elements based on refinement ratio of 1.3. The index is the pressure of the monitoring points in the vaneless, guide vane and stay vane. As shown in Table 2,
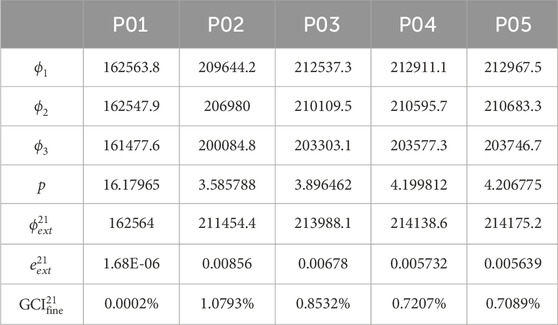
TABLE 2. Evaluation results of discretization error.
The detailed information of mesh nodes and elements of medium scheme is shown in Figure 4 and Table 3. In this study, the values of
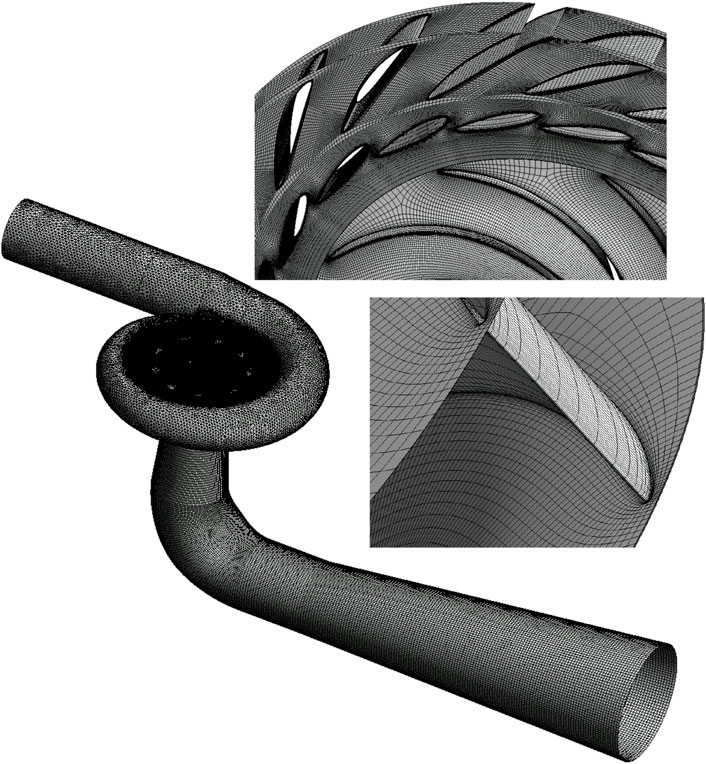
FIGURE 4. Schematic map of grid using in CFD simulation.
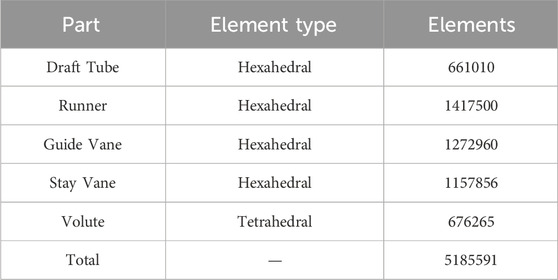
TABLE 3. Mesh number details of the computational domain.
4 Results and analyses
4.1 Experimental-numerical accuracy
For the accuracy of the numerical simulation results, a validation is necessary to compare CFD and experimental data. The ‘S’ shape characteristic curve of the pump turbine is shown in Figure 5. The figure shows the relationship between torque N and unit speed n11, as well as the relationship between unit discharge Q11 and unit speed n11. It can be observed that at the runaway point position (N = 0), the experimental and CFD results are in good agreement, with a unit speed error of approximately 0.4%. The overall curve trend is relatively matched, with a clear ‘S’ shape. Explain that the numerical simulation results are relatively accurate.
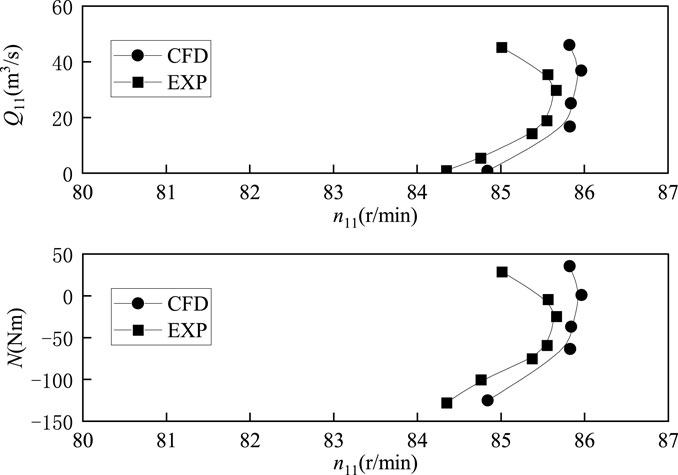
FIGURE 5. Comparison between CFD and experimental of ‘S’ shape characteristic.
4.2 Pressure pulsation analysis in the vaneless region
In this study, the direction of flow is from the volute to the draft tube. Figure 6, Figure 7, Figure 8, Figure 9, Figure 10 show the empirical mode decomposition results of monitoring points in the vaneless region. Table 4 shows the energy ratios of each IMF at this point. Table 5 shows the center frequencies of each IMF after monitoring point decomposition. Point P01 is located near the volute in the stay vane flow channel. There are five main modes of pressure pulsation at this point, among which the energy proportion of IMF1 is the highest, accounting for 31.36%. And IMF2 is the second highest, accounting for 22.93%. It can be observed that overall, the energy share of the five IMF’s is relatively close. According to Figure 6 and Table 4, it can be observed that the center frequency of IMF1 is 261.22, and the overall time signal of IMF1 shows a discontinuous pattern. After Fourier transform, the double blade passing frequency is the main high amplitude frequency. The center frequency of IMF2 is 166.54. The time signal of IMF2 is relatively continuous, and after Fourier transform, it contains blade passing frequency components and double blade passing frequency components. The center frequency of IMF3 is 68.56, and after Fourier transform, the main frequency of the components is similar to the center frequency. The center frequency of IMF4 is 13.79, and after Fourier transform, its main component is rotational frequency. The center frequency of IMF5 is 6.62, which is a typical low frequency. It can be observed that at point P01, except for IMF5, all other components account for a considerable proportion, indicating that the frequency component at this point is relatively complex. According to Figure 11, it can be observed that there is a significant periodic signal present at the double blade passing frequency position, and the components at this position also occupy the main position. But the corresponding instantaneous frequency changes quickly. In contrast, the instantaneous frequency of low-frequency components is relatively stable. From the marginal spectrum, it can also be seen that compared to high-frequency components, low-frequency components have a strong influence. This indicates that in this region, the influence of blade passing frequency is relatively discontinuous and varies greatly, while the influence of rotational frequency components is more stable and sustained.
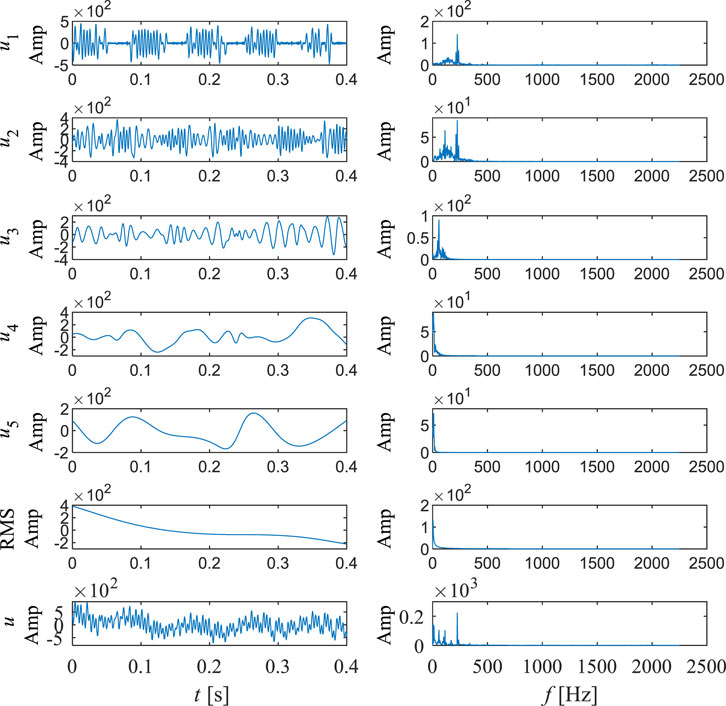
FIGURE 6. Empirical mode decomposition of pressure pulsation signal at P01.
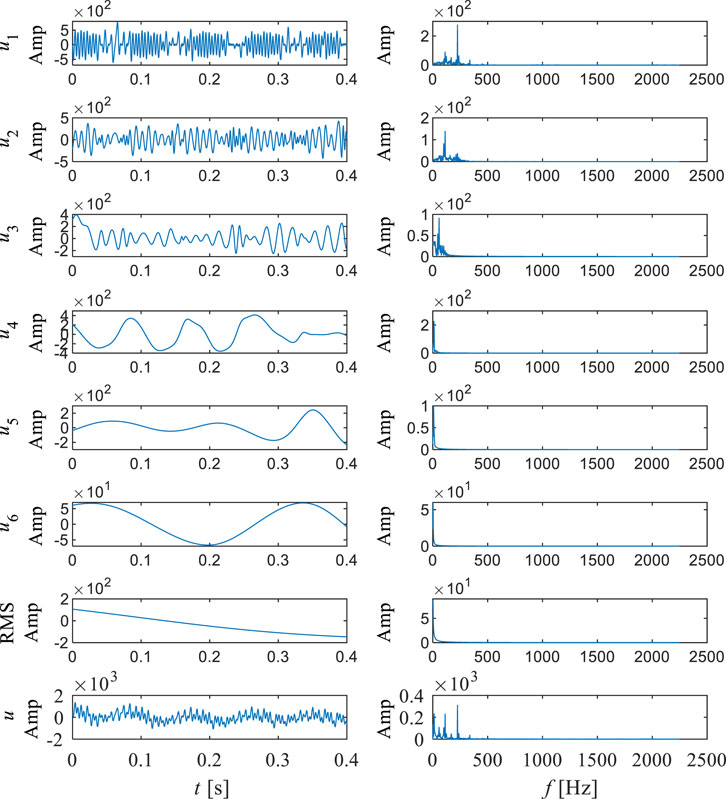
FIGURE 7. Empirical mode decomposition of pressure pulsation signal at P02.
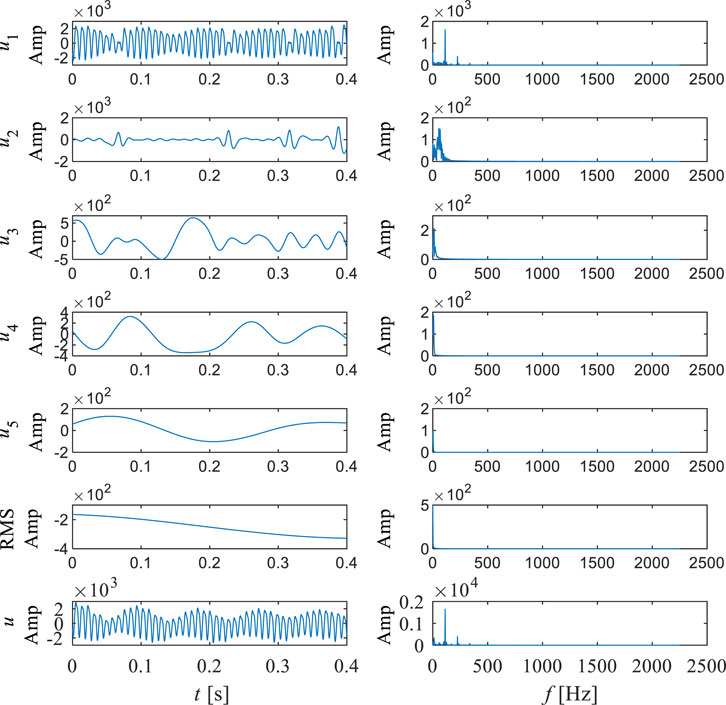
FIGURE 8. Empirical mode decomposition of pressure pulsation signal at P03.
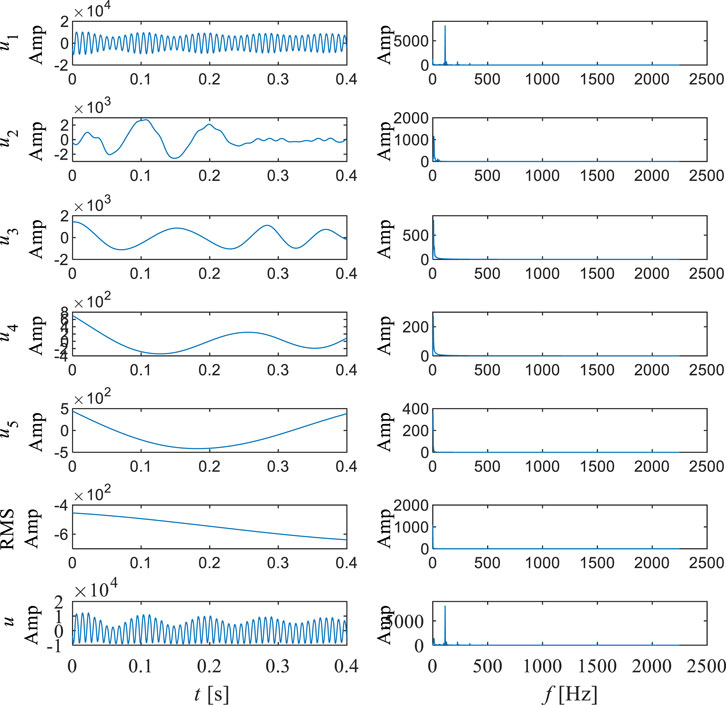
FIGURE 9. Empirical mode decomposition of pressure pulsation signal at P04.
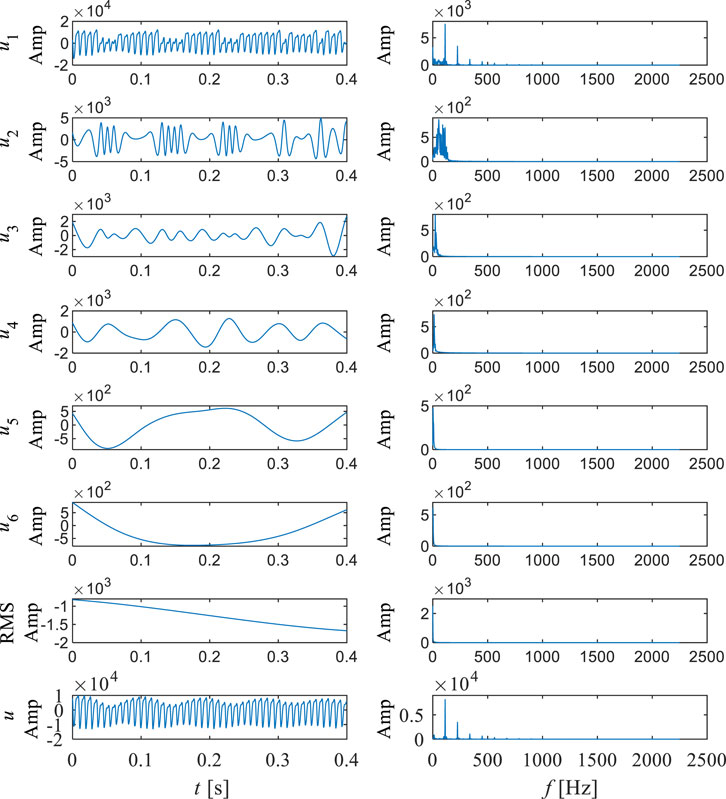
FIGURE 10. Empirical mode decomposition of pressure pulsation signal at P05.
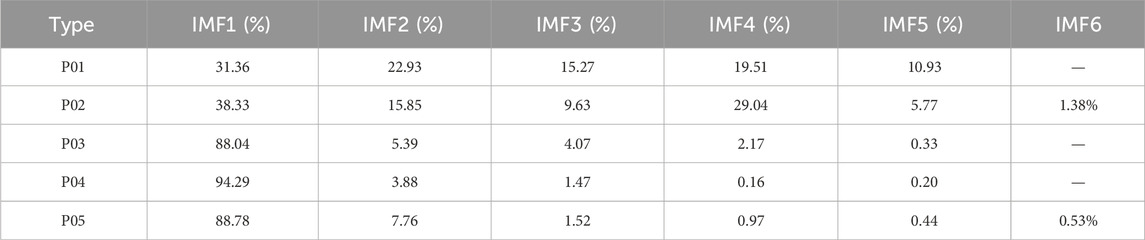
TABLE 4. Energy ratio of each IMF.
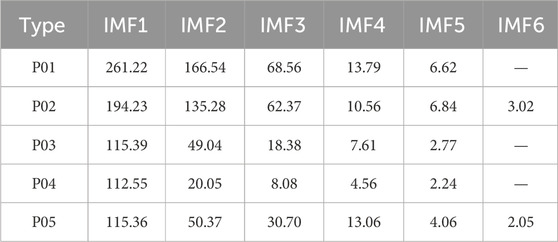
TABLE 5. Center frequency of each IMF.
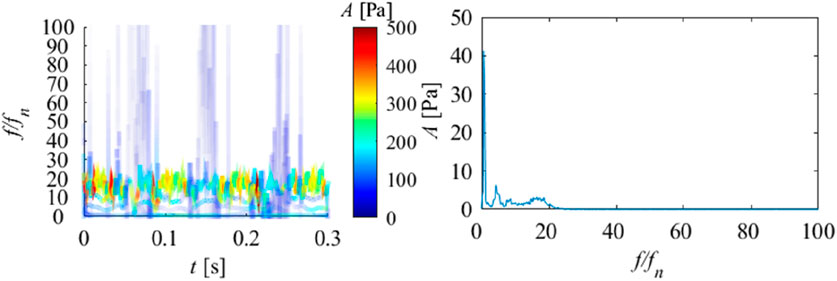
FIGURE 11. Hilbert spectrum (right) and marginal spectrum (left) of pressure pulsation signal at P01.
Point P02 should be located in the middle of the stay vane flow channel. It can be observed that the energy proportion of IMF1 at this position is the highest, accounting for 38.33%, while IMF4 is the second highest, accounting for 29.04%. According to Figure 7 and Table 4, it can be observed that the center frequency of IMF1 is 194.23, and after Fourier transform, the double blade passing frequency is the main high amplitude frequency. Compared to point P01, the discontinuity of IMF1 significantly weakens. The center frequency of IMF2 is 135.28, and after Fourier transform, the blade passing frequency is the main frequency component. The center frequency of IMF3 is 62.37, and after Fourier transform, the main frequency of the components is similar to the center frequency. The center frequency of IMF4 is 10.56, and after Fourier transform, its main component is rotational frequency. The center frequencies of IMF5 and IMF6 are 6.84 and 3.02, which are low-frequency components. It can be observed that the frequency components of this point are still relatively complex, but compared to point P01, the amplitudes of IMF2 and IMF4 are significantly enhanced. This indicates a significant increase in the intensity of blade passing frequency and rotation frequency. According to Figure 12, it can be observed that the Hilbert spectrum and marginal spectrum of P02 are similar to those of P01, but it is evident that at the double blade passing frequency position, the instantaneous frequency is more stable, while the originally occurring high-frequency instantaneous frequency is significantly reduced. This indicates that in this region, the double blade passing frequency and blade passing frequency gradually tend to be stable and continuous, but the rotational frequency is still the most stable and has the longest impact duration.
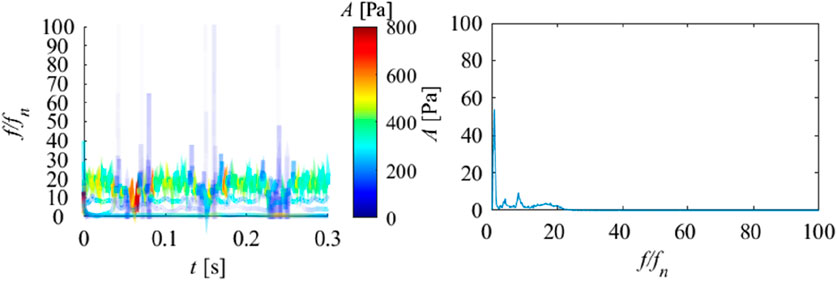
FIGURE 12. Hilbert spectrum (right) and marginal spectrum (left) of pressure pulsation signal at P02.
Point P03 is located in the vaneless region between the stay vane and the guide vane. It can be observed that the energy ratio of IMF1 at this position dominates, accounting for 88.04%. The proportion of other IMF components is extremely low. According to Figure 8 and Table 4, it can be observed that the center frequency of IMF1 is 115.39, and the time signal waveform of IMF1 is relatively continuous. After Fourier transform, the blade passing frequency is the main high amplitude frequency. The center frequency of IMF2 is 49.04. After Fourier transform, it can be found that the frequency component of IMF2 is similar to the IMF3 component of P01 and P02. The center frequencies of IMF4 and IMF5 are 7.61 and 2.77, which are obvious low-frequency components. It can be observed that at point P03, the frequency component becomes clearly defined, and the blade passing frequency becomes the dominant signal. Compared to P01 and P02, the component of blade passing frequency is greatly enhanced, and through Fourier transform, it can be observed that the amplitude of other components has not changed significantly. Double the blade passing frequency becomes the harmonic of the blade passing frequency and is divided into IMF1. According to Figure 13, it can be observed that the instantaneous frequency of high frequency almost disappears, and the instantaneous frequency of blade passing frequency becomes dominant, and is more stable compared to P01 and P02. However, overall, the low-frequency components are the most stable and have the most sustained impact.
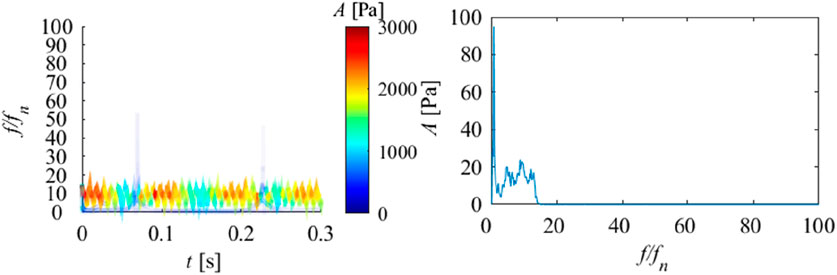
FIGURE 13. Hilbert spectrum (right) and marginal spectrum (left) of pressure pulsation signal at P03.
Point P04 is located in the middle of the guide vane channel, and it can be observed that the energy proportion of IMF1 at this position is the highest, accounting for 38.33%, while IMF4 is the second highest, accounting for 94.29%. According to Figure 9 and Table 4, it can be observed that the signal characteristics of P04 and P03 are very similar. But compared to P03, the original features of IMF2 have disappeared, and IMF1 is almost entirely composed of blade passing frequency components. At the same time, rotational frequency is further enhanced. This indicates that at this location, the characteristics of the signal are relatively pure, mainly composed of blade passing frequency and rotation frequency. According to Figure 14, it can be observed that there are only two frequency features, one near the rotation frequency and the other near the blade passing frequency. Both marginal spectrum and Hilbert spectrum prove that these two frequency features are relatively stable and have the greatest impact.
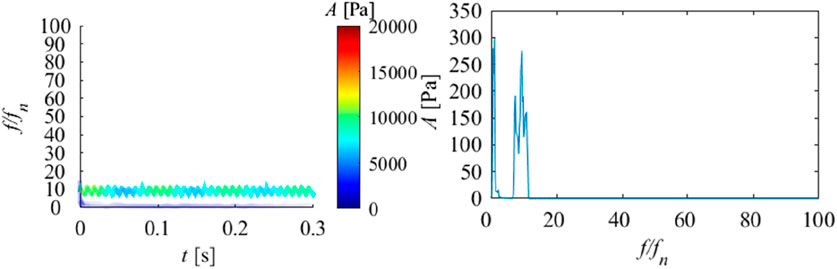
FIGURE 14. Hilbert spectrum (right) and marginal spectrum (left) of pressure pulsation signal at P04.
Point P05 should be located in the vaneless region between the guide vanes and the runner. It can be observed that the energy proportion of IMF1 at this position is the highest, accounting for 88.78%. According to Figure 10 and Table 4, it can be observed that the center frequency of IMF1 is 115.36, and the overall time signal of IMF1 is continuous. After Fourier transform, it is found that it is composed of blade passing frequency and its harmonics. This indicates that in this region, the frequency caused by the rotation of the runner blades is more pronounced, and due to other factors interfering, harmonics occur. The center frequency of IMF2 is 50.37. After Fourier transform, the frequency component of IMF2 is similar to that of IMF2 in P03. It can be observed that at point P05, the IMF components representing blade passing frequency become more complex, while the rotational frequency still has a certain impact. At the same time, specific frequency components between blade passing frequency and rotational frequency have reappeared. According to Figure 15, it can be observed that although the instantaneous frequency near the blade passing frequency still occupies the highest instantaneous amplitude, it becomes unstable again. The low-frequency components have also become relatively unstable. The marginal spectrum also fully proves this point. The effect of rotor stator interaction in the vaneless region between the runner and the guide vane leads to the complexity of pressure pulsation. Overall, in the vaneless and guide vane regions, the blade passing frequency and rotor frequency components are the main sources of pressure pulsations in this region. As water flows from the volute to the runner, the intensity of pressure pulsation gradually increases. The pressure pulsation initially consists of blade passing frequency, double blade passing frequency, rotational frequency, and specific frequency. This specific frequency may be caused by flow separation. Subsequently, as the flow towards the runner increases, the intensity of blade passing frequency and double blade passing frequency significantly increases, and the stability of each IMF under pressure pulsation significantly improves. As the flow reaches the vaneless region of the fixed and guide vanes, the blade passing frequency suddenly increases sharply and becomes more stable. The characteristics of the specific frequency also change, which may be caused by the chaotic flow pattern inside the vaneless region. As the flow reaches the middle of the guide vane, due to the small opening, the flow is constrained, which also leads to the most stable frequency change of the flow in this region, consisting only of blade passing frequency and rotor frequency, and the intensity of blade passing frequency and rotor frequency is improved. Afterwards, in the vaneless region between the runner and the guide vane, due to the effect of rotor stator interaction, harmonics appeared in the blade passing frequency, making the frequency related to the blade passing frequency unstable and greatly enhancing its strength. The frequency also slightly increased, while a specific frequency appeared in the vaneless region between the stay vanes and the guide vanes, further indicating that this frequency may be caused by the chaotic flow pattern inside the vaneless region. At this location, the composition of the pressure pulsation signal becomes extremely complex.
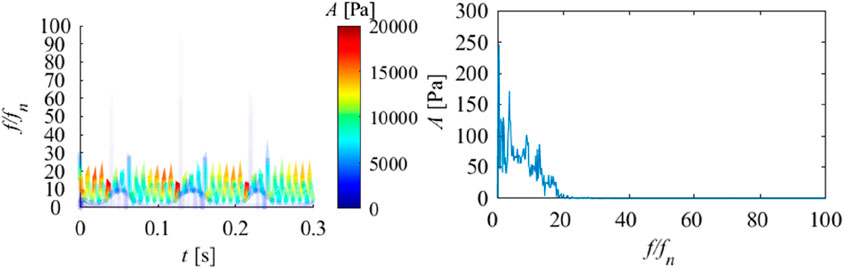
FIGURE 15. Hilbert spectrum (right) and marginal spectrum (left) of pressure pulsation signal at P05.
4.3 Pressure pulsation analysis in the draft tube
Figure 16, Figure 17 show the empirical mode decomposition results of monitoring points in the draft tube. Table 6 shows the energy ratios of each IMF at this point. Table 7 shows the center frequencies of each IMF. P06 and P07 are located symmetrically on the straight cone section of the draft tube. From Table 7, it can be observed that the energy proportion of IMF6 in P06 and P07 is the highest, at 49.44% and 51.51%, with center frequencies of 3.83 and 7.44. It can be seen that in the draft tube, low-frequency components occupy the main energy of pressure pulsation. This indicates that the pressure pulsation caused by the vortex rope in the draft tube has a significant impact on it. Among other IMF, IMF5 accounts for the second largest amount of energy. From the center frequency and Fourier transform of IMF5, it can be seen that this corresponds to rotational frequency. Meanwhile, it can be observed that the third highest energy ratio is IMF3, which corresponds to the blade passing frequency component. As shown in Figures 18, 19, in the Hilbert spectrum and marginal spectrum, it can be found that low-frequency plays an absolute dominant role and is also the main source of pressure pulsation, while other IMF components play a very low role in the entire pressure pulsation. At the same time, there are extremely unstable frequency characteristics at high frequencies, which are speculated to be influenced by fine vortex ropes. Through analysis, it can be found that the pressure pulsations in the vaneless region and the draft tube interact and influence each other. The obvious low-frequency components, rotation frequency, and blade passing frequency can be observed at different monitoring points. At the same time, it indicates that the low-frequency frequency in the vaneless region comes from the action and propagation of the vortex rope in the draft tube. This indicates the characteristic of pressure pulsation propagating upstream and downstream. Overall, under the runaway condition, the pressure pulsation of the draft tube is significantly weaker than that in the vaneless region.
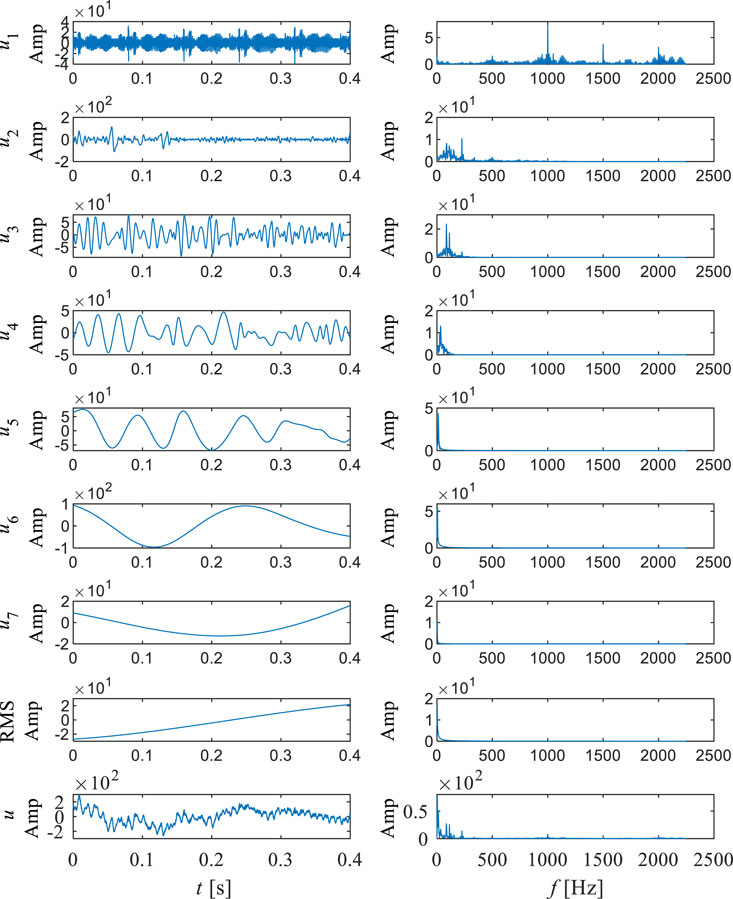
FIGURE 16. Empirical mode decomposition of pressure pulsation signal at P06.
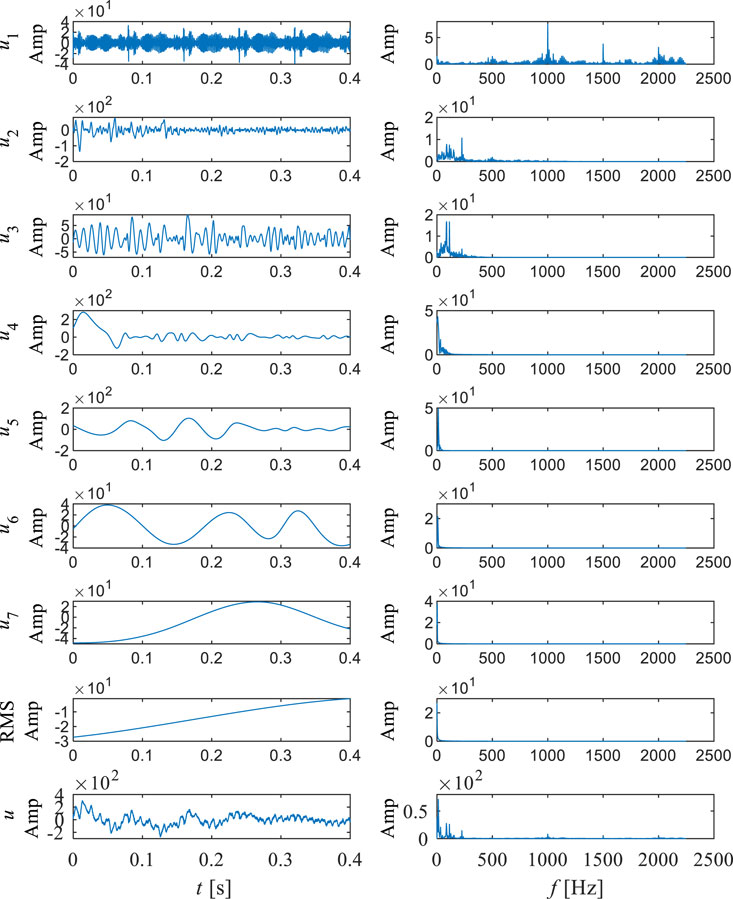
FIGURE 17. Empirical mode decomposition of pressure pulsation signal at P07.
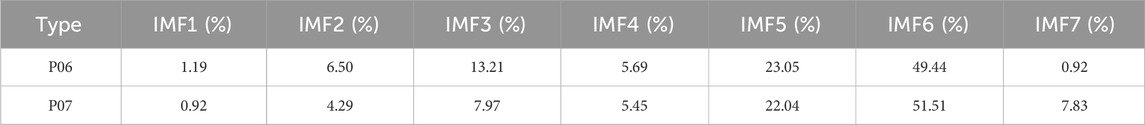
TABLE 6. Energy ratio of each IMF in draft tube.
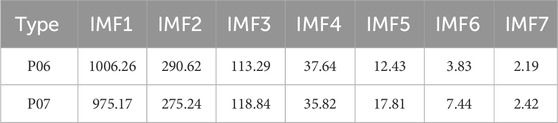
TABLE 7. Center frequency of each IMF in draft tube.
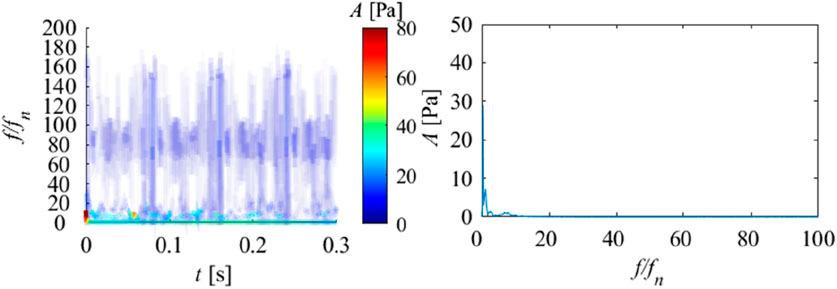
FIGURE 18. Hilbert spectrum (right) and marginal spectrum (left) of pressure pulsation signal at P06.
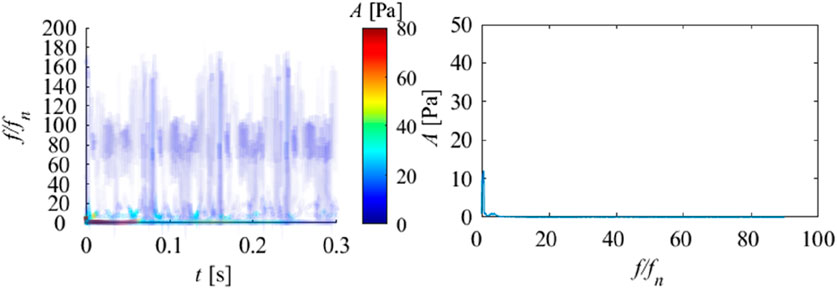
FIGURE 19. Hilbert spectrum (right) and marginal spectrum (left) of pressure pulsation signal at P07.
5 Conclusion
This article adopts the Hilbert Huang transform method to study the pressure pulsation in the vaneless region and draft tube of the runaway condition of the pump turbine. Through research, the following conclusions were obtained:
1) The main components of pressure pulsation in the vaneless region are blade passing frequency, rotational frequency, double blade passing frequency, vortex rope frequency, and specific frequency. The overall composition is relatively complex. The main components of pressure pulsation in the draft tube are vortex rope frequency and rotational frequency. The pressure pulsations in the vaneless region and the draft tube interact and interact with each other. The obvious low-frequency vortex rope characteristics, rotation frequency, and blade passing frequency can be observed at different monitoring points.
2) Through the Hilbert Huang transform, the characteristics of each IMF can be clearly observed, making the signal composition more clear. In stay vanes, the energy of double blade passing frequency and rotational frequency plays a dominant role in pressure pulsation. In the vaneless region of fixed and guide vanes, the blade passing frequency and its harmonics occupy the highest energy. In the guide vane channel, the blade passing frequency occupies almost all of the energy. In the vaneless region of the guide vanes and runners, blade passing frequency and its harmonics play a dominant role, but the overall composition is very complex. At the same time, special frequency characteristics caused by channel separation in stay vanes and chaotic flow patterns in vaneless region were discovered. They have different frequency characteristics.
3) In the vaneless region, as water flows from the volute to the runner, the intensity of pressure pulsation gradually increases. The initial frequency composition of pressure pulsation is caused by blade passing frequency, double blade passing frequency, rotation frequency, and flow separation. Subsequently, as the flow towards the runner increases, the intensity of blade passing frequency and double blade passing frequency significantly increases, and the stability of each IMF under pressure pulsation significantly improves. As the flow reaches the vaneless region of the fixed and guide vanes, the blade passing frequency suddenly increases sharply and becomes more stable. The characteristic frequency caused by the chaotic flow pattern inside the vaneless region has occurred. As the flow reaches the middle of the guide vane, due to the small opening, the flow is constrained, resulting in the most stable frequency variation of the flow in this region, consisting only of blade passing frequency and rotor frequency. Afterwards, in the vaneless region between the runner and the guide vane, due to the effect of rotor stator interaction, harmonics appeared in the blade passing frequency, making the frequency related to the blade passing frequency unstable and greatly enhancing its strength.
Through the research in this article, it has been proven that the Hilbert Huang transform can be effectively applied to the analysis of pressure pulsations in pump turbines. The composition and specificity of pressure pulsation can be observed more effectively and intuitively. It provides a more powerful tool and intuitive display for pressure pulsation analysis. This study provides a reference for the pressure pulsation characteristics generated during the actual operation of pump turbines. Subsequently, based on this research, further research can be conducted on the variation law of pressure pulsation over time under the S-characteristic, and corresponding time-varying analysis can be carried out.
Data availability statement
The original contributions presented in the study are included in the article/Supplementary material, further inquiries can be directed to the corresponding author.
Author contributions
WX: Conceptualization, Data curation, Investigation, Methodology, Software, Supervision, Writing–review and editing. ZG: Data curation, Formal Analysis, Methodology, Project administration, Supervision, Writing–review and editing. ZL: Conceptualization, Formal Analysis, Methodology, Validation, Writing–original draft. RX: Funding acquisition, Resources, Visualization, Writing–review and editing. RT: Formal Analysis, Project administration, Writing–review and editing.
Funding
The author(s) declare financial support was received for the research, authorship, and/or publication of this article. This research was funded by State Grid Xinyuan Group Co., Ltd. Technology Project, grant number SGXYKJ-2023-049.
Acknowledgments
The authors would like to acknowledge the financial support of State Grid Xinyuan Group Co., Ltd. Technology Project, grant number SGXYKJ-2023-049.
Conflict of interest
Authors WX and ZG were employed by Pumped Storage Technology and Economy Research Institute of State Grid Xinyuan Company Ltd.
The remaining authors declare that the research was conducted in the absence of any commercial or financial relationships that could be construed as a potential conflict of interest.
Publisher’s note
All claims expressed in this article are solely those of the authors and do not necessarily represent those of their affiliated organizations, or those of the publisher, the editors and the reviewers. Any product that may be evaluated in this article, or claim that may be made by its manufacturer, is not guaranteed or endorsed by the publisher.
References
Agnalt, E., Iliev, I., Solemslie, B. W., and Dahlhaug, O. G. (2019). On the rotor stator interaction effects of low specific speed francis turbines. Int. J. Rotating Mach. 2019, 1–11. doi:10.1155/2019/5375149
Bahzad, H., Fennell, P., Shah, N., Hallett, J., and Ali, N. (2022). Techno-economic assessment for a pumped thermal energy storage integrated with open cycle gas turbine and chemical looping technology. Energy Convers. Manag. 255, 115332. doi:10.1016/j.enconman.2022.115332
Baya, A., Muntean, S., Câmpian, V. C., Cuzmoş, A., Diaconescu, M., and Bǎlan, G. (2010). Experimental investigations of the unsteady flow in a francis turbine draft tube cone. IOP Conf. Ser. Earth Environ. Sci. 12, 012007. doi:10.1088/1755-1315/12/1/012007
Carlson, F., and Davidson, J. H. (2021). Parametric study of thermodynamic and cost performance of thermal energy storage coupled with nuclear power. Energy Convers. Manag. 236, 114054. doi:10.1016/j.enconman.2021.114054
Celik, I., and Karatekin, O. (1997). Numerical experiments on application of richardson extrapolation with nonuniform grids. J. Fluids Eng. 119, 584–590. doi:10.1115/1.2819284
Chirag, T., Cervantes, M. J., Bhupendrakumar, G., and Dahlhaug, O. G. (2014). Pressure measurements on a high-head francis turbine during load acceptance and rejection. J. Hydraulic Res. 52, 283–297. doi:10.1080/00221686.2013.854846
Duparchy, F., Favrel, A., Lowys, P.-Y., Landry, C., Müller, A., Yamamoto, K., et al. (2015). Analysis of the Part Load helical vortex rope of a francis turbine using on-board sensors. J. Phys. Conf. Ser. 656, 012061. doi:10.1088/1742-6596/656/1/012061
Egusquiza, E., Valero, C., Huang, X., Jou, E., Guardo, A., and Rodriguez, C. (2012). Failure investigation of a large pump-turbine runner. Eng. Fail Anal. 23, 27–34. doi:10.1016/j.engfailanal.2012.01.012
Favrel, A., Landry, C., Müller, A., Yamamoto, K., and Avellan, F. (2014). Hydro-acoustic resonance behavior in presence of a precessing vortex rope: observation of a lock-in phenomenon at Part Load francis turbine operation. IOP Conf. Ser. Earth Environ. Sci. 22, 032035. doi:10.1088/1755-1315/22/3/032035
Favrel, A., Müller, A., Landry, C., Yamamoto, K., and Avellan, F. (2016). Space and time reconstruction of the precessing vortex core in francis turbine draft tube by 2D-PIV. IOP Conf. Ser. Earth Environ. Sci. 49, 082011. doi:10.1088/1755-1315/49/8/082011
Goyal, R., Trivedi, C., Gandhi, B. K., Cervantes, M. J., and Dahlhaug, O. G. (2016). Transient pressure measurements at Part Load operating condition of a high head model francis turbine. Sādhanā 41, 1311–1320. doi:10.1007/s12046-016-0556-x
Goyal, R., Trivedi, C., Kumar Gandhi, B., and Cervantes, M. J. (2018). Numerical simulation and validation of a high head model francis turbine at Part Load operating condition. J. Institution Eng. (India) Ser. C 99, 557–570. doi:10.1007/s40032-017-0380-z
Huang, N. E., Shen, Z., Long, S. R., Wu, M. C., Shih, H. H., Zheng, Q., et al. (1998). The empirical mode decomposition and the Hilbert spectrum for nonlinear and non-stationary time series analysis. Proc. R. Soc. Lond. Ser. A Math. Phys. Eng. Sci. 454, 903–995. doi:10.1098/rspa.1998.0193
Ji, T., Wang, J., Li, M., and Wu, Q. (2022). Short-term wind power forecast based on chaotic analysis and multivariate phase space reconstruction. Energy Convers. Manag. 254, 115196. doi:10.1016/j.enconman.2021.115196
Kc, A., Thapa, B., and Lee, Y.-H. (2014). Transient numerical analysis of rotor–stator interaction in a francis turbine. Renew. Energy 65, 227–235. doi:10.1016/j.renene.2013.09.013
Kong, L., Chen, X., Gong, J., Fan, D., Wang, B., and Li, S. (2022). Optimization of the hybrid solar power plants comprising photovoltaic and concentrating solar power using the butterfly algorithm. Energy Convers. Manag. 257, 115310. doi:10.1016/j.enconman.2022.115310
Kuznetsov, I., Zakharov, A., Arm, V., and Akulaev, R. (2014). Model and prototype investigations of upper partial load unsteady phenomena on the francis turbine designed for head up to 120 m. IOP Conf. Ser. Earth Environ. Sci. 22, 032032. doi:10.1088/1755-1315/22/3/032032
Laouari, A., and Ghenaiet, A. (2019). Predicting unsteady behavior of a small francis turbine at several operating points. Renew. Energy 133, 712–724. doi:10.1016/j.renene.2018.08.111
Li, H., Xu, B., Mahmud, Md.A., Chen, D., and Zhang, J. (2019). Pumping phase modulation analysis for operational quality of a pumped-storage generating system. Energy Convers. Manag. 199, 111989. doi:10.1016/j.enconman.2019.111989
Mauro, S., Lanzafame, R., Brusca, S., and Messina, M. (2019). Unsteady computational fluid dynamics analysis of the hydrodynamic instabilities in a reversible francis turbine used in a storage plant. Heliyon 5, e02441. doi:10.1016/j.heliyon.2019.e02441
Menter, F. R. (1994). Two-equation eddy-viscosity turbulence models for engineering applications. AIAA J. 32, 1598–1605. doi:10.2514/3.12149
Nicolet, C., Zobeiri, A., Maruzewski, P., and Avellan, F. (2010). On the upper Part Load vortex rope in francis turbine: experimental investigation. IOP Conf. Ser. Earth Environ. Sci. 12, 012053. doi:10.1088/1755-1315/12/1/012053
Nicolet, C., Zobeiri, A., Maruzewski, P., and Avellan, F. (2011). Experimental investigations on upper Part Load vortex rope pressure fluctuations in francis turbine draft tube. Int. J. Fluid Mach. Syst. 4, 179–190. doi:10.5293/IJFMS.2011.4.1.179
Pasche, S., Gallaire, F., and Avellan, F. (2019). Origin of the synchronous pressure fluctuations in the draft tube of francis turbines operating at Part Load conditions. J. Fluids Struct. 86, 13–33. doi:10.1016/j.jfluidstructs.2019.01.013
Pei, J., Yuan, S. Q., Li, X. J., and Yuan, J. P. (2014). Numerical prediction of 3-D periodic flow unsteadiness in a centrifugal pump under part-load condition. J. Hydrodynamics 26, 257–263. doi:10.1016/S1001-6058(14)60029-9
Quaranta, E., Aggidis, G., Boes, R. M., Comoglio, C., De Michele, C., Ritesh Patro, E., et al. (2021). Assessing the energy potential of modernizing the European hydropower fleet. Energy Convers. Manag. 246, 114655. doi:10.1016/j.enconman.2021.114655
Suh, J.-W., Yang, H.-M., Kim, J.-H., Joo, W.-G., Park, J., and Choi, Y.-S. (2021). Unstable S-shaped characteristics of a pump-turbine unit in a lab-scale model. Renew. Energy 171, 1395–1417. doi:10.1016/j.renene.2021.03.013
Trivedi, C., Agnalt, E., and Dahlhaug, O. G. (2017). Investigations of unsteady pressure loading in a francis turbine during variable-speed operation. Renew. Energy 113, 397–410. doi:10.1016/j.renene.2017.06.005
Trivedi, C., Agnalt, E., and Dahlhaug, O. G. (2018a). Experimental investigation of a francis turbine during exigent ramping and transition into total load rejection. J. Hydraulic Eng. 144. doi:10.1061/(ASCE)HY.1943-7900.0001471
Trivedi, C., Agnalt, E., and Dahlhaug, O. G. (2018b). Experimental study of a francis turbine under variable-speed and discharge conditions. Renew. Energy 119, 447–458. doi:10.1016/j.renene.2017.12.040
Trivedi, C., Cervantes, M., and Gandhi, B. (2016). Investigation of a high head francis turbine at runaway operating conditions. Energies (Basel) 9, 149. doi:10.3390/en9030149
Trivedi, C., Cervantes, M. J., Gandhi, B. K., and Dahlhaug, O. G. (2013). Experimental and numerical studies for a high head francis turbine at several operating points. J. Fluids Eng. 135. doi:10.1115/1.4024805
Trivedi, C., Cervantes, M. J., Gandhi, B. K., and Ole, D. G. (2014). Experimental investigations of transient pressure variations in a high head model francis turbine during start-up and shutdown. J. Hydrodynamics 26, 277–290. doi:10.1016/S1001-6058(14)60031-7
Wallimann, H., and Neubauer, R. (2015). Numerical study of a high head francis turbine with measurements from the francis-99 Project. J. Phys. Conf. Ser. 579, 012003. doi:10.1088/1742-6596/579/1/012003
Yexiang, X., Zhengwei, W., Zongguo, Y., Mingan, L., Ming, X., and Dingyou, L. (2010). Numerical analysis of unsteady flow under high-head operating conditions in francis turbine. Eng. Comput. Swans. 27, 365–386. doi:10.1108/02644401011029934
Zeng, W., Yang, J., and Hu, J. (2017). Pumped storage system model and experimental investigations on S-induced issues during transients. Mech. Syst. Signal Process 90, 350–364. doi:10.1016/j.ymssp.2016.12.031
Zhang, X., Cheng, Y., Yang, Z., Chen, Q., and Liu, D. (2020). Influence of rotational inertia on the runner radial forces of a model pump-turbine running away through the S-shaped characteristic region. IET Renew. Power Gener. 14, 1883–1893. doi:10.1049/iet-rpg.2019.1476
Keywords: pump turbine, pressure pulsation, hilbert huang transform, runaway, rotor stator interaction
Citation: Xiao W, Gui Z, Lu Z, Xiao R and Tao R (2024) Pressure pulsation of pump turbine at runaway condition based on Hilbert Huang transform. Front. Energy Res. 12:1344676. doi: 10.3389/fenrg.2024.1344676
Received: 26 November 2023; Accepted: 22 January 2024;
Published: 05 February 2024.
Edited by:
Maria Grazia De Giorgi, University of Salento, ItalyReviewed by:
Guangjie Peng, Jiangsu University, ChinaHamid Reza Rahbari, Aalborg University, Denmark
Copyright © 2024 Xiao, Gui, Lu, Xiao and Tao. This is an open-access article distributed under the terms of the Creative Commons Attribution License (CC BY). The use, distribution or reproduction in other forums is permitted, provided the original author(s) and the copyright owner(s) are credited and that the original publication in this journal is cited, in accordance with accepted academic practice. No use, distribution or reproduction is permitted which does not comply with these terms.
*Correspondence: Ruofu Xiao, eHJmQGNhdS5lZHUuY24=