 Faisal Maqbool
 Mujeeb Iqbal Soomro2
 Laveet Kumar
 Khanji Harijan
- 1Department of Mechanical Engineering, Mehran University of Engineering and Technology, Jamshoro, Pakistan
- 2Department of Mechanical Engineering, Mehran University of Engineering and Technology, SZAB Campus, Khairpur, Sindh, Pakistan
- 3Department of Mechanical and Industrial Engineering, College of Engineering, Qatar University, Doha, Qatar
Energy drives the growth, transformation, and economic development of every nation. The vitality of human existence and progress hinges on the accessibility of both energy and water resources. As freshwater resources are diminishing, therefore, desalination needs have increased. In solar membrane distillation systems, the key challenge is maintaining the intake water temperature in the membrane distillation system with fluctuating solar radiation intensity which affects the distillate water quantity and quality. The objective of this study is to enhance and optimize a mathematical model for analyzing a cutting-edge solar-integrated PV/T-DCMD system. In this innovative integration, the direct contact membrane distillation intake water temperature is derived from the photovoltaic thermal output. The integration of direct contact membrane distillation with photovoltaic thermal systems represents a cost-effective and technologically advantageous concept. As the water temperature increases, there is a notable improvement in the evaporation efficiency of PV/T-DCMD systems, with an increase from 35.08% to 42.01%. Additionally, there is a reduction in specific thermal energy consumption, decreasing from 1,192 to 1,386 kWh/m3 as a consequence of the elevated feed water temperature.
1 Introduction
In a world where temperatures are rising and fresh water is becoming scarcer, the creation of green energy is becoming more important. Using fossil fuels has increased environmental pollution and exacerbated the severity of natural disasters. Producing clean energy and fresh water is crucial for overcoming such challenges. One of the world’s greatest difficulties is meeting the growing demand for clean water. The need for pure water is growing in tandem with the global population and economy. Water shortages will affect 70% of the world by 2025. Only 0.5% of the world’s water sources are acceptable for human and agricultural use, even though more than half of the population lives within 200 km of seashore (Li, 2012). The growing population and industrial need for clean water are driving demand. The water sector is contemplating salty and brackish water. For decades, solar desalination has improved, resulting in increased daily production at reduced prices. Solar water desalination is thermal or membrane (Anis et al., 2019). Extreme levels of water shortage, as indicated in Figure 1, have arisen in the Middle East and North Africa area due to a combination of factors, including dry and semi-arid climatic conditions, rapid population increase, and inefficient water usage. The “United Nations Sustainable Development Agenda” aims to decrease water shortages by improving water consumption efficiency and resource management (Cf, 2015).
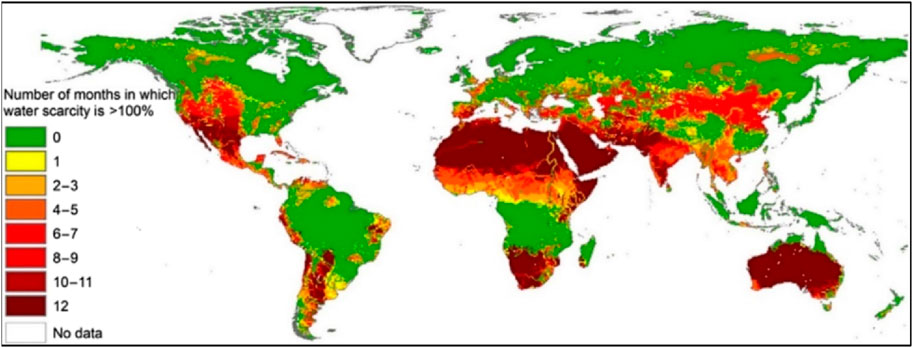
FIGURE 1. Worldwide water scarcity zones (IRENA, 2022).
Desalination technology is crucial to solving the global water challenge. The International Desalination Association (IDA) estimated 16,000 desalination units worldwide in June 2018, generating 87.5 million cubic meters of water per day and servicing 300 million people (Hussain and Kim, 2020). Desalination demands substantial energy to eliminate salt and impurities from seawater or brackish water, contingent on the chosen technology and water conditions (Kalogirou, 2005). Many countries use desalinization to satisfy their freshwater needs. In 2020, the world’s desalination potential was 114.9 million m3/day (Eke et al., 2020; Kumar et al., 2023). Desalination is expensive due to escalating energy costs and distant supply issues. Integrating desalination facilities with low-grade heat sources and solar energy, especially sustainable solar power, may reduce costs and energy usage (Qtaishat and Banat, 2013). Wind, solar, hydro, tidal, geothermal, and biomass are renewable energy sources that decrease fossil fuel use and solve global energy and environmental issues. Renewable desalination decreases fossil fuel consumption, greenhouse gas emissions, and energy security (Nalule, 2018). There are several different techniques for desalinating water using solar thermal energy; they include solar still, humidification-dehumidification, multi-effect, multi-stage flash, and membrane desalination. These processes rely on solar heat to generate thermal energy, which is then utilized to evaporate and condense saltwater into potable water (Shalaby et al., 2022). The reverse osmosis process, the most common desalination process, can be powered by PV panels, which have become popular in areas with high solar radiation (Anand et al., 2021). Several more RES can be successfully integrated with desalination technologies to give long-term solutions to water shortage, as shown in Figure 2. Some of the most effective and widely used combinations of renewable energy sources for desalination are as follows (CRES, 1998).
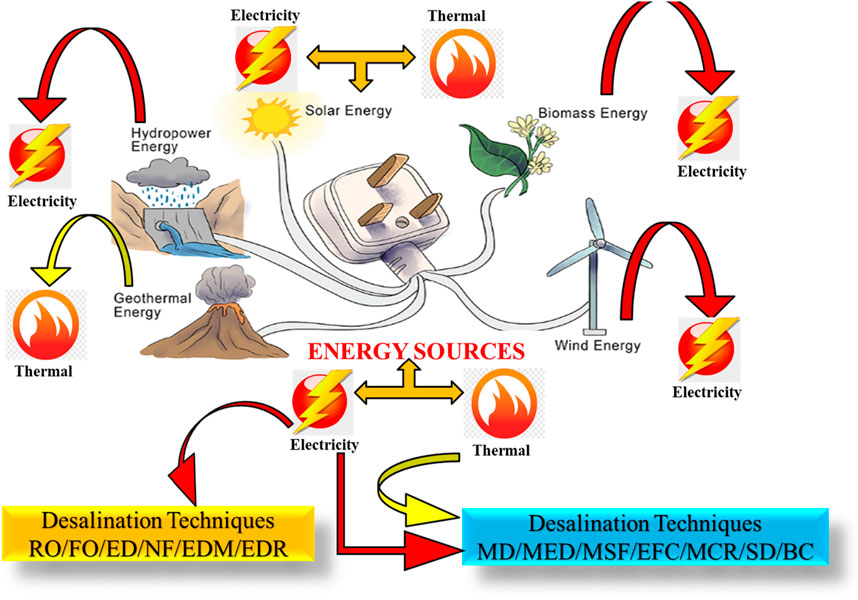
FIGURE 2. Alternative methods of desalination in accordance with RES.
The expression “Water is life” succinctly captures the crucial role that water plays in sustaining life on our planet. Water could be categorized according to its salinity levels as follows: Freshwater: salinity below 500 parts per million (ppm) - Brackish water: salinity ranging from 5,000 to 35,000 ppm - Saline water: salinity between 35,000 and 45,000 ppm - Brine: salinity beyond 45,000 ppm (Soomro et al., 2022). Water demand in Pakistan exceeds its supply, even though rivers and groundwater make up most of its fresh water. The country is under water stress and on the edge of being categorized as water scarcity, with 80% or more water shortage by 2040 (w. r. institute, 2022; Kumar et al., 2021a). Pakistan’s rivers and groundwater are unfit for human consumption owing to excessive TDS and arsenic pollution. Population health is threatened by high groundwater arsenic levels. Pakistan, is the sixth most populous developing country, with 803,950 km2 and 1,146 km of coastline, offering tremendous renewable energy potential (w. r. institute, 2022). Pakistan energy power generation (July-March FY 2023) share percentage of hydro (28.6%), Thermal (46.2) %, Nuclear (21%), and Renewable (4.2%) (p. e. survey, 2023). Current power production in Pakistan shows poor renewable power generation, hence alternative renewable ways should be improved to meet demand.
RES desalination combinations can solve water shortages, and further research can improve efficiency and cost. Solar energy powers desalination technology because it is clean, plentiful, and widely accessible. Solar systems use PV technology to produce power from sunlight (González et al., 2017). The PV sector has increased by over 35% annually over the last decade. Global PV capacity was 591 GW in 2019, including 184 GW of module manufacture and 125 GW of sales (Feldman and Margolis, 2019; Khatri et al., 2022). Current solar technology comprises PV and solar thermal panels, which are combined to generate electricity and heat in hybrid PV/T systems (Barbu et al., 2019). While most electricity in Pakistan comes from harmful sources, solar PV power-generating systems can produce 3.525 ×10⁶ and 455.3 GWh annually, meeting present and future energy demands (Harijan et al., 2015). Active cooling achieves 60% thermal efficiency and PV/T 22% electrical efficiency (Kumar et al., 2021b). Glazed PV/T systems are more efficient than unglazed systems in thermal energy and exergy. Glassed PV/T systems have 74.14% thermal energy efficiency and 0.76% exergy efficiency, whereas unglazed systems have 71.29% and 0.65%. Energy efficiency of electricity (Kumar et al., 2021c). PV/T systems continually produce 55°C hot water. The heat exchanger maintains membrane distillation (MD) at 40°C. This MD method generates 3 L of fresh water per square meter per hour utilizing 5,200 kJ/kg water (Al-Hrari et al., 2020). The water-based PV/T has the highest thermal, electrical, and overall efficiency at 44.5%, 14.8%, and 59.3%. Water flows 1.02 L per minute through its 16-mm tube. Results show that PV/T system thermal and electrical efficiency rises with Reynolds number (Hassan et al., 2023). In a small solar-based PV/T water collector, Reynolds number boosts heat transfer rate and electrical and thermal efficiency from 0.004 kg/s to 0.08 kg/s, achieving 89.96% and 11.47%, respectively, and exergy efficiency is 14.68% at 0.02 kg/s mass flow rate (Podder et al., 2023).
In membrane distillation, a hydrophobic membrane transports water vapor from a salty feed to a clean permeate stream without allowing salty water in. This requires heating feed water and cooling permeate to maintain a temperature differential. Vapor condensation on the colder side of the membrane produces clean water without contaminants or salts (Alklaibi and Lior, 2005; Ashoor et al., 2016). MD shows energy efficiency with low-quality heat sources and modest temperature changes. Its flexibility to solar thermal and conventional energy makes it a potential large-scale purification method with environmental and economic benefits (Luo and Lior, 2016; Baghbanzadeh et al., 2017). MD processing needs a low-grade heat source and a condenser, therefore heat transfer and mass transfer mechanisms are used. MD is configured in several ways depending on how membrane vapor pressure differentials are created. Direct contact MD, vacuum MD, swirl gas MD, and air gap MD are the four basic membrane distillation methods used to purify water (Yadav et al., 2021). DCMD is the most popular since it is simpler for commercial purposes. DCMD can utilize waste heat or low-grade solar thermal energy for freshwater production, although fuel price inflation is unpredictable (Long et al., 2018). DCMD, well-known for industrial use, recovers waste heat and generates freshwater using low-grade solar energy. DCMD recovers waste heat better than other membrane processes because it uses less energy and works at lower temperatures and pressures. DCMD modeling and testing have examined heat and mass transfer, operational parameters, pore size distribution, air flux, flow rate, flow velocities, and feed temperature (Phattaranawik et al., 2003; Chen et al., 2009). The water temperature entering the heat exchanger will decrease if the water that exits the CPV/T system has a low temperature. When it comes to the DCMD module, a substantial reduction in temperature was observed in the initial temperature of the feed input (Al-Hrari et al., 2020). The DCMD had more water flow than the AGMD. Long-term DCMD testing produced high water flow. DCMD boosted water flow by 43% over AGMD. Clear days have 30% lower SEC and 17% greater GOR than gloomy days (Choi et al., 2022). With 80 MWe of concentrated solar power integrated with DCMD and 12 h of thermal storage, the system produced 353.87 GWh of energy with a 56.1% capacity factor. The lowest Levelized Energy Cost was 4.51 cents per kWh for the PT plant. DCMD technology in the SPT system produced water for US $ 0.314 per cubic meter (Soomro et al., 2020). The developed DCMD system produces drinkable water at 45.18 kg per square meter per hour using an evacuated tube solar collector. Solar heating at 75°C maintained a mass flow rate of 7 L/min on both sides of the membrane and 80% evaporation efficiency (CK et al., 2022).
Previously conducted studies did not provide complete simulations of solar energy integrated with DCMD systems that allowed optimization of a small-scale saline solar desalination, which could be useful for DCMD solar installations that produce drinking water. Flat plate photovoltaic thermal collectors are suited for small-scale reverse osmosis systems due to their low thermal energy demand. In contrast, for larger-scale reverse osmosis desalination and hybrid reverse osmosis-membrane distillation with high electricity and thermal energy requirements, concentrated photovoltaic thermal collectors are preferable. The objective of this study is to integrate solar PV/T technology with DCMD to create a highly effective system that can operate using low-grade heat sources, specifically at temperatures around 40°C. This integration is particularly advantageous given the solar PV/T’s outlet water temperature range of 40–55°C, contingent on weather conditions. The primary objective is to provide an innovative solution for water desalination, especially targeting distant regions that lack the availability of drinkable water. The suggested integrated system harnesses solar energy to simultaneously generate electricity and provide clean water. The work focuses on a compact and easily transportable system, using numerical simulations, to be useful for various environments. The purpose of this research is to numerically perform a small-scale, portable system using DCMD for desalinating brackish water for use in regions that are geographically isolated from potable water sources. In this study, a MATLAB model is presented for a solar PV/T system that integrated a DCMD system to generate power as well as clean water production utilizing the solar power system. Considering this, a solar brackish water heating system including both PV/T and DCMD for desalination is introduced into the system at the same time. The main aims of this computational study are to develop a new MATLAB model for the solar-powered PV/T-DCMD system in Simulink to analyze energy balance, heat transfer, and mass transfer, with the dual objective of simultaneously generating electricity and desalinating water.
This study is structured for a comprehensive understanding of the solar PV/T and DCMD system integration. Section 2 outlines the methodology, while Section 3 focuses on mathematical modeling. Model validation is detailed in Section 4. The study facilitates thermal and electrical analyses, along with heat transfer assessment. Section 5 presents findings on DCMD impact, Section 6 concludes the study findings and Section 7 presents the future work and recommendations.
2 Methodology
2.1 System description
This study was conducted to assess how viable Solar PV/T systems are under the climatic conditions prevalent in Jamshoro, Pakistan, to determine their operational efficiency along the direct contact membrane distillation system. This study area was selected because of its favorable solar energy potential, and it is one of the most predominant methods of obtaining fresh water at a low cost in the region, which has become more prominent in the regions where a viable amount of solar energy is accessible for obtaining fresh water. Figure 3 displays the integration of solar PV/T with the DCMD system for electricity and freshwater production.
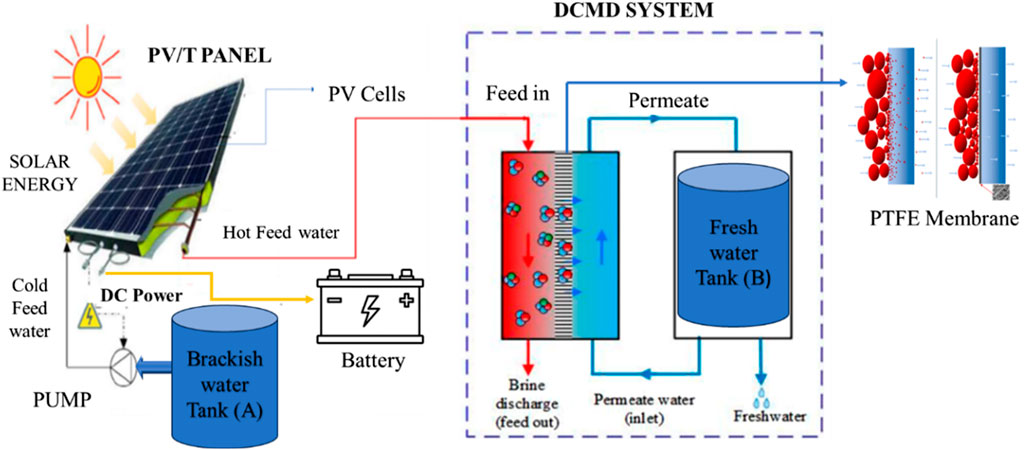
FIGURE 3. Schematic diagram of the Solar PV/T-DCMD hybrid system.
2.2 System simulation procedure
The simulation framework is divided into three phases: The first phase is to measure the temperature of the hot feed in brackish or salty water; the second phase is to compute the temperature difference between the hot and cold phases of the membrane; and the final phase is to determine the temperature of cold fresh water. The shown hybrid system in Figure 3 consists mainly of a PV/T system and a DCMD unit for the dual purpose of water purification and power production. The PV/T system utilizes solar energy to heat the working fluid, which is pumped from the storage tank (A), using brackish water. The brackish water is heated in a PV/T system, and the resulting change in temperature is then introduced into the DCMD system. The DCMD system employs three processes to purify water. Firstly, heat is transferred from the feed water to the feed/membrane interface, crossing the temperature boundary layer. Secondly, the heat is then transferred from the feed/membrane interface to the membrane/permeate interface, causing a decrease in the temperature of the membrane feed. At last, heat is transferred from the membrane/permeate interface to the permeate side, resulting in a decrease in the temperature of the membrane permeate to the interface of the bulk permeate temperature. As a result, the vapor pressure differential occurs and the temperature gradient is transformed, the increases in the temperature gradient on time force the vapor molecules across the membrane pores to travel from the hot phase to the cold phase resulting in condensation on the permeate side in the form of fresh water in the storage tank (B). The electrical energy produced by the PV/T system is used to operate the equipment in the system, such as pumps. Any surplus energy is then stored in batteries for domestic use. This stored energy serves as a reserve for domestic use, ensuring a continuous and reliable power supply even during periods of low solar irradiation. Figure 4 represents the research work methodology chart, the chart outlines the methodology followed in the research work and includes key steps, processes, and relationships considered in the study. The model considers all essential elements, such as changes in solar irradiation, feed water temperature at the initial stages, and membrane surface temperature after the flow stream. The excess heat that is released by the PV module is absorbed by the heat exchanger installed in the PV/T system in an effective manner, which enables the warm-up of the cold saline or brackish water that is being delivered to the system. After going through the heating process, the saline or brackish water gained the desired temperature to enter the DCMD system for further procedure.
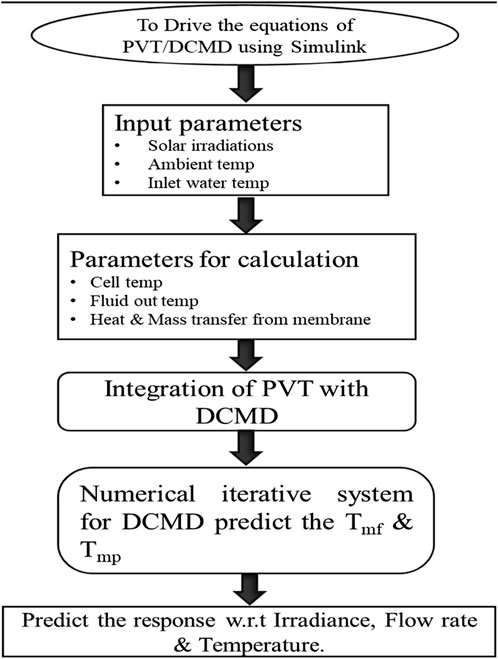
FIGURE 4. Methodology framework.
The DCMD module operates by receiving a constant flow of heated saline or brackish water. Simultaneously, the condensation process is initiated by commencing cold water from the permeate side of the DCMD module. To move water vapors across the membrane, there needs to be a difference in temperature between the feed and permeate surfaces. As a result, there is a difference in the vapor pressure between the surfaces on the feed side and the permeate side, which serves to enhance the flow of water vapor. The divergence generated in water vapor travels over the membrane due to the temperature gradient, leading to the condensation process and ultimately resulting in the production of clean drinkable water. The drinkable water is subsequently maintained in the permeate tank, while the brine is consistently discarded.
3 Mathematical modelling
3.1 Photovoltaic thermal system
Even though there are various PV/T configurations, the type that is considered for analysis is a flat-plate collector. The principal configuration of the PV/T collector is shown as a cross-sectional view in Figure 5, where G represents the solar irradiation incident on the PV/T flat-plate collector.
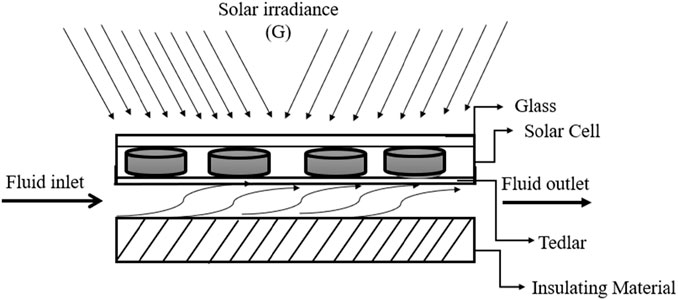
FIGURE 5. Cross-sectional view of the solar PV/T system. Partially adopted from Tiwari and Sodha (2006).
The operational efficiency of typical PV cells can be enhanced by implementing a fluid circulation system underneath the cell layer. This system facilitates the extraction of heat from the cells, resulting in a reduction of their operating temperature. As a result, the electrical efficiency of the cells increases. There are methods to manipulate the design of such a structure to improve its electrical or thermal efficiency. A comprehensive evaluation of the proposed Solar PV/T system was systematically carried out with special attention to various environmental and climatic factors prevalent in Pakistan. This comprehensive assessment covers many factors such as solar radiation levels, and ambient temperature, all of which play a significant role in determining system performance and suitability for Pakistan’s environment. The reason for choosing this site is Pakistan’s significant solar energy potential and the need for desalination due to limited freshwater resources. An evaluation of the PV/T system and its performance was performed using MATLAB software. Table 1 shows the design parameters that were employed in the PV/T system studies that have been conducted (Hossain et al., 2019). The PV/T collector is made up of two essential components: a photovoltaic element that generates power and a thermal collector that functions as a heat exchanger. By using energy balance equations, to determine both the efficiencies (electrical and thermal) of the PV/T module and the temperatures according to the weather conditions. The PV/T module with 250 W and 60 cells was selected for the simulation. Its width and length are 99.2 and 163.68 cm respectively. It derives analytical expressions for thermal parameters and the thermal efficiency of a PV/T collector, it is essential to develop energy balance equations for each individual component of the PV/T system. By conducting a comprehensive analysis, to determine the various temperatures within the system based on the fluctuating ambient conditions, which occur on an hourly basis.
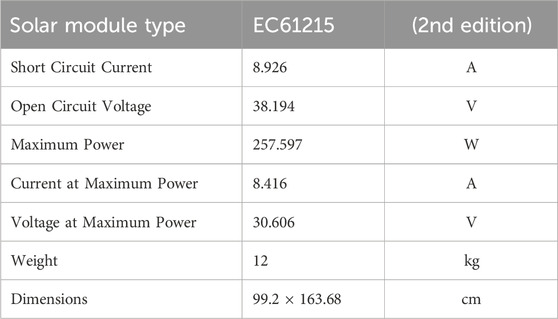
TABLE 1. Specifications of solar PV/T (Hossain et al., 2019).
Table 1 provides a point of reference for comprehending the attributes and capacities of the solar PV/T module used in the simulation. It assists in understanding the energy balance equations and thermal characteristics calculated for each part of the PV/T system, as well as in calculating the temperatures inside the system under changing environmental circumstances on an hourly basis. Essentially, these specifications provide a fundamental comprehension of the technical characteristics of the PV/T module, which contributes to the comprehensive analysis and simulation carried out in the research. PV/T output temperature for hot water is 55°C, after utilizing the heat exchanger the hot feed water becomes 40°C and then can be supplied to the MD system to meet the energy requirement of the system (Al-Hrari et al., 2020).
3.2 Energy investigation for PV/T module
The amount of solar energy that is accessible on the PV module can be determined using Eq. 1. The energy rate included in this analysis encompasses the cumulative heat dissipation from solar cells to the surrounding environment, the total heat transfer from solar cells to the Tedlar back surface, and the rate of electrical energy (Sobhnamayan et al., 2014; Xiao et al., 2019).
The heat balance equation includes various variables. This expression calculates the cell temperature of the solar PV/T system. It considers the effective transmissivity-absorptivity product, ambient temperature, and the temperatures of the cover and back surface. The temperature of the solar cells is denoted as
Tbs refers to the back surface temperature, and
Eq. 3 quantifies the solar radiation effectively absorbed by the PV collector, and this is determined through the product of effective absorptivity and transmissivity. This expression defines the effective transmissivity-absorptivity product for the solar PV/T system. It incorporates the transmissivity of the cover, absorptivity of the cover, the fraction of the absorbed radiation in the cover, the absorptivity of the PV module, and the efficiency of the electrical part. This parameter is crucial for determining the overall efficiency of the solar collector.
3.3 Energy investigation for tedlar back surface
Using Eq. 4, to determine the rate at which thermal energy is transmitted from the tedlar to the water (Sobhnamayan et al., 2014).
The temperature of the tedlar back surface can be calculated using Eq. 5 as illustrated (Sobhnamayan et al., 2014).
By substituting the results of Equations 2–5 into Eq. 1, to get an expression for the rate at which heat is transported to the rear surface of the tedlar.
3.4 Investigation for water flowing below tedlar
Using the equation and the boundary condition
Equation 6 expresses the temperature of the fluid outlet from the solar PV/T system where hp1,2 denoted the penalty factor arising from the inclusion of solar cell material, glass, and the contact between tedlar and the working fluid.
3.5 Thermal model for PV/T water collector
The calculation for the effective thermal energy rate in a PV/T water collector is determined as follows in Equations 7–9 (Shi and Lin, 2019).
Where
The thermal efficiency of a photovoltaic/thermal (PV/T) water collector can be described as follows.
The total amount of thermal energy received by the collector comprises both the sensible heat and any latent heat associated with phase changes in the fluid (air or water) passing through it. The amount of solar radiation that reaches the collection is equal to the amount of energy that the collector absorbs. Since the PV/T water collector effectively converts solar energy into useable heat, it is a more efficient and sustainable technology for generating both electricity and hot water. This is due to its high thermal efficiency.
3.6 Electrical PV/T model
The PV/T system can convert solar irradiance into energy via the direct use of photovoltaic cells. Accordingly, an electrical model is used to determine the relationship between ‘output current and output voltage’ and between ‘output power and output voltage’. The efficiency of energy conversion of the solar panel was evaluated based on different parameters. Additionally, the panel surface temperature and real-time solar radiation intensity (expressed in watts per square meter) were also recorded. Furthermore, alongside the ambient temperature, measurements were taken for the entrance and exit temperature of the water flow, as well as the water flow rate. The energy conversion efficacy of a solar cell describes the amount of generated electricity that can be efficiently utilized and collected. The computational methods are carried out to precisely determine the photoelectric conversion efficiency, expressed by a set of defined Equations 10–12 (Flores-Larsen et al., 2019):
The power output of a PV system is measured in watts. The solar energy that is absorbed by the PV modules is turned into electric energy as well as thermal energy. However, thermal energy is wasted via three modes of heat convection, conduction, and radiation.
3.7 Modeling membrane distillation
In DCMD, the adjacent membrane that agrees with the passage of water vapor, known as the permeate side, is in direct contact with a stream consisting only of pure water (Maab et al., 2012). DCMD system uses a membrane module made from polytetrafluoroethylene (PTFE) flat sheet membranes that have a thickness of 120 μm and a porosity of 80%, which have been designed for use with the DCMD system. The DCMD module consists of two different flow compartments, one for the feed solution (saline or brackish water), and the other for the permeate side. Figure 6 below shows a schematic representation of the DCMD module, which has two distinct flow compartments. The dimensions of the DCMD module that was selected for modeling are 0.7 m in length, 0.2 m in width, and 0.001 m in thickness, and it has a mean pore size of 0.12 μm.
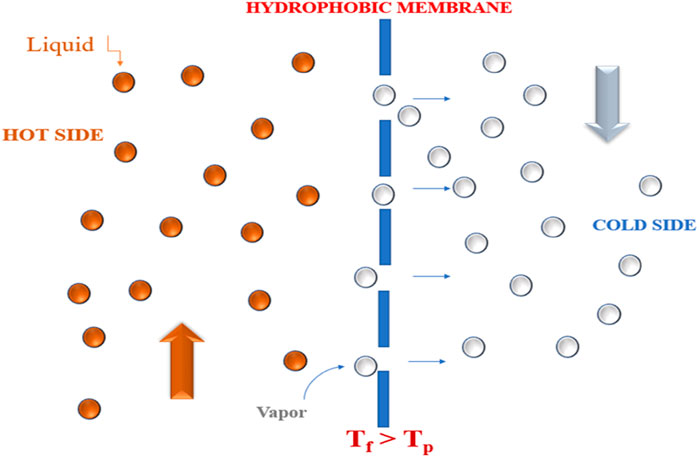
FIGURE 6. Schematic of a DCMD module.
The aggregate of water vapor that passes through the membrane per unit area and time, Permeate flux is given by in Eq. 13 and coefficient for the membrane in Eq. 14 (Khayet, 2011).
where
where the temperatures
Where
where ‘k', ‘Dh’, and ‘Nu’ stand in for the mean conduction of the liquid, the hydraulic length conduction path, and the Nusselt number, respectively. In an experimental setup, the direct measurement of
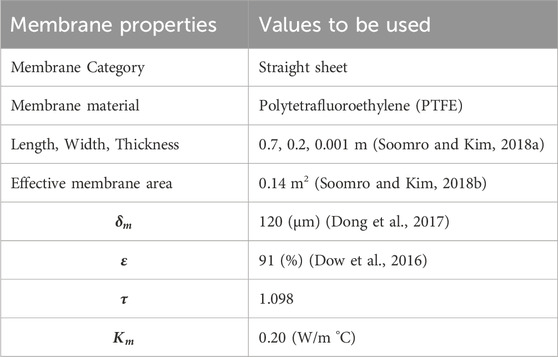
TABLE 2. Characteristics of the DCMD membrane system.
DCMD utilizes temperature variations to differentiate freshwater from saltwater water. The DCMD membrane system uses hydrophobic membranes to repel liquid water while allowing vapor passage, thermal gradients for evaporation and condensation, direct contact between saline and freshwater streams to improve heat and mass transfer efficiency, low pressures for energy savings, scalability for diverse applications, brackish water treatment, and moderate temperature operation. The disk and frame type membrane module used in the DCMD system consists of multiple membrane sheets stacked together with alternating feed and permeate flow compartments. The feed mixture flows through the feed compartments, while the permeate vapor flows through the permeate compartments and is condensed to produce the product water. The flat-sheet hydrophobic membrane allows only water vapor to cross through it, while rejecting salt and other impurities, resulting in high-quality product water.
The Nusselt numbers for the feed side and permeate side are calculated using Equations 20, 21 for laminar flow
Where
Where,
3.8 Heat transfer
In the DCMD process, several heat transfer processes take place concurrently in three distinct regions: first, hotness transfer crossways the feed boundary layer in the form of convective, second, heat transfer across the film in the form of conductive, and final heat transfer across the permeate boundary layer in the form of convective, as shown in Figure 7. The heat transport processes, along with mathematical equations for each respective domain, can be briefly indicated as follows (Soomro et al., 2020).
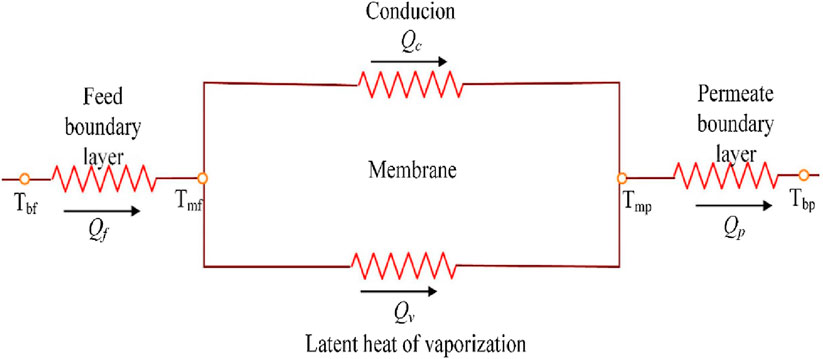
FIGURE 7. Heat transfer mechanisms involved in Membrane Desalination (Soomro and Kim, 2018b).
Effective heat transfer processes are the backbone of membrane desalination, which efficiently produces freshwater. One of them is conduction, which occurs when temperature gradients cause heat to transfer across a membrane. The process of convection affects the distribution of temperatures because it includes the transfer of heat when fluids flow over a membrane. Radiation affects temperature gradients by transferring heat via electromagnetic waves. Another important factor in desalination is the latent heat of vaporization, which necessitates effective heat transfer to transition from a liquid to a vapor. To improve desalination efficiency, it is necessary to optimize these mechanisms. The process of heat transfer via the feed side is carried out by convection is expressed in Equation 24 (Soomro and Kim, 2018b).
The
The evaporative heat relocation
The symbol
The determination of conductive heat transport across the membrane is achieved by applying the Fourier law of conduction expressed in Eq. 27 (Khalifa et al., 2017).
The
where
The convective heat transfer is represented in Eq. 30 (Soomro and Kim, 2018b):
The expression for the entire warm transference through the DCMD system under steady-state circumstances is given in Eq. 31 (Soomro and Kim, 2018b).
where
By using the MATLAB software to solve equations relating to energy balance, mass, and heat transfer, the performance assessment of the PV/T-DCMD system was carried out. Both the feed and permeate flows in the DCMD system were constantly moving in opposing directions. The temperature of the saline water and the temperature of the reference condenser water impacted the feed temperature.
To simulate and predict the
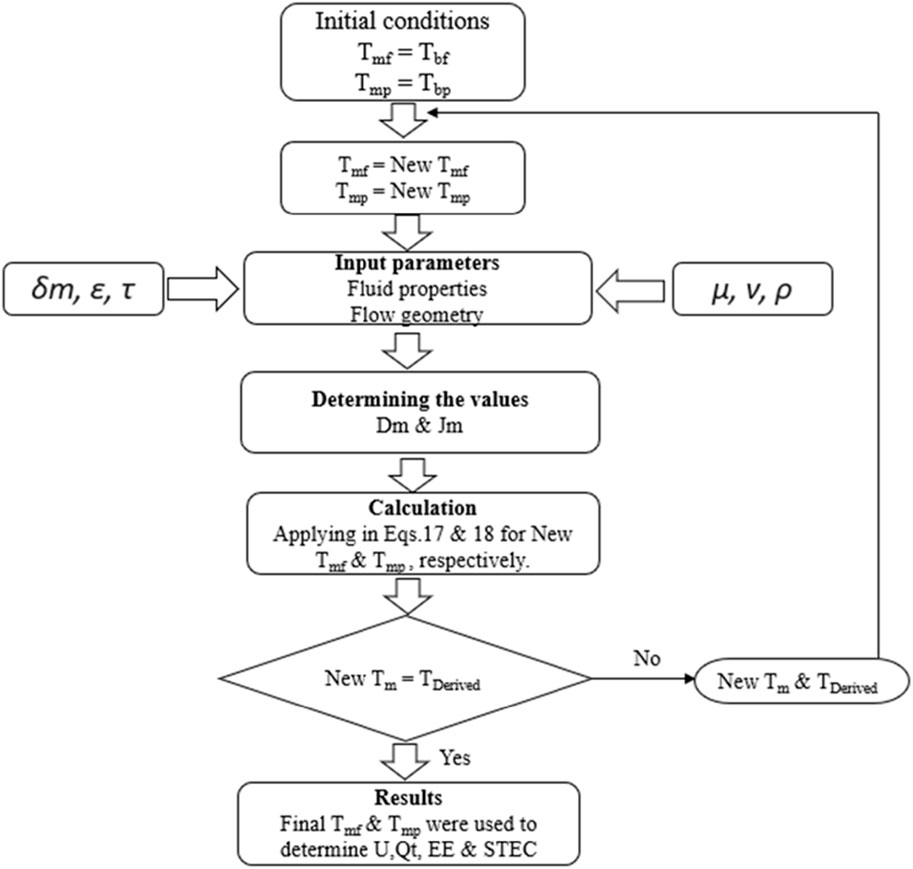
FIGURE 8. Iterative numerical scheme for DCMD system.
4 Model validation
Implementation of PV/T system with DCMD has not been investigated, we have had to validate PV/T and DCMD separately. In comparison to a water-based PV/T system with a mass stream rate of 0.023 kg/s, this study achieved improved thermal and electric efficiencies. The thermal efficiency reached 55.60%, and the electrical efficiency rose to 11.2%, surpassing the previously reported values of 51.53% and 10.2%, respectively. These advancements were observed under specific conditions 40°C on the feed side and 20°C on the permeate side. Particularly, the difference in permeate fluxes increased by 6.7%, as determined through simulation work conducted by Soomro and Kim (2018b), and by 9.8% with an experimental study by Gustafson (Gustafson et al., 2016). On flow rate of 1.1 L per minute, the permeate flux of simulation work is 7.3 kg/m2. hr and experimental work 7.1 kg/m2.hr while in this study the permeate flux is 7.5 kg/m2.hr at 10:30 a.m. As Figure 9 shows in the increased permeate flux proves a significant advancement.
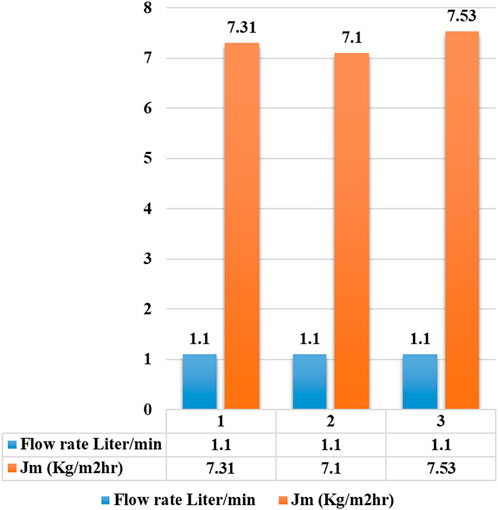
FIGURE 9. Validation of flux with simulation and experimental study.
The results of this study highlight the benefits of a DCMD system’s integration with a PV/T system, indicating increased efficiency and potential outcomes for future efforts.
5 Results and discussion
The current study presents implementation evaluations of the integration of a PV/T system with a DCMD system. Analysis of the PV/T system with integrated DCMD system for freshwater production and electricity generation has been discussed.
5.1 Performance investigation of PV/T system
Solar irradiance and ambient temperature have important roles in how effectively PV/T performs. To evaluate the PV/T water system’s heat transfer characteristics and thermal efficiency, energy balance equations were solved for each component. The Jamshoro, Pakistan region has been selected to test the performance of the Solar PV/T model. The weather station at MUET, Jamshoro, has recorded temperatures for the whole month of August 2023. From April to August, Jamshoro receives a maximum of 1,000 w/m2 of solar radiation, while the average figure for the rest of the year is about 722 W/m2. By investigating the change in energy characteristics as a function of solar irradiation, cell temperature, and water flow rate, it has been established which of these components has the most influence on the PV/T system’s energy output. Table 3 shows the design data and climate data from the Jamshoro weather station that were utilized to assess the water temperature and cell temperature. The system can generate freshwater with a modest amount of power input. Freshwater can also be produced in rural and distant places with this technology, which is particularly useful considering the scarcity of potable water in those places.

TABLE 3. Solar irradiance and ambient temperature.
The effects of solar irradiance and ambient temperature are crucial for a PV/T system’s performance. Solar irradiation varies hourly, reaching its highest point at noon, and this change greatly influences the system’s performance. Both the photovoltaic and thermal efficiencies are impacted by the ambient temperature. At very high temperatures, energy production is reduced, while the thermal component benefits from maintaining a temperature gradient. For the PV/T system to be designed, operated, and controlled in a way that maximizes efficiency and dependability under a wide range of climatic circumstances.
5.2 Hourly fluctuations of PV/T on different parameters with different flow rate
The hourly variations of multiple parameters in a PV/T system are evaluated based on varying mass flow rates of 1, 1.5, 2, 3,4, and 5 L per minute as shown in Figure 10. Because the temperature of the solar cell is higher than that of the water used for purification, there is an increase of about 20°C in the fluid’s input temperature in comparison to temperature of the close circumstances. The mass stream rate of water and the efficiency of the thermal absorber induce a significant drop in temperature in PV/T cells. The temperature of the PV/T cell decreases as cosmological energy grows. Figure 10A depicts the high PV/T water inlet/outlet temperature differential (10°C) at the 1.0 LPM flow rate. sunlight, ambient temperature, flow rate, and system layout are the key factors that affect the hourly variations in PV/T systems. Power generation and thermal energy output are both improved by exposure to high levels of solar radiation. Although thermal efficiency could improve because of steeper temperature gradients, PV cell efficiency could decline as ambient temperatures rise. The efficiency of thermal energy extraction is greatly affected by the temperature differential between the heat transfer fluid and the PV cells. A system’s performance is greatly affected by its design, which includes the type of collector, the arrangement of PV cells, and the material selection.
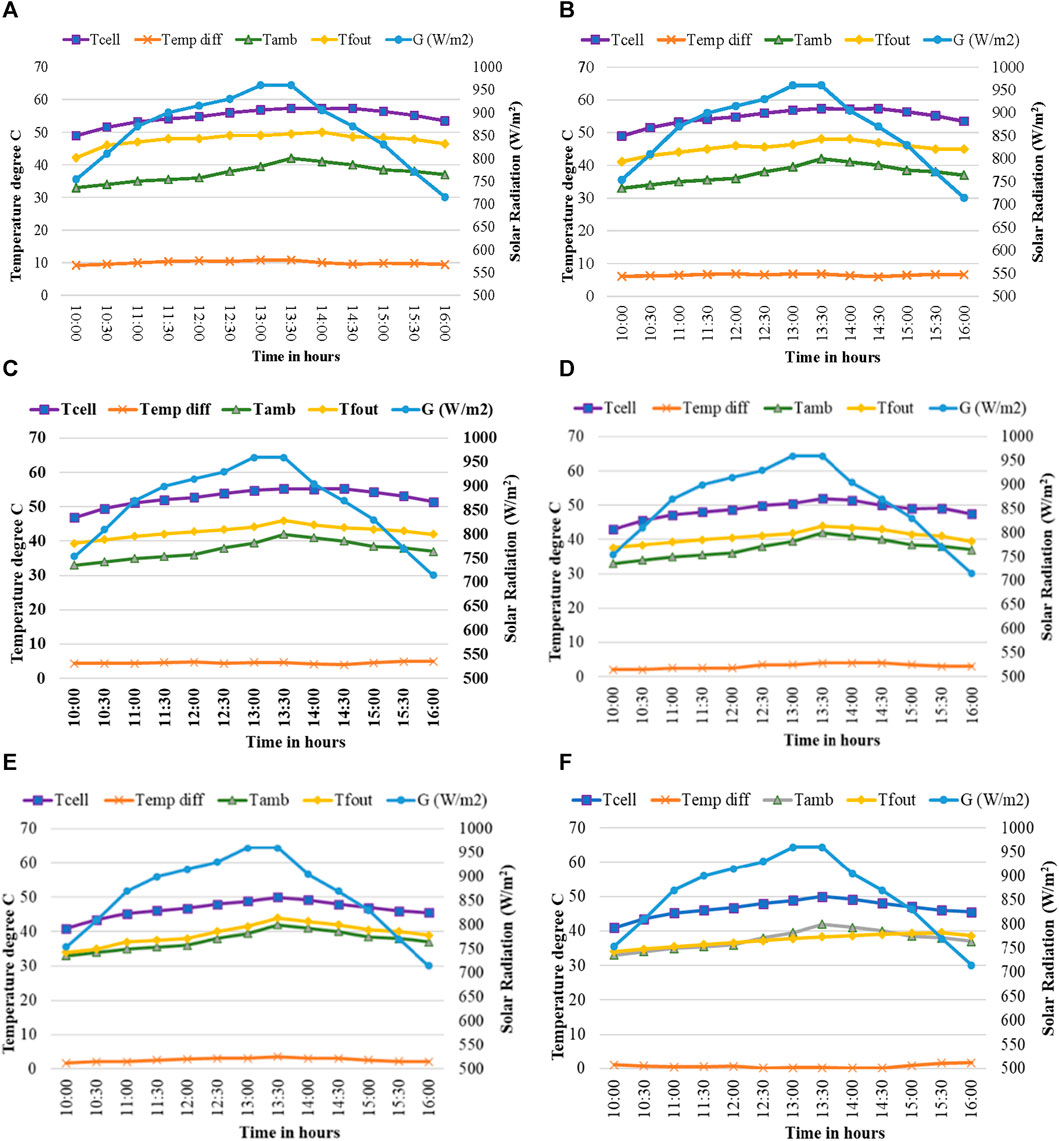
FIGURE 10. Variations in PV/T parameters on different flow rates observed in the daytime. (A) Daily dynamics of PV/T on 1 LPM; (B) Daily dynamics of PV/T on 1.5 LPM; (C) Daily dynamics of PV/T on 2 LPM; (D) Daily dynamics of PV/T on 3 LPM; (E) Daily dynamics of PV/T on 4 LPM; (F) Daily dynamics of PV/T on 5 LPM.
It is evident solar cell temperature is greater than the water temperature and there is an increase in water temperature of nearly 15°C pertaining to an ambient. As can be observed in Figure 10B, in the PV/T system the water entering and leaving temperature differential is significant (8.5°C) when the flow rate is 1.5 L per minute. The solar cell temperature is greater than the water temperature and there is an evident increase in water temperature approaching 10°C above the ambient temperature. According to the results in Figure 10C we observe that the PV/T water entering and leaving temperature differential is moderate when the flow rate is set at 2.0 L per minute. The solar cell temperature is greater than the water temperature and an increase in water temperature of approaching 4°C respecting the ambient temperature. Figure 10D illustrates that the PV/T water input and exit temperature differential is 4°C when the flow rate is 3.0 L per minute. The solar cell temperature is greater than the water temperature and an increase in water temperature of around 2.5°C respecting an ambient. Figure 10E shows that the temperature differential between the incoming and the outflow PV/T water is just 2°C at a flow rate of 4.0 L per minute and when the flow rate was adjusted on 5 L per minute the inlet and outlet temperature difference was less than 1°C and the outlet water temperature become equal or less than ambient temperature as shown in Figure 10F. These results show that the single solar PV/T system declines the performance of the DCMD system when the flow rate is increased. Comparing the input and exit temperatures of the PV/T system at varying mass flow rates, we observed that the temperature difference was increasing at low mass flow rates and decreasing at high flow rates. All the graphs illustrate that the output water temperature decreases as the flow rate increases. Therefore, it is suggested that a flow rate between 1 and 2 L per minute will be used to deliver warm water to the DCMD system to enhance the distillation process. If the flow rate is further increased from 4 L per minute to 5 or 6 L per minute on a single solar PV/T system the performance efficiency drops, and the temperature difference between the inlet and to outlet becomes equal which highly affects the evaporation efficiency of DCMD system. In other words, the warm water may not spend enough time interacting with the membrane in the DCMD system, impacting the effectiveness of the evaporation process.
5.3 Effect of water flow rate on the thermal performance of PV/T
The thermal performance of a PV/T system can be significantly influenced by the rate of water flow. PV/T systems integrate PV and solar thermal components to simultaneously produce electrical energy and heat. The water flow rate, particularly in relation to the heat transfer fluid’s circulation within the system, has a significant impact on thermal performance through numerous factors. The thermal performance of a PV/T system is greatly affected by the water flow rate, finding the ideal flow rate is critical for balancing the advantages of greater flow rates such as improved thermal efficiency and protection of PV cells from overheating with issues like energy consumption and environmental impact. For each PV/T application, system designers usually do extensive simulations and analysis to find the optimal water flow rate. The appropriate water flow rate can change depending on the characteristics of the environment and the seasons. When it comes to selecting the most appropriate flow rate, system researchers need to take into consideration a variety of aspects, including the ambient temperature, the amounts of solar radiation, and the specific requirements of the project.
As depict from Figure 11, temperature of the water that is discharged steadily decreases as the volume of water that is flowing through the system increases. Increasing the flow rate from 1 to 2 L per minute results in a hotter water supply while simultaneously enhancing efficiency.
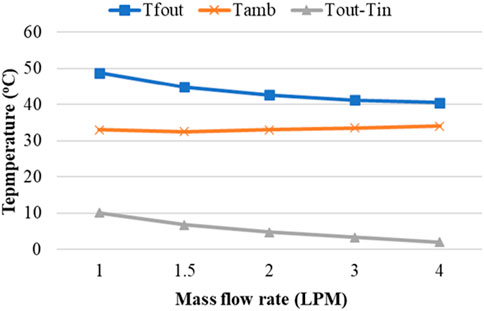
FIGURE 11. Effect of PV/T thermal performance on different flow rate.
5.4 Effect of PV/T efficiencies on different mass flow rates
The improvement of thermal efficiency can be achieved by raising the flow rate which mitigates the temperature increase in the PV/T accumulator to affect the execution of the DCMD system. If the flow rate is too low, the PV/T system overheats, reducing both thermal and electrical efficiency. If the flow rate is too high, it does not allow sufficient heat transfer time within the PV/T system. The electrical efficiency of PV/T systems improved when the stream rate was improved from 1 to 4 L per minute. As such, finding the right balance through flow rate adjustment is crucial for maximizing the overall system efficiency of the integrated system because membrane distillation needs warmer water at continuous intervals to increase freshwater production. The performance of solar PV/T systems on distinct flow rates is shown in Figure 12. There are many different aspects to consider while analyzing the impact that PV/T efficiencies have on various mass flow rates. To obtain the highest possible level of overall efficiency for the system, it is necessary to strike a balance between the system’s thermal and electrical performance. The researcher of the system makes use of simulations and studies to ascertain the mass flow rate that is most efficient in accordance with the needs of the system and the circumstances of the environment.
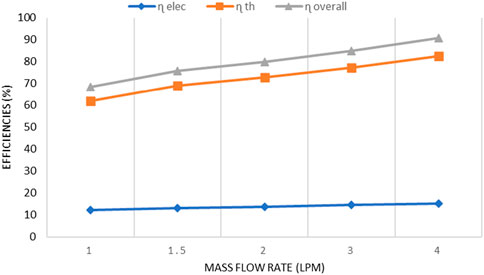
FIGURE 12. Influence of flow rate on PV/T efficiencies.
In PV/T-DCMD integrated systems, achieving optimum system efficiency is of greatest significance, which requires flow rate modifications to be made with a careful balance in consideration. This is especially important for membrane distillation, which may increase its output of freshwater by taking advantage of intermittently rising water temperatures at regular intervals based on the changes in solar radiation.
5.5 Energy evaluation for the DCMD system
Evaporation efficiency (EE) and specific thermal energy consumption (STEC) intake were researched and contrasted with one another with the intent of evaluating the DCMD system’s overall energy efficiency. The Eq. 34 that is described and provided below represents an approach that can be used to calculate the EE: (Khalifa et al., 2015).
Feed temperature was increased from 36°C to 48°C in 4°C increments while all other operational parameters remained constant. The effect of feed temperature on EE is evident in Figure 13. The EE increased from 35.08% to 42.01% when the feed temperature was raised from 30°C to 45°C. Evaporation efficiency improves when feed temperature rises because of the larger temperature difference between the input and output fluids.
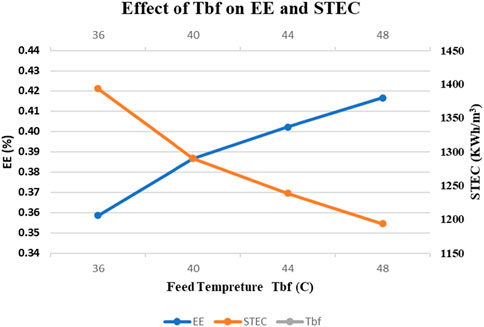
FIGURE 13. Effect of PV/T outlet water temperature on EE and STEC.
In addition, the STEC for producing freshwater varies with the temperature of the feed water. The source of STEC is is expressed in Eq. 35 (Soomro et al., 2022).
Figure 13 indicates the influence of feed temperature on STEC. As input temperature increased from 30°C to 45°C, STEC dropped significantly from 1,192 kWh/m3 to 1,386 kWh/m3. The STEC of the DCMD system dropped because the permeate flow increased in proportion to the rise in feed temperature. It has been observed that increasing the feed water temperature increased EE and decreased STEC when the temperature was increased. It can therefore be concluded that DCMD is more efficient when feed temperature is higher, due to the increase in efficiency. The observed patterns indicate a direct relationship between the temperature of the feed water, the EE, and STEC. Increasing the temperature of the feed water not only improves the efficiency of evaporation but also reduces the amount of thermal energy used per unit of output. Hence, the system exhibits greater efficiency with elevated feed water temperatures. This finding is significant for adjusting the operating parameters of the DCMD system to get greater efficiency and performance in freshwater production.
5.6 Influence of flow rate on permeate flux
In general, the permeate flux rises with the rise in the feed stream rate. To examine the effect of feed flow rate on permeating flux, the flow rate of the feed varied between 1 and 4 L per minute in this study. We observed that when the flow rate of the PV/T system was increased from 1 to 4 L per minute, the permeate flux started to decrease because the temperature from the PV/T system decreased as depicted in Figure 14. The rise in feed stream rate led to a decrease in permeate flux, because of the increased velocity of flow rate, which directly impacted the thermodynamic properties of the integrated system. We observed an increase in the feed flow rate from 1 to 4 L per minute corresponding to an increase in the permeate flux from 12.44 to 6.6 kg/m2 h.
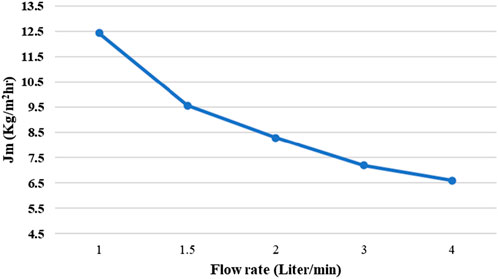
FIGURE 14. Effect of flow rate on permeate flux.
The increase in feed flow rate results in enhanced hydrodynamic properties of the flow, hence leading to an elevation in permeate flux. When comparing the impacts of feed temperature and feed flow rate, it becomes evident that feed temperature has a greater impact on permeate flux compared to the feed flow rate.
5.7 Freshwater production
The main objective of this research is to develop a DCMD system for producing fresh water from the low-grade waste heat of a PV/T system. Estimates of the DCMD system’s freshwater output can be derived from Eq. 36 (Soomro and Kim, 2018b):
There is a direct relationship between fluctuations in the amount of solar power an incoming DCMD condenser receives, and the volume of cooling water used in the DCMD condenser, which in turn influences the output of the water production process. With a feed temperature of 40°C, a permeate temperature of 20°C, and a feed flow rate of from 1 L per minute to 4 L per minute, the DCMD system integrated with the solar PV/T system produced freshwater for domestic purpose usage, However, in August, freshwater output was 151.39 L per day. According to the results of this study, the temperature of the feed water is the main variable that affects the amount of freshwater that is produced by the DCMD system as well as the amount of wastewater rejection.
6 Conclusion
This study analyzes and assesses a solar photovoltaic thermal system integrated with the direct contact membrane distillation mechanism, particularly designed for the climatic circumstances of Jamshoro Pakistan. The maximum solar radiation of Jamshoro was recorded at 960 W/m2, while the electrical power achieved a peak of 214 W during the hour of highest solar energy. The simulation results of the developed model reveal that for every 50 W/m2 increase in solar irradiation level, where photovoltaic thermal power output escalates by 16.32 W, while electrical efficiency reduces from 15.5% to 12.04%. The maximum cell temperature of the PV/T system is recorded at 55.23°C when the flow rate is adjusted to 2 L per minute. It is noteworthy that for every 1°C increase in cell temperature, there is a subsequent increase in the photovoltaic output power leading to an increase in efficiency. The outlet water temperature decreases gradually with increasing water flow rate. Increasing the feed temperature results in a significant boost to the permeate flow and the increase in transmembrane temperature differential is the main driver in direct contact membrane distillation. The feed temperature has improved from 39ºC to 45°C, and the evaporation efficiency increased from 39.13% to 48.01%, respectively while the specific thermal energy consumption of the system has reduced considerably from 1,189.13 kWh/m³ to 1,389.49 kWh/m3 respectively. As the feed flow rate was increased from 1 L per minute to 4 L per minute, the permeate flux decreased from 12.5 kg/m2 h to 6.5 kg/m2 h. The freshwater production by the proposed system, so far, is estimated up to 151.39 L per day.
7 Future work and recommendations
Future work should concentrate on refining the integrated PV/T system with DCMD by exploring novel materials and designs to boost efficiency. Emphasis should be placed on developing sophisticated control algorithms for seamless integration of variable solar PV power with DCMD operations.
The study recommends widespread adoption of integrated PV/T systems with DCMD to effectively address global challenges of power and freshwater scarcity, offering a dual solution for sustainable energy generation and freshwater production. Implementation of this integrated technology has the potential to make substantial contributions towards a more resilient and environmentally conscious future.
Data availability statement
The raw data supporting the conclusions of this article will be made available by the authors, without undue reservation.
Author contributions
FM: Conceptualization, Data curation, Formal Analysis, Investigation, Methodology, Software, Visualization, Writing–original draft. MS: Formal Analysis, Methodology, Software, Supervision, Writing–review and editing. LK: Conceptualization, Formal Analysis, Funding acquisition, Methodology, Project administration, Supervision, Validation, Writing–review and editing. KH: Formal Analysis, Funding acquisition, Methodology, Project administration, Supervision, Writing–review and editing.
Funding
The author(s) declare financial support was received for the research, authorship, and/or publication of this article. The authors would like to acknowledge the financial support from the Higher Education Commission (HEC), Pakistan for the PhD Scholarship, an Initiative of the Aghaz E Haqooq E Balochistan Package.
Conflict of interest
The authors declare that the research was conducted in the absence of any commercial or financial relationships that could be construed as a potential conflict of interest.
Publisher’s note
All claims expressed in this article are solely those of the authors and do not necessarily represent those of their affiliated organizations, or those of the publisher, the editors and the reviewers. Any product that may be evaluated in this article, or claim that may be made by its manufacturer, is not guaranteed or endorsed by the publisher.
References
Al-Hrari, M., Ceylan, İ., Nakoa, K., and Ergün, A. (2020). Concentrated photovoltaic and thermal system application for fresh water production. Appl. Therm. Eng. 171, 115054. doi:10.1016/j.applthermaleng.2020.115054
Alklaibi, A. M., and Lior, N. (2005). Membrane-distillation desalination: status and potential. Desalination 171 (2), 111–131. doi:10.1016/j.desal.2004.03.024
Anand, B., Shankar, R., Murugavelh, S., Rivera, W., Midhun Prasad, K., and Nagarajan, R. (2021). A review on solar photovoltaic thermal integrated desalination technologies. Renew. Sustain. Energy Rev. 141, 110787. doi:10.1016/j.rser.2021.110787
Anis, S. F., Hashaikeh, R., and Hilal, N. (2019). Functional materials in desalination: a review. Desalination 468, 114077. doi:10.1016/j.desal.2019.114077
Ashoor, B., Mansour, S., Giwa, A., Dufour, V., and Hasan, S. (2016). Principles and applications of direct contact membrane distillation (DCMD): a comprehensive review. Desalination 398, 222–246. doi:10.1016/j.desal.2016.07.043
Baghbanzadeh, M., Rana, D., Lan, C. Q., and Matsuura, T. (2017). Zero thermal input membrane distillation, a zero-waste and sustainable solution for freshwater shortage. Appl. Energy 187, 910–928. doi:10.1016/j.apenergy.2016.10.142
Barbu, M., Darie, G., and Siroux, M. (2019). Analysis of a residential photovoltaic-thermal (PVT) system in two similar climate conditions. Energies 12 (19), 3595. doi:10.3390/en12193595
Cf, O. (2015). Transforming our world: the 2030 Agenda for sustainable development. New York, NY, USA: United Nations.
Chen, T.-C., Ho, C.-D., and Yeh, H.-M. (2009). Theoretical modeling and experimental analysis of direct contact membrane distillation. J. Membr. Sci. 330 (1-2), 279–287. doi:10.1016/j.memsci.2008.12.063
Choi, J., Cho, J., Shin, J., Cha, H., Jung, J., and Song, K. G. (2022). Performance and economic analysis of a solar membrane distillation pilot plant under various operating conditions. Energy Convers. Manag. 268, 115991. doi:10.1016/j.enconman.2022.115991
Ck, P. P., Kumaresan, G., Abraham, R., Santosh, R., and Velraj, R. (2022). Effect of teflon-coated PVDF membrane on the performance of a solar-powered direct contact membrane distillation system. Sustainability 14 (11), 6895. doi:10.3390/su14116895
Cres, G. (1998). “Desalination guide using renewable energies,” in THERMIE–DG XVII (Brussels, Belgium: European Commission Report).
Dong, G., Kim, J. F., Kim, J. H., Drioli, E., and Lee, Y. M. (2017). Open-source predictive simulators for scale-up of direct contact membrane distillation modules for seawater desalination. Desalination 402, 72–87. doi:10.1016/j.desal.2016.08.025
Dow, N., Gray, S., Li, J. d., Zhang, J., Ostarcevic, E., Liubinas, A., et al. (2016). Pilot trial of membrane distillation driven by low grade waste heat: membrane fouling and energy assessment. Desalination 391, 30–42. doi:10.1016/j.desal.2016.01.023
Eke, J., Yusuf, A., Giwa, A., and Sodiq, A. (2020). The global status of desalination: an assessment of current desalination technologies, plants and capacity. Desalination 495, 114633. doi:10.1016/j.desal.2020.114633
Feldman, D. J., and Margolis, R. M. (2019). Q4 2018/Q1 2019 solar industry update. Golden, CO, United States: National Renewable Energy Lab NREL.
Flores-Larsen, S., Filippín, C., and Barea, G. (2019). Impact of climate change on energy use and bioclimatic design of residential buildings in the 21st century in Argentina. Energy Build. 184, 216–229. doi:10.1016/j.enbuild.2018.12.015
González, D., Amigo, J., and Suárez, F. (2017). Membrane distillation: perspectives for sustainable and improved desalination. Renew. Sustain. Energy Rev. 80, 238–259. doi:10.1016/j.rser.2017.05.078
Gustafson, R. D., Murphy, J. R., and Achilli, A. (2016). A stepwise model of direct contact membrane distillation for application to large-scale systems: experimental results and model predictions. Desalination 378, 14–27. doi:10.1016/j.desal.2015.09.022
Harijan, K., Uqaili, M. A., and Mirza, U. K. (2015). Assessment of solar PV power generation potential in Pakistan. J. Clean Energy Technol. 3, 54–56. doi:10.7763/jocet.2015.v3.168
Hassan, A., Abbas, S., Yousuf, S., Abbas, F., Amin, N., Ali, S., et al. (2023). An experimental and numerical study on the impact of various parameters in improving the heat transfer performance characteristics of a water based photovoltaic thermal system. Renew. Energy 202, 499–512. doi:10.1016/j.renene.2022.11.087
Hossain, M., Pandey, A., Selvaraj, J., Abd Rahim, N., Rivai, A., and Tyagi, V. (2019). Thermal performance analysis of parallel serpentine flow based photovoltaic/thermal (PV/T) system under composite climate of Malaysia. Appl. Therm. Eng. 153, 861–871. doi:10.1016/j.applthermaleng.2019.01.007
Hussain, M. I., and Kim, J.-T. (2020). Performance evaluation of photovoltaic/thermal (PV/T) system using different design configurations. Sustainability 12 (22), 9520. doi:10.3390/su12229520
IRENA (2022). Supporting countries worldwide in their transition to a sustainable energy future. Available: https://www.irena.org/.
Iversen, S., Bhatia, V., Dam-Johansen, K., and Jonsson, G. (1997). Characterization of microporous membranes for use in membrane contactors. J. Membr. Sci. 130 (1-2), 205–217. doi:10.1016/s0376-7388(97)00026-4
Kalogirou, S. A. (2005). Seawater desalination using renewable energy sources. Prog. energy Combust. Sci. 31 (3), 242–281. doi:10.1016/j.pecs.2005.03.001
Khalifa, A., Ahmad, H., Antar, M., Laoui, T., and Khayet, M. (2017). Experimental and theoretical investigations on water desalination using direct contact membrane distillation. Desalination 404, 22–34. doi:10.1016/j.desal.2016.10.009
Khalifa, A., Lawal, D., Antar, M., and Khayet, M. (2015). Experimental and theoretical investigation on water desalination using air gap membrane distillation. Desalination 376, 94–108. doi:10.1016/j.desal.2015.08.016
Khatri, S. A., Harijan, K., Uqaili, M. A., Shah, S. F., Mirjat, N. H., and Kumar, L. (2022). Solar photovoltaic potential and diffusion assessment for Pakistan. Energy Sci. Eng. 10 (7), 2452–2474. doi:10.1002/ese3.1149
Khayet, M. (2011). Membranes and theoretical modeling of membrane distillation: a review. Adv. colloid interface Sci. 164 (1-2), 56–88. doi:10.1016/j.cis.2010.09.005
Kumar, L., Hasanuzzaman, M., Rahim, N., and Islam, M. (2021c). Modeling, simulation and outdoor experimental performance analysis of a solar-assisted process heating system for industrial process heat. Renew. Energy 164, 656–673. doi:10.1016/j.renene.2020.09.062
Kumar, L., Hasanuzzaman, M., and Rahim, N. A. (2021b). Real-time experimental performance assessment of a photovoltaic thermal system cascaded with flat plate and heat pipe evacuated tube collector. J. Sol. Energy Eng. 144 (1). doi:10.1115/1.4051861
Kumar, L., Soomro, J., Khoharo, H., and Assad, M. E. H. (2023). A comprehensive review of solar thermal desalination technologies for freshwater production. AIMS Energy 11 (2), 293–318. doi:10.3934/energy.2023016
Kumar, P., Shah, S. F., Uqaili, M. A., Kumar, L., and Zafar, R. F. (2021a). Forecasting of drought: a case study of water-stressed region of Pakistan. Atmosphere 12 (10), 1248. doi:10.3390/atmos12101248
Li, C. (2012). Innovative desalination systems using low-grade heat. https://digitalcommons.usf.edu/etd/4126.
Long, R., Lai, X., Liu, Z., and Liu, W. (2018). Direct contact membrane distillation system for waste heat recovery: modelling and multi-objective optimization. Energy 148, 1060–1068. doi:10.1016/j.energy.2018.02.027
Luo, A., and Lior, N. (2016). Critical review of membrane distillation performance criteria. Desalination Water Treat. 57 (43), 20093–20140. doi:10.1080/19443994.2016.1152637
Maab, H., Francis, L., Al-saadi, A., Aubry, C., Ghaffour, N., Amy, G., et al. (2012). Synthesis and fabrication of nanostructured hydrophobic polyazole membranes for low-energy water recovery. J. Membr. Sci. 423, 11–19. doi:10.1016/j.memsci.2012.07.009
Manawi, Y. M., Khraisheh, M., Fard, A. K., Benyahia, F., and Adham, S. (2014). Effect of operational parameters on distillate flux in direct contact membrane distillation (DCMD): comparison between experimental and model predicted performance. Desalination 336, 110–120. doi:10.1016/j.desal.2014.01.003
Martinez-Diez, L., and Vazquez-Gonzalez, M. I. (1999). Temperature and concentration polarization in membrane distillation of aqueous salt solutions. J. Membr. Sci. 156 (2), 265–273. doi:10.1016/s0376-7388(98)00349-4
Nalule, V. R. (2018). Energy poverty and access challenges in sub-Saharan Africa: the role of regionalism. Berlin, Germany: Springer.
Naroei, M., Sarhaddi, F., and Sobhnamayan, F. (2018). Efficiency of a photovoltaic thermal stepped solar still: experimental and numerical analysis. Desalination 441, 87–95. doi:10.1016/j.desal.2018.04.014
p. e. survey (2023). Pakistan economic survey 2022-23. Available: https://www.finance.gov.pk/survey/chapters_23/Highlights.pdf.
Phattaranawik, J., Jiraratananon, R., and Fane, A. G. (2003). Heat transport and membrane distillation coefficients in direct contact membrane distillation. J. Membr. Sci. 212 (1-2), 177–193. doi:10.1016/s0376-7388(02)00498-2
Podder, B., Das, S., and Biswas, A. (2023). Numerical analysis of a small sized water based solar photovoltaic-thermal collector. Int. J. Green Energy 20 (2), 113–128. doi:10.1080/15435075.2021.2023881
Qtaishat, M. R., and Banat, F. (2013). Desalination by solar powered membrane distillation systems. Desalination 308, 186–197. doi:10.1016/j.desal.2012.01.021
Shalaby, S. M., Kabeel, A., Abosheiasha, H., Elfakharany, M., El-Bialy, E., Shama, A., et al. (2022). Membrane distillation driven by solar energy: a review. J. Clean. Prod. 366, 132949. doi:10.1016/j.jclepro.2022.132949
Shi, J., and Lin, C.-X. (2019). “Computational simulation and analysis of major control parameters of time-dependent PV/T collectors,” in ASME International Mechanical Engineering Congress and Exposition, Salt Lake City, Utah, November, 2019.
Sobhnamayan, F., Sarhaddi, F., Alavi, M. A., Farahat, S., and Yazdanpanahi, J. (2014). Optimization of a solar photovoltaic thermal (PV/T) water collector based on exergy concept. Renew. Energy 68, 356–365. doi:10.1016/j.renene.2014.01.048
Soomro, M. I., and Kim, W.-S. (2018a). Performance and economic evaluation of linear Fresnel reflector plant integrated direct contact membrane distillation system. Renew. Energy 129, 561–569. doi:10.1016/j.renene.2018.06.010
Soomro, M. I., and Kim, W.-S. (2018b). Performance and economic investigations of solar power tower plant integrated with direct contact membrane distillation system. Energy Convers. Manag. 174, 626–638. doi:10.1016/j.enconman.2018.08.056
Soomro, M. I., Kim, W.-S., and Kim, Y.-D. (2020). Performance and cost comparison of different concentrated solar power plants integrated with direct-contact membrane distillation system. Energy Convers. Manag. 221, 113193. doi:10.1016/j.enconman.2020.113193
Soomro, M. I., Kumar, S., Ullah, A., Shar, M. A., and Alhazaa, A. (2022). Solar-powered direct contact membrane distillation system: performance and water cost evaluation. Sustainability 14 (24), 16616. doi:10.3390/su142416616
Tiwari, A., and Sodha, M. (2006). Performance evaluation of solar PV/T system: an experimental validation. Solar energy 80 (7), 751–759.
w. r. institute (2022). Getting public transport back on track, post-pandemic. Available: https://www.wri.org/.
Xiao, L., Shi, R., Wu, S.-Y., and Chen, Z.-L. (2019). Performance study on a photovoltaic thermal (PV/T) stepped solar still with a bottom channel. Desalination 471, 114129. doi:10.1016/j.desal.2019.114129
Yadav, A., Labhasetwar, P. K., and Shahi, V. K. (2021). Membrane distillation using low-grade energy for desalination: a review. J. Environ. Chem. Eng. 9 (5), 105818. doi:10.1016/j.jece.2021.105818
Keywords: solar integrated desalination, direct contact membrane distillation, photovoltaic thermal, low-grade heat, evaporation efficiency
Citation: Maqbool F, Soomro MI, Kumar L and Harijan K (2024) Modeling and simulation of direct contact membrane distillation system integrated with a photovoltaic thermal for electricity and freshwater production. Front. Energy Res. 12:1344214. doi: 10.3389/fenrg.2024.1344214
Received: 25 November 2023; Accepted: 15 January 2024;
Published: 06 February 2024.
Edited by:
Muhammad Sultan, Bahauddin Zakariya University, PakistanReviewed by:
Hitesh Panchal, Government Engineering College, Patan, IndiaMd Shouquat Hossain, Jiangsu University, China
Tauseef Aized, University of Engineering and Technology, Lahore, Pakistan
Copyright © 2024 Maqbool, Soomro, Kumar and Harijan. This is an open-access article distributed under the terms of the Creative Commons Attribution License (CC BY). The use, distribution or reproduction in other forums is permitted, provided the original author(s) and the copyright owner(s) are credited and that the original publication in this journal is cited, in accordance with accepted academic practice. No use, distribution or reproduction is permitted which does not comply with these terms.
*Correspondence: Laveet Kumar, bGF2ZWV0Lmt1bWFyQGZhY3VsdHkubXVldC5lZHUucGs=