 Jawed Mustafa
 Saeed Alqaed1,2
 Hikmet Ş. Aybar
- 1Mechanical Engineering Department, College of Engineering, Najran University, Najran, Saudi Arabia
- 2Science and Engineering Research Center, Najran University, Najran, Saudi Arabia
- 3Department of Nutrition, Cihan University-Erbil, Erbil, Iraq
- 4Department of Mechanical Engineering, Eastern Mediterranean University, Famagusta, TRNC, Turkey
- 5Department of Medical Research, China Medical University Hospital, China Medical University, Taichung, Taiwan
The present article presents a 3D simulation of a solar thermal panel containing phase change materials (PCMs). Two pipes are devised in the panel, and several pin fins (PFs) are applied to each pipe. Organic PCMs are encapsulated in a compartment around the PFs and pipes. The variable is PF shape, which includes four types, i.e., square, rectangular, triangular, and circular. Nanofluid (NFD) is used within the pipes. The study is carried out transiently and continued until the stabilization of outlets. Utilizing an FEM method based on a weak form, namely, Galerkin, to find a numerical solution for mathematical modeling. The artificial intelligent results indicate that using triangular, square, rectangular, and circular PFs provides the highest NFD temperature in the outlet, respectively. Circular PFs lead to a lower heat transfer coefficient (HC) compared to other PFs. The comparison between various PF shapes shows that the use of circular and triangular PFs results in the lowest and highest panel temperature, respectively. Moreover, the highest and lowest volume fraction of melting PCMs around the pipe is obtained through the use of triangular and circular PFs, respectively.
1 Introduction
Solar power is the most widespread source of energy in the world. The energy of sunlight that strikes the earth in an hour is more than the energy consumption of the earth’s population in a year. Despite its extensiveness, solar energy has an extremely low density (Kim et al., 2022; Mustafa et al., 2022; Hassan et al., 2023). The Sun is not only an enormous source of energy but also the origin of life and the source of all other energies (Izadi et al., 2021; Roper et al., 2022). Fossil energy also originates from solar energy because fossil fuels were once plants with sun-dependent life (Ascione et al., 2021; Hamzat et al., 2021; Li et al., 2021). To harness this source, we need to find a way for the high-productive and low-cost conversion of its dispersed energy into consumable electrical energy (Ejaz et al., 2021; Jamil et al., 2021; Wang et al., 2021; Xiong et al., 2021). Therefore, many researchers have focused their studies on solar energy. Bansal et al. (1994) shown that the wind tower-connected solar chimney can create an airflow rate of 1.4 kg/s at an incoming solar radiation of 700 W/m2 using a solar chimney
linked with a wind tower-assisted ventilation system. The findings also revealed that an air exchange rate of 35–73 air changes per hour may be reached utilising a mass flow rate of 0.75–1.3 kg/s in an environment with a wind speed of 1 m/s. Using a spreadsheet computer software, Aboulnaga (1998) provided a parametric analytical evaluation of a rooftop solar chimney paired with a cooled hollow. According to the findings, the suggested rooftop solar chimney may produce up to 1.6 kg/s of airflow at an incident solar radiation level of 850 w/m2 on average. Moreover, the chimney’s highest air velocity was close to 1.1 m/s. The findings also suggest that with a wind speed of 0.4 m/s, the cooled cavity may provide a mass flow rate of 0.35 kg/s at an average incoming solar energy of 575 w/m2 and an air velocity of 0.9 m/s in the chimney. Nowadays, the use of photovoltaic (PV) systems to convert solar into electrical energy is regarded as a solution to meet energy needs (Chandrasekar and Senthilkumar, 2021; Salari et al., 2021; Siah Chehreh Ghadikolaei, 2021). A small fraction of absorbed solar-radiated energy is converted into electrical energy by PV cells, while a large part of it is converted into thermal energy and raises the cells’ temperature (Chan et al., 2010; Kumar et al., 2015; Said et al., 2018; Ali, 2020). PV cells are the most crucial part of PV systems, and the increased temperature of PV cells reduces the efficiency of PV systems. Hence, the PV cells’ temperature should be reduced as possible to improve the efficiency and productivity of such systems. Various researchers have proposed different cooling systems with different conclusions (Katekar and Deshmukh, 2020; Vaithilingam et al., 2020; Aghakhani et al., 2022). The photovoltaic phenomenon is the one that generates electricity through light radiation without any driving mechanism. A PV system is the PV phenomenon and any system that employs it. A solar PV system or solar energy system is a renewable energy system that uses PV modules to convert sunlight into electricity (Hernández-Callejo et al., 2019; Shittu et al., 2019; Wahab et al., 2019). The generated electricity can be either stored or harnessed directly. PV systems are widely-used systems concerning new energies. Kazemian et al. (2019) presented a 3D simulation of a comprehensive model of a PCM-integrated PV thermal system. The findings show that as compared to the PVT system only, the PCM-integrated PV thermal system has a lower surface temperature and coolant output temperature. The findings suggest that raising the melting point of PCMs from 40°C to 65 °C raises the surface temperature from 51.53°C to 58.78°C while lowering the percentage of melted PCMs from 82.7% to 9.6%. The electrical and thermal energy efficiency of the PCM-integrated PV thermal system is also shown to improve when the thermal conductivity of the PCM rises.
Given the significance of energy restoration in solar devices by PCMs due to the limited time of solar radiation, the present article performs a numerical study on the effect of using PCMs in a solar panel (Mondal, 2008; Sharma et al., 2009; Agyenim et al., 2010; Rostami et al., 2020). To this end, some PCM is used under a solar panel along with two pipes with a NFD flow. Several PFs are embedded over the pipes, and the effect of PFs shapes, i.e., square, rectangular, triangular, and circular, is investigated. The transient study continues until the variations are stabilized, and the values of outlet NFD‘s temperature, panel temperature, HC, and PCM’s temperature and melting contours are studied.
2 Problem statement
The problem’s geometry includes a 100 × 85 cm solar panel, under which a type- Paraffin wax PCM compartment is employed. Two pipes with an internal diameter (ID) of 5 and 4 cm are embedded inside the compartment with a center-to-center spacing of 46 cm. There is a flow of NFD inside the pipe with an inlet temperature of 298.15 K and a constant Reynolds number. Several circular (Cir), square (Sqr), rectangular (Rec), and triangular (Tri)-shaped PFs are placed on the pipes with a height of 2.5 cm. Figure 1 depicts a view of the problem’s geometry.
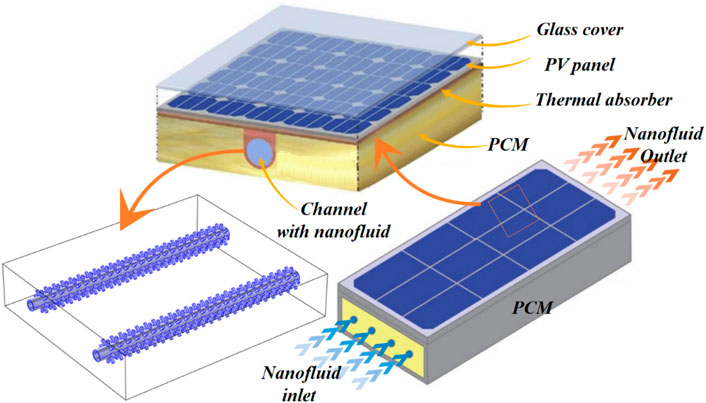
FIGURE 1. A view of the geometry of the solar panel and PF-added pipes.
Table 1 shows the values for the properties of the nanoparticle, water, and PCM (Li, 2013).
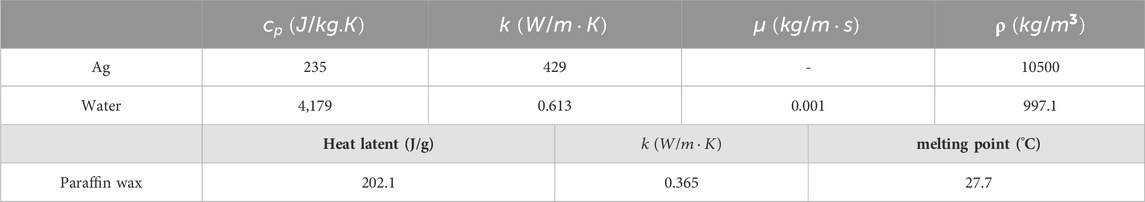
TABLE 1. The values for the properties of the nanoparticle, water, and PCM (Żyła and Fal, 2017).
3 The governing equations and numerical method
The continuity, momentum, and energy equations for mixture as well as the volume fraction equation for the secondary phase are therefore solved using the mixture model. (Ishii, 1975).
where
The drift velocity for nanoparticles,
The nanoparticles’ velocity in relation to the base fluid’s velocity is used to compute the slip velocity (relative velocity).
This is the relationship between slip velocity and drift velocity:
The mixture model requires a constitutive equation to be solved. As a result, the slip velocity may be calculated using the Manninen et al. (Mikko et al., 1996) proposed equation (Schiller, 1933).
Enthalpy-Porosity is a well-considered approach for mimicking a porous material in a domain.
The value of the volum fraction linked with each cell in this sort of media indicates the porosity of the cells (Daneh-Dezfuli and Pordanjani, 2022).
Moreover, the source word expressed by the letter S was thought to be as follows. (Kalbasi et al., 2019; Daneh-Dezfuli and Pordanjani, 2022):
The term “enthalpy” was used to refer to the variation of “H" in Eq. 13, which contains the latent and sensible enthalpies (Kalbasi, 2021; Daneh-Dezfuli and Pordanjani, 2022).
According to the following mathematical formulation, the variant of “h” reflects the sensible enthalpy:
Moreover, the latent heat was represented by the symbol
where the γ is determined as follows:
The density was predicted and applied using this simulation’s boussinesq model. The aforementioned supposition is formally expressed in the following equation. (Kalbasi et al., 2019; Kalbasi, 2021).
The finite element approach is used to conduct the simulation (FEM). The equations of the NFD are solved using the two-phase mixing technique. With COMSOL 6, all equations are resolved.
4 Validation
Two articles on solar energy and solar thermal panels are employed to validate the present article. In Figure 2, the values of panel temperature in different heat fluxes are compared among two articles, i.e., Nasrin et al. (2018) and Rahman et al. (2017). The given articles investigate solar panel temperature in different heat fluxes. The result comparison indicates that the results of the present simulation are close to those of the two previous articles.
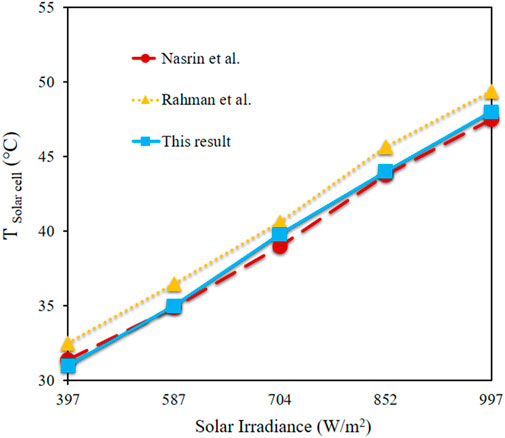
FIGURE 2. The comparison of panel temperature among the present article, Nasrin et al. (2018), and Rahman et al. (2017) in different heat fluxes.
5 Results and discussion
Figure 3 shows the vectors that denote the direction of the melted PCM current with temperature coloration for different circular, rectangular, triangular, and square-shaped PFs on the NFD flow pipe. As with other fluids, the melted PCM contains convective flow due to the temperature difference within, which gives rise to the buoyant force in the melted PCM; as a result, the hotter parts of PCM moves upward against the gravity force, and the colder and heavier parts move downward along the direction of the gravity force. Of course, the high viscosity of the melted PCM leads to weak buoyant force and extremely slow PCM movement. However, the vectors depict the direction of the melted PCM’s movement in the Solar System, showing that lower-temperature parts of PCM move downward, and higher-temperature parts of melted PCM move upward. The highest upward velocity is seen in the middle of the two pipes, where PCM melts more quickly and has a higher temperature. In contrast, in lower-temperature parts, the melted PCM moves downward to be replaced by higher-temperature PCM.
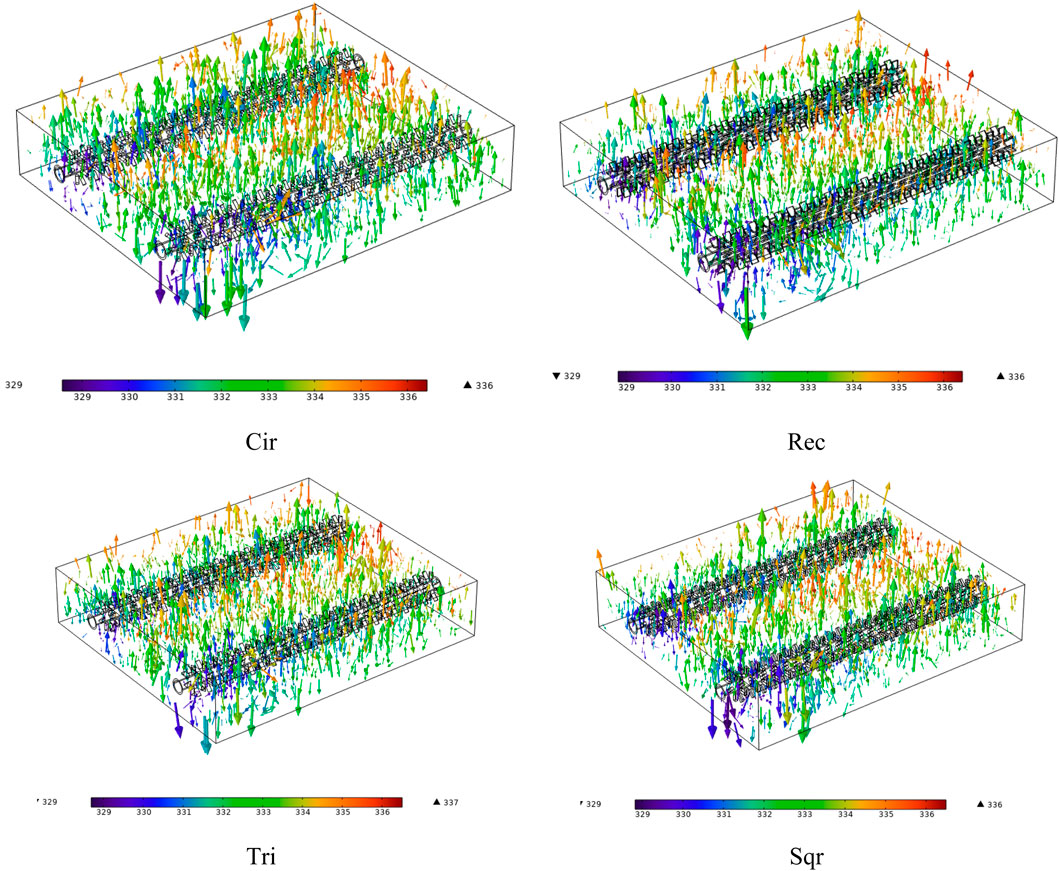
FIGURE 3. The vectors that denote the direction of the melted PCM current with temperature coloration for different shaped PFs on the NFD flow pipe.
Figure 4 shows the temperature of the Solar System for different circular, rectangular, triangular, and square-shaped PFs on the NFD -containing pipes at four different times. The analysis of the PCM’s melting process over time shows that at the beginning, PCM starts to melt sooner in the upper and middle parts of the two pipes, especially in the outlet section. On the contrary, there is less melted and more solid PCM in the lower part, especially around the pipes. Since the NFD enters these areas, there is a high heat transfer from PCM, which leaves PCM solid in the given area at all times. On the contrary, the melting process gradually progresses in other parts over time, covering the side parts of PCM in the Solar System. In the upper layer, it can be seen that there is less melted PCM in the area where the two pipes pass, which is due to the colder NFD -containing pipes compared to other parts. Especially, a part of solid PCM is seen in the inlet part of the NFD for all pin din shapes at all times, which is due to the lower temperature of the NFD s in this particular section. The PF shape variation has no significant effect on the amount of melted PCM at different times, and slow NFD is one of the reasons behind limited variations.
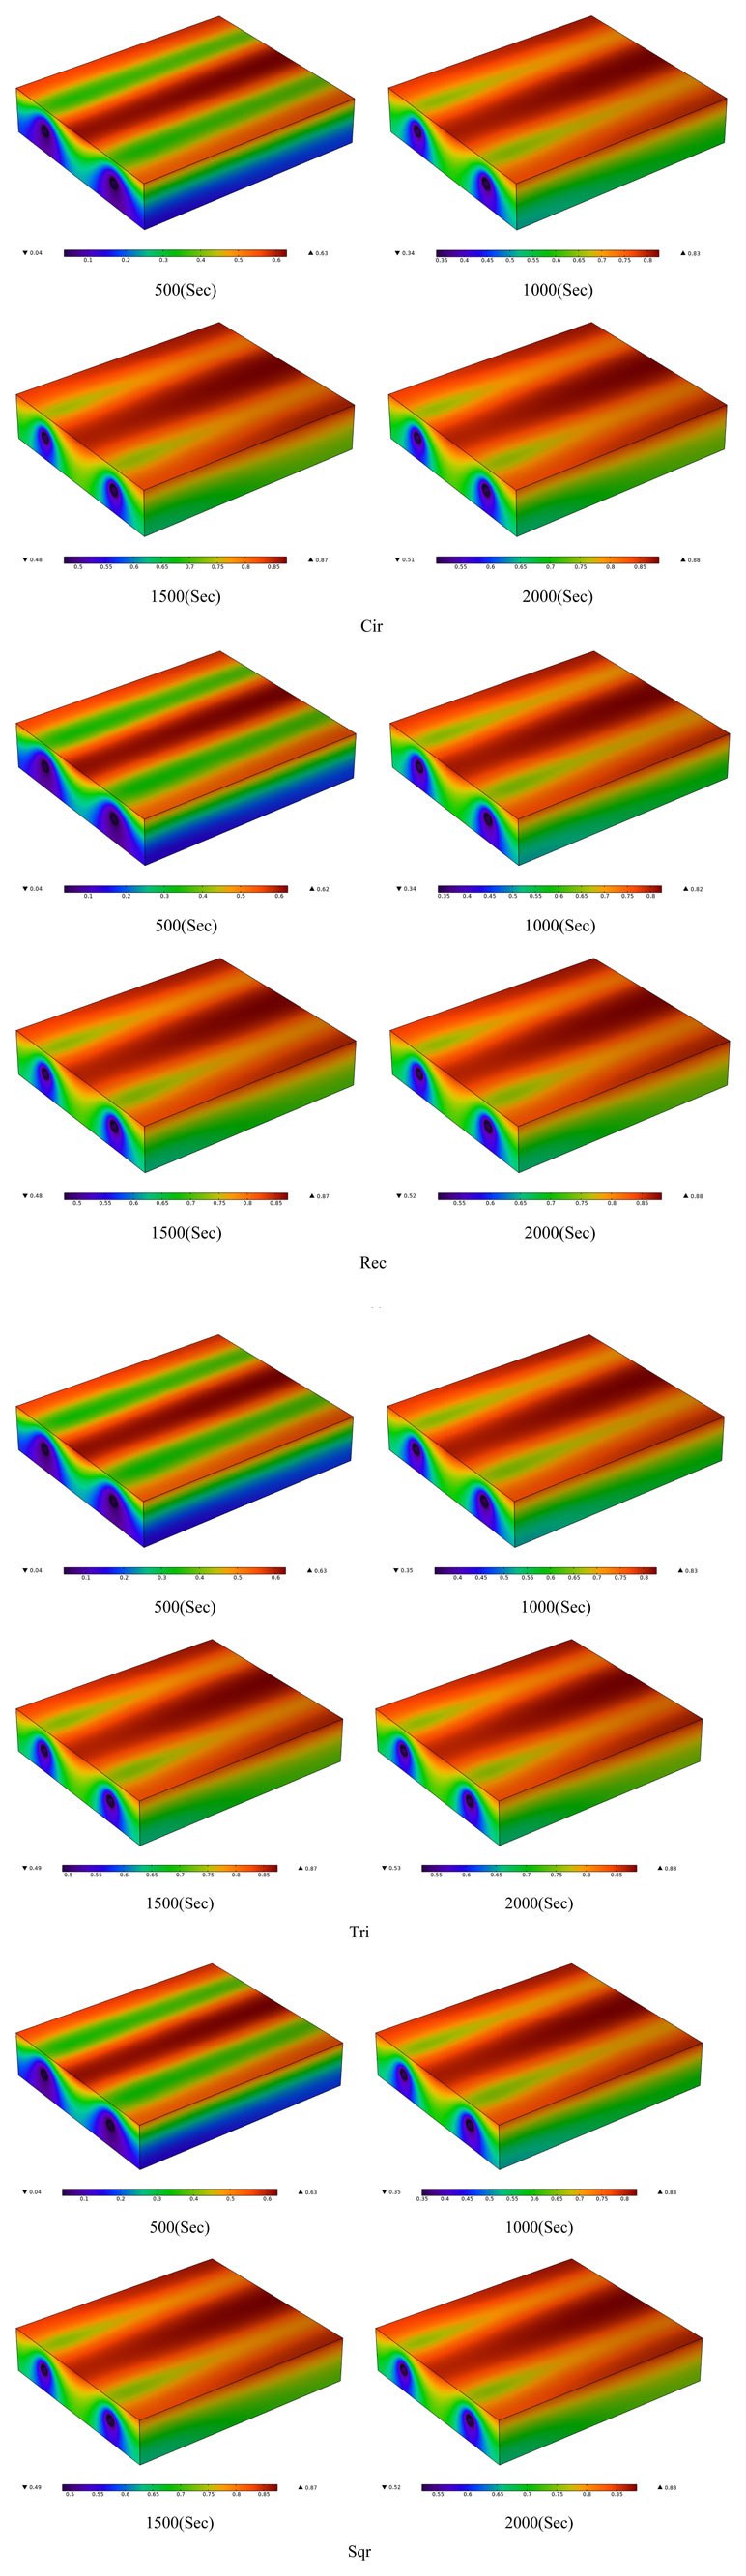
FIGURE 4. The temperature of the solar system for different shaped PFs on the NFD -containing pipes at four different times.
Figure 5 shows the temperature of NFD -containing pipes for different circular, rectangular, triangular, and square-shaped PFs on the NFD flow pipe at the final time. In all PF shapes, there is low-to-high temperature variation from the inlet toward the outlet of the NFD flow. On the inlet side, the pipe’s temperature is lower, while on the outlet side, the pipe has the highest temperature. The maximum temperatures on the pipe are close for different PF shapes, and the minimum temperature on the pipe is different according to PF shape variations. The addition of PFs on pipes results in the heat transferring better from PCM to the pipe, which leads to increased time of PCM melting and higher temperature of NFD in the outlet. There is a lower minimum temperature on the pipe in the circular and rectangular PFs compared to the triangular and square PF shapes. The outlet NFD flow with a high temperature can be employed for domestic use and hot water generation. As a consequence, the enhanced heat transfer to the NFD raises the temperature of the outlet NFD and lowers the temperature of the panel, both of which improve the overall efficiency of the Solar System.
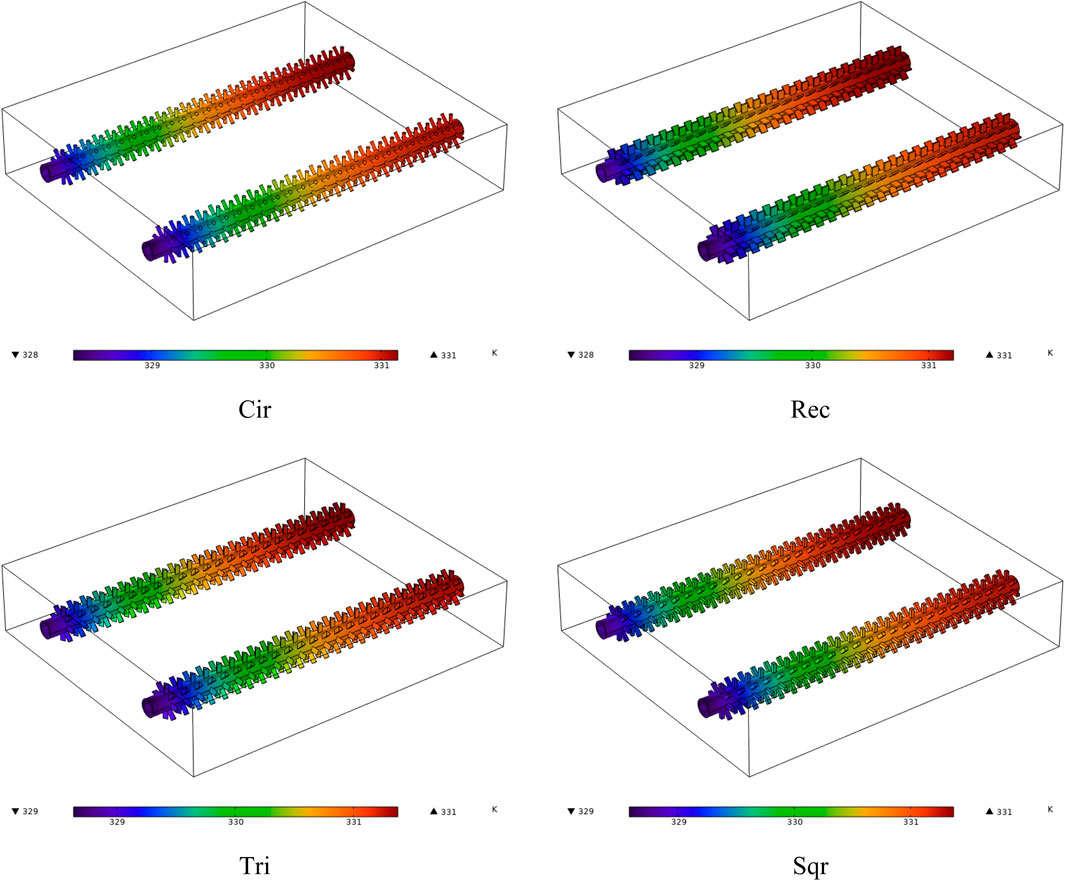
FIGURE 5. The temperature of NFD -containing pipes for different shaped PFs on the NFD flow pipe at the final time.
Figure 6 gives the temperature on the middle layer of the Solar System for different circular, rectangular, triangular, and square-shaped PFs on the NFD flow pipe at the final time. The PF shape variation changes the heat transfer area between the pipe and PCM. Low-temperature NFD flow enters the pipe and takes in the PCM’s heat. The extent of contact between the pipe and PCM affects the amount of heat transfer from PCM to the NFD and the required time to reach the steady state conditions. The maximum temperature in this section of PCM shows no significant change in the PF shape variations. The considerable energy restoration by PCM mitigates the effect of PF shape. In a circular PF shape, the NFD‘s temperature is lower to some extent in the middle of the pipes and to some lower extent in the inlet compared to the three PF shapes. The low NFD velocity is also a reason behind the limited effect of PF shapes. However, the minimum temperature in this section of PCM significantly changes with PF shape variations. The minimum temperature is seen in the rectangular PF shape, followed by two triangular and square cases. The highest temperature minimum occurs in the circular PF. The close the minimum and maximum temperatures in a Solar System, the higher the temperature uniformity, which is desirable for solar systems and panels.
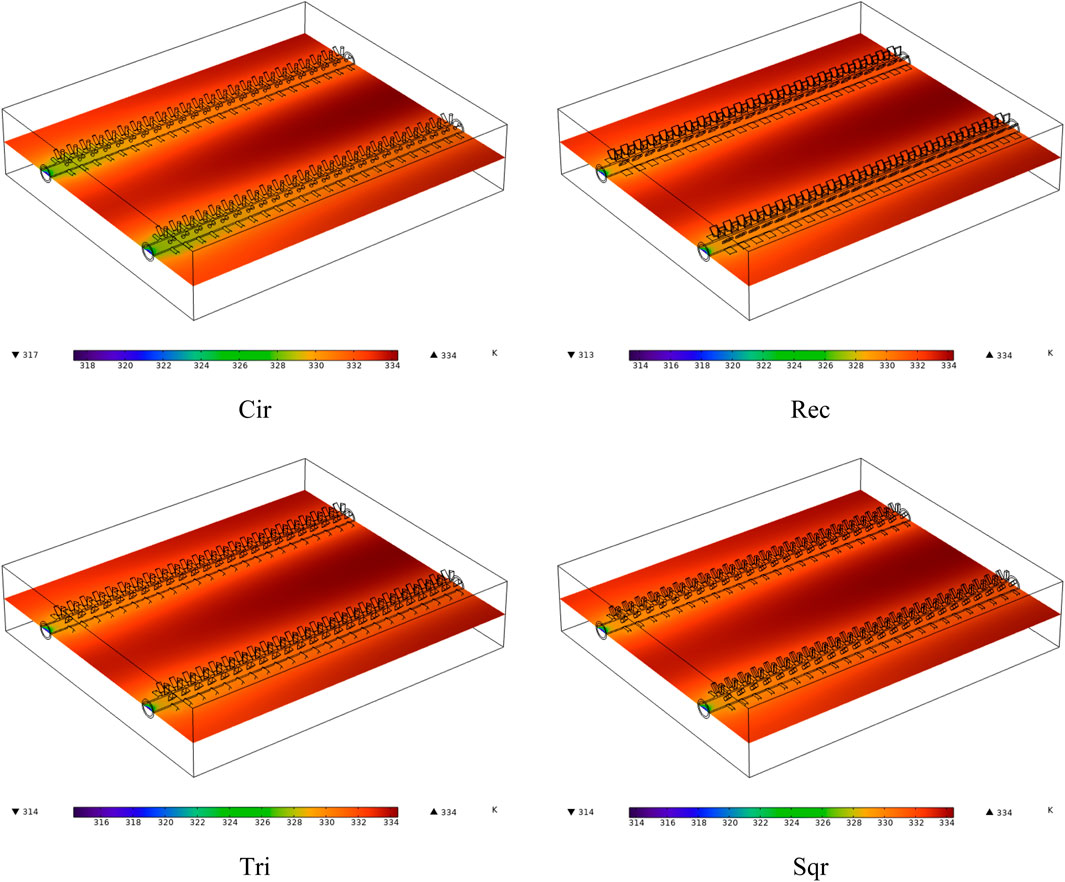
FIGURE 6. The temperature on the middle layer of the solar system for different shaped PFs on the NFD flow pipe at the final time.
Figure 7 shows the transient study of the NFD temperature in the outlet of the Solar System for different circular, rectangular, triangular, and square-shaped PFs on the NFD -containing pipes. The NFD temperature in the outlet depends on the temperature of the panel and PCM and is seen to be increased up to 1800 s; but, after that, the NFD temperature in the outlet remains constant as most conditions of the problem, and the panel temperature become constant. After 1800 s, a steady state is established in the system, and the transient problem becomes a steady-state one with quite limited variations in the results. The PF shape variation has a low effect on the outlet NFD temperature, which is primarily due to the use of PCM, which allows a considerable amount of thermal energy in the Solar System to be used for melting PCM; as a result, PF shape variation, which leads to the heat transfer variation between the NFD and PCM, causes limited changes in the results. The use of circular PFs lowers the NFD temperature in the outlet, while the use of triangular PFs increases the outlet NFD temperature.
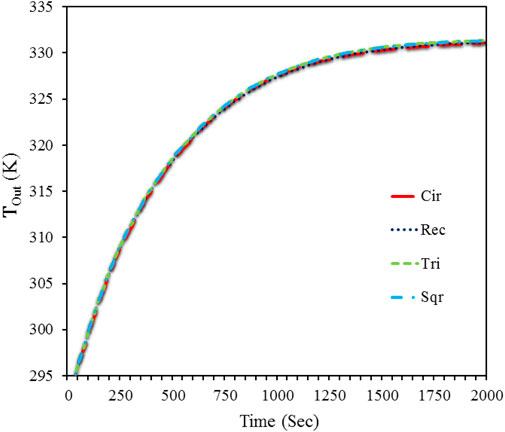
FIGURE 7. The outlet NFD temperature of the solar system for different shaped PFs on the NFD -containing pipes.
Figure 8 shows the transient study of the HC between the NFD and Solar System for different circular, rectangular, triangular, and square-shaped PFs on the NFD -containing pipes. The HC between the NFD flow and its surrounding is also increasing up to 1800 s, after which it reaches the steady state and takes a constant value. The increase in the panel temperature enhances the temperature difference in PCM, leading to a rise in the temperature gradient in the NFD and an increase in its HC. When the NFD and panel temperatures are fixed, the HC also has very limited variations after 18000 s. The values of the HC are exceedingly close in square, rectangular, and triangular PF shapes, and the only significantly different value of the HC belongs to the circular PF shape, in which the value of the HC is lower than that of other PF shapes, which is evidently clear at most times. Among various PF shapes, the triangular PF shape has the highest HC. Given the averaging process on the local HCs to obtain the average value of the HC, a higher surface on the PFs leads to a reduction in the average HC on circular PFs.
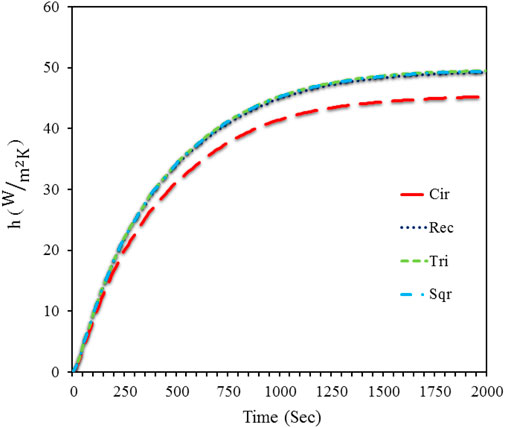
FIGURE 8. The HC between the NFD and solar system for different shaped PFs on the NFD -containing pipes.
Figure 9 shows the transient study of the volume fraction of PCM for different circular, rectangular, triangular, and square-shaped PFs on the NFD -containing pipes. The melting process of PCM starts from the early times, and the amount of melted PCM increases over time until after approximately 1800 s, after which the variations in the amount of melted PCM become considerably limited. From this time forward, the conditions of the problem get close to the steady state, and the variations in the problem significantly decrease. From this time forward, the amount of melted PCM remains near 73% with small variations. Melting PCM during the daytime helps supply the energy in the solar water heater system at night. The changes in the shape of PFs on the pipes have limited effects on the amount of melted PCM at various times, and the highest level of variations in melted PCM upon PF shape variation is observed when the problem reaches the steady state. At this time, the use of circular and triangular PFs is seen to cause the minimum and maximum amount of melted PCM, respectively. The amount of melted PCM is higher in square PFs compared to rectangular PFs. The higher the aspect ratio of the PF, the greater the contact between the PFs and PCM, which results in more heat transferring from PCM to the NFD and, finally decreased amount of melted PCM. Hence, the use of circular PFs leads to the minimum amount of melted PCM.
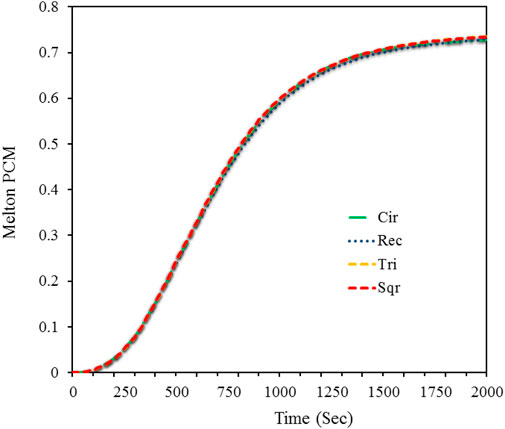
FIGURE 9. The volume fraction of PCM for different shaped PFs on the NFD -containing pipes.
Figure 10 shows the average temperature of the solar panel for different circular, rectangular, triangular, and square-shaped PFs on the NFD -containing pipes. Given the inclusion of PCM under the panel, the high amount of restored energy in it, and the limited velocity of the NFD in the pipe, PF shape variation has a low effect on the panel’s average temperature. The panel’s temperature has an increasing trend upon receiving solar energy, rising from the initial temperature of 293 K to more than 332 K. The temperature trend in the panel also implies a significant decrease in its variation after 1800 s. Given the constant conditions of the problem, the panel temperature also remains constant, and the problem becomes a steady-state one. Under the transient conditions, the shape variations of PFs on the pipes have a lower effect on the panel temperature, and the greatest variations on the average panel temperature are seen upon PF shape variations at the steady-state time after 1800 s when the use of triangular PFs is seen to give rise to higher temperatures in the panel. On the contrary, the use of circular PFs generates the lowest temperatures in the panel. The increased cross-section of the PFs results in improved heat transfer from the PCM to the pipe and the NFD flow, which, in turn, leads to a greater drop in the panel temperature.
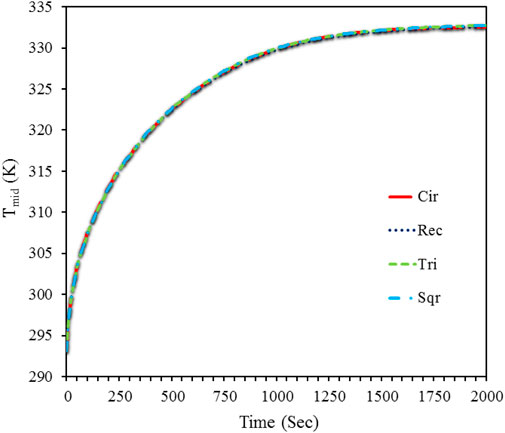
FIGURE 10. The average temperature of the solar panel for different shaped PFs on the NFD -containing pipes.
6 Conclusion
The present article performs a simulation on the effect of the use of differently-shaped PFs on the pipes in a solar thermal panel system. The corresponding PFs include circular, triangular, square, and rectangular PFs placed on two pipes under the solar panel. The two pipes are embedded in the middle of the PCM, and the study is continued transiently until the problem reaches a steady state. The studies on the effect of PF shapes show:
1. The minimum and maximum panel temperatures are obtained upon the use of circular and triangular PFs, respectively, and the corresponding variations in the panel temperature are mostly observed after 1800 s.
2. The use of triangular and circular PFs results in the highest and lowest amount of melted PCM in the Solar System.
3. At the study time of 2000 s, the volume percent of melted PCM reaches approximately 73% among different cases of PF shapes, and the variations are limited after the given time.
4. Compared to other PF shapes, the circular PF has the minimum HC with a considerable difference. The triangular PF has a higher value of the HC compared to the other two PFs.
5. The use of triangular, square, rectangular, and circular PFs leads to the highest values of NFD temperature in the outlet, respectively.
Data availability statement
The raw data supporting the conclusion of this article will be made available by the authors, without undue reservation.
Author contributions
JM: Data curation, Formal Analysis, Methodology, Project administration, Validation, Writing–original draft, Writing–review and editing. SA: Formal Analysis, Methodology, Writing–review and editing. SS: Formal Analysis, Project administration, Writing–review and editing. HA: Formal Analysis, Methodology, Validation, Writing–original draft, Writing–review and editing.
Funding
The author(s) declare that no financial support was received for the research, authorship, and/or publication of this article.
Acknowledgments
The authors are thankful to the Deanship of Scientific Research and under the supervision of the Science and Engineering Research Centre at Najran University for funding this work under the Research centers Funding program grant code (NU/RCP/SERC/12/12).
Conflict of interest
The authors declare that the research was conducted in the absence of any commercial or financial relationships that could be construed as a potential conflict of interest.
Publisher’s note
All claims expressed in this article are solely those of the authors and do not necessarily represent those of their affiliated organizations, or those of the publisher, the editors and the reviewers. Any product that may be evaluated in this article, or claim that may be made by its manufacturer, is not guaranteed or endorsed by the publisher.
References
Aboulnaga, M. M. (1998). A roof solar chimney assisted by cooling cavity for natural ventilation in buildings in hot arid climates: an energy conservation approach in Al-Ain city. Renew. Energy 14, 357–363. doi:10.1016/S0960-1481(98)00090-1
Aghakhani, S., Afrand, M., Karimipour, A., Kalbasi, R., and Mehdi Razzaghi, M. (2022). Numerical and experimental study of thermal efficiency of a spiral flat plate solar collector by changing the spiral diameter, flow rate, and pipe diameter. Sustain. Energy Technol. Assessments 53, 102353. doi:10.1016/j.seta.2022.102353
Agyenim, F., Hewitt, N., Eames, P., and Smyth, M. (2010). A review of materials, heat transfer and phase change problem formulation for latent heat thermal energy storage systems (LHTESS). Renew. Sustain. Energy Rev. 14, 615–628. doi:10.1016/j.rser.2009.10.015
Ali, H. M. (2020). Recent advancements in PV cooling and efficiency enhancement integrating phase change materials based systems – a comprehensive review. Sol. Energy 197, 163–198. doi:10.1016/j.solener.2019.11.075
Ascione, F., Bianco, N., Iovane, T., Mastellone, M., and Mauro, G. M. (2021). The evolution of building energy retrofit via double-skin and responsive façades: a review. Sol. Energy 224, 703–717. doi:10.1016/j.solener.2021.06.035
Bansal, N. K., Mathur, R., and Bhandari, M. S. (1994). A study of solar chimney assisted wind tower system for natural ventilation in buildings. Build. Environ. 29, 495–500. doi:10.1016/0360-1323(94)90008-6
Chan, H.-Y., Riffat, S. B., and Zhu, J. (2010). Review of passive solar heating and cooling technologies. Renew. Sustain. Energy Rev. 14, 781–789. doi:10.1016/j.rser.2009.10.030
Chandrasekar, M., and Senthilkumar, T. (2021). Five decades of evolution of solar photovoltaic thermal (PVT) technology – a critical insight on review articles. J. Clean. Prod. 322, 128997. doi:10.1016/j.jclepro.2021.128997
Daneh-Dezfuli, A., and Pordanjani, A. H. (2022). Investigation of passive method in thermal management of lithium-ion batteries at different discharge rates by changing the number of cavities containing phase change materials. J. Energy Storage 52, 104758. doi:10.1016/j.est.2022.104758
Ejaz, A., Babar, H., Ali, H. M., Jamil, F., Janjua, M. M., Fattah, I. M. R., et al. (2021). Concentrated photovoltaics as light harvesters: outlook, recent progress, and challenges. Sustain. Energy Technol. Assessments 46, 101199. doi:10.1016/j.seta.2021.101199
Hamzat, A. K., Sahin, A. Z., Omisanya, M. I., and Alhems, L. M. (2021). Advances in PV and PVT cooling technologies: a review. Sustain. Energy Technol. Assessments 47, 101360. doi:10.1016/j.seta.2021.101360
Hassan, I. U., Naikoo, G. A., Salim, H., Awan, T., Tabook, M. A., Pedram, M. Z., et al. (2023). Advances in photochemical splitting of seawater over semiconductor nano-catalysts for hydrogen production: a critical review. J. Industrial Eng. Chem. 121, 1–14. doi:10.1016/j.jiec.2023.01.006
Hernández-Callejo, L., Gallardo-Saavedra, S., and Alonso-Gómez, V. (2019). A review of photovoltaic systems: design, operation and maintenance. Sol. Energy 188, 426–440. doi:10.1016/j.solener.2019.06.017
Ishii, M. (1975). Thermo-fluid dynamic theory of two-phase flow. J. NASA Sti/recon Tech. Rep. A 75, 29657.
Izadi, M., and El Haj Assad, M. (2021). “Chapter 15 - use of nanofluids in solar energy systems,” in Design and performance optimization of renewable energy systems. Editors M. E. H. Assad, and M. A. Rosen (Academic Press), 221–250.
Jamil, F., Ali, H. M., and Janjua, M. M. (2021). MXene based advanced materials for thermal energy storage: a recent review. J. Energy Storage 35, 102322. doi:10.1016/j.est.2021.102322
Kalbasi, R. (2021). Introducing a novel heat sink comprising PCM and air - adapted to electronic device thermal management. Int. J. Heat Mass Transf. 169, 120914. doi:10.1016/j.ijheatmasstransfer.2021.120914
Kalbasi, R., Afrand, M., Alsarraf, J., and Tran, M.-D. (2019). Studies on optimum fins number in PCM-based heat sinks. Energy 171, 1088–1099. doi:10.1016/j.energy.2019.01.070
Katekar, V. P., and Deshmukh, S. S. (2020). A review on research trends in solar still designs for domestic and industrial applications. J. Clean. Prod. 257, 120544. doi:10.1016/j.jclepro.2020.120544
Kazemian, A., Salari, A., Hakkaki-Fard, A., and Ma, T. (2019). Numerical investigation and parametric analysis of a photovoltaic thermal system integrated with phase change material. Appl. Energy 238, 734–746. doi:10.1016/j.apenergy.2019.01.103
Kim, J., Jeong, S., Beak, M., Park, J., and Kwon, K. (2022). Performance of photovoltaic-driven electrochemical cell systems for CO2 reduction. Chem. Eng. J. 428, 130259. doi:10.1016/j.cej.2021.130259
Kumar, A., Baredar, P., and Qureshi, U. (2015). Historical and recent development of photovoltaic thermal (PVT) technologies. Renew. Sustain. Energy Rev. 42, 1428–1436. doi:10.1016/j.rser.2014.11.044
Li, H., Wang, Z., Hong, T., and Piette, M. A. (2021). Energy flexibility of residential buildings: a systematic review of characterization and quantification methods and applications. Adv. Appl. Energy 3, 100054. doi:10.1016/j.adapen.2021.100054
Li, M. (2013). A nano-graphite/paraffin phase change material with high thermal conductivity. Appl. Energy 106, 25–30. doi:10.1016/j.apenergy.2013.01.031
Mikko, M., Manninen, V., Taivassalo, S., and Kallio, S. (1996). On the mixture model for multiphase flow. Espoo (Finland), Finland: Technical Research Centre of Finland, 69. Medium:.
Mondal, S. (2008). Phase change materials for smart textiles – an overview. Appl. Therm. Eng. 28, 1536–1550. doi:10.1016/j.applthermaleng.2007.08.009
Mustafa, J., Alqaed, S., Almehmadi, F. A., and Jamil, B. (2022). Development and comparison of parametric models to predict global solar radiation: a case study for the southern region of Saudi Arabia. J. Therm. Analysis Calorim. 147, 9559–9589. doi:10.1007/s10973-022-11209-7
Nasrin, R., Hasanuzzaman, M., and Rahim, N. A. (2018). Effect of high irradiation on photovoltaic power and energy. Eff. high Irradiat. Photovolt. power energy 42, 1115–1131. doi:10.1002/er.3907
Rahman, M. M., Hasanuzzaman, M., and Rahim, N. A. (2017). Effects of operational conditions on the energy efficiency of photovoltaic modules operating in Malaysia. J. Clean. Prod. 143, 912–924. doi:10.1016/j.jclepro.2016.12.029
Roper, R., Harkema, M., Sabharwall, P., Riddle, C., Chisholm, B., Day, B., et al. (2022). Molten salt for advanced energy applications: a review. Ann. Nucl. Energy 169, 108924. doi:10.1016/j.anucene.2021.108924
Rostami, S., Afrand, M., Shahsavar, A., Sheikholeslami, M., Kalbasi, R., Aghakhani, S., et al. (2020). A review of melting and freezing processes of PCM/nano-PCM and their application in energy storage. Energy 211, 118698. doi:10.1016/j.energy.2020.118698
Said, Z., Arora, S., and Bellos, E. (2018). A review on performance and environmental effects of conventional and nanofluid-based thermal photovoltaics. Renew. Sustain. Energy Rev. 94, 302–316. doi:10.1016/j.rser.2018.06.010
Salari, A., Taheri, A., Farzanehnia, A., Passandideh-fard, M., and Sardarabadi, M. (2021). An updated review of the performance of nanofluid-based photovoltaic thermal systems from energy, exergy, economic, and environmental (4E) approaches. J. Clean. Prod. 282, 124318. doi:10.1016/j.jclepro.2020.124318
Sharma, A., Tyagi, V. V., Chen, C. R., and Buddhi, D. (2009). Review on thermal energy storage with phase change materials and applications. Renew. Sustain. Energy Rev. 13, 318–345. doi:10.1016/j.rser.2007.10.005
Shittu, S., Li, G., Akhlaghi, Y. G., Ma, X., Zhao, X., and Ayodele, E. (2019). Advancements in thermoelectric generators for enhanced hybrid photovoltaic system performance. Renew. Sustain. Energy Rev. 109, 24–54. doi:10.1016/j.rser.2019.04.023
Siah Chehreh Ghadikolaei, S. (2021). An enviroeconomic review of the solar PV cells cooling technology effect on the CO2 emission reduction. Sol. Energy 216, 468–492. doi:10.1016/j.solener.2021.01.016
Vaithilingam, S., Gopal, S. T., Srinivasan, S. K., Manokar, A. M., Sathyamurthy, R., Esakkimuthu, G. S., et al. (2020). An extensive review on thermodynamic aspect based solar desalination techniques. J. Therm. Analysis Calorim. 145, 1103–1119. doi:10.1007/s10973-020-10269-x
Wahab, A., Hassan, A., Qasim, M. A., Ali, H. M., Babar, H., and Sajid, M. U. (2019). Solar energy systems – potential of nanofluids. J. Mol. Liq. 289, 111049. doi:10.1016/j.molliq.2019.111049
Wang, P., Liu, Z., and Zhang, L. (2021). Sustainability of compact cities: a review of Inter-Building Effect on building energy and solar energy use. Sustain. Cities Soc. 72, 103035. doi:10.1016/j.scs.2021.103035
Xiong, Q., Altnji, S., Tayebi, T., Izadi, M., Hajjar, A., Sundén, B., et al. (2021). A comprehensive review on the application of hybrid nanofluids in solar energy collectors. Sustain. Energy Technol. Assessments 47, 101341. doi:10.1016/j.seta.2021.101341
Keywords: pin fin, PVT, nanofluid, phase chane material, numerical study
Citation: Mustafa J, Alqaed S, Sajadi SM and Aybar HŞ (2024) Enhancing solar panel cooling efficiency: a study on the influence of nanofluid inclusion and pin fin shape during melting and freezing of phase change materials. Front. Energy Res. 12:1344061. doi: 10.3389/fenrg.2024.1344061
Received: 28 November 2023; Accepted: 17 January 2024;
Published: 05 February 2024.
Edited by:
Sudhakar Kumarasamy, Universiti Malaysia Pahang, MalaysiaReviewed by:
Hossam Nabwey, Prince Sattam Bin Abdulaziz University, Saudi ArabiaMassoudi Mohamed Dhia, University of Monastir, Tunisia
Copyright © 2024 Mustafa, Alqaed, Sajadi and Aybar. This is an open-access article distributed under the terms of the Creative Commons Attribution License (CC BY). The use, distribution or reproduction in other forums is permitted, provided the original author(s) and the copyright owner(s) are credited and that the original publication in this journal is cited, in accordance with accepted academic practice. No use, distribution or reproduction is permitted which does not comply with these terms.
*Correspondence: Jawed Mustafa, am1tdXN0YWZhQG51LmVkdS5zYQ==; Hikmet Ş. Aybar, aGlrbWV0LmF5YmFyQGVtdS5lZHUudHI=